 Youcun Liu
 Haohong Huang
 Lihong Meng
 Mingxia Liu3
 Zidan Wu
 Tao Liu
 David Labat
95% of researchers rate our articles as excellent or good
Learn more about the work of our research integrity team to safeguard the quality of each article we publish.
Find out more
ORIGINAL RESEARCH article
Front. Earth Sci. , 13 January 2023
Sec. Geohazards and Georisks
Volume 10 - 2022 | https://doi.org/10.3389/feart.2022.1043403
This article is part of the Research Topic Monitoring, Early Warning and Mitigation of Natural and Engineered Slopes – Volume II View all 17 articles
Vegetation coverage is an important indicator for evaluating regional environmental quality. Based on MODIS NDVI and DEM data collected for the upper reaches of the Ganjiang River Basin, China, this study used trend analysis, coefficient of variation, Hurst index, and linear regression to analyze the temporal and spatial evolution of vegetation coverage and its relationship with terrain factors in the basin during the years 2000–2020. The vegetation coverage in the study area showed a fluctuating increasing trend at a rate of 5%/10y, and an increasing trend with increasing elevation. The maximum vegetation coverage was identified in the elevation zone of 750–1,000 m, with an average of 83.54%. Vegetation coverage also showed an increasing trend with increasing slope. The maximum vegetation coverage was up to 82.22% in the slope zone of ≥25°. There were no significant differences among the distributions of vegetation coverage in different aspects because the terrain in the study area is not rugged enough to form barriers against sunlight. The vegetation coverage was relatively stable in the study area, with an average coefficient of variation of 14.8%. Hurst analysis showed that the anti-sustainability effect of vegetation change was stronger than that of sustainability, and weak anti-sustainability was dominant. The effects of human activities mainly concentrated in the areas of low elevation and small slopes less than 2°where cities and towns are located. The findings can provide a scientific basis for the management of regional ecosystems in the future.
RESPONSE of terrestrial ecosystems to global climate change is a core research subject raised in the International Geosphere-Biosphere Program (IGBP) (Deng et al., 2021; Bejagam et al., 2022; Wei et al., 2022), which has received great attention from the international scientific community. As an essential component of terrestrial ecosystems, vegetation significantly impacts the global flow of material and energy, biological diversity, and climate stability. It is the most sensitive indicator of global climate change (Shobairi et al., 2018; Zhan et al., 2021; Geng et al., 2022). Vegetation coverage is also influenced by terrain factors, for example, altitude affects vegetation growth due to changes in the effective accumulated temperature and soil moisture (Lamchin et al., 2018; Kalisa et al., 2019; Wang et al., 2020). Therefore, analysis of the influence of terrain factors on the spatial-temporal evolution of vegetation coverage is of great significance for evaluating regional environmental quality and maintaining balance in regional ecosystems (Przeździecki et al., 2017; Ranjbar et al., 2020).
To reflect the growth status of vegetation, fractional vegetation coverage (FVC) is an important parameter for describing terrestrial ecosystems. FVC is defined as the ratio of the vertical projection area of above ground vegetation organs (including leaves, stems, and branches) to the total vegetation area (Hilker et al., 2014; Sarfo et al., 2022). The measurement methods for FVC include ground surveys and remote sensing estimation. The latter is suitable for large-scale and long-term FVC assessments and has been widely used (Dardel et al., 2014; Chybicki and Łubniewski, 2017; Ranjan and Gorai, 2022). Vegetation indexes, such as normalized difference vegetation index ((NDVI) (Ivanov et al., 2008; Zhan et al., 2021) and enhanced vegetation index (EVI) (Zeng et al., 2022), are measure of surface reflectance that provides a quantitative estimation of vegetation growth. The NDVI has a good correlation with FVC and has been widely used for the assessment of vegetation dynamics at both regional and global scales (Huete, 2016; Liu et al., 2016; Xiong et al., 2021).
The Ganjiang River is one of the main tributaries of the Yangtze River. The upper reaches of the Ganjiang River Basin are water conservation areas and its ecological environment directly affects the economic development in the lower reaches of the Yangtze River Basin (Liu et al., 2021). Rare earth elements (REEs) are necessary components of many modern devices, such as electric vehicles, wind turbines, and intelligent electronic devices. As the soil in the upper reaches of the Ganjiang River Basin is highly rich in rare-earth resources, it has been exploited for REEs, leading to ecological and environmental problems, such as vegetation destruction, soil erosion, debris flow, and water pollution (Liu et al., 2020). Given the fragile ecosystem and climatic conditions, the ecosystem of the region is bound to be affected by terrain and human factors. The FVC can objectively reflect the overall condition of the regional ecological environment. Previous studies have analyzed the change in vegetation coverage and its correlation with geomorphological factors in the southern Jiangxi region (Li et al., 2014). However, existing research has not explored the influence of terrain factors on the spatial-temporal evolution of vegetation coverage.
Therefore, the present study was designed with the following objectives: 1) to qualitatively evaluate the spatiotemporal evolution of vegetation coverage in the upper reaches of the Ganjiang River Basin, China, and 2) to identify its relationship with terrain factors. The Terra Moderate Resolution Imaging Spectroradiometer (MODIS) Normalized Difference Vegetation Index (NDVI) data collected over the years 2000–2020 were used to calculate the FVC in different time periods, and future changes were predicted using the Hurst exponent. The relationship with terrain factors was examined using data on elevation slope and aspect with partial correlation analysis. As the complete exclusion of the effects of human activities is impossible, a partial discussion of this aspect was also included. This study will facilitate a deeper understanding of the interactions between the ecosystem and terrain in the Ganjiang River Basin.
The upper reaches of the Ganjiang River Basin are located in the south of Jiangxi Province, China, which span across 24°29′–27°09′N and 113°54′–116°38′E with an area of 30,277 km2 (Figure 1) (Liu et al., 2020). Several administrative districts, including the prefecture-level city of Ganzhou, are located in this basin. Several tributaries, including the Zhangjiang, Gongjiang, Meijiang, Pingjiang, Taojiang, and Shangyoujiang Rivers are present in this basin. The basin has a subtropical monsoonal climate, with a mean annual precipitation of 1,600 mm. Its topography is characterized by mountains and hills, with a gradual increase in elevation from the center to the perimeter. The soil types within the basin include red, yellow, and purple soils. The vegetation types are diverse as the basin is located on the southern edge of the mid-subtropical zone.
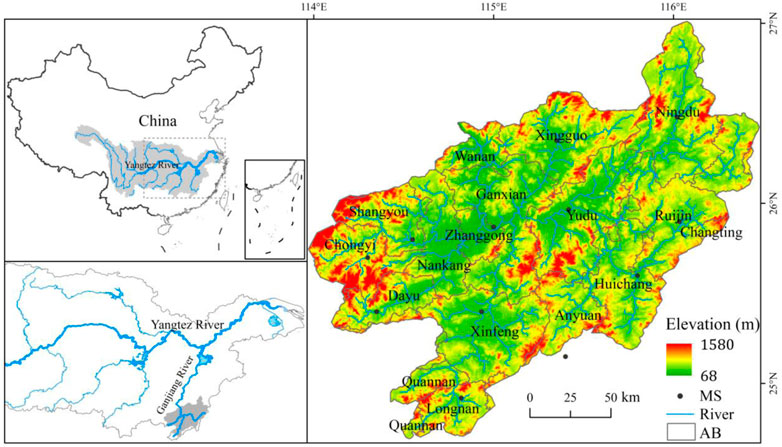
FIGURE 1. Location of the study area; MS and AB denote meteorological station and administrative boundary, respectively.
The MODIS vegetation index Version 6 data, MOD13Q1 product, is provided every 16 days at a 250 m spatial resolution as a gridded level-3 product in the sinusoidal projection. The data over the years 2000–2020 (totally 480 scenes) were downloaded from the website run by the NASA’s Goddard Space Flight Center (https://ladsweb.modaps.eosdis.nasa.gov/). MODIS NDVI products are computed from atmospherically corrected bidirectional surface reflectance that is masked for water, clouds, heavy aerosols, and cloud shadows (García et al., 2014). Consequently, they have been widely used in studies to assess changes in regional vegetation coverage. In addition, the data of digital elevation model (DEM), including the V3 version of the Advanced Spaceborne Thermal Emission and Reflection Radiometer (ASTER) Global Digital Elevation Model (GDEM), were obtained from the Geospatial Data Cloud run by the Computer Network Information Center of the Chinese Academy of Sciences (http://www.gscloud.cn/) with a spatial resolution of 30 m.
Data pre-processing mainly included the following steps: 1) the MODIS Reprojection Tool (MRT) was used to convert the format and projection of the downloaded MODIS NDVI data; 2) the Savitzky-Golay (S-G) filter was used to smooth MODIS NDVI data and eliminate the influence of noise (Savitzky and Golay, 1964); and 3) maximum value composite (MVC) was used to synthesize the maximum NDVI in an annual time series. As the annual maximum NDVI can reflect the vegetation coverage during the best vegetation growth period of a year and eliminate the influence of atmosphere, clouds, and solar altitude angle on remote sensing images, it was used to analyze the temporal and spatial variation in vegetation coverage in the current study.
In addition, the DEM data for the study area were obtained in the following procedures: first, the DEM data were mosaiced using ArcGIS; second, the mosaiced DEM data were resampled with a resolution of 250 m; finally, the DEM data for the study area were cut out along its boundary.
The dimidiate pixel model is a simple and widely used one for the estimation of FVC using remote sensing data (Zhang et al., 2017). The model assumes that a pixel is composed of vegetation and non-vegetation components, and the FVC can be calculated using the following equation:
Where S is the spectral response of the remote sensing data, Sv and Ss are the spectral responses for pure vegetation and pure soil within the pixel, respectively.
There is a strong correlation between FVC and NDVI. Based on previous studies (Carlson and Ripley, 1997; Jing et al., 2011), an NDVI-based vegetation coverage estimation model was established. The calculation formula is as follows (Gutman and Ignatov, 1998):
Where NDVI represents the value of a mixed pixel, NDVImax represents the maximum NDVI value of a pure vegetation pixel, which is close to 1 in theory, and NDVImin represents the minimum NDVI value of pure non-vegetation pixels, which is close to 0 in theory.
Affected by meteorological factors, vegetation types, seasonal changes, and other factors, the NDVImax and NDVImin of different remote sensing images are different to some extent. The maximum and minimum values of NDVI within a certain confidence interval are generally used. Most researchers set the confidence interval to be 1–99% or 5–95% (Duo et al., 2016; Wei et al., 2017). Considering the actual situation in the study area, we chose a confidence interval of 1–99%. In addition, we divided FVC into five levels with reference to several previous studies, as shown in Table 1 (Li et al., 2014; Hao et al., 2020; Sun et al., 2020).
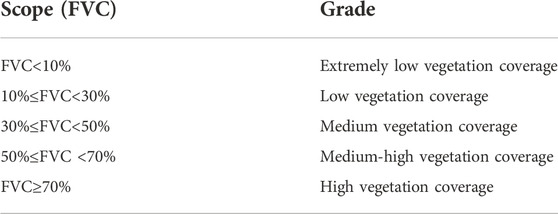
TABLE 1. Classification of vegetation coverage grade in the study area.
The coefficient of variation (CV) represents the ratio of standard deviation to mean. It is a useful parameter for comparing the degree of variation from one data series to another, even if the means are significantly different among different data series. This index was used to assess FVC stability in the current study.
Univariate linear regression analysis was adopted for the trend analysis to linearly fit the temporal variation trend of vegetation coverage in the upper reaches of the Ganjiang River Basin from 2000 to 2020. The calculation formula is as follows:
Where Slope is the slope of the univariate linear regression equation, indicating the trend in FVC evolution in the research time series; n is the total number of monitoring years; i is the serial number of monitoring years; and FVCi indicates the vegetation coverage of the ith year. Slope>0 indicates that the vegetation coverage in the study area shows an increasing trend; slope<0 indicates that the vegetation coverage shows a decreasing trend; and the slope around zero indicates that the changes in vegetation coverage are not obvious. In this study, trend in FVC evolution was divided into five grades (Huo and Sun, 2021; Fu et al., 2022), as shown in Table 2.
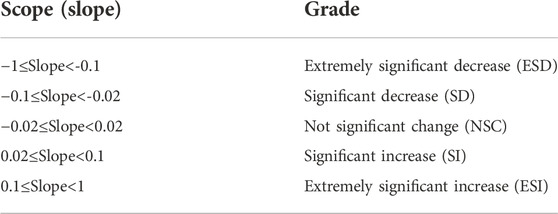
TABLE 2. Classification of grade for the evolution trend of vegetation coverage in the study area.
The CV index can be used to reveal relative fluctuations in grid pixel values (Rey et al., 2016; Kalisa et al., 2019). If the CV index value is larger, the fluctuation in the vegetation coverage FVC pixel is greater and the FVC value is more unstable. In contrast, if the CV index value is smaller, the distribution of the time series data is more homogeneous, and the FVC is more stable. The calculation formula is as follows:
Where CV is the coefficient of variation of the grid pixel value, FVCi represents the maximum vegetation coverage in the ith year, and
Calculation of the cumulative deviation:
Calculation of the range sequence:
Calculation of the standard deviation sequence:
Calculation of the Hurst exponent:
Where H is the Hurst exponent; FVC(t) is the time series, 1≤t≤
The Hurst exponent varies between 0 and 1. It can be categorized into three types: 1) 0.5 <H<1, indicating that the sequence is persistent, and the future change trend is consistent with the past change trend. The closer the value of H is to 1, the stronger the persistence; 2) H = 0.5, indicating that the sequence is a random sequence, and the future change trend is independent of the past change trend; 3) 0<H<0.5, indicating that the sequence is an anti-persistent sequence, and the future change trend is opposite to the past change trend. The closer the value of H is to 0, the stronger the anti-persistence. H was used to assess the sustainability of FVC in this study.
Based on the above calculations, the annual average spatial distribution and annual variation in vegetation coverage in the upper reaches of the Ganjiang River Basin can be obtained. In view of the altitude distribution in the upper reaches of the Ganjiang River Basin, the elevation of GDEM data was divided into five intervals: 68–250 m, 250–500 m, 500–750 m, 750–1,000 m, and 1,000–1,580 m. In addition, slopes of mountains and hills in the study area were analyzed using ArcGIS software based on the results of the second national land survey, and reclassified into five intervals: 0°–2°, 2°–6°, 6°–15°, 15°–25°, and ≥25° (Liu et al., 2018). According to the aspect model in DEM data, the aspects were also analyzed using ArcGIS software, and reclassified into nine types: flat land (FL), north slope (337.5°–22.5°), northeast slope (22.5°–67.5°), east slope (67.5°–112.5°), southeast slope (112.5°–157.5°), south slope (157.5°–202.5°), southwest slope (202.5°–247.5°), west slope (247.5°–292.5°), and northwest slope (29.5°–337.5°). The spatial distribution characteristics of elevation, slope, and aspect (Figure 2) in the upper reaches of the Ganjiang River Basin were obtained.
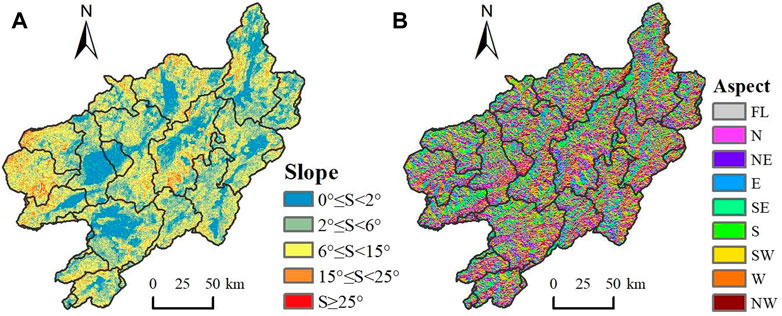
FIGURE 2. Spatial distribution characteristics of slope and aspect in the upper reaches of Ganjiang River Basin. FL, N, NE, E, SE, S, SW, W, and NW denote flat land, north slope, northeast slope, east slope, southeast slope, south slope, southwest slope, west slope, and northwest slope, respectively. (A) Distribution of slope (B) Distribution of aspect.
1) Temporal variation of FVC
The interannual variation in FVC in the upper reaches of the Ganjiang River Basin, China, over the years 2000–2020 is shown in Figure 3. The average annual FVC in the study area showed a fluctuating increasing trend (p <0.001), with a growth rate of 5%/10y. The lowest value of average annual FVC was 59.9% (i.e., 0.59) in 2000, and the highest value of average annual FVC was 70.9% in 2020. This is mainly due to the fact that Ganzhou City has implemented measures conducive for ecological improvement since 2000, such as restriction of mineral exploitation, afforestation, and reclamation of mined areas. The upper reaches of Ganjiang River Basin are 80% mountains, 10% water, and 5% fields, and the area of farmland is small. Owing to the undeveloped economy, most of the working population work away from home. The phenomenon of farmland abandonment was serious, which induced an increase in vegetation coverage.
2) Spatial distribution of FVC
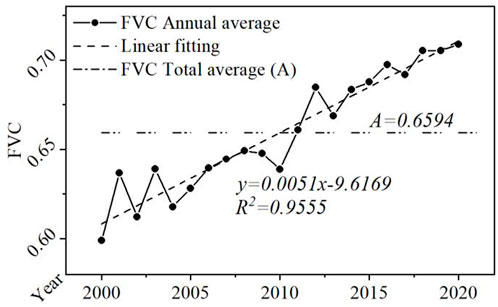
FIGURE 3. Interannual variation of FVC in the upper reaches of Ganjiang River Basin, China during the years 2000–2020.
Figure 4 and Figure 5 show the spatial distribution and proportion of each vegetation coverage grade in the upper reaches of the Ganjiang River Basin from 2000 to 2020, respectively. The overall situation of vegetation coverage was good, mainly with high and higher vegetation coverage (FVC≥50%). The annual average vegetation coverage was 65.94% (Figure 3), with the proportion of low, lower, medium, higher, and high vegetation coverage of 0.9%, 2.5%, 12.3%, 38%, and 46.3%, respectively (Figure 5). The sum of the latter two grades of vegetation coverage was greater than 50%. This is because the upper reaches of the Ganjiang River Basin have a warm climate, abundant rainfall, and are rich in forest resources. In addition, the topographical characteristics of the study area are “high around, low in the middle with the west side higher than the east side”. Terrain characteristics limit the range of human activity. Areas with low vegetation coverage are mainly cities and towns where human activities are intensive, such as Zhanggong District, Ganxian District, Nankang District, Yudu County, Ningdu County, Xinfeng County, Xingguo County, Huichang County, Ruijin City, and Longnan County. The areas with high vegetation coverage are mainly located in the middle and low mountain areas where human activities are less, such as west of Chongyi County, west of Dayu County, northwest of Shangyou County, and Quannan County. The proportion of high vegetation coverage (FVC≥70%) in the upper reaches of Ganjiang River Basin showed a fluctuating increasing trend with time, with the lowest proportion of 35.9% in 2002 and the highest proportion of 59.3% in 2020. A detailed examination of Figure 4 and Figure 5 found that the growth of plants in the transition zone between high and higher vegetation coverages (68%≤FVC≤72%) varied in different years. This was due to the difference in weather and water conditions in different years, which resulted in the mutual conversion between the two grades of vegetation coverage, such as 2000 to 2003 in the northwest areas (Figures 4A–D) and 2012 to 2014 in the northeast areas (Figures 4M–4O). Consequently, this was also the reason for the observed fluctuations in the proportion of areas with high vegetation coverage. The high vegetation areas also extend to a certain degree in their surroundings. This was because of afforestation with the enforcement of environmental and ecological policies. In addition, the proportion of high vegetation coverage increased, reflecting the growth of afforested trees, such as in the central area, from 2013 to 2016 (Figures 4N–4Q). Since 2012, the proportion of the areas with high vegetation coverage turned to be more than 50%. In contrast, the proportion of areas with higher vegetation coverage, moderate vegetation coverage, and lower vegetation coverage showed a fluctuating decreasing trend. The decreasing degree were as follows: moderate vegetation coverage (from 19.8% in 2000 to 7.8% in 2020), higher vegetation cover (from 39.6% in 2000 to 29.1% in 2019), and lower vegetation cover (from 5.7% in 2000 to 1.8% in 2020). Owing to the undeveloped economy, the abandonment of farmland accelerated, and agricultural production activities decreased, which resulted in the transfer of some moderate vegetation coverage areas to higher or high vegetation coverage areas, such as in the central and southern parts of the basin from 2017 to 2020 (Figures 4R–4U). In contrast, the areas with low vegetation coverage showed a slight down trend, but the proportion was relatively stable, accounting for between 1.4% and 1.85%. Areas with low vegetation coverage mainly concentrate in places where human activities are intensive, and the land is mainly constructed land. It is not easy to change construction land to other land use types.
3) Trend in FVC evolution
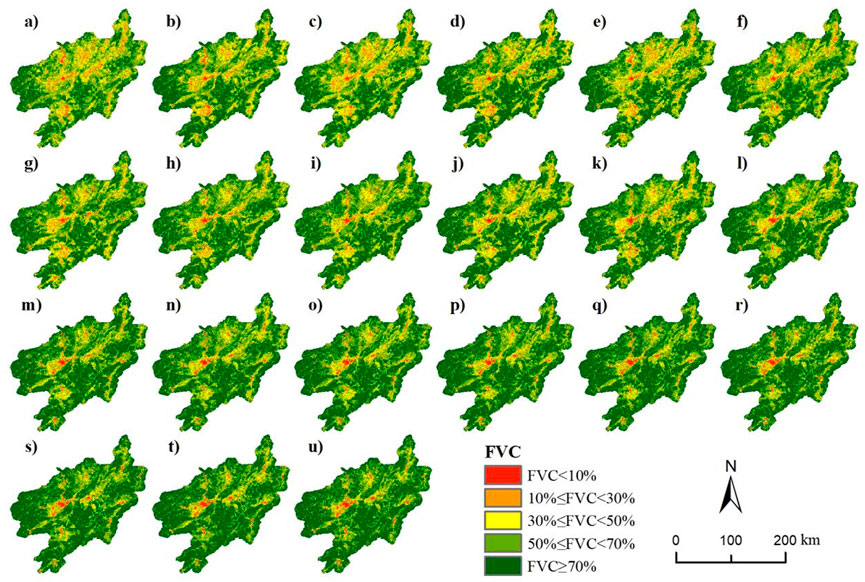
FIGURE 4. Spatial distribution of annual vegetation coverage in the upper reaches of Ganjiang River Basin from 2000 to 2020. (A–U) are the annual vegetation coverage for the years from 2000 to 2020, respectively.
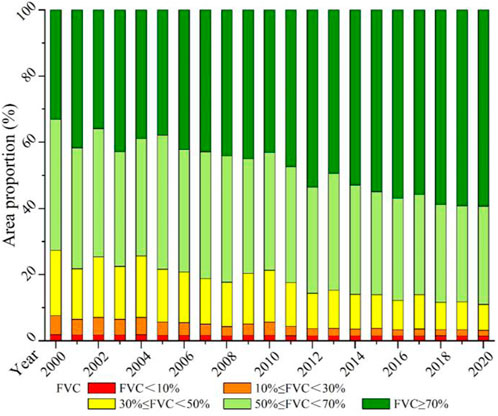
FIGURE 5. Evolution of the proportion of each vegetation coverage in the upper reaches of Ganjiang River Basin from 2000 to 2020.
To better analyze the spatiotemporal evolution characteristics of vegetation coverage in the upper reaches of the Ganjiang River Basin, the period from 2000 to 2020 was further divided into seven sub-periods: 2000–2002, 2003–2005, 2006–2008, 2009–2011, 2012–2014, 2015–2017, and 2018–2020, respectively. Figure 6 and Figure 7 show the spatial distribution and proportion of vegetation coverage change in the upper reaches of the Ganjiang River Basin from 2000 to 2020, respectively. Because of the need for urban construction in some counties and districts during 2000–2002 and 2003–2005, parts of the land with vegetation coverage were transformed into construction land, resulting in a decrease in vegetation coverage in different areas, especially during 2000–2002 (Figure 6). In the northeast of Yudu, vegetation coverage decreased from 2006 to 2008, started to increase from 2009 to 2011, and remained stable after 2011. This area is mainly a transitional zone between high and higher vegetation coverages, as shown in Figures 4G,I. Influenced by climatic conditions, this transition zone changed from high vegetation coverage to higher vegetation coverage during 2006–2008, but gradually changed back to high vegetation coverage after 2009. During 2009 to 2020, different areas showed different degrees of increase or decrease in different time periods. Overall, the changes remained stable, and there was a significant increase in vegetation coverage. The increase in vegetation coverage was mainly due to the return of farmland to forests and afforestation enforced by the environmental protection policies. The central and eastern parts of Zhanggong District were the most stable areas during 2009–2020 because urban construction had been done earlier. The construction land in the west part of the district had been gradually expanded since 2008. Consequently, the vegetation coverage first decreased and then stabilized at middle and low levels (Figure 4I, Figure 6C, Figure 7). The changes in vegetation coverage in the seven sub-periods between 2000 and 2020 were mainly insignificant, significant increase, and significant decrease, while those with extremely significant increases and decreases were relatively fewer (Figure 7). The changes in proportions at different time periods were different. The reasons were that the meteorological conditions, human activities, and related policies varied in different time periods, such as the construction of towns and central urban areas in the upper reaches of the Ganjiang River Basin from 2003 to 2005, accompanied by the transformation of part of the vegetation land to construction land. Vegetation coverage decreased, resulting in an increase in the proportion of significant decreases. Affected by the so-called “Lucid waters and lush mountains are invaluable assets” national movement for the promotion of ecological protection during 2015–2017, more attention was paid to the protection of ecological environment than before. The vegetation coverage increased, and the proportion of significant increase improved. From 2000 to 2020, the vegetation coverage in 98% of the total area of the upper reaches of Ganjiang River Basin did not change significantly. The proportion of significant increase only accounted for 1.52% (Figure 6), and was mainly distributed in the middle of Xinfeng County, the north of Gan County, the south of Xingguo County, and the west of Nankang District. Other counties and districts showed a sporadic distribution.
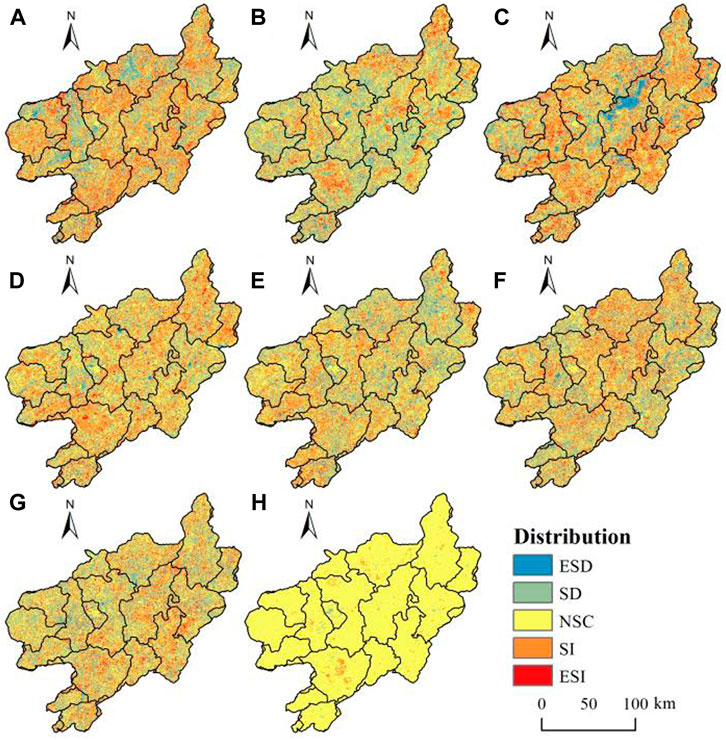
FIGURE 6. Evolution trend of changes in vegetation coverage in the upper reaches of Ganjiang River Basin from 2000 to 2020. (A–H) are for the sub-periods of 2000–2002, 2003–2003, 2006–2008, 2009–2011, 2012–2014, 2015–2017, 2018–2020, and 2000–2020, respectively. ESD, SD, NSC, SI, and ESI denote extremely significant decrease, significant decrease, non-significant change, significant increase, and extremely significant increase, respectively.
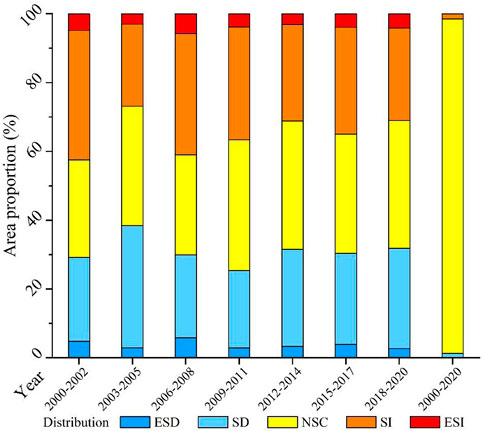
FIGURE 7. Proportion of vegetation coverage change in the upper reaches of Ganjiang River Basin in different time periods. ESD, SD, NSC, SI, and ESI denote extremely significant decrease, significant decrease, non-significant change, significant increase, and extremely significant increase, respectively.
In recent years, the coordinated development of the navel orange industry and ecological environment in Xinfeng County, restriction on exploitation of mineral resources, afforestation, and the implementation of land reclamation policies in mining areas in the northern part of Gan County, southern part of Xingguo County, and western part of Nankang County have contributed a lot to the protection of the ecological environment in these areas. The areas with significant decrease only accounted for 0.48%, which were mainly distributed in the eastern part of Nankang District, the central part of Zhanggong District, the central part of Ruijin City, and the periphery of each city. The transformation of vegetated land into construction land was the reason for the decrease in vegetation coverage.
Overall, the areas without significant changes accounted for more than 95% (Figure 6 and Figure 7). Areas with increased and decreased vegetation coverage occurred at different locations during different periods. The increase and decrease cancelled each other out on the long time scale. This was also verified by the area changes reflected by the Hurst index, as shown later, indicating consistency with this conclusion.
4) Stability and sustainability of FVC
The spatial distribution of the coefficient of variation (CV) of FVC in the upper reaches of the Ganjiang River Basin during the time period between 2000 and 2020 is shown in Figure 8A. CV represents the dispersion and fluctuation of the data distribution. The larger the CV, the more dispersed is the data distribution. The greater the fluctuation, the greater is the variation, and vice versa. In this study, the CV of FVC was divided into three grades (Li et al., 2021; Liu et al., 2022), as shown in Table 3. Vegetation coverage in the study area was relatively stable. The CV of FVC ranged from 2.56% to 98.83%, with an average of 14.8%. The areas with stable FVC (CV less than 15%) accounted for 63.47% of the total area of the study, mainly distributed in the surrounding mountains. Fewer human activities in mountainous areas were conducive to vegetation growth; thus, the change in FVC in mountainous areas was small. The areas with unstable FVC (CV between 15% and 40%) accounted for 34.51%, mainly including the south of Nankang District, the middle of Xinfeng County, the north of Yudu County, and the south of Xingguo County. The areas with extremely unstable FVC (CV higher than 40%) accounted for 2.02%, including the middle of Xinfeng County, the middle of Nankang District, the middle of Yudu County, the south of Xingguo County, and the middle of Ruijin City. In recent years, Xinfeng County has focused on the coordinated development of the navel orange industry and strengthened the protection of the ecological environment, so the changes in FVC in this area were dramatic. The drastic changes in FVC in the middle of the Nankang District and Ruijin City were due to urban expansion. Drastic changes in FVC in the middle of Yudu County and south of Xingguo County were induced by the implementation of afforestation and land reclamation in mined areas.
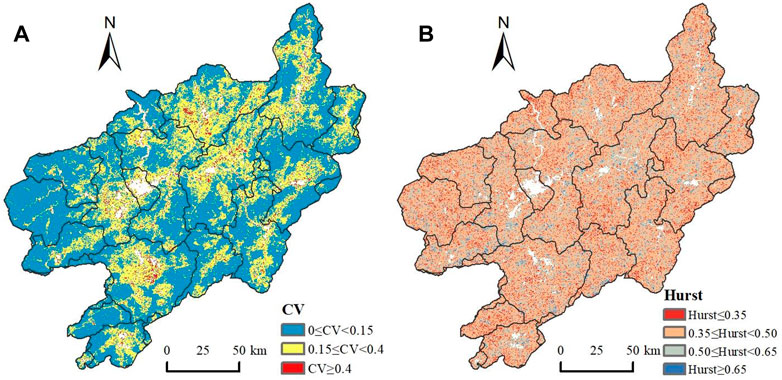
FIGURE 8. Spatial distribution of coefficient of variation (CV) and Hurst exponent of FVC in the upper reaches of Ganjiang River Basin during 2000–2020. (A) Distribution of CV (B) Distribution of Hurst exponent.
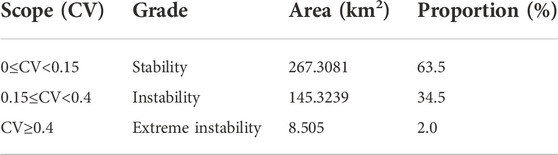
TABLE 3. Stability associated with changes in vegetation coverage in the upper reaches of ganjiang river basin during 2000–2020.
The spatial distribution of the Hurst exponent of FVC in the upper reaches of the Ganjiang River Basin from 2000 to 2020 is shown in Figure 8B. The average Hurst exponent of FVC in the study area was 0.46. The pixels with Hurst exponents less than 0.5 accounted for 66.38% and those with Hurst exponents greater than 0.5 accounted for 33.62%. The anti-sustainability of vegetation coverage change in the study area was stronger than that of sustainability, indicating that the FVC in the upper reaches of the Ganjiang River Basin would decrease in the future. The pixels showing strong anti-sustainability accounted for 11.1% of the study area and those with weak anti-sustainability accounted for 55.28%. The pixels showing strong sustainability accounted for 30.78% of the study area and those with weak sustainability accounted for 2.84% (Table 4). The vegetation coverage change in the study area was dominated by weak anti-sustainability, indicating that the FVC in the upper reaches of the Ganjiang River Basin will decrease slightly in the future. This was consistent with the results reported (Liu et al., 2021).
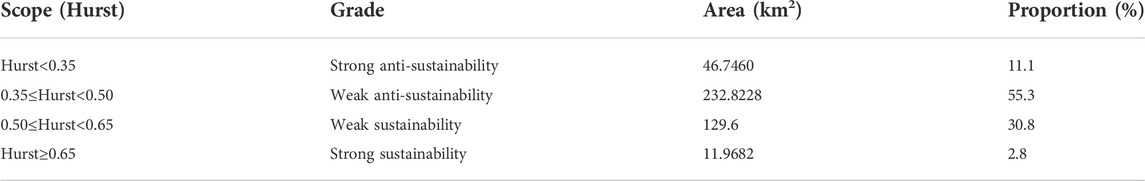
TABLE 4. Sustainability associated with changes in vegetation coverage in the upper reaches of ganjiang river basin during 2000–2020.
1) Distribution of vegetation coverage with altitude
The vegetation coverage in the upper reaches of the Ganjiang River Basin increased continuously with increasing altitude (Figure 9). The vegetation coverage in the elevation zone of 68–250 m was the lowest, with an average of 54.09%. The zone with highest vegetation coverage was 750–1,000 m, with an average of 83.54%. In addition, the annual average vegetation coverage in different elevation zones showed a fluctuating increase; the elevation zones with obvious fluctuating growth were 68–250 m and 250–500 m. However, there was a trough in the average vegetation coverage in the 500–1,580 m elevation zone from 2006 to 2008, which was less disturbed by human beings. Meteorological factors, such as increase in air temperature, decrease in precipitation, and enhanced evaporation, were thought to be the reasons that led to less water for plants, and were not conducive to the improvement of vegetation coverage. The increase in vegetation coverage above 250 m indicated that human activities mainly concentrated in the areas below 250 m. Both vegetation coverage and rate of increase of vegetation increased without human disturbance.
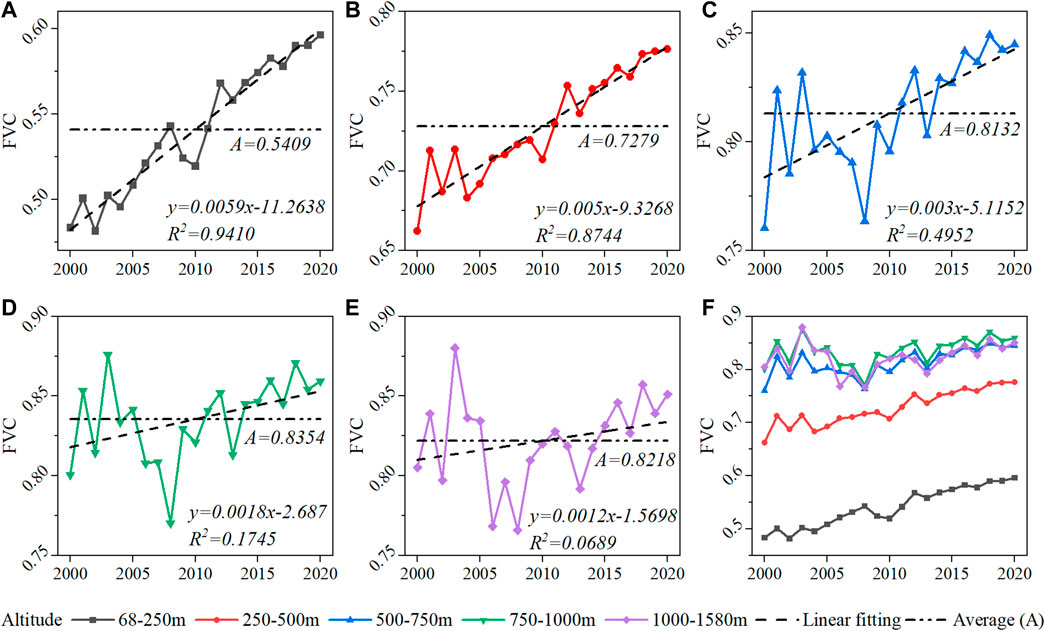
FIGURE 9. Evolution characteristics of vegetation coverage with increase in altitude in the upper reaches of Ganjiang River Basin from 2000 to 2020.
In general, altitude affects local weather and water conditions, which consequently affect vegetation growth. Weather and water conditions in low-altitude areas are better and more suitable for plant growth, and therefore, the vegetation coverage should be relatively higher in low-altitude than in high-altitude areas. However, disturbance from human activities in low-altitude areas leads to a sharp decrease in vegetation coverage, mainly due to the transformation of vegetated land to construction land. The average vegetation coverage of the elevation zones: 500–750 m, 750–1,000 m, and 1,000–1,580 m was more than 80%, and the degree of variation becomes smaller with the increase in altitude. The highest altitude in the upper reaches of the Ganjiang River Basin is 1,580 m. A height greater than 1,000 m restricts plant growth, and the vegetation coverage above that tends to remain unchanged. The weather and water conditions in the elevation zone of 1,000–1,580 m were not favorable for vegetation growth compared to those in the elevation zone of 750–1,000 m. Therefore, the vegetation coverage in the elevation zone of 1,000–1,580 m was lower than that in the elevation zone of 750–1,000 m. With increasing altitude, vegetation coverage tends to remain stable. This phenomenon is similar to that reported for the Hanjiang River Basin (Liu et al., 2018).
2) Distribution of vegetation coverage with slope
Vegetation coverage in the upper reaches of the Ganjiang River Basin increased as the slope increased (Figure 10). The lowest vegetation coverage was located in the slope zone of 0°–2°, with an average of 50.19%. The highest vegetation coverage was located in a slope zone greater than 25°. This is because a gentle slope zone is suitable and convenient for human activities such as industrial and agricultural production. Most people in the Ganjiang River Basin live in a slope zone of 0°–2°, where cities and towns are located. Less natural vegetation is distributed in this slope zone, resulting in lower vegetation coverage. The slope zone of 2°–6° is a transition zone between the industrial and agricultural production lands, resulting in relatively higher vegetation coverage compared with that in the slope zone of 0°–2°. The vegetation coverage in the slope zone of 6°–15° was higher than that in the slope zone of 2°–6°, because the original woodlands in this slope zone were easier to be reclaimed as terraced fields for agricultural production.
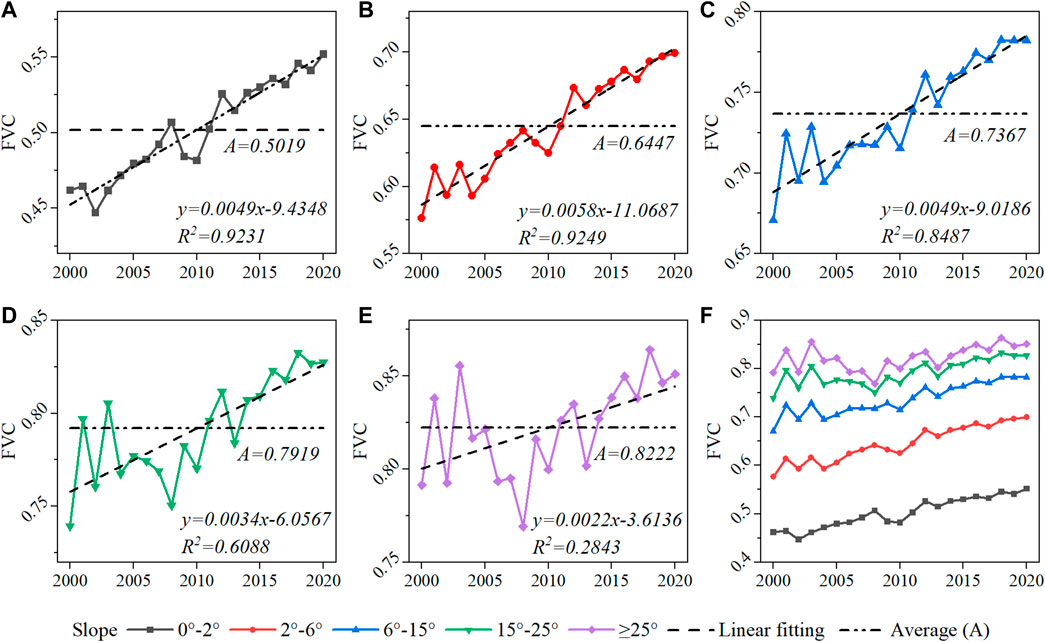
FIGURE 10. Variation characteristics of vegetation coverage with increase in slope degree in the upper reaches of Ganjiang River Basin from 2000 to 2020.
In general, the steeper the slope, the lower the accumulated temperature and precipitation, the worse the water retention capacity of the soil, and the worse the weather and water conditions for vegetation growth. Vegetation coverage should decrease with an increase in the slope degree. However, the areas with highest vegetation coverage in this study were identified in the areas with slopes greater than 25°. This is because local human production activities were greatly reduced owing to topographical and traffic restrictions with the increase in slope degree. Vegetation growth in areas with steeper slopes was mainly affected by natural conditions, with less interference from human activities. The changed trend of vegetation coverage returned to normal and showed an increasing trend. This finding is similar to that of a study on the upper Minjiang River Basin (Zhang et al., 2018). The difference was that the maximum slope in the study area was only 40°, and that in the upper Minjiang River Basin was more than 55°. The areas with the maximum vegetation coverage were in the zones with slope degrees between 25° and 45°. A similar phenomenon was also found in other basins, such as the Guandu River basin reported (Chen et al., 2019). Both the elevation and slopes in this study area are relatively small compared with those in the other basins.
3) Distribution of vegetation coverage with aspect
Overall, there was no significant difference among the distributions of average vegetation coverage in the different aspects in the upper reaches of the Ganjiang River Basin (Figure 11). This is because the terrain in the study area is not rugged enough to form barriers against hydrothermal cycle. The average vegetation coverage in the upper reaches of the Ganjiang River Basin was in the following order: vegetation coverage of north slope > northwest slope > northeast slope > west slope > southwest slope > east slope > south slope > southeast slope > flat land (Table 5 and Table 6). Aspects with higher average vegetation coverage, such as the north and northwest slopes, are shady slopes, while the aspects with low average vegetation coverage, such as the east, south, and southeast slopes, are commonly known as sunny slopes. Although the upper reaches of the Ganjiang River Basin have a subtropical monsoon climate with abundant precipitation, long-term solar radiation leads to excessive water evaporation from plants and soils, resulting in fewer water conditions and growth retardation. The plants on shady slopes received less solar radiation than those on sunny slopes leading to low evaporation, retaining a certain amount of water for plant growth. Therefore, the plant growth conditions on shady slopes were slightly better than those on sunny slopes in the study area. It also reported that evaporation in the hilly regions of South China was negatively correlated with relative humidity and positively correlated with temperature and percentage of sunshine (Liu et al., 2019). Receiving too much solar radiation not only inhibits the photosynthetic efficiency of plants but also accelerates the evaporation of surface water. In contrast, the average vegetation coverage of flat land was significantly smaller than that of mountains and hills, mainly due to interference from human activities.
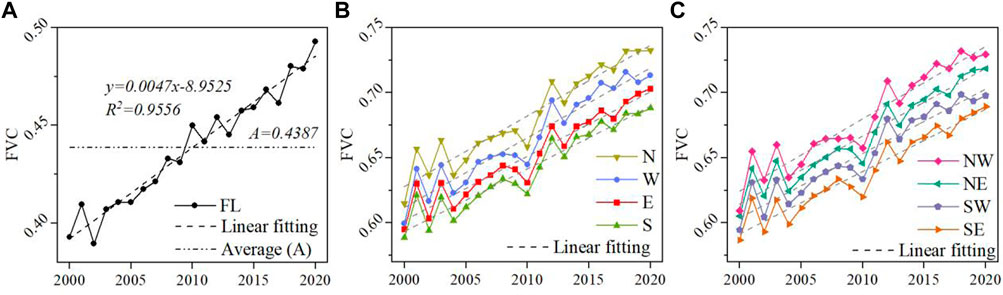
FIGURE 11. Distribution characteristics of vegetation coverage with aspect in the upper reaches of Ganjiang River Basin from 2000 to 2020. FL, N, NE, E, SE, S, SW, W, and NW denote flat land, north slope, northeast slope, east slope, southeast slope, south slope, southwest slope, west slope, and northwest slope, respectively.
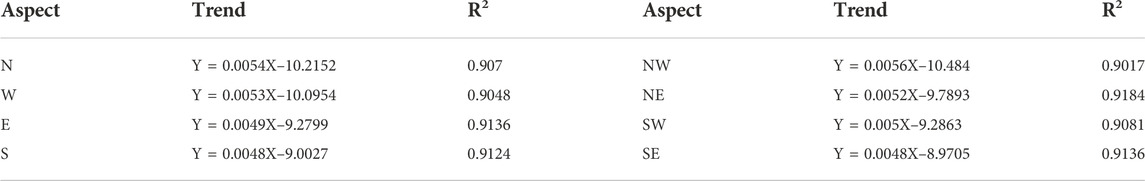
TABLE 5. Linear regression between the vegetation coverage and aspect in the upper reaches of ganjiang river basin from 2000 to 2020.
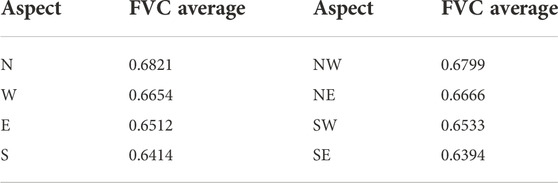
TABLE 6. Average vegetation coverage in each aspect in the upper reaches of ganjiang river basin from 2000 to 2020.
Human activities play an important role in vegetation growth, which can have positive or negative impacts on surface vegetation coverage through indirect impact or direct transformation. For example, afforestation, deforestation, urbanization development, engineering construction and ecological recovery will inhibit or promote the growth of vegetation, cause dramatic changes in surface vegetation in a short period of time, and play a key role in ecosystem restoration and healthy development (Zhang et al., 2019b). In the past 20 years, the accumulated afforestation area in the upper reaches of Ganjiang River is about 0.5 million hectares, which has improved the vegetation coverage to a certain degree; On the other hand, with the continual expansion of the economic specification, the urbanization rate of the upper reaches of the Ganjiang River has increased from 37.53% in 2010 to 55.31% in 2020, the growth rate has reached 47.37% (Liu, 2021). At the same time, the decline of forest ecological function, the intensification of water and soil loss, the general increase of population density and the mining of rare earth minerals have led to the degeneration of the surface vegetation in some areas in varying degrees. In recent years, in order to improve the living quality of residents, the local government has carried out greening construction and ecological livelihood projects actively, the surface vegetation coverage has improved greatly. Therefore, the concept of “green” and “coordination” in high-quality development is vital to the protection of the ecological environment.
This study analyzed the spatiotemporal evolution of vegetation coverage and its relationships with terrain and human factors in the upper reaches of the Ganjiang River Basin, China. The FVC showed a fluctuating increasing trend, and also human activities have different impacts on vegetation coverage under different terrain conditions. Consistent with the achievements of previous studies (Liu et al., 2021; Fu et al., 2022; Tian and Wang, 2022), the ecological environment of the Ganjiang River basin is generally showing a good trend, and at the same time, the basin is subject to some human impact.
However, there are still other factors, such as climate factors, which influence vegetation dynamics that have not been considered. Therefore, quantifying the contributions of various factors and determining the main influencing factors should be the focus of future research. In addition, this study did not use multisource NDVI data for mutual verification. The resolution and quality of the different NDVI data varied. This also affected the results associated with the estimation of vegetation coverage. Further studies considering such factors are ongoing for a deeper understanding of the interrelationships among the ecological environment, climate factors, terrain factors, and human activities in the study area.
Taking the upper reaches of Ganjiang River of long-term sequence research, this study not only enriches the research content of dynamic and rapid monitoring of the change process of ecological environment quality, but also provides reference for rapid assessment of ecological environment quality and construction of ecological environment quality model to analyze the main driving forces. The methods and models adopted in this paper are also applicable in the Yellow River Basin, the Manas River Basin and other watersheds (Liu et al., 2018; Zhang et al., 2019b). Considering the time step of research and analysis is relatively long, the subtle changes among years being ignored, future study will integrating other higher resolution data sources to optimize the evaluation index of ecological environment quality in order to analyze the evolution characteristics of ecological environment quality accurately.
Based on MODIS NDVI and DEM data collected for the upper reaches of the Ganjiang River Basin, this study used trend analysis, coefficient of variation, Hurst index, and linear regression to analyze the temporal and spatial evolution of vegetation coverage and its relationships with terrain factors in the upper reaches of the Ganjiang River Basin, China during the years 2000–2020. The major conclusions drawn from this study are as follows.
1) The FVC showed a fluctuating increasing trend (P<0.001), with an increase rate of 5%/10y. Spatially, the vegetation coverage was dominated by high vegetation coverage in the study area, showing a low-value distribution in the middle and high-value distribution in the surroundings. Themultiyear average FVC was 65.94%. The areas with significant increase and significant decrease accounted for 1.52% and 0.48% respectively, while those with insignificant changes accounted for 98%.
2) The vegetation coverage was relatively stable in the study area, with an average CV of 14.8%. The FVC showed large changes in the middle of Xinfeng County, middle of Nankang District, middle of Yudu County, south of Xingguo County, and middle of Ruijin City, followed by that in the south of Nankang District, middle of Xinfeng County, north of Yudu County, and south of Xingguo County. The surrounding mountains with high altitudes exhibited the smallest changes in the FVC. Hurst analysis showed that the anti-sustainability effect of vegetation change was stronger than that of sustainability, and weak anti-sustainability was dominant. The average Hurst exponent was 0.46.
3) Vegetation coverage in the upper reaches of the Ganjiang River Basin showed an increasing trend with increasing elevation. The maximum vegetation coverage was identified in the elevation zone of 750–1,000 m, with an average of 83.54%. Vegetation coverage also showed an increasing trend with increasing slope. The maximum vegetation coverage was up to 82.22% in the slope zone of ≥25°. There were no significant differences among the distributions of vegetation coverage in different aspects. Overall, the vegetation coverage of flat land was the lowest with a percentage of 43.87, and the maximum was that of the north slope (68.21%). The vegetation coverage on shady slopes was better than that on sunny slopes.
Therefore, under good terrain conditions such as low altitude, gentle slope and aspect with sufficient water and heat conditions, the vegetation coverage is higher. And the differences in topographic factors in the background of the watershed lead to both common and unique characteristics of vegetation differentiation. In addition, terrain conditions affect the range and intensity of human activities, which in turn affects the long-term evolution trend of vegetation cover.
In the context of the background of carbon peaking and carbon neutrality goals, the upper reaches of the Ganjiang River should maintain a good ecosystem, continue to protect the ecological environment of the basin, and build a watershed ecological security pattern. And it is necessary to balance resource development and ecological protection, develop in protection, and protect in development, so as to realize the coordination of economic development and ecological protection in the basin.
The datasets presented in this study can be found in online repositories. The names of the repository/repositories and accession number(s) can be found below https://ladsweb.modaps.eosdis.nasa.gov/.
All authors listed have made a substantial, direct, and intellectual contribution to the work and approved it for publication. YL: Conceptualization, Writing-original draft, Visualization, Funding acquisition. HH: Methodology. LM: Resources, Project administration. ML: Investigation, Data curation. ZW: Formal analysis. TL: Writing-review. DL: Editing, Supervision.
This work was supported in part by the National Natural Science Foundation of China (41861002), the Natural Science Foundation of Guangdong Province of China (2022A1515012010), the Natural Science Foundation of Jiangxi Province of China (20202BABL203031), the Foundation of Education Department of Jiangxi Province of China (GJJ202015), the Key Research Foundation of Education Department of Guangdong Province of China (2021ZDZX4046).
Sincere thanks to Prof Ming Zhang, who was from the Geological Survey of Japan, National Institute of Advanced Industrial Science and Technology for his assistance in completing the paper when he was alive, we also thank the reviewers and the editor for their advice on this manuscript.
The authors declare that the research was conducted in the absence of any commercial or financial relationships that could be construed as a potential conflict of interest.
All claims expressed in this article are solely those of the authors and do not necessarily represent those of their affiliated organizations, or those of the publisher, the editors and the reviewers. Any product that may be evaluated in this article, or claim that may be made by its manufacturer, is not guaranteed or endorsed by the publisher.
Bejagam, V., Keesara, V. R., and Sridhar, V. (2022). Impacts of climate change on water provisional services in Tungabhadra basin using InVEST Model. River Res. Appl. 38 (1), 94–106. doi:10.1002/rra.3891
Caccia, D. C., Percival, D., Cannon, M. J., Raymond, G., and Bassingthwaighte, J. B. (1997). Analyzing exact fractal time series: evaluating dispersional analysis and rescaled range methods. Phys. A Stat. Mech. its Appl. 246 (3-4), 609–632. doi:10.1016/s0378-4371(97)00363-4
Carlson, T. N., and Ripley, D. A. (1997). On the relation between NDVI, fractional vegetation cover, and leaf area index. Remote Sens. Environ. 62, 241–252. doi:10.1016/s0034-4257(97)00104-1
Chen, H., Ouyang, W., and Liu, F. (2019). Variation of vegetation cover and its correlation of topographic factors in Guandu River Basin. Soil Water Conserv. 26, 135–147.
Chybicki, A., and Łubniewski, Z. (2017). Optimized AVHRR land surface temperature downscaling method for local scale observations: case study for the coastal area of the gulf of gdańsk. Open Geosci. 9 (1), 419–435. doi:10.1515/geo-2017-0032
Dardel, C., Kergoat, L., Hiernaux, P., Mougin, E., Grippa, M., and Tucker, C. (2014). Re-greening sahel: 30 years of remote sensing data and field observations (Mali, Niger). Remote Sens. Environ. 140, 350–364. doi:10.1016/j.rse.2013.09.011
Deng, Z., Lu, Z., Wang, G., Wang, D., Ding, Z., Zhao, H., et al. (2021). Extraction of fractional vegetation cover in arid desert area based on Chinese Gf-6 satellite. Open Geosci. 13 (1), 416–430. doi:10.1515/geo-2020-0241
Duo, A., Zhao, W., Qu, X., Jing, R., and Xiong, K. (2016). Spatio-temporal variation of vegetation coverage and its response to climate change in north China plain in the last 33 years. Int. J. Appl. Earth Observation Geoinformation 53, 103–117. doi:10.1016/j.jag.2016.08.008
Fu, B., Yang, W., Yao, H., He, H., Lan, G., Gao, E., et al. (2022). Evaluation of spatio-temporal variations of FVC and its relationship with climate change using GEE and Landsat images in Ganjiang River Basin. Geocarto Int., 1–31. doi:10.1080/10106049.2022.2082551
García, M., Alloza, J., Mayor, Á., Bautista, S., and Rodriguez, F. (2014). Detection and mapping of burnt areas from time series of MODIS-derived NDVI data in a Mediterranean region. Open Geosci. 6 (1), 112–120. doi:10.2478/s13533-012-0167-y
Geng, W. L., Li, Y. Y., Sun, D. Q., Li, B., Zhang, P., Chang, H., et al. (2022). Prediction of the potential geographical distribution of Betula platyphylla Suk. in China under climate change scenarios. Plos one 17 (3), e0262540. doi:10.1371/journal.pone.0262540
Gutman, G., and Ignatov, A. (1998). The derivation of the green vegetation fraction from NOAA/AVHRR data for use in numerical weather prediction models. Int. J. Remote Sens. 19 (8), 1533–1543. doi:10.1080/014311698215333
Hao, J., Xu, G., Luo, L., Zhang, Z., Yang, H., and Li, H. (2020). Quantifying the relative contribution of natural and human factors to vegetation coverage variation in coastal wetlands in China. Catena 188, 104429–104514. doi:10.1016/j.catena.2019.104429
Hilker, T., Lyapustin, A. I., Tucker, C. J., Hall, F. G., Myneni, R. B., Wang, Y., et al. (2014). Vegetation dynamics and rainfall sensitivity of the Amazon. Proc. Natl. Acad. Sci. U. S. A. 111, 16041–16046. doi:10.1073/pnas.1404870111
Huete, A. (2016). Vegetation's responses to climate variability. Nature 531, 181–182. doi:10.1038/nature17301
Huo, H., and Sun, C. (2021). Spatiotemporal variation and influencing factors of vegetation dynamics based on geodetector: A case study of the northwestern yunnan plateau, China. Ecol. Indic. 130, 108005. doi:10.1016/j.ecolind.2021.108005
Hurst, H. (1951). Long term storage capacity of reservoirs. T. Am. Soc. Civ. Eng. 116, 770–799. doi:10.1061/taceat.0006518
Ivanov, V. Y., Bras, R. L., and Vivoni, E. R. (2008). Vegetation-hydrology dynamics in complex terrain of semiarid areas: 2. Energy-water controls of vegetation spatiotemporal dynamics and topographic niches of favorability. Water Resour. Res. 44 (3). doi:10.1029/2006wr005595
Jing, X., Yao, W., Wang, J., and Song, X. Y. (2011). A study on the relationship between dynamic change of vegetation coverage and precipitation in Beijing’s mountainous areas during the last 20 years. Math. Comput. Model. 54, 1079–1085. doi:10.1016/j.mcm.2010.11.038
Kalisa, W., Igbawua, T., Henchiri, M., Zhang, S., and Bai, Y. (2019). Assessment of climate impact on vegetation dynamics over East Africa from 1982 to 2015. Sci. Rep. 9 (1), 16865–16920. doi:10.1038/s41598-019-53150-0
Lamchin, M., Lee, W. K., Jeon, S. W., Wang, S. W., and Song, C. (2018). Long-term trend and correlation between vegetation greenness and climate variables in Asia based on satellite data. Sci. total Environ. 618, 1089–1095. doi:10.1016/j.scitotenv.2017.09.145
Li, H., Liu, X., and Li, B. (2014). Vegetation coverage variations and correlation with geomorphologic factors in red soil region: a case in south Jiangxi Province. Sci. Geogr. Sin. 34 (1), 103–109.
Li, Y., Zhao, Z., Wang, L., Li, G., and Chang, L. (2021). Vegetation changes in response to climatic factors and human activities in Jilin Province, China, 2000–2019. Sustainability 13 (16), 8956. doi:10.3390/su13168956
Liu, C., Zhang, X., Wang, T., Chen, G., Zhu, K., Wang, Q., et al. (2022). Detection of vegetation coverage changes in the Yellow River basin from 2003 to 2020. Ecol. Indic. 138, 108818. doi:10.1016/j.ecolind.2022.108818
Liu, G., Wang, X., Wang, X., Wang, B. X., and Xiao, S. M. (2021). Spatial heterogeneity and driving factors of land use change in the middle and upper reaches of Ganjiang River, southern China. Chin. J. Appl. Ecol. 32 (7), 2545–2554. doi:10.13287/j.1001-9332.202107.016
Liu, H., Zheng, L., and Yin, S. (2018). Multi-perspective analysis of vegetation cover changes and driving factors of long time series based on climate and terrain data in Hanjiang River Basin, China. Arab. J. Geosci. 11 (17), 509–516. doi:10.1007/s12517-018-3756-3
Liu, M. (2021). Study on the change of vegetation coverage and its driving factors in the upper reaches of Ganjiang River basin. MA thesis. China: Jiangxi University of Science and Technology.
Liu, X., Zhou, W., and Bai, Z. (2016). Vegetation coverage change and stability in large open-pit coal mine dumps in China during 1990–2015. Ecol. Eng. 95, 447–451. doi:10.1016/j.ecoleng.2016.06.051
Liu, Y., Ding, Q., Chen, M., Zhong, L., Labat, D., Zhang, M., et al. (2020). Analyses of runoff and sediment transport and their drivers in a rare Earth mine drainage basin of the Yangtze River, China. Water 12 (8), 2283. doi:10.3390/w12082283
Liu, Y., Liu, Y., Chen, M., Labat, D., Li, Z., and Bian, Z. (2019). Characteristics and drivers of reference evapotranspiration in hilly regions in southern China. Water 11 (9), 1914. doi:10.3390/w11091914
Przeździecki, K., Zawadzki, J., Cieszewski, C., and Bettinger, P. (2017). Estimation of soil moisture across broad landscapes of Georgia and South Carolina using the triangle method applied to MODIS satellite imagery. Silva Fenn. Hels. 51 (4), 1683. doi:10.14214/sf.1683
Ranjan, A. K., and Gorai, A. K. (2022). Evaluating phenological trends of different vegetation types in response to climate change over the Rajmahal Hills in India during 2001-2019. Remote Sens. Lett. 13, 898–911. doi:10.1080/2150704x.2022.2106455
Ranjbar, A., Vali, A., Mokarram, M., and Taripanah, F. (2020). Investigating variations of vegetation: climatic, geological substrate, and topographic factors—a case study of kharestan area, fars Province, Iran. Arab. J. Geosci. 13 (14), 597. doi:10.1007/s12517-020-05615-0
Rey, D., Holman, I. P., Daccache, A., Morris, J., Weatherhead, E., and Knox, J. (2016). Modelling and mapping the economic value of supplemental irrigation in a humid climate. Agric. water Manag. 173, 13–22. doi:10.1016/j.agwat.2016.04.017
Sarfo, I., Shuoben, B., and Otchwemah, H. B. (2022). Validating local drivers influencing landuse cover change in southwestern Ghana: a mixed-method approach[J]. Environ. Earth Sci. 81 (14), 1–34.
Savitzky, A., and Golay, M. J. E. (1964). Smoothing and differentiation of data by simplified least squares procedures. Anal. Chem. 36 (8), 1627–1639. doi:10.1021/ac60214a047
Shobairi, S. O. R., Usoltsev, V. A., and Chasovskikh, V. P. (2018). Dynamic estimation model of vegetation fractional coverage and drivers. Int. J. Adv. Appl. Sci. 5 (3), 60–66. doi:10.21833/ijaas.2018.03.009
Sun, Y., Shan, M., Pei, X., Zhang, X. K., and Yang, Y. L. (2020). Assessment of the impacts of climate change and human activities on vegetation cover change in the Haihe River basin, China. Phys. Chem. Earth Parts A/B/C 115, 102834. doi:10.1016/j.pce.2019.102834
Tian, J., and Wang, Y. (2022). A study on the temporal and spatial changes of vegetation primary productivity in Ganjiang River basin based on the background of urbanization. Territ. Nat. Resour. Study 01, 83–87.
Wang, B., Xu, G., Li, P., Li, Z., Zhang, Y., Cheng, Y., et al. (2020). Vegetation dynamics and their relationships with climatic factors in the Qinling Mountains of China. Ecol. Indic. 108, 105719. doi:10.1016/j.ecolind.2019.105719
Wei, X., Wang, S., and Wang, Y. (2017). Spatial and temporal change of fractional vegetation cover in north-western China from 2000 to 2010. Geol. J. 53, 427–434. doi:10.1002/gj.3030
Wei, Z., Zhen, Y., Zhang, R., Du, L., Huang, Q., and Yang, S. (2022). Trends of vegetation dynamics and its response to climate change in Pearl River Basin of southwestern China. Arab. J. Geosci. 15 (5), 454–513. doi:10.1007/s12517-022-09556-8
Xiong, Y., Li, Y., Xiong, S., Wu, G., and Deng, O. (2021). Multi-scale spatial correlation between vegetation index and terrain attributes in a small watershed of the upper Minjiang River. Ecol. Indic. 126, 107610. doi:10.1016/j.ecolind.2021.107610
Zeng, Y., Hao, D., Huete, A., Dechant, B., Berry, J., Chen, J. M., et al. (2022). Optical vegetation indices for monitoring terrestrial ecosystems globally. Nat. Rev. Earth Environ. 3, 477–493. doi:10.1038/s43017-022-00298-5
Zhan, Y., Fan, J., Meng, T., Li, Z., Yan, Y., Huang, J., et al. (2021). Analysis on vegetation cover changes and the driving factors in the mid-lower reaches of Hanjiang River Basin between 2001 and 2015. Open Geosci. 13 (1), 675–689. doi:10.1515/geo-2020-0259
Zhang, B., Cui, L., Shi, J., and Wei, P. (2017). Vegetation dynamics and their response to climatic variability in China. Adv. Meteorology 2017, 1–10. doi:10.1155/2017/8282353
Zhang, M., Luo, G., Cao, X., Hamdi, R., Li, T., Cai, P., et al. (2019). Numerical simulation of the irrigation effects on surface fluxes and local climate in typical mountain-oasis-desert systems in the central asia arid area. JGR. Atmos. 124 (23), 12485–12506. doi:10.1029/2019jd030507
Zhang, M., Wang, J., and Li, S. (2019). Tempo-spatial changes and main anthropogenic influence factors of vegetation fractional coverage in a large-scale opencast coal mine area from 1992 to 2015. J. Clean. Prod. 232, 940–952. doi:10.1016/j.jclepro.2019.05.334
Keywords: vegetation coverage, spatial-temporal variation, terrain factor, correlation, Ganjiang River basin
Citation: Liu Y, Huang H, Meng L, Liu M, Wu Z, Liu T and Labat D (2023) Spatial-temporal evolution of vegetation coverage and its relationship with terrain and human factors in the upper reaches of Ganjiang River Basin, China. Front. Earth Sci. 10:1043403. doi: 10.3389/feart.2022.1043403
Received: 13 September 2022; Accepted: 31 October 2022;
Published: 13 January 2023.
Edited by:
Wen Nie, Jiangxi University of Science and Technology, ChinaCopyright © 2023 Liu, Huang, Meng, Liu, Wu, Liu and Labat. This is an open-access article distributed under the terms of the Creative Commons Attribution License (CC BY). The use, distribution or reproduction in other forums is permitted, provided the original author(s) and the copyright owner(s) are credited and that the original publication in this journal is cited, in accordance with accepted academic practice. No use, distribution or reproduction is permitted which does not comply with these terms.
*Correspondence: Lihong Meng, bWxoODE1OEAxNjMuY29t
Disclaimer: All claims expressed in this article are solely those of the authors and do not necessarily represent those of their affiliated organizations, or those of the publisher, the editors and the reviewers. Any product that may be evaluated in this article or claim that may be made by its manufacturer is not guaranteed or endorsed by the publisher.
Research integrity at Frontiers
Learn more about the work of our research integrity team to safeguard the quality of each article we publish.