 Ning Zhao
 Atsuyoshi Manda
 Xiaojun Guo3
 Bin Wang
94% of researchers rate our articles as excellent or good
Learn more about the work of our research integrity team to safeguard the quality of each article we publish.
Find out more
ORIGINAL RESEARCH article
Front. Earth Sci. , 10 November 2022
Sec. Atmospheric Science
Volume 10 - 2022 | https://doi.org/10.3389/feart.2022.1043093
This article is part of the Research Topic Modelling, Simulating and Forecasting Regional Climate and Weather, volume II View all 8 articles
Our recent study suggested that moisture from the subtropical Western Pacific (WP) contributed the most to an atmospheric river (AR) event and the related heavy rainfall during the heavy rain of 2020 in Japan based on a Lagrangian approach. However, the actual role of moisture from the subtropical WP region in the AR and heavy rain formations remains unclear. To evaluate that, we conducted a set of numerical sensitivity experiments by adjusting the surface moisture supply over the subtropical WP region with factors of 0%, 50%, and 200%. The sensitivity experiments suggest that the reduced surface evaporation over the subtropical WP suppressed the local convective activity and decreased moisture content in the whole troposphere, leading to shallow and weak positive geopotential height anomalies. Although the slightly strengthened WP subtropical High (WPSH) and related anomalous anticyclonic circulation enhanced the southwesterly wind, convective activities along the Meiyu-Baiu front were still weakened due to the largely reduced moisture supply, resulting in another anomalous anticyclonic circulation over Japan but had much stronger and deeper structures. These two anomalous circulations and the reduced moisture modulated the AR over Japan, which eventually caused the weakened rainfalls and the northward migration of the rainband. By contrast, larger surface evaporation enhanced the local convective activities and weakened the dominant WPSH, resulting in the weakening and the southward migration of the AR. Overall, this study confirmed the large contributions of moisture supply from the subtropical WP region to the AR and related precipitation over Japan during the record-breaking Meiyu-Baiu season in 2020 via both dynamic and thermodynamic influences. In addition, it reveals that, although larger evaporation over the WP region would increase the total rainfalls but would not have led to more several rainfalls over certain regions, such as the relatively small Kyushu Island.
In 2020, a large amount of rain fell over East Asia during the Meiyu-Baiu season from June to July, inducing many record-breaking heavy rainfalls and great damage due to the floods and landslides (e.g., JMA 2020; Araki et al., 2021; Qiao et al., 2021). Previous studies indicated that the cause of this long-persisting Meiyu-Baiu season in 2020 combined the influences of multiple sources from the tropics, mid-and high latitudes, such as the Indian Ocean basin warming that can further be related to the 2019 super Indian Ocean Dipole (e.g., Takaya et al., 2020; Cai et al., 2022), teleconnections that related to the North Atlantic Oscillation and the Madden-Julian Oscillation (e.g., Liu et al., 2020; Horinouchi et al., 2021; Zhang et al., 2021), and the Arctic and global warming (e.g., Chen M et al., 2021; Nakamura and Sato 2022; Tang et al., 2022).
Particularly, it has been demonstrated that most extreme events during the Meiyu-Baiu season could be related to the strong moisture transport with narrow, filamentary shapes, i.e., the atmospheric rivers (AR, e.g., Kamae et al., 2017; Takemura et al., 2019; Imada et al., 2020). For example, Liang and Yong (2021) argued the contributions of ARs to total precipitation in East Asia and suggested ARs could be associated with 68% of the summer extreme precipitation in East Asia. Similarly, Park et al. (2021) also showed that ARs may contribute to 60%–80% of heavy rainfalls in East Asia from June to July. Specifically, some recent studies confirmed that ARs played important roles in severe rainfall events in eastern China and western Japan in 2020 (e.g., Takaya et al., 2020; Araki et al., 2021), while Wang et al. (2013) further estimated the contribution of ARs could reach 50%–80% of the total Meiyu-Baiu precipitation in that year.
As the key feature of AR, the highly accumulated moisture always attracts attention. In general, previous studies suggest that moisture is transported from the tropical regions during the Meiyu-Baiu season (e.g., Zhou et al., 2010; Baker et al., 2015; Guo et al., 2019), while the western Pacific subtropical High (WPSH) provides the fundamental wind force, whose role was further highlighted during the two severe Meiyu-Baiu seasons in 2018 and 2020 (e.g., Huang et al., 2018; Takemura et al., 2019; Yuan et al., 2019; Zhao et al., 2022). Therefore, many studies focused on the roles of tropical sea surface temperature (SST), which influenced the evaporation and convection in the tropics (and hence moisture from there), and more importantly, the intensity and location of the WPSH (e.g., Xie et al., 2016; Liang et al., 2021; Ueda et al., 2021).
It is no doubt that the tropics dramatically influence AR activities during the Meiyu-Baiu season by modulating moisture and circulations (e.g., Kamae et al., 2021; Takahashi and Fujinami 2021); however, some recent studies on moisture sources also shed a light on the potentially underestimated roles of subtropical regions. For example, Hu and Dominguez (2019) showed that tropical moisture only contributed less than 50% to the inland precipitation in mid-latitudes. In addition to that, by considering the gain/loss processes (e.g., evaporation and precipitation) during moisture transport, Shi et al. (2020) also suggested that the contributions of moisture from the Indian Ocean to actual precipitation were less than 10% during the summertime of East Asia due to moisture loss during the transport.
In the same manner, our recent study (Zhao et al., 2021; hereafter Z21) revealed that the subtropical western Pacific (WP; 122°–140°E, 15°–28°N) region contributed the most to moisture accumulation of the ARs during the Meiyu-Baiu season of 2020. However, two issues remained in the Z21. At first, in Z21 and other similar studies (e.g., Sodemann et al., 2008), the gain/loss processes are defined by moisture changes of the “pseudo air parcel,” and, more importantly, the “evaporation” was generally defined as the changes within the planetary boundary layer, which may only reflect the vertical mixing rather than the actual evaporation. Although such assumptions helped us in revealing the contributions of different regions, they also led to some uncertainties about whether surface evaporation did contribute much as we found before. Secondly, the role of moisture from subtropics in the AR and heavy rain formations could hardly be investigated by the trajectory-based analyses used in Z21, which require numerical sensitivity experiments. Therefore, the current study was motivated to evaluate the actual contributions and potential roles of moisture supply from the oceans during the heavy rain and to reveal the mechanisms of the related modulations. In this study, we focused on the moisture from the subtropical WP region, which contributed the most to the case in 2020 as revealed in Z21.
This paper is organized as follows. Section 2 includes descriptions of the data sources and settings of the numerical model and sensitivity experiments. Section 3 documents the overview of the AR and precipitation during the study period and the responses of the local atmosphere over the subtropical WP region and ARs over Japan in the sensitivity experiments. Section 4 discusses the contributions of moisture and wind anomalies in modulating the AR and the responses of the WPSH and ARs. Finally, a summary of our major findings is presented in Section 5.
In this study, the numerical experiments were conducted based on the Weather Research and Forecasting model (WRF V4.2.2; Skamarock et al., 2008). Following Z21, the study domain covers the East Asian region (94°–166°E, 2.5°–45.5°N; Figure 1D) with 9-km mesh grids and 60 sigma layers from the surface to 50-hPa. In addition, to represent the convective moistening over the subtropical WP region well (e.g., Takemi 2015; Z21), we applied a two-way nested inner domain with 3-km resolution that was slightly larger than the WP region (121°–141°E, 13.5°–29.5°N) to avoid unexpected disturbances near the inner domain boundaries due to the regionally applied adjusting factors in the sensitivity experiments. Note that we did not include the Japanese archipelago within the inner domain for saving the computational and analyzing cost, and Z21 has confirmed that the 9-km mesh grids could represent the heavy rainfall well enough.
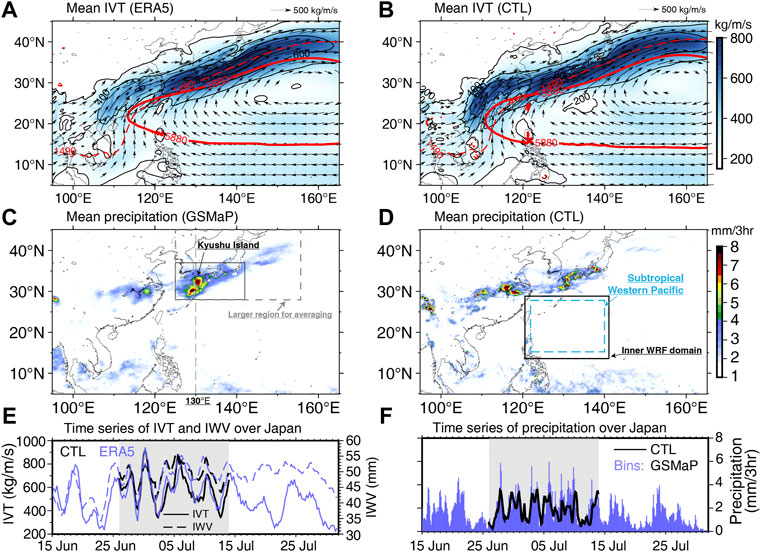
FIGURE 1. (A,B) Mean moisture transport (IVT by color and contours with every 200 kg/m/s, and moisture fluxes by vectors) together with the 1490-gpm and 5880-gpm geopotential height (red contours) and (C,D) mean precipitation during the period from 26 June to 13 July [gray shading in (E,F)]. (E,F) Time series of the area averaged IWV, IVT, and precipitation over Japan[(black box in (C)] based on the ERA5/GSMaP and the CTL run. The dashed line in (C) shows the cross-section 130°E in the following analyses. Gray dashed box in (C) show the larger area for averaging the total rainfall (see Table 2 and Section 3.3 for details). Two boxes in (D) show the subtropical Western Pacific (WP) region and the WRF inner domain.
The lateral boundary and initial conditions were interpolated from the 0.25-degree ERA5 reanalysis dataset from the European Centre for Medium-Range Weather Forecast (ECMWF; Hersbach et al., 2020). The lower boundary was obtained from the daily Optimum Interpolation Sea Surface Temperature (OISSTv2.1; Huang et al., 2020). Both lateral and lower boundary conditions were applied every 6 h.
The control (CTL) run was conducted to reproduce the period from late June to mid-July (26 June to 13 July), which contained most of the heavy rain events (see Figure 1F; JMA, 2020). Since we only focus on the ARs and heavy rainfalls that have a sub-weekly time scale (e.g., Lavers et al., 2020; Liu et al., 2021; also see Figures 1E,F), we reinitiated the model every 8 days during the study period (i.e., three 8-day cycles in total) to avoid the unexpected large anomalies that grew from the long-time integration. In addition, the three different initial times also helped us to obtain the common responses of ARs under different atmospheric conditions. The model output was saved every 3 h, and the first 2 days in each 8-day cycle were not used in our analyses, which are considered as the spin-up time and the time for moisture transported from subtropics to Japan (e.g., Zhao et al., 2021). The performance of the CTL run was compared to the ERA5 and the satellite-observed precipitation from the hourly Global Rainfall Mapping Precipitation (GSMaP) dataset (Kubota et al., 2020). Results show that the CTL run well simulated the atmospheric conditions and precipitation without any unnatural inconsistencies among the three cycles (Figure 1).
We used the Thompson microphysics scheme (Thompson et al., 2008), the Yonsei University PBL scheme (Hong et al., 2006), the Revised MM5 surface layer scheme (Jimenez et al., 2012), the United Noah Land Surface Model (Tewari et al., 2004), and the RRTMG Shortwave and Longwave Schemes (Iacono et al., 2008). We used the Tiedtke cumulus scheme for the outer domain (Zhang et al., 2011), and no cumulus scheme was used for the inner domain.
Three sensitivity experiments were carried out to investigate the influences of the surface moisture supply from the subtropical western Pacific region (122°–140°E, 15°–28°N) by applying extra factors to the original latent heat flux (hence, the evaporation) field. For simplicity, two experiments (NOLH and HFLG) were conducted to evaluate the response of the atmospheric rivers when the moisture supply was reduced. The NOLH run cut off the surface latent heat flux over the subtropical WP region by multiplying a uniformly distributed factor (0%), while the HFLH cut half (50%) of the flux. In addition, another experiment with doubled latent heat flux was conducted (DBLH) to evaluate the responses if extra moisture was supplied from the subtropical WP region. The three experiments are summarized in Table 1. Note that the adjusting factors were adopted every time step during the model iteration, and the exact modulated values will be changed accordingly under the conditions at each time step. Thus, the HFLH and DBLH runs do not necessarily have exactly half or doubled latent heat flux compared to the CTL run.
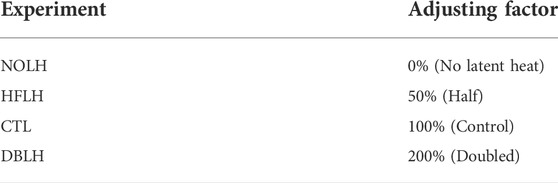
TABLE 1. Descriptions of the sensitivity experiments.
To illustrate the AR, we used the integrated water vapor (IWV) and its transport (IVT), which can be obtained as follows (e.g., Lavers et al., 2012).
where g is the gravitational acceleration, q is the specific humidity, p is the pressure, and u and v are the zonal and meridional wind, respectively.
In addition, as shown in previous studies, the strength and the location of the AR are primarily determined by the intensity and the northern edge of the WPSH (e.g., Ding and Chan, 2005; Kamae et al., 2017; Shi et al., 2020). Thus, to find out how would the AR respond to the moisture supply, the responses of the WPSH should be evaluated first. To do so, two indices were used in this study. Following Wang et al. (2013), the intensity of the WPSH was defined as the anomalous geopotential height at 850-hPa level over the region of 115°–150°E, 15°–25°N. Because of the short time coverage of our experiments, the index was calculated based on the raw data, instead of the long-term mean as used in Wang et al. (2013). On the other hand, to obtain the northern edge of the WPSH (and hence the location of the AR), a simple index was introduced in this study by using the latitudes of two critical geopotential height contours (i.e., 1490-gpm at 850-hPa level and 5880-gpm at 500-hPa level), which generally indicate the northern edge of the WPSH (e.g., Ren et al., 2013; also see red contours in Figures 1A,B). Based on that, the average latitude of these two contours within 125°E and 140°E (i.e., over Japan) was then defined as the northern edge index.
During the period from late June to mid-July 2020, a large amount of moisture was transported (>800 kg/m/s) and accumulated (>50 mm) over the regions from the southeast China and the subtropical WP region to Japan, forming a zonally oriented narrow pattern (i.e., the AR; Figure 1A). This mean-state AR generally followed the northern edge of the WPSH (see red contours in Figure 1) and was formed by the overlapped strong westerly wind and the highly accumulated moisture north of 28°N (Figure 2A). In some aspects, this mean-state AR was highly related to the quasi-stationary Meiyu-Baiu front, where the troposphere was dominated by enhanced deep convection (see the high relative humidity, RH, connecting the lower and upper troposphere; Figure 2C).
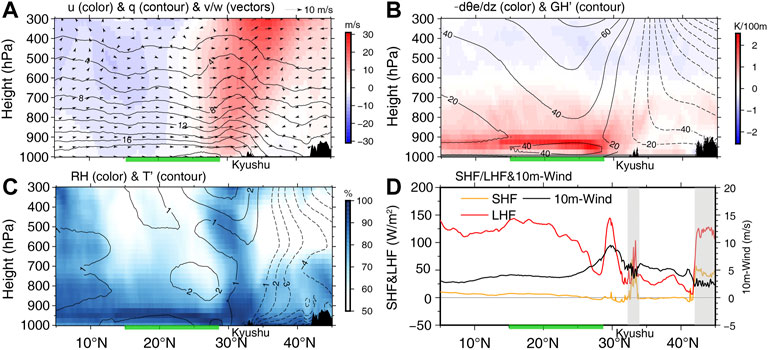
FIGURE 2. Cross-sections along 130°E (averaged within 129.5°–130.5°E) based on the CTL run averaged from 26 June to 13 July: (A) wind fields (color shading and vectors; w is amplified 50 times for visualization) and specific humidity (q, contours), (B) vertical gradient of the equivalent potential temperature (
As shown in Figure 1F, continuous rains fell over western Japan and lasted more than 1 month from late June to the end of July, when the heavy rainfalls occasionally occurred every two or 3 days, especially during our study period (26 June to 13 July; gray shading in Figure 1). By calculating the lead-lag correlation coefficients among moisture transport (IVT), moisture accumulation (IWV), and precipitation (Figure 3A), we found the occasionally occurred heavy rainfalls were closely related to the individual AR events as indicated by the remarkably increased IVTs and the related IWVs (Figure 1E). The lead-lag correlations suggest that the AR (i.e., the IVT) helped moisture accumulation prior to the heavy rainfall (i.e., the pre-moistening of the troposphere; Tsuji et al., 2021), and their maximum correlation was found at −6 h. Meanwhile, the IWV varied almost simultaneously with the precipitation which is consistent with the previous studies (e.g., Tsuji et al., 2021).
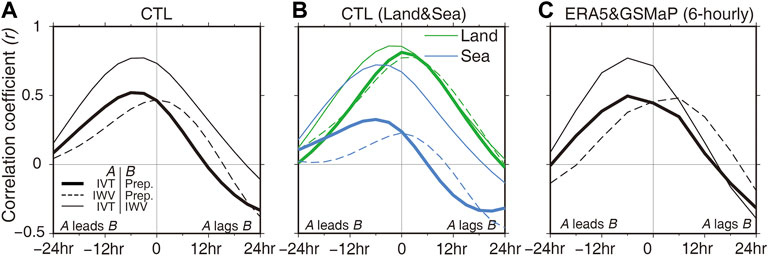
FIGURE 3. (A) The lead-lag correlations among the area-averaged IVT, IWV, and precipitation during the study period (26 June to 13 July) over Japan (black box in Figure 1C). (B) represents the coefficients calculated over land (green) and sea (blue) areas. Results based on 6-hourly ERA5 and GSMaP are also plotted in (C) for comparison.
In addition, as shown in Figure 1, the precipitation during the heavy rain showed clear land-sea dependence, suggesting there might be different correlations over the land and the sea. Following that line, we calculated the lead-lag correlations based on the land-sea mask used in the model (Figure 3B). Interestingly, while the correlations over the sea remained similar to those we found above, the story over the land changed much. Despite the higher coefficients, the biggest difference is that the correlation between the IVT and precipitation reached its maximum with 0 leads over the land area, suggesting the ARs may play important roles not only in the pre-moistening of the troposphere but also in the initiation of convection via the orography-related processes (e.g., Schumacher and Johnson, 2005; Miyajima and Fujibe, 2011). Note that the maximum correlation between the IVT and IWV over land was found at −3 h with a coefficient of 0.860 but remained high at 0 leads (0.858), suggesting that the 3-hour output interval may not be short enough in resolving the detailed changes of moisture and related short-time processes (Henderson et al., 2021).
On the other hand, when the Japanese archipelago suffered heavy precipitation, almost no precipitation was found over the subtropical WP region (Figures 1C,D). Compared to the tropical regions, a large amount of moisture was concentrated within the boundary layer and lower levels (>900-hPa) over the subtropical WP region (Figures 2A,C), while the surface latent heat flux (i.e., evaporation; red line in Figure 2D) were even larger than the tropical Pacific and was comparable with that over the Kuroshio warm current (i.e., the peak around 30°N). As a result, a warm and moist boundary layer was formed over the subtropical WP region with a large instability near the top of the boundary layer (Figure 2B). However, convection was still inhibited by the capping inversion due to the dominant WPSH. As a result, most convection remained shallow, and only some weak signals of deep convection could be seen in this region (see the light blue shading showing the upward extending RHs around 20°N in Figure 2C), exhibiting a typical trade-wind cumulus regime.
Note that, for our own interest, we also calculated the lead-lag correlations over the Yangtze River region (110°–120°E, 27°–32.5°N) during the same period (Supplementary Figure S1). Results show that both the IVT and the IWV had low correlation coefficients with precipitation, suggesting the rainfalls over the western (i.e., the Yangtze River region) and eastern (i.e., the Japanese archipelago) sections of the Meiyu-Baiu front did not share the same dynamics, which is consistent with previous studies (e.g., Chen and Chang 1980; Sampe and Xie 2010).
Before checking the responses of ARs and precipitation over Japan, we first evaluate the subtropical WP region which directly responded to the modified latent heat flux. Figure 4 shows the meridional differences in thermal conditions along 130°E. Not surprisingly, we found large reductions of moisture within the local boundary layer over the subtropical WP region in the NOLH and HFLH runs. Moreover, due to the reduced surface moisture supply, the boundary layer was stabilized (Figure 4D), especially near the top of the boundary layer (∼925 hPa). Such stabilization further suppressed the weak convection over the WP region, which made the local troposphere even drier (Figures 4A,B; also see Figure 5), as suggested by the large drying and cooling signals in the lower-to-mid troposphere where the shallow convection mainly controlled (Figures 4D,E). On the other hand, the surface wind in the NOLH and HFLH runs did not monotonically respond to the surface latent heat flux but was increased in the south and decreased north of the WP region, which generally corresponded to an anomalous anti-cyclonic circulation (e.g., Figure 5).
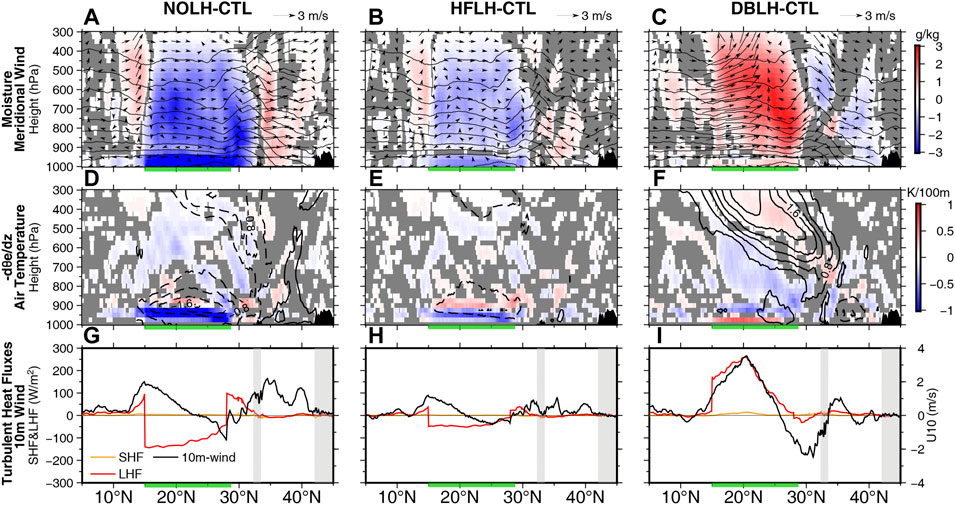
FIGURE 4. Cross-sectional differences between sensitivity experiments and the CTL run along 130°E: (A–C) specific humidity (q, color shading; contours represent q of the CTL run) and meridional wind (vectors; w is amplified 50 times for visualization), (D–F) vertical gradient of the equivalent potential temperature (
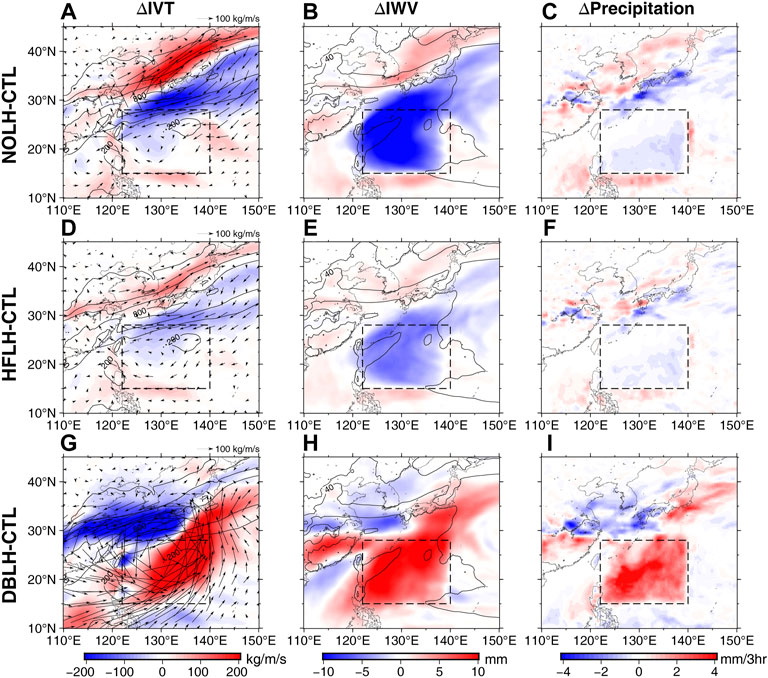
FIGURE 5. Differences in moisture transport [IVT; (A,D,G)], moisture accumulation [IWV; (B,E,H), and precipitation (C,F,I)] between the sensitivity experiments and the CTL run. Contours represent the values in the CTL run, and dashed boxes show the WP region. Contours are plotted every 200 kg/m/s and 20 mm, respectively.
Similarly, the wind anomaly also induced nonlinear responses of the surface latent heat in the DBLH run (Figure 4I). The flux was largely increased in the regions south of 25°N, while its maximum was about three times larger than the CTL run around 20°N. On the other hand, the anomalies gradually decayed to zero from 20°N to the northern boundary of the subtropical WP region at 28°N. In addition, as the surface evaporation increased, the entire troposphere became moister over the subtropical WP region (Figure 4C), suggesting the upward moisture transport was enhanced. Considering the warming signals in mid-to-upper levels, such anomalous vertical moisture transport was likely induced by the enhanced local convective activities (also see Figure 9F). Moreover, it is found that the moistening/warming patterns were located higher in the southern regions but remained relatively shallower in the north, exhibiting a vertically southward-titled pattern (Figure 4F), which may be related to the distributions of the surface latent heat flux anomalies.
As shown in Figures 4, 5, the modulated moisture content over the WP region influenced the air masses transported northward, which further influenced the AR and related precipitation over Japan. Our results show that in both NOLH and HFLH runs, moisture transport over Japan decreased in the south and increased in the north, resulting in a northwestward-shifted pattern. Meanwhile, clear reductions in moisture content were found near the frontal regions around 30°N with titled structures from lower to upper levels, suggesting the convective activity was weakened near the Meiyu-Baiu front (e.g., Figures 4D,E; Matsumoto et al., 1971; Hu et al., 2021). As a result, precipitation was largely reduced over the Japanese archipelago and was increased in the north over the seas. The total amount of rainfalls decreased from 266.84 mm to 201.04 mm and 250.55 mm in the NOLH and HFLH runs, respectively (Table 2), which are consistent with the contribution ratios found in Z21. Moreover, these reductions remain large even though we included the ocean areas nearby where the precipitation increased due to the northward shift.

TABLE 2. Total precipitation averaged over Japan (125–142°E, 28–37°N) and a larger area covering both the Japanese Archipelago and the seas nearby (125–155°E, 28–45°N) during the period from 26 June to 13 July.
By contrast, when the surface latent heat flux was doubled, an anomalous cyclonic moisture transport was generated over the subtropical WP region (Figure 5G), which largely weakened the original moisture channel along the edge of the WPSH (e.g., Zhao et al., 2021). Meanwhile, the anomalous circulation induced stronger northward moisture transport toward eastern Japan. Compared to that, the IWV showed a slightly different pattern, which has positive anomalies over most regions of Japan, except Kyushu Island. Consequently, precipitation was weakened on the western side of the Japanese archipelago but was enhanced in the east (Figure 5I), while the total rainfalls over Japan remained almost unchanged (Table 2). Note that the weakened WPSH was somehow similar to the conditions during phases 7-8 of the Boreal summer Intraseasonal Oscillation when convection was enhanced over the subtropical regions (see Figure 9 in Guo et al., 2021).
Our results show that the responses in precipitation depended on the scales and regions we focused on. Figure 6 shows the meridional distributions of the AR and precipitation over Kyushu Island where the heaviest rainfalls occurred (e.g., Figure 1). It is found that the stray-off of the main axis of the AR mainly caused the changes in rainfalls over Kyushu in the NOLH and DBLH runs, although they had opposite settings in moisture supply. Meanwhile, in the HFLH run, even though the evaporation was reduced, precipitation over Kyushu became heavier because of the slightly northward migrated AR (Figure 6B). Therefore, precipitation over the relatively small Kyushu Island would not show a monotonic response to the moisture supply from the subtropical WP region, although it linearly responded to the changes in the IVT. In contrast, the total amount of rainfall over the whole region that was influenced by the AR showed more linear responses to the adjusted evaporation.
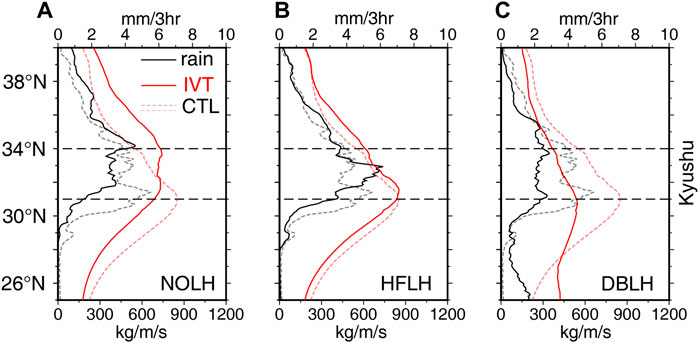
FIGURE 6. Meridional distributions of the mean moisture transport (IVT, red line) and precipitation (black line) along 130°E (averaged within 129–132°E) in each experiment, where the values in the CTL run are plotted in dashed lines.
Overall, the above results well document the critical role of moisture supply from the subtropical WP region to the AR and related precipitation, and the reduced/enhanced moisture from the oceans would induce linearly responded total rainfalls. But they also indicated that larger sea surface evaporation would not have led to more precipitation over certain regions, such as the relatively small Kyushu Island, because of the closely combined thermal and dynamical responses that determined the moisture transport.
As we mentioned in Section 3, our results show that the migrations of the rainband generally followed the AR; however, due to the nonlinear combination of moisture and wind and the related thermodynamical processes, it is difficult to evaluate their contributions. Therefore, we considered the following linear decomposition of the anomalous moisture fluxes:
where u and q are the wind and moisture in the CTL run,
Because the IVT only measures the magnitude, the right-hand-side terms of Eq. 4 were calculated separately by using the corresponding three components of Eq. 3. For instance,
Figure 7 shows the contributions of anomalous moisture and wind to the total moisture transport (IVT). As we expected, the wind anomaly induced the largest IVT anomalies in most regions, which generally determined the spatial pattern of their sums. On the other hand, our results also show that moisture anomaly could provide a comparable contribution to the transport around the core part of the AR around 30°N, where the Meiyu-Baiu front is located. A detailed comparison of the relative contributions over Kyushu Island is shown in Figure 8. It is found that, in the NOLH and HFLH runs, moisture anomaly contributed about 60% of the total reduction over the AR’s core region (i.e., IVT >400 kg/m/s), where most rainfalls occurred (e.g., Figures 1, 6). By contrast, the wind anomaly dominated the responses in the DBLH run and contributed to over 90% of the anomalous IVTs (Figure 8C). Compared with the previous two terms, the eddy term played a minor role and can be neglected in most regions.
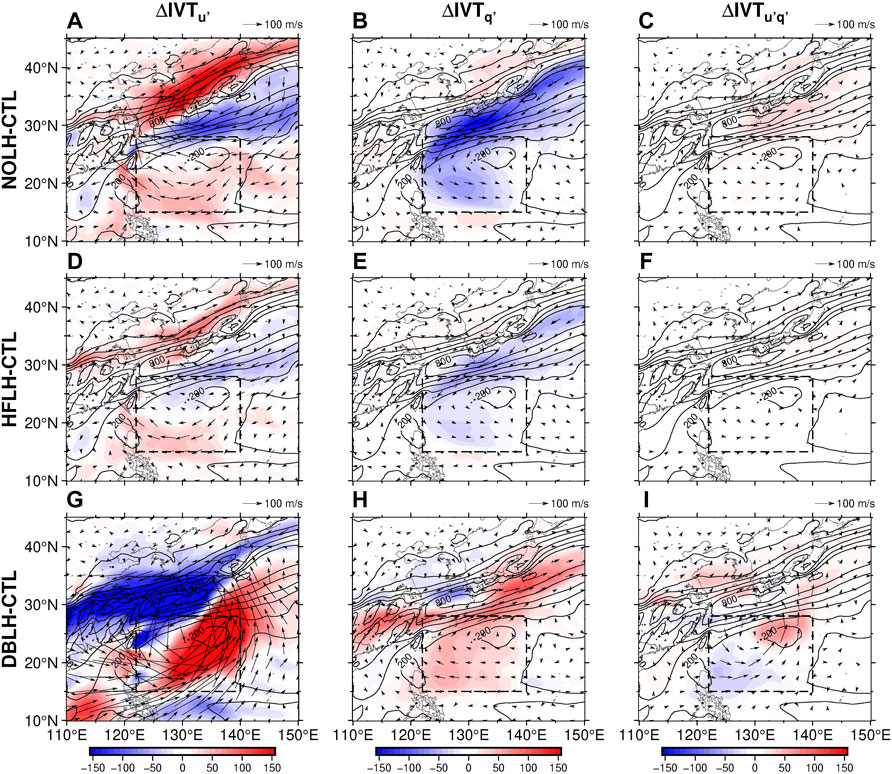
FIGURE 7. Contributions of wind (
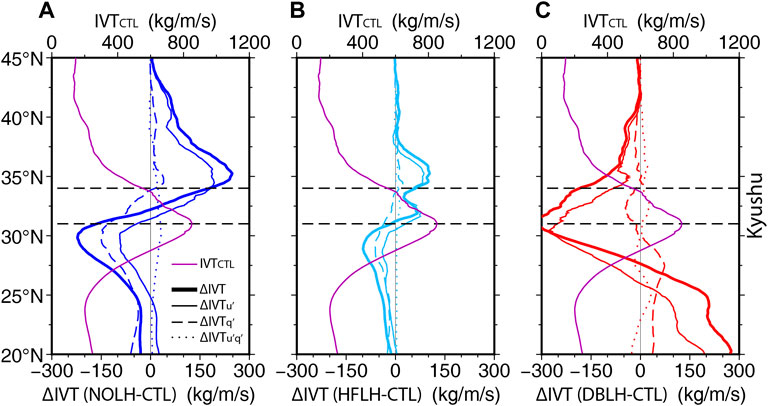
FIGURE 8. Mean differences of moisture transport (
It should be noticed that the linear decomposition presented above only provides “pseudo” contributions of moisture and wind because moisture is neither an independent nor a conserved variable in its nature, which could modulate/be modulated by the wind via diabatic and adiabatic processes. In addition, we also confirmed that anomalous moisture from other regions was nearly neglectable compared to the WP region (see Supplementary Figure S2), except in the DBLH run where the anomalous wind slightly enhanced the latent heat flux over the South China Sea.
In the previous section, we discussed the relative contributions of the anomalous moisture and wind fields to the AR; however, it remains unclear what processes induced such anomalous wind patterns (hence, the WPSH).
As shown in Table 3, the WPSH became stronger in the NOLH and HFLH runs, although the modulations were relatively small. The WPSH was strengthened by about 2.42 gpm in the HFLH run, which only increased to 2.68 gpm even though the surface evaporation was entirely removed. Moreover, both modulations were one order smaller than the WPSH’s own variations during the study period, suggesting that the intensity of the WPSH was not so sensitive to the reduction of the underneath moisture supply, which is consistent with previous findings (e.g., Xie et al., 2016; Guan et al., 2019; Chen et al., 2021). On the other hand, compared to the intensity, the responses of the northern edge to the reduced evaporation were larger and linear, which also correlated well with the northward migration of the AR.
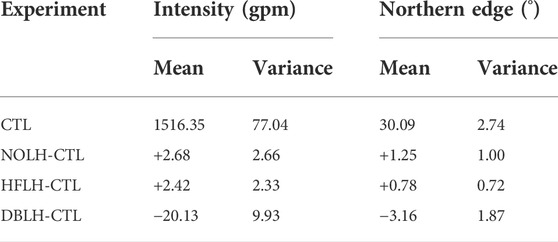
TABLE 3. Indices of the intensity and the northern edge of the WPSH and their anomalies in the sensitivity experiments.
Figure 9 further represents how did the WPSH respond to the modulated evaporation, which shows the vertical and horizontal structures of the anomalous geopotential height and diabatic heating. It is found that positive geopotential height anomalies appeared over the subtropical WP region and the Meiyu-Baiu front around 30°N in the NOLH and HFLH runs, corresponding well with the weakened convective activities in both regions (see the negative diabatic heating anomalies). However, the anomalies south of Japan were generally weak and were limited within the mid-to-lower levels by the dominant WPSH, while the structure was strong and deep near the front. Because of that, the geopotential height anomalies induced two types of anomalous anticyclonic circulations including the shallow and weak one in the south and the deep and strong one over Japan.
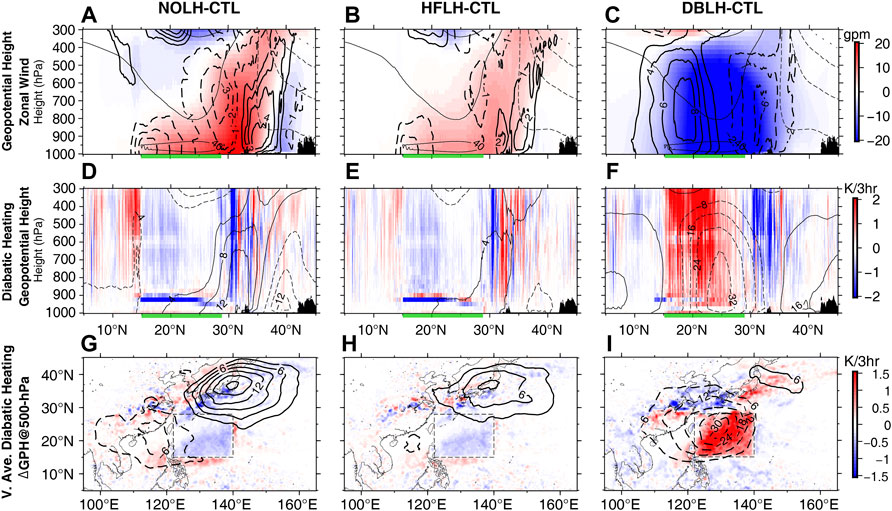
FIGURE 9. Cross-sections along 130°E: (A–C) of the geopotential height (color shading) and zonal wind anomalies (thick contours of every 1 m/s; eastward positive) and (D–F) diabatic heating (color shading) and geopotential height anomalies (contour). (G–I) Horizontal distributions of the vertically averaged diabatic heating (1000- to 300-hPa) and wind anomalies at the 500-hPa level. Geopotential height in the CTL run is also plotted by thin contours with every 40-gpm in (A–C). Contour intervals are doubled in (C,F,I) to avoid overcrowding.
Overall, the above results could be summarized as follows. The reduced evaporation weakened the local convection over the WP region, inducing a weak anticyclonic circulation and the enhanced southwesterly wind toward Japan (e.g., Figure 5). However, because of the reduced moisture supply, convective activities along the Meiyu-Baiu front were weakened (e.g., Figure 9), leading to another strong and deep anticyclonic circulation over Japan and an extended northern edge of the WPSH (e.g., Table 3). As a result, the AR and the related rainband were moved northward corresponding to the modulated wind and moisture fields (e.g., Figure 7). Note that the slight inconsistency between the distribution of the positive geopotential height anomalies and the weakened diabatic heating was likely induced by the strong northeastward advection along the front.
On the other hand, compared to two reduced-flux runs, the WPSH was greatly weakened in the DBLH run with the intensity reduced over 20 gpm, while its northern edge also retreated southward over 3°. Analyses show that such weakening was related to the barotropic-like geopotential height anomaly generated south of Japan (Figures 9C,F,I), which was induced by the enhanced convective activities over the subtropical WP region and finally led to the weakening and the southward retreat of the AR and related rainband (Figures 5, 7). Moreover, although such a large weakening of the WPSH would unlikely occur in the real world, it may help us in projecting the possible future changes since similar responses were found in an extra experiment with a more realistic factor of 125%. In that experiment, the WPSH was weakened by −3.45 gpm, and its northern edge anomalies retreated about −0.61°, while the anomalous circulation patterns were weaker but similar to the DBLH run (see Supplementary Figure S3).
In this study, we investigated the impacts of moisture supply from the subtropical WP on the atmospheric river (AR) and related precipitation over Japan during the Meiyu-Baiu season of 2020. A set of numerical sensitivity experiments were conducted by adjusting the surface latent heat flux (hence, the evaporation). In general, our model well reproduced the atmospheric conditions during the study period from late June to mid-July, including the strong moisture transport (i.e., the AR), large precipitation along the Meiyu-Baiu front, and the dominant WPSH over the subtropical WP. Additionally, our analyses also indicate that the rainfalls over the Japanese archipelago were highly related to the strong moisture transport, suggesting the potential role of the wind in convection initiation over Japan (e.g., Schumacher and Johnson, 2005; Miyajima and Fujibe, 2011).
Based on the experiments, we evaluated the responses of the local atmosphere over the WP region and the AR and precipitation over Japan. We found that the local atmosphere strongly responded to the surface evaporation, while large and significant modulations in the AR and precipitation were also found along the Meiyu-Baiu front. Particularly, the reduced surface evaporation (e.g., the NOLH and HFLH runs) suppressed the local convective activity, which further reduced the moisture content in the whole troposphere. The drier air masses were then transported northward and induced the weakening of the AR and the convective activities along the Meiyu-Baiu front. Meanwhile, the suppressed convection along the front generated an anomalous high-pressure pattern associated with the anticyclonic circulation, which eventually led to the northward migration of the AR and the related rainband. On the other hand, when the surface evaporation over the WP region was enhanced, the WPSH was weakened and retreated southeastward, while the related anomalous cyclonic circulation induced the weakening of the AR and precipitation over western Japan.
Overall, this study confirmed the great contributions of moisture supply from the subtropical WP region to the AR and heavy rainfalls over Japan during the record-breaking Meiyu-Baiu season in 2020. Meanwhile, although larger evaporation from the oceans south of Japan would increase the total rainfalls over the whole region that was influenced by the AR around Japan, it would not have led to more rainfalls over some specific regions, such as the relatively small Kyushu Island. Moreover, these results would enhance our understanding in projecting the future changes of the heavy rainfalls over Japan (e.g., Kamae et al., 2021), and the migration processes revealed in this study may also help the understanding of the self-maintenance of the Meiyu-Baiu front and its meridional movements on a longer time scale (e.g., Moteki and Manda, 2013; Qian et al., 2020). On the other hand, since the current study was performed based on the regional atmospheric model, the potential influences (especially the damping effects, e.g., Hirons et al., 2018) of the air-sea interaction should be carefully examined based on the coupled models in future studies. Moreover, as we mentioned before, the limited regional model could not fully represent the responses of the WPSH due to the pre-determined boundary conditions; therefore, a hemispherical/global model should be considered in future works.
Publicly available datasets were analyzed in this study. The data used in this study were listed as follows: GSMaP (https://sharaku.eorc.jaxa.jp/GSMaP), ERA5 (https://cds.climate.copernicus.eu/), and OISSTv2.1 (https://www.ncei.noaa.gov/products/optimum-interpolation-sst).
NZ: conceptualization, methodology, model and data analyses, writing—original draft, writing—review, editing, and visualization. AM: conceptualization, methodology, writing—review, and editing. XG and BW: methodology, writing—review, and editing. All authors contributed to the article and approved the submitted version.
This work was partially supported by JSPS KAKENHI (JP19H05697) and by the author’ institute (JAMSTEC) as the regular annual budget provided by the MEXT of Japan. This work is also partially supported by JAMSTEC through its sponsorship of research activities at the IPRC (JICore).
The authors are grateful to Qoosaku Moteki and Seiki Ayako (JAMSTEC) for their fruitful comments and discussions. The numerical experiments in this study were carried out on the JAMSTEC Super-Computer System (DA System).
The authors declare that the research was conducted in the absence of any commercial or financial relationships that could be construed as a potential conflict of interest.
All claims expressed in this article are solely those of the authors and do not necessarily represent those of their affiliated organizations, or those of the publisher, the editors and the reviewers. Any product that may be evaluated in this article, or claim that may be made by its manufacturer, is not guaranteed or endorsed by the publisher.
The Supplementary Material for this article can be found online at: https://www.frontiersin.org/articles/10.3389/feart.2022.1043093/full#supplementary-material
Araki, K., Kato, T., Hirockawa, Y., and Mashiko, W. (2021). Characteristics of atmospheric environments of quasi-stationary convective bands in Kyushu, Japan during the july 2020 heavy rainfall event. SOLA 17, 8–15. doi:10.2151/sola.2021-002
Baker, A. J., Sodemann, H., Baldini, J. U. L., Breitenbach, S. F. M., Johnson, K. R., van Hunen, J., et al. (2015). Seasonality of westerly moisture transport in the East Asian summer monsoon and its implications for interpreting precipitation δ18O. J. Geophys. Res. Atmos. 120, 5850–5862. doi:10.1002/2014JD022919
Cai, Y., Chen, Z., and Du, Y. (2022). The role of Indian ocean warming on extreme rainfall in central China during early summer 2020: Without significant el niño influence. Clim. Dyn. 59, 951–960. doi:10.1007/s00382-022-06165-9
Chen, M., Chang, T. H., Lee, C. T., Fang, S.-W., and Yu, J.-Y. (2021). A study of climate model responses of the Western Pacific subtropical high to El Niño diversity. Clim. Dyn. 56, 581–595. doi:10.1007/s00382-020-05500-2
Chen, T. G., and Chang, C. (1980). The structure and vorticity budget of an early summer monsoon trough (Mei-Yu) over southeastern China and Japan. Mon. Weather Rev. 108 (7), 942–953. doi:10.1175/1520-0493(1980)108<0942:tsavbo>2.0.co;2
Chen, X., Dai, A., Wen, Z., and Song, Y. (2021). Contributions of Arctic sea-ice loss and East Siberian atmospheric blocking to 2020 record-breaking Meiyu-Baiu rainfall. Geophys. Res. Lett. 48, e2021GL092748. doi:10.1029/2021GL092748
Ding, Y., and Chan, J. (2005). the East asian summer monsoon: An overview. Meteorol. Atmos. Phys. 89, 117–142. doi:10.1007/s00703-005-0125-z
Guan, W., Hu, H., Ren, X., and Yang, X.-Q. (2019). Subseasonal zonal variability of the Western pacific subtropical high in summer: Climate impacts and underlying mechanisms. Clim. Dyn. 53, 3325–3344. doi:10.1007/s00382-019-04705-4
Guo, L., van der Ent, R. J., Klingaman, N. P., Demory, M., Vidale, P. L., Turner, A. G., et al. (2019). Moisture sources for east Asian precipitation: Mean seasonal cycle and interannual variability. J. Hydrometeorol. 20 (4), 657–672. doi:10.1175/JHM-D-18-0188.1
Guo, X., Zhao, N., Kikuchi, K., Nasuno, T., Nakano, M., and Annamalai, H. (2021). Atmospheric rivers over the indo-pacific and its associations with boreal summer intraseasonal oscillation. J. Clim. 34 (24), 9711–9746. doi:10.1175/JCLI-D-21-0290.1
Henderson, D. S., Otkin, J. A., and Mecikalski, J. R. (2021). Evaluating convective initiation in high-resolution numerical weather prediction models using GOES-16 infrared brightness temperatures. Mon. Weather Rev. 149 (4), 1153–1172. doi:10.1175/MWR-D-20-0272.1
Hersbach, H., Bell, B., Berrisford, P., Hirahara, S., Horányi, A., Muñoz-Sabater, J., et al. (2020). The ERA5 global reanalysis. Q. J. R. Meteorol. Soc. 146, 1999–2049. doi:10.1002/qj.3803
Hirons, L. C., Klingaman, N. P., and Woolnough, S. J. (2018). The impact of air-sea interactions on the representation of tropical precipitation extremes. J. Adv. Model. Earth Syst. 10, 550–559. doi:10.1002/2017MS001252
Hong, S. Y., Noh, Y., and Dudhia, J. (2006). A new vertical diffusion package with an explicit treatment of entrainment processes. Mon. Weather Rev. 134, 2318–2341. doi:10.1175/MWR3199.1
Horinouchi, T., Kosaka, Y., Nakamigawa, H., Nakamura, H., Fujikawa, N., and Takayabu, Y. N. (2021). Moisture supply, jet, and silk-road wave train associated with the prolonged heavy rainfall in Kyushu, Japan in early july 2020. SOLA 17B, 1–8. doi:10.2151/sola.2021-019
Hu, H., and Dominguez, F. (2019). Understanding the role of tropical moisture in atmospheric rivers. JGR. Atmos. 124, 13826–13842. doi:10.1029/2019JD030867
Hu, Y., Deng, Y., Lin, Y., Zhou, Z., Cui, C., and Dong, X. (2021). Dynamics of the spatiotemporal morphology of Meiyu fronts: An initial survey. Clim. Dyn. 56, 2715–2728. doi:10.1007/s00382-020-05619-2
Huang, B., Liu, C., Banzon, V., Freeman, E., Graham, G., Hankins, B., et al. (2020). Improvements of the daily Optimum Interpolation Sea surface temperature (DOISST) version 2.1. J. Clim. 34, 2923–2939. doi:10.1175/JCLI-D-20-0166.1
Huang, Y., Wang, B., Li, X., and Wang, H. (2018). Changes in the influence of the Western Pacific subtropical high on Asian summer monsoon rainfall in the late 1990s. Clim. Dyn. 51, 443–455. doi:10.1007/s00382-017-3933-1
Iacono, M. J., Delamere, J. S., Mlawer, E. J., Shephard, M. W., Clough, S. A., and Collins, W. D. (2008). Radiative forcing by long–lived greenhouse gases: Calculations with the AER radiative transfer models. J. Geophys. Res. 113, D13103. doi:10.1029/2008JD009944
Imada, Y., Kawase, H., Watanabe, M., Arai, M., Shiogama, H., and Takayabu, I. (2020). Advanced risk-based event attribution for heavy regional rainfall events. npj Clim. Atmos. Sci. 3, 37. doi:10.1038/s41612-020-00141-y
Japan Meteorological Agency (JMA) (2020). Characteristics of the heavy rain of July 2020 and related atmospheric circulation. Available at: www.jma.go.jp/jma/press/2007/31a/r02gou.pdf (accessed July 31, 2020).
Jimenez, P. A., Dudhia, J., Gonzalez–Rouco, J. F., Navarro, J., Montavez, J. P., and Garcia-Bustamante, E. (2012). A revised scheme for the WRF surface layer formulation. Mont. Weather Rev. 140, 898–918. doi:10.1175/MWR-D-11-00056.1
Kamae, Y., Imada, Y., Kawase, H., and Mei, W. (2021). Atmospheric rivers bring more frequent and intense extreme rainfall events over East Asia under global warming. Geophys. Res. Lett. 48, e2021GL096030. doi:10.1029/2021GL096030
Kamae, Y., Mei, W., and Xie, S. P. (2017). Climatological relationship between warm season atmospheric rivers and heavy rainfall over East Asia. J. Meteorological Soc. Jpn. 95 (6), 411–431. doi:10.2151/jmsj.2017-027
Kubota, T., Aonashi, K., Ushio, T., Shige, S., Takayabu, Y. N., Kachi, M., et al. (2020). Global satellite mapping of precipitation (GSMaP) products in the GPM era, satellite precipitation measurement. Berlin, Germany: Springer. doi:10.1007/978-3-030-24568-9_20
Lavers, D. A., Ralph, F. M., Richardson, D. S., and Pappenberger, F. (2020). Improved forecasts of atmospheric rivers through systematic reconnaissance, better modelling, and insights on conversion of rain to flooding. Commun. Earth Environ. 1, 39. doi:10.1038/s43247-020-00042-1
Lavers, D. A., Villarini, G., Allan, R. P., Wood, E. F., and Wade, A. J. (2012). The detection of atmospheric rivers in atmospheric reanalyses and their links to British winter floods and the large-scale climatic circulation. J. Geophys. Res. 117, D20106. doi:10.1029/2012JD018027
Liang, J., and Yong, Y. (2021). Climatology of atmospheric rivers in the Asian monsoon region. Int. J. Climatol. 41, E801–E818. doi:10.1002/joc.6729
Liang, P., Hu, Z.-Z., Ding, Y., and Qian, Q. (2021). The extreme mei-yu season in 2020: Role of the madden-julian oscillation and the cooperative influence of the pacific and Indian oceans. Adv. Atmos. Sci. 38, 2040–2054. doi:10.1007/s00376-021-1078-y
Liu, B., Yan, Y., Zhu, C., Ma, S., and Li, J. (2020). Record‐breaking Meiyu rainfall around the Yangtze River in 2020 regulated by the subseasonal phase transition of the North Atlantic Oscillation. Geophys. Res. Lett. 47, e2020GL090342. doi:10.1029/2020GL090342
Liu, X., Ma, X., Chang, P., Jia, Y., Fu, D., Xu, G., et al. (2021). Ocean fronts and eddies force atmospheric rivers and heavy precipitation in Western North America. Nat. Commun. 12, 1268. doi:10.1038/s41467-021-21504-w
Matsumoto, S., Ninomiya, K., and Yoshizumi, S. (1971). Characteristic features of “Baiu&rdquo; front associated with heavy rainfall. J. Meteorological Soc. Jpn. 49 (4), 267–281. doi:10.2151/jmsj1965.49.4_267
Miyajima, J., and Fujibe, F. (2011). Climatology of extreme precipitation in Japan for different time scales. SOLA 7, 157–160. doi:10.2151/sola.2011-040
Moteki, Q., and Manda, A. (2013). Seasonal migration of the baiu frontal zone over the east China sea: Sea surface temperature effect. SOLA 9, 19–22. doi:10.2151/sola.2013-005
Nakamura, T., and Sato, T. (2022). A possible linkage of Eurasian heat wave and East Asian heavy rainfall in Relation to the Rapid Arctic warming. Environ. Res. 209, 112881. doi:10.1016/j.envres.2022.112881
Park, C., Son, S.-W., and Kim, H. (2021). Distinct features of atmospheric rivers in the early versus late east Asian summer monsoon and their impacts on monsoon rainfall. Geophys. Res. Atmos. 126, e2020JD033537. doi:10.1029/2020JD033537
Qian, Q., Liang, P., Qi, L., Ding, Y., and He, J. (2020). Sub-seasonal variability of meridional activity of western pacific subtropical high in boreal late summer. Front. Earth Sci. 8, 597969. doi:10.3389/feart.2020.597969
Qiao, S., Chen, D., Wang, B., Cheung, H.-N., Liu, F., Cheng, J., et al. (2021). The longest 2020 Meiyu season over the past 60 years: Subseasonal perspective and its predictions. Geophys. Res. Lett. 48, e2021GL093596. doi:10.1029/2021GL093596
Ren, X., Yang, X., and Sun, X. (2013). Zonal oscillation of western pacific subtropical high and subseasonal SST variations during Yangtze persistent heavy rainfall events. J. Clim. 26 (22), 8929–8946. doi:10.1175/JCLI-D-12-00861.1
Sampe, T., and Xie, S. (2010). Large-scale dynamics of the meiyu-baiu rainband: Environmental forcing by the westerly jet. J. Clim. 23 (1), 113–134. doi:10.1175/2009JCLI3128.1
Schumacher, R. S., and Johnson, R. H. (2005). Organization and environmental properties of extreme-rain-producing mesoscale convective systems. Mon. Weather Rev. 133, 961–976. doi:10.1175/MWR2899.1
Shi, Y., Jiang, Z., Liu, Z., and Li, L. (2020). A Lagrangian analysis of water vapor sources and pathways for precipitation in east China in different stages of the east asian summer monsoon. J. Clim. 33, 977–992. doi:10.1175/JCLI-D-19-0089.1
Skamarock, W. C., Klemp, J. B., Dudhia, J., Gill, D. O., Barker, D. M., Wang, W., et al. (2008). A description of the advanced research WRF version 3. Tech. Note, TN-475+STR. Colorado, United States: University Corporation for Atmospheric Research, 1–96.
Sodemann, H., Schwierz, C., and Wernli, H. (2008). Interannual variability of Greenland winter precipitation sources: Lagrangian moisture diagnostic and North Atlantic oscillation influence. J. Geophys. Res. 113, D03107. doi:10.1029/2007JD008503
Takahashi, H. G., and Fujinami, H. (2021). Recent decadal enhancement of Meiyu-Baiu heavy rainfall over East Asia. Sci. Rep. 11, 13665. doi:10.1038/s41598-021-93006-0
Takaya, Y., Ishikawa, I., Kobayashi, C., Endo, H., and Ose, T. (2020). Enhanced Meiyu-Baiu rainfall in early summer 2020: Aftermath of the 2019 super IOD event. Geophys. Res. Lett. 47, e2020GL090671. doi:10.1029/2020GL090671
Takemi, T. (2015). Relationship between cumulus activity and environmental moisture during the CINDY2011/DYNAMO field experiment as revealed from convection-resolving simulations. J. Meteorological Soc. Jpn. 93A, 41–58. doi:10.2151/jmsj.2015-035
Takemura, K., Wakamatsu, S., Togawa, H., Shimpo, A., Kobayashi, C., Maeda, S., et al. (2019). Extreme moisture flux convergence over Western Japan during the heavy rain event of July 2018. SOLA 15A, 49–54. doi:10.2151/sola.15A-009
Tang, H., Wang, Z., Tang, B., Ma, Y., Pei, L., Tian, F., et al. (2022). Reduced probability of 2020 june–july persistent heavy Meiyu rainfall event in the middle to lower reaches of the Yangtze River basin under anthropogenic forcing. Bull. Am. Meteorol. Soc. 103 (3), S83–S89. doi:10.1175/BAMS-D-21-0167.1
Tewari, M., Chen, F., Wang, W., Dudhia, J., LeMone, M., Mitchell, K., et al. (2004). Implementation and verification of the unified Noah land surface model in the WRF model, 20th conference on weather analysis and forecasting/16th conference on numerical weather prediction. 11-15 january 2004. Washington: Seattle.
Thompson, G., Field, P. R., Rasmussen, R. M., and Hall, W. D. (2008). Explicit forecasts of winter precipitation using an improved bulk microphysics scheme. Part II: Implementation of a new snow parameterization. Mon. Weather Rev. 136 (12), 5095–5115. doi:10.1175/2008MWR2387.1
Tsuji, H., Takayabu, Y. N., Shibuya, R., Kamahori, H., and Yokoyama, C. (2021). The role of free-tropospheric moisture convergence for summertime heavy rainfall in Western Japan. Geophys. Res. Lett. 48, e2021GL095030. doi:10.1029/2021GL095030
Ueda, H., Yokoi, M., and Kuramochi, M. (2021). Enhanced subtropical anticyclone over the Indo-Pacific Ocean associated with stagnation of the Meiyu-Baiu rainband during summer, 2020. SOLA 17B, 002–018. doi:10.2151/sola.17B-002
Wang, B., Xiang, B., and Lee, J. Y. (2013). Subtropical high predictability establishes a promising way for monsoon and tropical storm predictions. Proc. Natl. Acad. Sci. U. S. A. 110, 2718–2722. doi:10.1073/pnas.1214626110
Xie, S. P., Kosaka, Y., Du, Y., Hu, K., Chowdary, J. S., and Huang, G. (2016). Indo-Western pacific ocean capacitor and coherent climate anomalies in post-ENSO summer: A review. Adv. Atmos. Sci. 33, 411–432. doi:10.1007/s00376-015-5192-6
Yuan, Y., Gao, H., and Ding, T. (2019). The extremely north position of the Western Pacific subtropical high in summer of 2018: Important role of the convective activities in the Western Pacific. Int. J. Climatol. 40, 1361–1374. doi:10.1002/joc.6274
Zhang, C., Wang, Y., and Hamilton, K. (2011). Improved representation of boundary layer clouds over the southeast pacific in ARW-WRF using a modified Tiedtke cumulus parameterization scheme. Mon. Weather Rev. 139 (11), 3489–3513. doi:10.1175/MWR-D-10-05091.1
Zhang, W., Huang, Z., Jiang, F., Stuecker, M. F., Chen, G., and Jin, F.-F. (2021). Exceptionally persistent Madden-Julian Oscillation activity contributes to the extreme 2020 East Asian summer monsoon rainfall. Geophys. Res. Lett. 48, e2020GL091588. doi:10.1029/2020GL091588
Zhao, N., Manda, A., Guo, X., Kikuchi, K., Nasuno, T., Nakano, M., et al. (2021). A Lagrangian view of moisture transport related to the heavy rainfall of July 2020 in Japan: Importance of the moistening over the subtropical regions. Geophys. Res. Lett. 48, e2020GL091441. doi:10.1029/2020GL091441
Zhao, Y., Cheng, J., Feng, G., Zheng, Z., Zhi, R., Zhang, Z., et al. (2022). Dominant role of meridional circulation in regulating the anomalous subsidence of the western pacific subtropical high in early summer. Front. Phys. 10, 713087. doi:10.3389/fphy.2022.713087
Keywords: atmospheric river (AR), Western Pacific, Meiyu-Baiu front, moisture supply, heavy rain, subtropical high
Citation: Zhao N, Manda A, Guo X and Wang B (2022) Impacts of moisture supply from the subtropical western Pacific on the subtropical high and the atmospheric river during the heavy rain of 2020 in Japan. Front. Earth Sci. 10:1043093. doi: 10.3389/feart.2022.1043093
Received: 13 September 2022; Accepted: 31 October 2022;
Published: 10 November 2022.
Edited by:
Izuru Takayabu, Japan Meteorological Agency, JapanReviewed by:
Yukari Naka, Kyoto University, JapanCopyright © 2022 Zhao, Manda, Guo and Wang. This is an open-access article distributed under the terms of the Creative Commons Attribution License (CC BY). The use, distribution or reproduction in other forums is permitted, provided the original author(s) and the copyright owner(s) are credited and that the original publication in this journal is cited, in accordance with accepted academic practice. No use, distribution or reproduction is permitted which does not comply with these terms.
*Correspondence: Ning Zhao, emhhb25pbmdAamFtc3RlYy5nby5qcA==
Disclaimer: All claims expressed in this article are solely those of the authors and do not necessarily represent those of their affiliated organizations, or those of the publisher, the editors and the reviewers. Any product that may be evaluated in this article or claim that may be made by its manufacturer is not guaranteed or endorsed by the publisher.
Research integrity at Frontiers
Learn more about the work of our research integrity team to safeguard the quality of each article we publish.