 Tao Chen1,2
 Jisen Shu
 Gerson. S. V. Tovele
95% of researchers rate our articles as excellent or good
Learn more about the work of our research integrity team to safeguard the quality of each article we publish.
Find out more
ORIGINAL RESEARCH article
Front. Earth Sci. , 13 January 2023
Sec. Geohazards and Georisks
Volume 10 - 2022 | https://doi.org/10.3389/feart.2022.1038499
This article is part of the Research Topic A Multi-Disciplinary Study of Dynamic Triggering: Field Observations, Numerical Simulations, and Laboratory Experiments View all 6 articles
A clear understanding of landslide mechanisms and stability analyses is of great significance for landslide monitoring, prediction, and control. A large-scale end wall landslide occurred and its area reached 47,752 m2 on August 7–20, 2020, in the Manglai open-pit coal mine, China. In this paper, the engineering geological survey, mechanical test, large-deformation finite element numerical method, limit equilibrium method and analytical formula are used to analyze how the groundwater level rise caused this end wall failure and landslide. The engineering geological conditions, hydrogeological conditions, landslide activity signs and physical and mechanical parameter calibration of the sliding mass are investigated in detail and tested. Three-dimensional and two-dimensional numerical models of slopes are established, and an analytical formula calculation method to calculate the factor of safety (FoS) is proposed when sliding cracks are located on the top and toe of a slope. The results indicate that the fault fracture zone, soft strata, continuous heavy rainfall, and groundwater were the main contributors to this landslide. The three-dimensional numerical calculation results are consistent with the deformation and failure process of the slope observed in the field, which shows a retrogressive progressive failure mode. The calculation results of SLOPE/W and the analytical formula are consistent; i.e., when the groundwater level rises to +950, the stability of the end wall reaches the critical stability state. With the passage of time, the creep of the sliding surface accelerates until the entire end wall landslide.
In recent years, with the increasing depth of mining and the rapid construction of highways and railway tunnels worldwide, engineering activities supported by these technical and economic conditions have continuously increased the degree of disturbance to the geological environment (Huang, 2012; Katebi et al., 2019). In addition, under the influence of global climate change and other factors, the frequency of slope landslide disasters has increased (Martinović et al., 2017). Open-pit mining is a frequently used method to develop mineral resources, and the landslide disasters of high and steep slopes caused by mining are directly related to the vitality of mines (Carlà et al., 2018; Vinoth and Ajay Kumar, 2014). For example, the landslide accident at the Shengli East No. 2 open-pit coal mine directly caused the mine to stop production and, ultimately, the company running the mine became insolvent (Fan et al., 2016). We collected information concerning landslide disasters at 20 open-pit coal mines in China disclosed over the last two decades, which involved 137 large-scale landslide accidents (Figure 1). Of these, the landslides at the Shengli open-pit coal mine (Zhang et al., 2010), Fuxin Haizhou open-pit coal mine (He et al., 2011), and the Fushun West open-pit coal mine (Nie et al., 2017) are typical examples of the instability and failure of open-pit coal mine slopes. These examples indicate that rainfall is the most important factor that makes open-pit slopes unstable, followed by soft strata and mining activities.
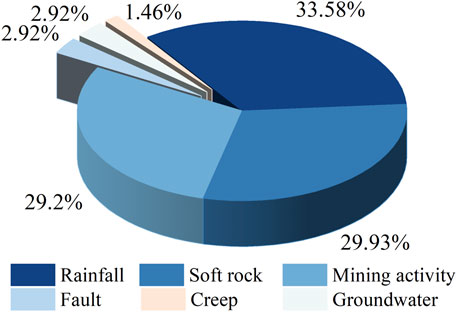
FIGURE 1. Percentage pie chart of landslide failure mechanisms in open-pit coal mines in China.
Different types of landslide deformation failure modes have been studied via field investigations, numerical analyses, monitoring data, and model tests (Locat et al., 2017; Peng et al., 2021; Wu et al., 2021). According to the deformation mechanism and the different failure modes of landslides, landslides can be divided into three types according to the spatial development patterns of their sliding zones (Figure 2). The first type is the gradual penetration of the sliding zone from front to back, referred to as the retrogressive progressive-failure mode (Figure 2A). The second type is the gradual connection of the sliding zone from back to front, referred to as the advancing progressive-failure mode (Figure 2B) (Tremblay-Auger et al., 2022). The third type combines characteristics of the previous two types, and the sliding zone is progressively penetrated from the front and the back to the middle, resulting in a composite progressive-failure mode (Figures 2C,F) (López-Vinielles et al., 2020). The landslide types corresponding to the above three progressive-failure modes are retrogressive landslides, thrust load-caused landslides, and composite landslides, respectively (Tan et al., 2016). Numerous studies have demonstrated that most retrogressive landslides occur in clay-rich strata, especially during periods of rainfall (Jaboyedoff et al., 2009; Locat et al., 2011; Zhang et al., 2018). Examples of retrogressive landslides include the Hongao dump landslide in Shenzhen, China (Yin et al., 2016), the Chaoyang open-pit coal mine in China (Figure 2D), and the Sapa landslide in Vietnam (Tran et al., 2022). In China, thrust load-caused landslides primarily occur in the Three Gorges Reservoir area, the Sichuan Basin (Song et al., 2021a), and the Inner Mongolia open-pit coal mines. For example, the Qingjiang Maoping landslide (Lee et al., 2006), the Xintan landslide (Zhang et al., 2008), and the Shengli East No. 2 open-pit coal mine landslide (Figure 2E) (Fan et al., 2016) were all closely related to loading and rainfall at the back edge of the sliding mass.
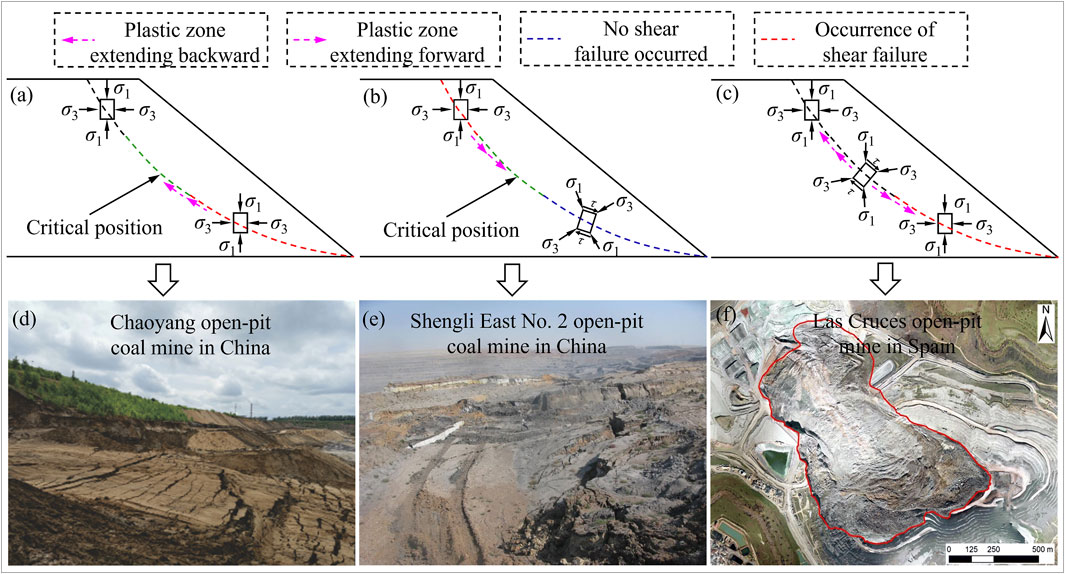
FIGURE 2. Progressive failure process of (A) retrogressive landslide, (B) load-caused landslide and (C) complex landslide. Typical open-pit coal mine landslide: (D) Chaoyang open-pit coal mine, (E) Shengli East No.2 open-pit coal mine in China and (F) Las Cruces open-pit mine in Spain (López-Vinielles et al., 2020).
Landslide phenomena are primarily triggered by the combined action of internal and external factors. Internal factors include the weakening of the nature of the slope itself and the poor geological structure of the slope. External factors include external load factors such as earthquakes, rainfall, and engineering excavations (Zhang J. et al., 2015; Song et al., 2021b). When the slope is in a critical state or in a harsh geological environment, external loads such as engineering excavations or rainfall can easily cause landslides. Of course, sometimes even without obvious external factors, the strength of a slope will gradually weaken in a long process and a long-term instability may occur. Because of the complex causes of landslides and the effects of multiple external factors, the deformation can be complicated (Hungr et al., 2014; Katebi et al., 2019; Reichenbach et al., 2018). For example, retrogressive landslides are often caused by the movement of the reservoir level or by mining activities (Jaboyedoff et al., 2009; Kennedy et al., 2020; Miao et al., 2018; Song et al., 2021c). A single-stage traction landslide caused by snow melting can evolve into a multi-stage rotary landslide (Wang et al., 2020a; Xie et al., 2020). Perennial loading or rainfall infiltration at the back edge of a sliding mass can easily lead to thrust load-caused landslides (Yong et al., 2013; Zhang M. et al., 2015), as well as composite landslides, under the action of coupling factors (Cheng and Luo, 2010; Yang et al., 2012; Shaller et al., 2020). Although these studies add to our knowledge of the landslide mechanism, they only internal and external factors. However, the progressive failure process studies are often performed with soil mass thrust analysis, which has not been shown through the plastic zone failure situation.
The end wall is a high and steep slope that gradually forms during the open-pit mining process with the continuous advancement of the mining depth and the position of the work line (Shang et al., 2001). Therefore, the open-pit end wall is in a dynamic state of development and has typical slope timeliness. Steep end wall mining technology (Cai et al., 2007) and slope timeliness theory (Cai et al., 2008) cause the slope angle of the end wall to become increasingly steeper, and at the same time, a large number of convex end walls are formed. An open-pit coal mine slope is always experiencing mining disturbances. The geological conditions, rainfall, and other influencing factors are numerous, and the landslide mechanisms are complex. Often, multiple sliding events form a composite landslide, which can be difficult to control. More than 80 landslides occurred in the Fuxin Haizhou open-pit coal mine landslide (He et al., 2011), and the comprehensive geological environment management of the mine forms a systematic and intricate project, with many of the topics confronted at the mine being problems worldwide (Du and Song, 2022). The abovementioned studies have illustrated the complexity and difficulty of open-pit coal mine landslides, but the deformation and failure processes remain in empirical judgments and simple mechanical calculations. Therefore, it is a more intuitive and clear method to show the progressive failure process of different types of landslides by numerical analysis.
Given the knowledge gaps and approaches that we can use, this research aims to analyze the failure mechanism and stability of open-pit coal mine landslides. We performed a detailed investigation and test on the engineering geological conditions, hydrogeological conditions, landslide activity signs and physical and mechanical parameter calibration of the sliding mass in the landslide area. The multidimensional numerical simulation calculation and analytical formula were used to analyze the slope models of different groundwater levels. The landslide was analyzed from three angles of landslide causes, mechanism and stability, which provided guidance for landslide treatment and preliminary prediction.
Considering the landslide accident in the Manglai open-pit coal mine, an engineering geological investigation was performed in the landslide area, and the physical and mechanical parameters of the sliding body and sliding zone were obtained by physical and mechanical tests. Then, the multi-dimensional numerical model of the landslide area was constructed, and the analytical formula of the FoS was proposed to analyze the deformation, failure and stability of the landslide area. The logical structure of this study is shown in Figure 3.
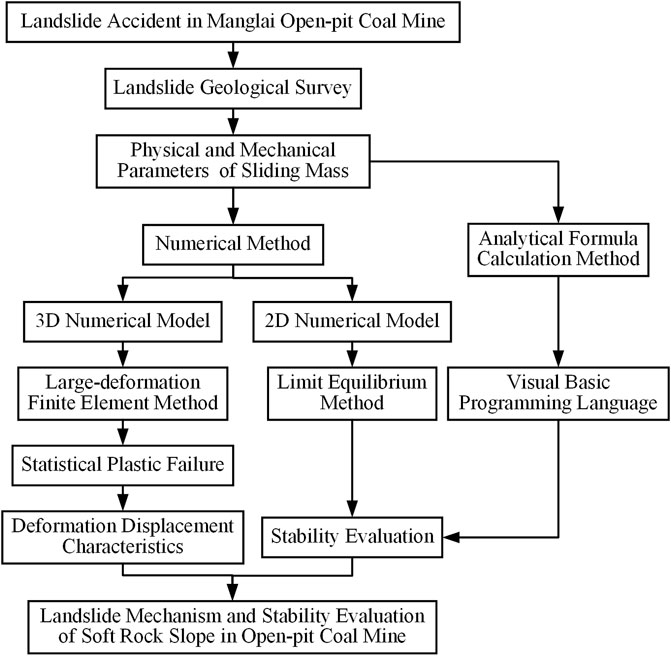
FIGURE 3. Methodology and logic structure diagram.
According to the logical structure diagram in Figure 3, the key methods in this study include engineering geological surveys, physical and mechanical parameter calibrations of the sliding mass, the large-deformation finite element method, the limit equilibrium method and the analytical formula. Five key steps are introduced in detail.
Geological disasters are inevitable, but landslide disasters can reduce the possible impact of landslides on the environment by optimizing the working mode, improving the disaster prevention mechanism, and minimizing the impact of landslides. In this study, the engineering geological exploration stage included surrounding geological condition mapping, topography and landslide activity signs, landslide hydrogeological condition mapping, landslide surveying and testing.
Through surveying and mapping the geological conditions of the landslide area, we investigate various rock structures and the distribution of weak rock strata around the landslide, and clarify the material composition and type of the landslide, the weak interlayer, and the nature, occurrence and development degree of the structure and fault in the area. The investigation contents of topography and geomorphology and landslide activity signs in landslide area are as follows: the relative height of sliding mass, slope gradient, bench position, width and number, landslide boundary shape, the strike, height and slope gradient of the main fault wall at the trailing edge; the shape of the leading edge and characteristics of the free surface; the exposed position of the sliding zone; the size, extension length, distribution position, shape characteristics and visible depth of ground cracks; the time and change of cracks. The history and process of landslide occurrence and development. The surveying and mapping contents of landslide hydrogeological conditions are as follows: the actual development characteristics, runoff conditions, surface water conditions, atmospheric precipitation conditions, groundwater recharge and drainage problems, groundwater depth, type, permeability, dynamic change and spatial distribution in the landslide area and surrounding areas. Exploration and testing of landslide: identifying the thickness, structural characteristics, material composition and spatial distribution characteristics of rock strata.
Since the rock mass in the landslide area belongs to geological soft rock, it has low strength, large porosity, and poor cementation degree, and it is significantly affected by the cutting and weathering of the tectonic plane. The loose, scattered, soft and weak rock strata, which contain many expansive clay minerals, easily become looser and weaker under the immersion of rainwater and groundwater, and the mechanical parameters of this soft rock are difficult to test. However, in these rock mechanics parameters, the cohesion and internal friction angle are important to invert the landslide process. Therefore, the physical and mechanical parameters of the sliding mass are calibrated by field tests and laboratory tests in this study. The cross-plate shear test is performed on the exposed rock surface in the landslide area. Due to the limitation of field conditions, no cross-plate shear test was performed in the fault fracture zone. The standard ring cutter samples of each rock layer are made on site and taken back to the laboratory for the direct shear test by a strain-controlled direct shear apparatus. The elastic modulus of the rock was obtained by an indoor triaxial compression test using a GDS triaxial tester.
FLAC3D is an explicit finite difference program to numerically study the mechanical behavior of a continuous three-dimensional medium when it reaches equilibrium or stable plastic flow. At present, the strength reduction finite element method is commonly used in the stability analysis of small deformation slopes. To simulate and analyze the occurrence and development of large deformation slope failure, the large-deformation finite element method must be introduced (Hibbitt et al., 1970; Mohammadi and Taiebat, 2016; Zhou et al., 2003). The principle of the large-deformation finite element analysis model is based on the basic principle of the Lagrange algorithm and solved by the incremental method, i.e., from time t to time t + ∆t, a known state configuration must be selected as the reference configuration to define the symmetric stress tensor
where
Then, the node position and node displacement at time t and time t+∆ t are, respectively:
where {}<e> refers to the subset of nodal velocity values in the calculation at global node e in FLAC3D.
The above equations are the basic equations of the large-deformation finite element method. The influence of the rising height of the groundwater level on landslides is inversed by the large deformation finite method, and the deformation and failure process of landslides in the Manglai open-pit coal mine are revealed.
The limit equilibrium method is the earliest proposed and most widely used method. Professor Fredlund, a famous Canadian geotechnical engineering scholar, summarized various methods (Fredlund, 1981). In 1981, he first proposed the concept of general limit equilibrium (GLE), and noted that other limit equilibrium methods could be considered special cases or simplifications of GLE. These two static principles of GLE are as follows: 1) the sum of all forces around a point is 0; 2) the sum of all forces in both orthogonal directions is 0. These two statics principles plus a supplementary principle or a supplementary hypothesis for certain forces. For example, Morgenstern-Price method and Spencer method are used as supplementary principles to make assumptions on inter-bar forces. The Janbu method uses the moment balance of each slice to calculate the shear force between strips, which is also a supplementary principle. In theory, the stability of soft rock slopes can become a static problem and the FoS can be solved.
Considering the arbitrary slope in Figure 4, the sliding surface is also arbitrary. If a slice is taken from the sliding mass, the force on the slice, i.e., normal force Ei, Ei +1, shear force Ti, Ti +1 on the vertical surface of the slice, normal force Ni and shear force Si at the bottom of the slice.
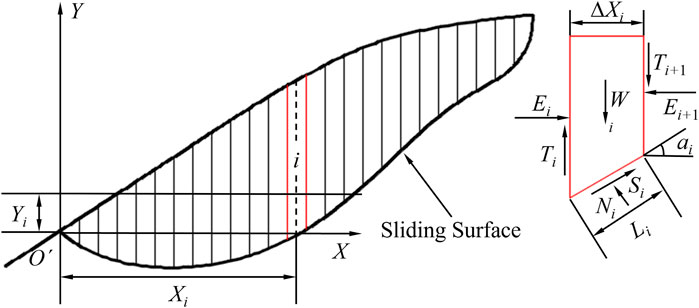
FIGURE 4. Schematic map of a general slope.
Moment balance method: The moment is calculated by O’ of all load pairs that act on the sliding mass, and the sum of the moments should be 0, so the factor of safety expression Fm of the GLE under torque balance is:
where ci is the cohesion of the sliding surface,
Static balance method: The sum of projections of all forces along the horizontal direction is equal to 0, so the factor of safety expression Ff of the force balance condition can be deduced as follows:
Equations 4, 5 are general expressions of the FoS derived from moment equilibrium conditions and static equilibrium conditions. They are widely used in geotechnical, mining and other projects mainly because long-term engineering practice has proven that the limit equilibrium method is effective and relatively reliable for soft rock slope stability analysis.
Because there are often aquifers in the rock and soil mass of an open-pit slope, groundwater activity can occur frequently. Therefore, the influence of the water pressure field needs to be considered when calculating the slope stability. (Tang et al., 2020). proposed an analytical formula for convex slopes but did not consider the influence of the groundwater, and the application of their formula to an open-pit slope is restricted. According to the topography of the slope surface, a slope with a shallow upper part and a steep lower part (Figure 5) is often called a convex slope. The position of the convex point (e.g., point A in Figure 5) not only determines the topography but also affects the sliding surface. Normally, tension cracks on the sliding surface appear on the trailing edge of a slope. However, for a convex slope, the tension cracks on the sliding surface may appear on the slope surface, which diverges from traditional slope stability analyses. Therefore, when analyzing the stability of a convex slope, the two cases where the tension cracks on the sliding surface under the water line are located on the slope top and on the slope surface need to be discussed separately.
1) Circular sliding of the crack on the slope top
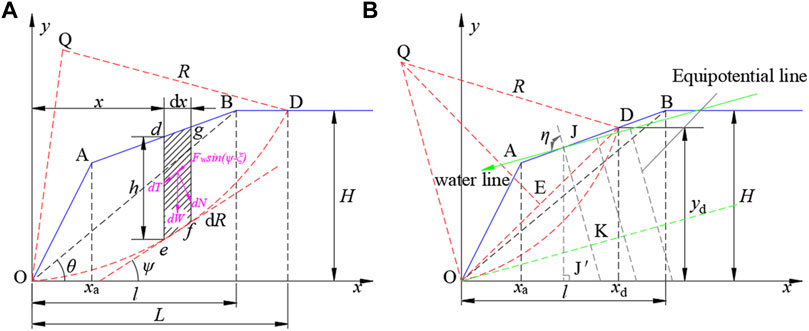
FIGURE 5. Mechanical model for the slope stability analysis of the groundwater level: (A) circular sliding of the crack on the slope top and (B) circular sliding of the crack on the slope surface.
According to previous studies (Jiang and Kang, 2008), when the internal friction angle of a homogeneous soil slope is φ > 16.7°, the minimum factor of safety (FoS) difference between the critical slip circle through the slope toe and the slope surface is less than 2%. We can use the sliding slope to draw a free body diagram and perform a force analysis, as shown in Figure 5. In the figure, H is the slope height (m); θ is the slope angle (°); R is the radius of the critical slip circle (m); O is the origin of the coordinates (m); L and l are the distances of the points of B and D to the y-axis, respectively (m); h and dx are the height and the width of an infinitesimal slice (defg), respectively (m); dW, dT, dN, and dR are the gravity, sliding force, vertical force, and sliding resistance of the infinitesimal slice (defg), respectively (N); Fw is the seepage force (N); η is the angle between the water line and the slope surface normal (°); ψ is the angle between the tangent of the critical slip circle at the point e and the x-axis (°); xa is the x-position at the point A (m); and ya is y-position at the point A (m). In addition, γ and γw are the unit weight of the soil and the water density, respectively (N m−3); V is the volume of the soil mass in the slope affected by the seepage (m3); φ is the internal friction angle of the soil (°); C is the cohesion of the soil (N m−2); and Q is the rotation center of the sliding arc with coordinates of (xQ, yQ). The coordinate of the convex point A is (xa, ya) (xa > 0, xa tanβ ≤ ya ≤ H). The coordinate of point B at the slope top is (l, H). The coordinate of point D for the crack on the sliding surface is (L, H).
According to Figure 5A, the geometric relationships are
The infinitesimal slice defg has a width of dx and a height of h. h can be computed using Eq. 7.
J and K are the points on the same equipotential line; therefore,
The direction of the seepage force is consistent with the flow of the groundwater. The FoS under the water line infiltration is the ratio of the moment of all the sliding resistances (Mr1) to the moment of all the sliding forces (Ms1).
Here, ξ is the angle between the water line and the horizontal plane (°) and Ir1, Ic1, and Is1 are defined constants. Their calculation process is shown in Supplementary Appendix S1A.
2) Circular sliding of the crack on the slope surface
When
Here, Ir2, Ic2, and Is2 are defined constants. Their calculation process is shown in Supplementary Appendix S1B.
1) Engineering geological conditions
The Manglai open-pit coal mine is located in the northern part of the Inner Mongolia Plateau, as shown in Figure 6A–C. Its northern side consists of a low mountain and hilly area, and its southern side consists of a Neogene terrace high plain. The terrain in the mining area is high in the northeast and low in the southwest, with an average altitude of 966–935 m and a relative elevation difference of 31 m. Through the geological survey of the landslide area, a landslide plane map is drawn, as shown in Figure 6D.
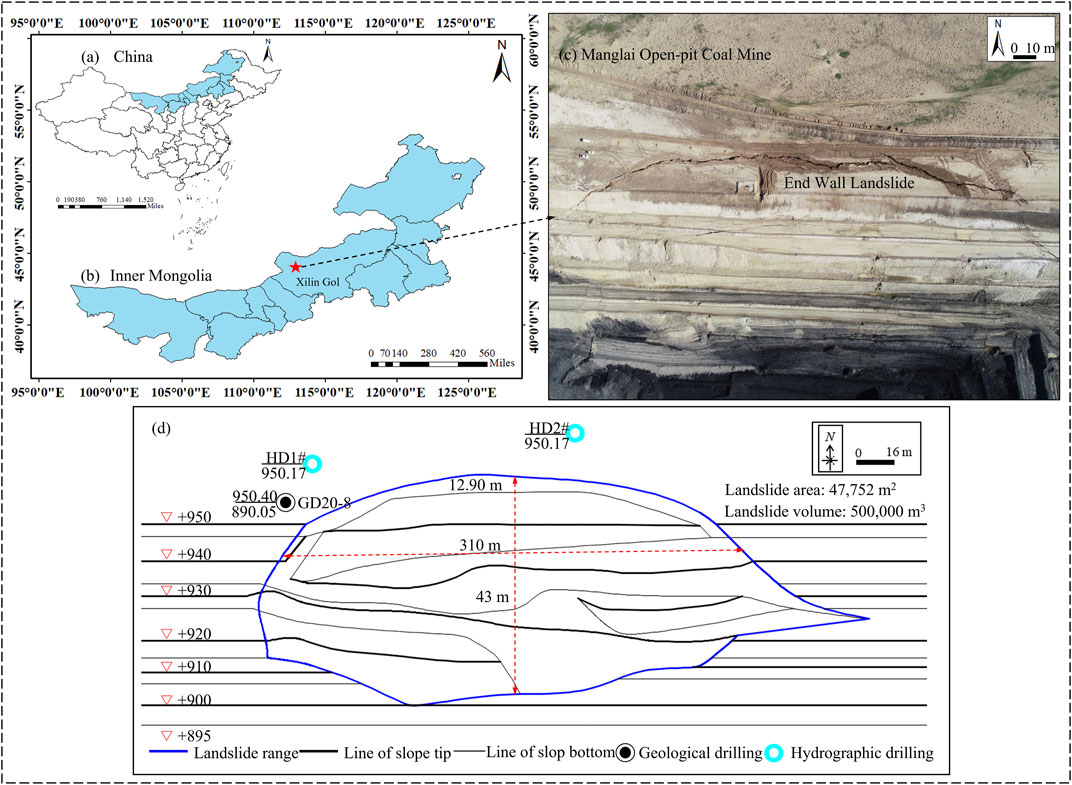
FIGURE 6. Location of the Manglai open-pit coal mine end wall landslide in (A) China, (B) Inner Mongolia Province, (C) the landslide area, and (D) diagram of the landslide area and drilling arrangement.
According to the core extracted from geological exploration drilling GD20-8 (Figure 6D), the strata in the landslide area are divided into Quaternary topsoil according to lithology and Neogene mudstone formation, sandstone formation and coal seam formation. In addition to argillaceous components, mudstone, caesious mudstone and charcoal mudstone contain a small number of silty components. The main component of mud contains many clay minerals. The sandstone composition is quartz, feldspar and argillaceous, and the development maturity is not high. Coal seam fractures are developed and contain thin green mudstone. The specific lithology description is shown in Supplementary Appendix S1C. Controlled by the sedimentary environment, Neogene sandstone and mudstone strata are exposed to long-term weathering, the weathering zone depth is generally approximately 10 m, argillaceous cemented sandstone is loose, and the weathering zone within the overall rock stability is poor.
The end wall strata have a monoclinic structure inclined to the southwest with a tendency of 203° and a dip angle of 8°–10°. There is a normal fault with a southeast strike in the coal seam at the north end wall with a dip angle of 60°. The fault runs through the entire line along the north–south direction of the mining area, and the fracture zone of the fault is developed, which provides convenient conditions for rainfall infiltration.
2) Hydrogeological conditions
The topography of the mining area is undulating, and there is no surface water system. However, small gullies have developed, although there is usually no water in the valley area. Temporary surface flows only occur during the snowmelt and rainy seasons.
Cumulative rainfall in the region for 2020 is counted. The annual rainfall in the mining area is 389.8 mm, and the cumulative rainfall in July and August is 168.6 mm and 75.8 mm, respectively. The rainfall in these 2 months is significantly higher than that in other months. From July 24 to 29, the cumulative rainfall was 25.1–47.8 mm. The cumulative rainfall on August 7–8 was 25.1–49.0 mm. The cumulative rainfall on August 12–13 was 30.0–40.0 mm. The cumulative rainfall in mid-August was 25.1–49.7 mm.
In 2019, hydrogeological drilling exploration of HD1# and HD2# was performed on the end wall of the landslide area (Figure 6D). In order to accurately determine the depth of groundwater level and the distribution of aquifers, the location of hydrological drillings is arranged near the landslide area. The results of the pumping test of each borehole are shown in Figure 7. The thickness of the pore-confined aquifer of Neogene clastic rock is 0–49.50 m with an average of 10.04 m. The aquifer lithology is sandstone, argillaceous cementation, loose structure, and uneven thickness. The aquifer is generally thin from the middle and gradually thickens in the northeast and southwest directions. According to the hydrogeological drilling HD1# and HD2# results, the aquifer water level depth is 8.07–18.02 m, the groundwater level elevation is 931.21–941.02 m, the unit water inflow is 0.00164–0.01723 L/s·m, the permeability coefficient is 0.0420–0.0536 m/d, and it is a weakly water-rich aquifer.
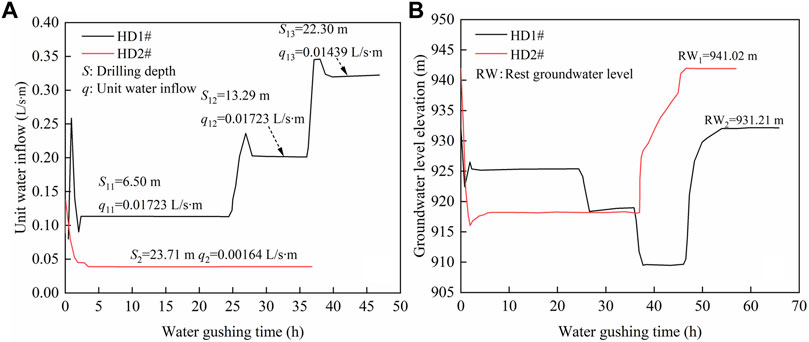
FIGURE 7. Curves of (A) unit water inflow and (B) groundwater level change in the landslide area.
Considering the topography, geomorphology, climate and other factors in this area, the water filling factors in the mining area are mainly rainfall and groundwater recharge. Rainfall is the direct water filling source in open pits. Rainfall is concentrated in July and August, which accounts for approximately 60–70% of the annual rainfall and easily forms centralized recharge. Second, through the pores of the surface cover layer and bedrock, weathering cracks penetrate into the lower directly water-filled Neogene clastic rock pore confined aquifer and subsequently through the slope into the open-pit mining field. During mining, the pore confined aquifer of Neogene clastic rocks is directly filled with water through pores and fissures. Its primary pores, fissures and open-pit stripping change the original stress state of the stratum during the construction of the stope. Because local stress unloading easily produces local stress concentrations, many secondary fissures are formed, and the original pores and fissures expand.
1) Basic information
From 2019 to 2020, three landslide accidents occurred on the end wall. In August 2019, a landslide occurred on the end wall as a result of rainfall. In August 2020, rainfall caused a landslide in the central and eastern part of the end wall (Figure 8A). In November 2020, a landslide occurred during the process of remolding the bench shape because of the coal resources at the lower part of the landslide (Figure 8B). In March 2021, cracks and signs of potential slippage at the end wall indicated deformation problems in two benches: +950 and +940 (Figures 8C,D). Four landslides occurred at the same location. Of these, the landslide that occurred in August 2020 was the largest and caused serious economic losses. The basic conditions of this landslide were as follows.
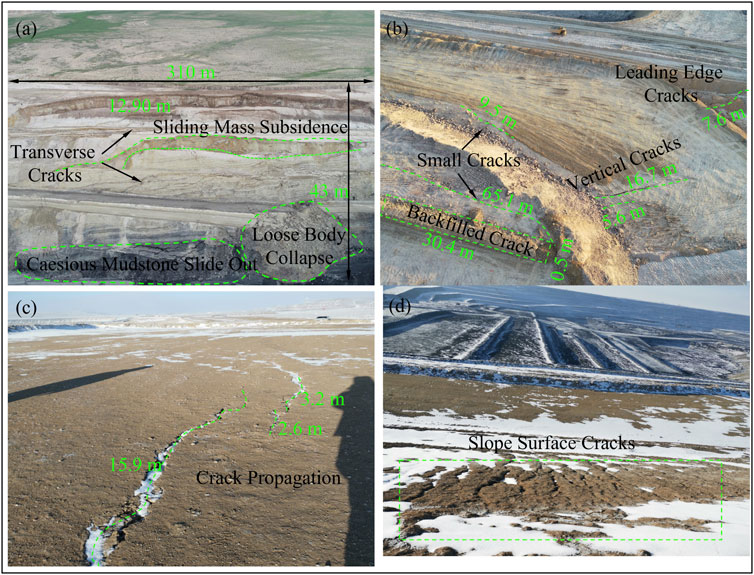
FIGURE 8. Time sequence of the landslide: (A) August 2020, (B) November 2020, and (C,D) March 2021.
The landslide area was in the middle and eastern area of the end wall of the stope, and the east boundary was 320 m from the surface boundary of the working ledge. The average length of the east–west landslide area was 310 m, its width in the north–south direction was 150 m, the subsidence height was 43 m, the landslide area was 47,752 m2, and the volume of the landslide was approximately 500,000 m3. The three flats of +940 through +920 cracked and collapsed in multiple locations, and four benches deformed and collapsed, resulting in the +940 and +920 haulage platforms at the end wall being broken. The end wall was the final slope. The landslide area was constructed in 2019 and consisted of four stripped benches. The height of a single bench was 10 m, and the slope angle was 45°. The +940 and +920 benches were haulage platforms with a width of 22 m and an actual slope angle of 21°.
2) Landslide process
On 7 August 2020, a 73-m-long crack appeared on the surface of the end wall with a width of approximately 0.02 m. At that time, the mining enterprise adopted a series of prevention and control measures, including stopping coal mining at the bottom of the pit, stopping the transportation of haulage platform vehicles, filling and blocking the cracks, and strengthening monitoring of the end wall. The end wall did not change significantly. Starting on August 12, the surface cracks on the end wall became wider and longer and subsidence appeared on the ground. The settlement reached 1.3 m on August 13, and cracks and deformation appeared on the lower end walls of the +910 and +900 benches. The daily surface settlement reached 4.5 m, 2.9 m, and 1.9 m on August 14, 15, and 16, respectively, and the settlement rate gradually decreased. The benches deformed, fractured, and collapsed to varying degrees, and cracks appeared in each bench. The surface subsided 0.8 m on August 17, and no obvious subsidence occurred on August 18–20. However, the end wall still experienced small creep deformation and sliding, and the surface settlement was 12.90 m.
The cross-plate shear test was performed on the exposed rock surface in the landslide area, and the field sampling was taken back to the laboratory for the direct shear test and indoor triaxial compression test to obtain the physical and mechanical parameters of rock strata in the landslide area, as shown in Table 1.
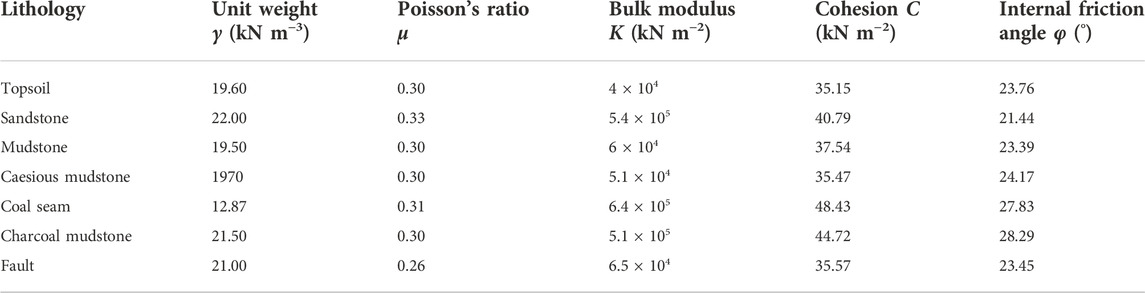
TABLE 1. Geomechanical properties.
Table 1 shows that the rock mechanics parameters of the landslide area are relatively small and have very similar mechanical properties. There are three main reasons. First, the strata in the landslide area belong to loose Quaternary and Neogene sediments. In addition to argillaceous components, mudstone, caesious mudstone and charcoal mudstone contain few silty components. The sandstone is composed of quartz, feldspar and a small amount of argillaceous, with high roundness and low development maturity. Sandstone has large intergranular voids, low clay mineral content, poor cementation, mainly argillaceous cementation, and it easily collapses in water, which is the root cause of its poor mechanical properties. The coal seam has a wood structure, and its texture is relatively disordered. It contains a thin layer of green mudstone interlayer, which can be crushed by hand. Second, from late July to mid-August, rainfall is frequent in the mining area. After the rock stratum in the landslide area is infiltrated by rainwater and groundwater, the mudstone and sandstone are loose, and the water content is large. Finally, the end wall in the landslide area belongs to the final slope of mining, and the slope rock exposure time is long. Under the weathering of rainfall, freezing and thawing cycles, mudstone and sandstone are mechanically broken, which results in loose accumulation of rock in the landslide area. In short, the Quaternary and Neogene strata in the landslide area are mixed in composition, and the mud and sand are interbedded with each other. The cementation is poor, the stress or water easily becomes loose, and the stability is extremely poor, which results in the similarity of rock mechanical properties.
The rising groundwater level caused by continuous rainfall was clearly the main trigger for this landslide. Because of the instability and failure of soft rock slopes, considerable displacement or deformation can occur, and the element strain may reach 10% or even more than 20%. Accordingly, FLAC3D was used to perform a large-deformation finite element numerical simulation study on the failure mechanism of the end wall landslide caused by the groundwater level rise.
Based on the actual geological conditions of the northern end wall, a three-dimensional geological model of the landslide area was established, as shown in Figure 9A. The size of the model was 332 m × 310 m, with a total of 291,298 elements and 282,296 nodes. The lower part of the model had a fixed boundary condition, the left and right sides were horizontally restricted, and the upper part formed its own boundary surface. The elastoplastic model was used to balance the initial stress, and the northern end wall was numerically calculated based on the Mohr–Coulomb failure criterion. The failure envelope for this model corresponds to a Mohr–Coulomb criterion (shear yield function) with a tension cutoff (tension yield function). The position of a stress point on this envelope is controlled by a non-associated flow rule for the shear failure and an associated rule for the tension failure. To calculate the convergence criterion, the unbalanced force ratio was required to be less than 10–5.
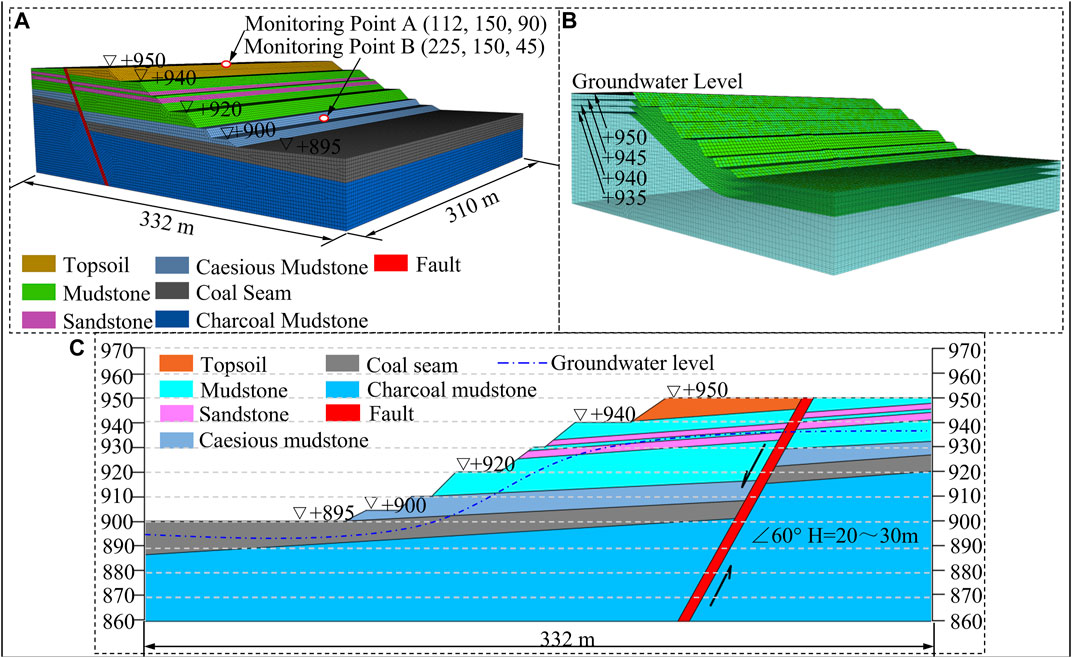
FIGURE 9. (A) three-dimensional finite element mesh, (B) groundwater level setup and (C) two-dimensional numerical model.
The groundwater level affects the slope stability by influencing the pore water pressure and changing the seepage force (Tu et al., 2009). Accordingly, FLAC3D can simulate groundwater activities that cause landslides by directly setting multiple diving surfaces, so it affects the pore water pressure of a slope, which avoids the complexity of seepage simulation analyses. Because of the lack of hydrological monitoring data before and after the landslide, the groundwater level was simulated by setting the position of the groundwater level, as shown in Figure 9B. According to the test results of hydrogeological drilling HD1# and HD2#, multiple simulations were performed to set the groundwater level at different altitudes (+950, +945, +940 and +935). The physical and mechanical parameters in the numerical calculation are shown in Table 1.
The FoS is the most intuitive parameter reflecting slope stability. Therefore, based on the principle of the limit equilibrium method, the SLOPE/W software is used to calculate the FoS under different groundwater levels. Based on drilling data, a two-dimensional slope numerical model is established, as shown in Figure 9C. The size of the model is 332 m×90 m. The bottom boundary and left and right sides of the model are fixed, and the Mohr–Coulomb failure criterion is used for numerical calculation. The groundwater level setting is consistent with the three-dimensional numerical calculation. The physical and mechanical parameters in the numerical calculation are shown in Table 1.
In this study, we used the Visual Basic programming language to implement the calculation process. The sliding surface for the landslide that occurred was determined via an engineering geological investigation. However, many potential landslides have not yet formed a penetrating sliding surface; therefore, it is necessary to find the critical circle sliding surface in theory, that is, to find the sliding surface with the smallest FoS from a series of possible sliding surfaces (Qi et al., 2013). Based on the premise of a circular arc sliding surface, an iterative method was used to determine the minimum FoS and the critical circular sliding surface (Tang et al., 2020), as shown in Figure 10. First, we set the initial value of L to l, such that yQ is traversed with a certain step length dy within the value range. Because L and yQ are determined, xQ can be determined via the geometric relationship in Figure 5 and the FoS can be calculated. Trial calculations are then conducted point by point, and the minimum value is taken to be the stability coefficient under the condition of L = l. Then, we increase the value of L by a certain step length dL to find the FoS of each step; the minimum value is the minimum FoS, Fsm. The coordinates of the circle center (xsm, ysm) corresponding to Fsm are the coordinates of the critical circle center; then, the critical circle sliding surface can be determined.
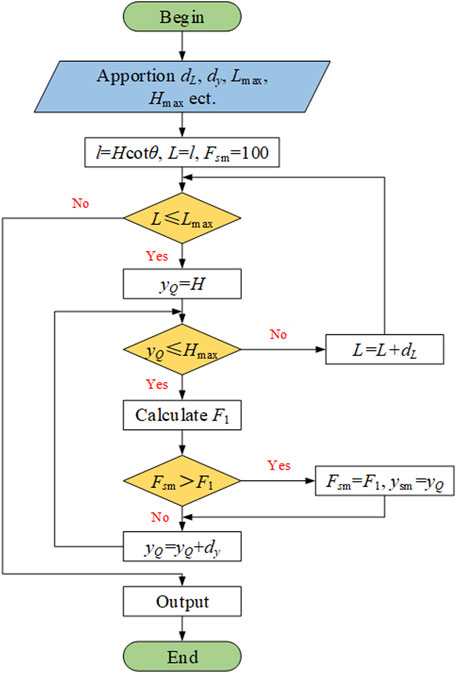
FIGURE 10. Flow chart for the search for the critical circle center.
In order to verify the rationality of the analytical formula, the FoS of different groundwater levels are calculated by the analytical formula, and compared with the calculation results of SLOPE/W.
In landslide research, the formation mechanism of a landslide is key. A clear understanding of the progressive-failure process of landslides is therefore beneficial to their prevention and treatment. According to the in-depth field survey of the landslide, the cause and mechanism of the landslide accident can be summarized.
1) Influence of the fault fracture zone on the end-wall stability
The landslide area is within the influence range of the fault fracture zone. The western boundary of the sliding mass and its occurrence are similar to the occurrence of the fault. After stripping exposes the fault, the marginal surface of the end wall provides conditions for the stratum to slide along the fault interface. The landslide area was a downhill stratum with a dip angle of 8°–9°. The soil mass strength of the end wall was low, and it easily weathered and broke after exposure, further softening when exposed to water (Ehteshami-Moinabadi, 2022). The soil mass in the fault fracture zone was seriously broken, and its looseness provided conditions for rainfall infiltration, which was one of the main reasons for the occurrence of this landslide.
2) Control effect of the soft stratum on the landslide
There were four mudstone terranes in the overlying strata in the coal seam of the Manglai open-pit coal mine with a thickness of 2.25–15.04 m. The terrane had a large water content, low strength, and was an aquiclude, with its lower part being a confined water aquifer. Because of the rapid rise of the groundwater line caused by rainfall seepage and the long-term infiltration of groundwater, this terrane developed into a plastic weak zone. It formed a yield region where the upper load of the soft stratum generated pressure that exceeded the ultimate bearing capacity of the soil, causing the local soil to irrecoverably deform. This region formed in the lower part of the slip body and gradually moved to the back edge of the slip body during the progressive-failure process. As time went by, the sliding surface inside the mudstone accelerated and crept until the end wall slid as a whole.
3) Mechanism of rainfall and groundwater seepage in the end wall
Rainfall raised the groundwater level of the end wall, which changed the pore water pressure (Figure 11). With the increase in the groundwater level, the pore water pressure inside the end wall increased continuously. When the groundwater level was +950, the maximum pore water pressure reached 880 kPa (Figure 11D). The permeability characteristics of the end-wall strata determine the seepage effect and the pore water pressure (Tu et al., 2009). The permeability coefficients of the end-wall strata from top to bottom were 6.23 × 10⁻⁶ m s−1 for the topsoil, 2.17 × 10⁻⁹ m s−1 for the mudstone, 1.79 × 10⁻⁷ m s−1 for the sandstone, and 2.39 × 10⁻⁶ m s−1 for the coal. The permeability coefficient of the topsoil was the largest, which provided the conditions for rainfall infiltration. The permeability coefficient of the mudstone is small, and it had a very low permeability degree, causing the rainwater to be blocked in the mudstone and the topsoil, resulting in an elevation of the static groundwater level in the end wall. The sandstone and coal have a medium permeability, which provided a good channel for the groundwater activity, forming a better aquifer and causing the mudstone to always be subjected to water infiltration. In the process of raising the static groundwater level in the end wall, the pore water pressure increased, reducing the suction of the soil matrix and resulting in a decrease in the soil shear strength (Andrewwinner and Chandrasekaran, 2021). The Mohr circle for the stress of the soil became smaller, and the shear strength decreased. The pore water pressure caused the stress state of the points on the sliding surface of the end wall to gradually change from a stable state to a critical stable state (Fan et al., 2017; Tran et al., 2021).
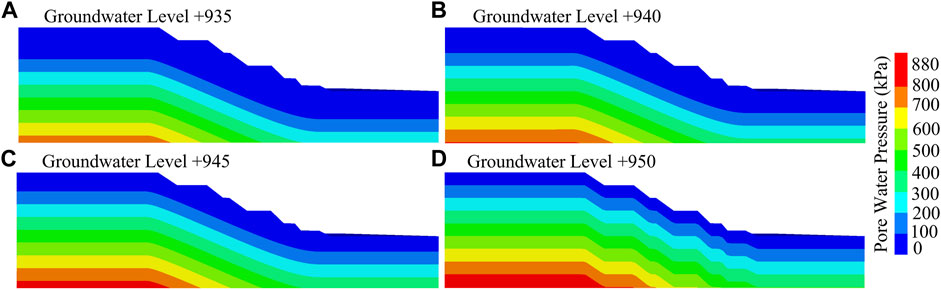
FIGURE 11. Cloud map of the pore water pressure for different groundwater levels: (A) +935, (B) +940, (C) +945, and (D) +950.
The essence of the progressive failure of a landslide is the process of weakening the mechanical parameters of the sliding zone (Zou et al., 2012). The progressive-failure process is manifested in two main aspects. Spatially, the sliding zone parameters gradually weaken and there is variability in the mechanical parameters of the sliding zone in different locations. Temporally, the mechanical parameters of the sliding zone show different rates of weakening with the gradual evolution and development of the landslide.
1) Development process of the plastic zone
The progressive-failure form is determined by analyzing the distribution of the plastic zone in the rock mass of the end wall. The numerical calculations capture the expansion of the plastic zone caused by the deterioration of the mechanical parameters of the soil mass when the groundwater levels were +945 and +950, as shown in Figure 12. Unit body failure under the Mohr–Coulomb strength criterion in FLAC3D is divided into four types: shear failure, tension failure, current state, and occurrence of a previous state. Shear-now and Shear-past are the shear failure plastic zones in the final equilibrium state and the nonequilibrium state, respectively, where Shear-now represents the unit body of the failure envelope that appears in the Mohr–Coulomb failure criterion. Tension-now and Tension-past are tensile yield plastic failure zones under the ultimate equilibrium state and unbalanced state, respectively.
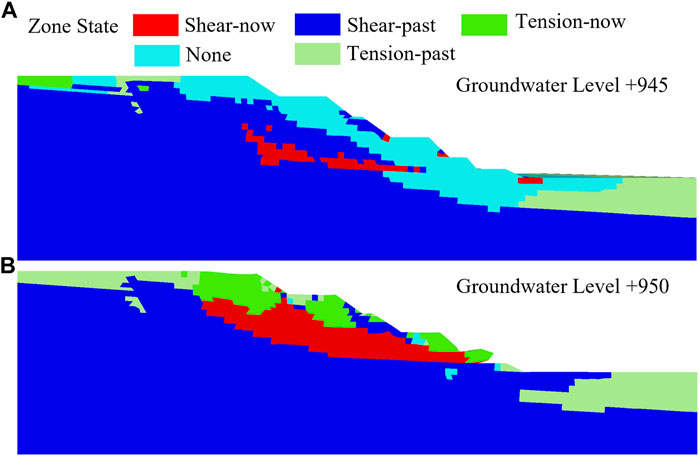
FIGURE 12. Progressive-failure process of the end wall plastic zone development: (A) +945 and (B) +950.
As shown in Figure 12A, when the groundwater level is +945, there is no plastic zone failure on the slope surface. There are few Shear-now units in the slope rock mass, but the entire shear failure plastic zone is not penetrated. However, tensile yielding plastic failure occurs at the top of the slope in the topsoil, which is consistent with the end wall failure observed on August 7–12. From August 7 to 8, the cumulative rainfall in the mining area reached 25.1–49.0 mm. Rainwater infiltrated the rock mass of the slope along the topsoil, which elevated the groundwater level and made the slope produce a 73-m-long and 0.02-m-wide tensile crack. Between August 8 and 12, there was no rainfall in the mining area, and the slope was in a stable development state, but the slope did not significantly change as a whole.
As shown in Figure 12B, when the groundwater level is +950, the plastic failure zone of the end wall first began to develop in the lower mudstone stratum. From the initial small amount of shear failure at the slope toe, it gradually developed upward into a large area of failure dominated by shear failure and tension failure. A tension failure area also appeared on the free surface of the end wall. Finally, the failure area of the plastic zone gradually extended to the slope top. The end-wall soil mass under the plastic failure area formed a circular sliding surface, and the sliding mass of the end wall slipped out of the +910 bench caesious mudstone. This is consistent with the destruction of the end wall at the site from August 12 to 17. From August 12 to 13, the rainfall in the mining area reached 30.0–40.0 mm. Rainwater infiltration continued to raise the groundwater level, so cracks on the surface of the end wall and settlement of the ground widened and lengthened. The crack deformation on August 13 was +910 and +900 benches on the bottom wall (Figure 8A). From August 14 to 17, the bench exhibited varying degrees of deformation, fracture, and collapse, and each bench exhibited cracks. The three-dimensional numerical simulation results show that the development process of the plastic failure zone is consistent with the observed deformation and failure process of the slope in the field.
2) Failure statistics of unit in plastic zone
Calculation results for the end wall under different water lines were compiled to perform unit failure status statistics to analyze the changes in the unit volume under the four failure statuses (shear-now, tension-now, shear-past, and tension-past) in the process of soil mass parameter degradation caused by the groundwater rise. It can be seen from Figure 13A that the shear failure had an increasing trend as the groundwater level rose and reached its maximum when the groundwater level was +950. The shear failure and tension failure in the past state were always larger than those in the current state (Figure 13B). When the groundwater level was less than +940, the end-wall failure was primarily shear failure and the tension failure area was nearly zero. When the groundwater level was greater than +940, the growth rate of the shear failure prior to equilibrium remained unchanged while the rate of change of the tension failure increased; the growth trends of the shear and tension failures in equilibrium were roughly the same. This shows that a groundwater level of +940 is the demarcation point at which the progressive-failure mode transforms a load-caused landslide to a retrogressive landslide.
3) End wall deformation condition
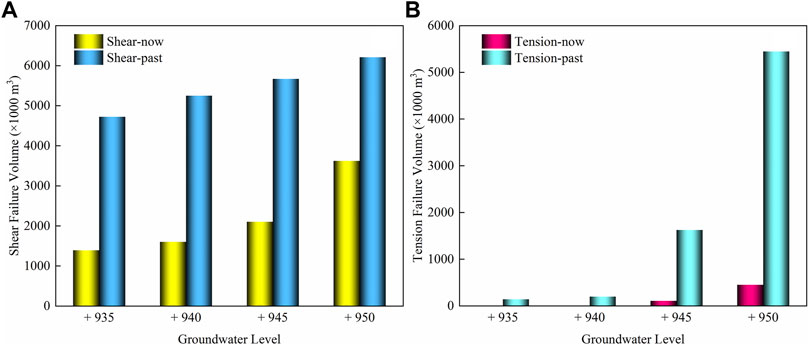
FIGURE 13. Volumes of (A) the shear failure states and (B) the tension failure states for different groundwater levels.
To study the degree of deformation and failure of the end wall when the groundwater level rises, monitoring points A (112, 150, 90) and B (225, 150, 45) were set at the top and toe of the slope (Figure 9A). The red and black lines show the data variation curves of the monitoring points A and B, respectively, in Figure 14. It can be seen from the X-displacement curve that, as the model timestep increases, the X-displacement value generally increases until it is stable. On average, the balanced X-displacement of monitoring point A is significantly larger than that of monitoring point B. When the groundwater level is less than +940, as the groundwater level increases, the maximum value of its displacement value also increases. The X-displacement value of monitoring point A was negative prior to 3,600 timesteps, the inflection point appeared from 3,300 timesteps to 3,500 timesteps, the position value at 3,600 timesteps became 0, and the displacement value from the inflection point to 4,000 timesteps was fast. The growth trend gradually eased and reached a maximum. The X-displacement value of monitoring point B was close to 0 prior to approximately 3,250 timesteps, and then increased rapidly, with an obvious displacement inflection point appearing at approximately 3,500 timesteps. It can be seen from the displacement cloud diagram that the maximum displacement value inside the sliding mass gradually shifted from the trailing edge of the sliding mass to the empty surface of the sliding mass; this is obvious in Figures 14A–C. Because the active earth pressure rupture occurred at the beginning of the end wall, the sliding zone of the trailing edge of the landslide expanded backward and downward and monitoring point A showed a negative displacement. With the expansion of the plastic zone, the stress concentration range expanded to the middle and front part of the wall and the displacement value of monitoring point A continued to increase. With the continuous adjustment of the stress, the deformation gradually accumulated at the front edge and the displacement values of monitoring points A and B continued to increase until they became stable. With increasing timestep, the deformation and failure of the front edge of the landslide was accompanied by the overall deformation and failure of the moving landslide, which reflected a progressive-failure process.

FIGURE 14. Variation of the X-displacement of monitoring points A and B versus the calculated timestep for different groundwater levels: (A) +935, (B) +940, (C) +945, and (D) +950.
When the groundwater level was as high as +950, the change trends of the X-displacement curves of the monitoring points were completely different (Figure 14D). As the timestep increased, the X-displacement values of the monitoring points A and B increased smoothly until they were stable; both were positive. The value of monitoring point A was obviously greater than the value of monitoring point B. However, at the beginning of the calculation, the displacement and deformation of monitoring point B appeared first and exceeded those of monitoring point A (Figure 14E), indicating that the end-wall failure started at the +910 bench and gradually failed at the top of the end wall. The landslide gradually underwent an active earth pressure rupture from the toe of surface of the rupture to the trailing edge of the sliding surface. Because of the decrease in σ3 (the loss of support at the front part of the wall) and the gradual active earth pressure rupture, the angle between the rupture surface and the large principal stress σ1 was 45° φ/2. The large principal stress σ1 primarily consisted of the self-gravity of the soil, the small principal stress σ3 reflected the horizontal compressive stress, and φ indicates the internal friction angle of the sliding belt. After a certain point, a landslide will gradually produce tensile cracks from bottom to top. In a certain period of time, the trailing edge of the landslide will be deformed and accompanied by the overall failure of the retrogressive landslide; this is the regressive progressive-failure process (Lu, 2015; Tan et al., 2016). This confirms that the deformation and failure mode of this landslide corresponds to a retrogressive progressive-failure mode, that is, the upper section was an arc-shaped failure and slipped downward and the lower part slid along the mudstone stratum and cut outward. Sliding drives the upper edge of the end wall to be located step by step, resulting in the overall end-wall instability. The calculation results are consistent with the actual on-site landslide model.
A large number of studies have shown that, because of algorithm and dimensional differences, the FoS calculation results of three-dimensional models are usually slightly larger than those of two-dimensional models (Fang et al., 2008; Lu et al., 2012). Therefore, we use the SLOPE/W and analytical formula to analyze the stability of two-dimensional end wall (Figure 9C). The ordinary method, the Bishop method, the simplified Janbu method, the Morgenstern–Price method, and the Spencer method were considered in the SLOPE/W analysis, and the results were compared with the analytical formula.
Figure 15A shows the circular sliding surface calculated by SLOPE/W. It was found that the sliding mass of the end wall slipped out of the +910 bench caesious mudstone, such that the SLOPE/W results are consistent with the progressive-failure results of the end wall calculated by FLAC3D (Figure 15B).
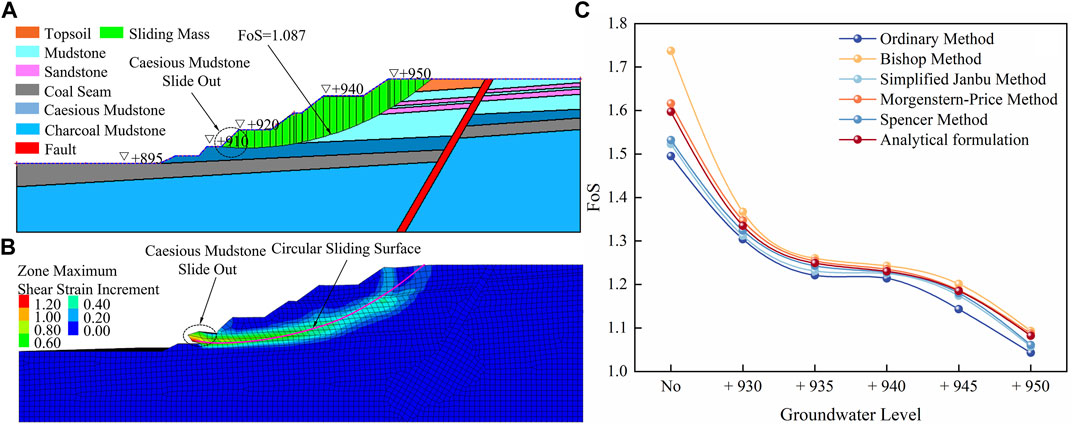
FIGURE 15. (A) SLOPE/W and (B) FLAC3D predictions of the potential sliding surface of the end wall when the groundwater level is +950, amd (C) FoS of the end wall at various groundwater levels calculated by the SLOPE/W and analytical formula.
We calculated the FoS of the end wall and compared the calculation results (Figure 15C). In the five groundwater level rise cases, SLOPE/W and the analytical formula calculation give consistent or similar FoS predictions. This indicates that the analytical formula calculation results are feasible. As the groundwater level rises, the safety factor of the north slope continues to decrease. The FoS curve changes slightly when the groundwater level is between +935 and +940. However, when the groundwater level rises to +950, FoS is close to 1.00. This indicates that the end wall stability is about to reach the critical stability state. With the passage of time, the sliding surface creep accelerated until the entire end wall landslide. The variation law of FoS once again verifies that the groundwater level rise caused by rainfall is the root cause of the landslide.
The failure process and stability were revealed via investigations, field experiment, analytical calculations, and numerical simulations. The conclusions obtained from this study can be summarized as follows.
1) The fault fracture zone provided conditions for interface sliding and rainfall infiltration, which caused the mudstone to rapidly develop into a plastic weak zone. Under the condition of continuous heavy rainfall and groundwater infiltration in July and August, the pore water pressure increased to 880 kPa in a short period of time.
2) The landslide started with the development of the mudstone layer at the toe of the slope. A groundwater level of +940 serves as a demarcation point at which the progressive-failure mode of the landslide transformed from load-caused to retrogressive. When the groundwater level is below +945, the maximum X-displacement is 0.054 m. However, when the groundwater level rises to +950, the X-displacement reaches 11.50 m. The development of the plastic failure zone and the change in the X-displacement confirmed that this landslide underwent a retrogressive progressive-failure process.
3) The calculation results of SLOPE/W and FLAC3D confirm that the sliding surface of the end wall is circular. The FoS of SLOPE/W and the analytical formula are consistent. The FoS decreased with increasing groundwater level. When the groundwater level rose to +950, the FoS was close to 1.00. With the passage of time, the creep of the sliding surface accelerated until the entire end wall landslide.
These findings can serve as a reference for studies of landslide mechanism formation and stability evaluation in open-pit coal mines. Stability evaluation in practical engineering is a prerequisite for prevention and control, and more studies on the reinforcement mechanism considering the progressive failure process will be further developed.
The original contributions presented in the study are included in the article/Supplementary Material, further inquiries can be directed to the corresponding author.
TC: Conceptualization, Writing—original draft. JS: Resources, Writing—eview and editing, Supervision, Datacuration. LH: Validation, Methodology, Investigation, Formal analysis. GT: Validation, Formal analysis. BL: Writing—review and editing.
This research was funded and supported by the National Natural Science Foundation of China (Grant No. 51774271), and the National Natural Science Foundation of China Youth Fund Project (Grant No. 51804298).
We are grateful to the reviewers for their valuable suggestions in improving the manuscript.
Author BL was employed by China Railway Resources Sunite Left Banner Manglai Mining Co. Ltd, China.
The authors declare that the research was conducted in the absence of any commercial or financial relationships that could be construed as a potential conflict of interest.
All claims expressed in this article are solely those of the authors and do not necessarily represent those of their affiliated organizations, or those of the publisher, the editors and the reviewers. Any product that may be evaluated in this article, or claim that may be made by its manufacturer, is not guaranteed or endorsed by the publisher.
The Supplementary Material for this article can be found online at: https://www.frontiersin.org/articles/10.3389/feart.2022.1038499/full#supplementary-material
Andrewwinner, R., and Chandrasekaran, S. S. (2021). Investigation on the failure mechanism of rainfall-induced long-runout landslide at Upputhode, Kerala State of India. Land 10 (11), 1212. doi:10.3390/land10111212
Cai, Q., Zhou, W., Che, Z., Liu, Y., and Peng, H. (2007). Research on the mining method and stripping ratio of steep end-slope mining in surface coal mines with flat coal deposit. J. China Univ. Min. Technol. 36 (6), 743–747.
Cai, Q., Zhou, W., Shu, J., Liu, Y., and Peng, H. (2008). Analysis and opplicaiton on end-slope timeliness of internal dumping under flat dipping ore body in large surface coal mine. J. China Univ. Min. Technol. 37 (6), 740–744.
Carlà, T., Farina, P., Intrieri, E., Ketizmen, H., and Casagli, N. (2018). Integration of ground-based radar and satellite InSAR data for the analysis of an unexpected slope failure in an open-pit mine. Eng. Geol. 235, 39–52. doi:10.1016/j.enggeo.2018.01.021
Cheng, S., and Luo, X. (2010). Research on theory and application of landslide model test. J. Coal Sci. Eng. China. 16 (2), 140–143. doi:10.1007/s12404-010-0206-6
Das, A., Jayashree, C., and Viswanadham, B. V. S. (2009). Effect of randomly distributed geofibers on the piping behaviour of embankments constructed with fly ash as a fill material. Geotext. Geomembranes 27 (5), 341–349. doi:10.1016/j.geotexmem.2009.02.004
Du, H., and Song, D. (2022). Investigation of failure prediction of open-pit coal mine landslides containing complex geological structures using the inverse velocity method. Nat. Hazards (Dordr). 111 (3), 2819–2854. doi:10.1007/s11069-021-05159-w
Ehteshami-Moinabadi, M. (2022). Properties of fault zones and their influences on rainfall-induced landslides, examples from Alborz and Zagros ranges. Environ. Earth Sci. 81 (5), 168. doi:10.1007/s12665-022-10283-2
Fan, L., Lehmann, P., and Or, D. (2017). Load redistribution rules for progressive failure in shallow landslides: Threshold mechanical models. Geophys. Res. Lett. 44 (1), 228–235. doi:10.1002/2016gl071763
Fan, Z., Zhou, Y., Liu, X., Li, S., and Zhang, X. (2016). Analysis of landslide mechanisms of the southern red bed slope in the No.2opencast coal mine in eastern Shengli coal field. Chin. J. Rock Mech. Eng. 35, 4063–4072.
Fang, J., Xu, Z., and Zhuang, X. (2008). Appraisal and analysis of three-dimensional slope stability based on elastoplastic FEM. Rock Soil Mech. 29 (10), 2667–2672.
Fredlund, D. G. (1981). The relationship between limit equilibrium slope stability methods. 10th. ICSMFE 3, 409–416.
He, F., Wang, L., Yao, Z., Zhang, L., and Zhao, G. (2011). Advanced materials research. Haikou, China: Trans Tech Publications, 271–277.The creep rupture numerical simulation of Coal (rock) layered slope
Hibbitt, H. D., Marcal, P. V., and Rice, J. R. (1970). A finite element formulation for problems of large strain and large displacement. Int. J. Solids Struct. 6 (8), 1069–1086. doi:10.1016/0020-7683(70)90048-x
Huang, R. (2012). Mechanisms of large-scale landslides in China. Bull. Eng. Geol. Environ. 71 (1), 161–170. doi:10.1007/s10064-011-0403-6
Hungr, O., Leroueil, S., and Picarelli, L. (2014). The Varnes classification of landslide types, an update. Landslides 11 (2), 167–194. doi:10.1007/s10346-013-0436-y
Jaboyedoff, M., Demers, D., Locat, J., Locat, A., Locat, P., Oppikofer, T., et al. (2009). Use of terrestrial laser scanning for the characterization of retrogressive landslides in sensitive clay and rotational landslides in river banks. Can. Geotech. J. 46 (12), 1379–1390. doi:10.1139/t09-073
Jiang, B., and Kang, W. (2008). Analytical formulation of Bishop's method for calculating slope stability. J. China Univ. Min. Technol. 37 (3), 287–290.
Katebi, M., Maghoul, P., and Blatz, J. (2019). Numerical analysis of pipeline response to slow landslides: Case study. Can. Geotech. J. 56 (12), 1779–1788. doi:10.1139/cgj-2018-0457
Kennedy, R., Take, W. A., and Siemens, G. (2020). Geotechnical centrifuge modelling of retrogressive sensitive clay landslides. Can. Geotech. J. 58 (10), 1452–1465. doi:10.1139/cgj-2019-0677
Lee, S., Li, X., and Liu, Y. (2006). Study on generation and evolution of maoping landslide on Qingjiang river. Chin. J. Rock Mech. Eng. 25 (2), 377–384.
Locat, A., Leroueil, S., Bernander, S., Demers, D., Jostad, H. P., and Ouehb, L. (2011). Progressive failures in eastern Canadian and Scandinavian sensitive clays. Can. Geotech. J. 48 (11), 1696–1712. doi:10.1139/t11-059
Locat, A., Locat, P., Demers, D., Leroueil, S., Robitaille, D., and Lefebvre, G. (2017). The Saint-Jude landslide of 10 May 2010, Quebec, Canada: Investigation and characterization of the landslide and its failure mechanism. Can. Geotech. J. 54 (10), 1357–1374. doi:10.1139/cgj-2017-0085
López-Vinielles, J., Ezquerro, P., Fernandez-Merodo, J. A., Bejar-Pizarro, M., Monserrat, O., Barra, A., et al. (2020). Remote analysis of an open-pit slope failure: Las Cruces case study, Spain. Landslides 17 (9), 2173–2188. doi:10.1007/s10346-020-01413-7
Lu, K., Zhu, D., and Yang, Y. (2012). Comparison and analysis of 2D and 3D slope stability analysis results. Rock Soil Mech. S2 (33), 150–154.
Lu, Y. (2015). Deformation and failure mechanism of slope in three dimensions. J. Rock Mech. Geotechnical Eng. 2 (7), 109–119. doi:10.1016/j.jrmge.2015.02.008
Martinović, K., Reale, C., and Gavin, K. (2017). Fragility curves for rainfall-induced shallow landslides on transport networks. Can. Geotech. J. 55 (6), 852–861. doi:10.1139/cgj-2016-0565
Miao, F., Wu, Y., Li, L., Tang, H., and Li, Y. (2018). Centrifuge model test on the retrogressive landslide subjected to reservoir water level fluctuation. Eng. Geol. 245, 169–179. doi:10.1016/j.enggeo.2018.08.016
Mohammadi, S., and Taiebat, H. (2016). Finite element simulation of an excavation-triggered landslide using large deformation theory. Eng. Geol. 205, 62–72. doi:10.1016/j.enggeo.2016.02.012
Nie, L., Li, Z., Lv, Y., and Wang, H. (2017). A new prediction model for rock slope failure time: A case study in West open-pit mine, Fushun, China. Bull. Eng. Geol. Environ. 76 (3), 975–988. doi:10.1007/s10064-016-0900-8
Peng, C., Li, S., Wu, W., An, H., Chen, X., Ouyang, C., et al. (2021). On three-dimensional SPH modelling of large-scale landslides. Can. Geotech. J. 59 (1), 24–39. doi:10.1139/cgj-2020-0774
Qi, X., Li, D., Zhou, C., and Phoon, K. K. (2013). Stochastic analysis method of critical slip surfaces in soil slopes considering spatial variability. Chin. J. Geotechnical Eng. 35 (4), 745–753.
Reichenbach, P., Rossi, M., Malamud, B. D., Mihir, M., and Guzzetti, F. (2018). A review of statistically-based landslide susceptibility models. Earth-Science Rev. 180, 60–91. doi:10.1016/j.earscirev.2018.03.001
Shaller, P. J., Doroudian, M., and Hart, M. W. (2020). The Eureka Valley landslide: Evidence of a dual failure mechanism for a long-runout landslide, Lithosphere, 2020.1
Shang, T., Shu, J., Cai, Q., and Che, Z. (2001). Space time relationship between end slope coal extraction and dumping and mining of open pits. J. China Univ. Min. Technol. 30 (1), 29–31.
Song, D., Liu, X., Huang, J., and Zhang, J. (2021b). Energy-based analysis of seismic failure mechanism of a rock slope with discontinuities using Hilbert-Huang transform and marginal spectrum in the time-frequency domain. Landslides 18 (1), 105–123. doi:10.1007/s10346-020-01491-7
Song, D., Liu, X., Huang, J., Zhang, Y., Zhang, J., and Nkwenti, B. N. (2021a). Seismic cumulative failure effects on a reservoir bank slope with a complex geological structure considering plastic deformation characteristics using shaking table tests. Eng. Geol. 286, 106085. doi:10.1016/j.enggeo.2021.106085
Song, D., Liu, X., Li, B., Zhang, J., and Bastos, J. J. V. (2021c). Assessing the influence of a rapid water drawdown on the seismic response characteristics of a reservoir rock slope using time–frequency analysis. Acta Geotech. 16 (4), 1281–1302. doi:10.1007/s11440-020-01094-5
Tan, F., Hu, X., Zhang, Y., He, C., and Zhang, H. (2016). Study of progressive failure processes and stabilities of different types of landslides. Rock Soil Mech. S2 (37), 597–606.
Tang, W., Li, W., Zhang, K., and Wang, H. (2020). Research on the stability analysis and optimization design of convex slope. Nonferrous Met. Min. Sect. 4 (72), 48–53.
Tran, T. V., Alvioli, M., and Hoang, V. H. (2021). Description of a complex, rainfall-induced landslide within a multi-stage three-dimensional model. Nat. Hazards (Dordr). 110, 1953–1968. doi:10.1007/s11069-021-05020-0
Tran, T. V., Alvioli, M., and Hoang, V. H. (2022). Description of a complex, rainfall-induced landslide within a multi-stage three-dimensional model. Nat. Hazards (Dordr). 110 (3), 1953–1968. doi:10.1007/s11069-021-05020-0
Tremblay-Auger, F., Locat, A., Leroueil, S., Demers, D., and Levasseur, P. (2022). A rare case of downward progressive failure in eastern Canada: The 1976 saint-fabien landslide. Can. Geotech. J. 59 (9), 1622–1642. doi:10.1139/cgj-2019-0831
Tu, X. B., Kwong, A., Dai, F. C., Tham, L. G., and Min, H. (2009). Field monitoring of rainfall infiltration in a loess slope and analysis of failure mechanism of rainfall-induced landslides. Eng. Geol. 105 (1-2), 134–150. doi:10.1016/j.enggeo.2008.11.011
Vinoth, S., and Ajay Kumar, L. (2014). Applying real time seismic monitoring technology for slope stability assessment—an Indian opencast coal mine perspective. Int. J. Min. Sci. Technol. 24 (1), 75–80. doi:10.1016/j.ijmst.2013.12.013
Wang, H., Yan, F., Li, X. c., Mi, Z. j., Li, X. m., and Wang, S. q. (2020a). Evolution mechanism study of flow slide catastrophes in large waste dumps at the Nanfen iron mine. Bull. Eng. Geol. Environ. 79 (9), 4733–4747. doi:10.1007/s10064-020-01881-0
Wang, Z., Liu, B., Han, Y., Wang, J., Yao, B., and Zhang, P. (2020b). Stability of inner dump slope and analytical solution based on circular failure: Illustrated with a case study. Comput. Geotechnics 117, 103241. doi:10.1016/j.compgeo.2019.103241
Wu, K., Chen, N., Hu, G., Wang, T., Zhang, Y., and Marcelo, S. (2021). New insights into the failure mechanism and dynamic process of the Boli landslide, China. Bull. Eng. Geol. Environ. 80 (3), 2131–2148. doi:10.1007/s10064-020-02085-2
Xie, J., Uchimura, T., Wang, G., Selvarajah, H., Maqsood, Z., Shen, Q., et al. (2020). Predicting the sliding behavior of rotational landslides based on the tilting measurement of the slope surface. Eng. Geol. 269, 105554. doi:10.1016/j.enggeo.2020.105554
Yang, G., Zhong, Z., Zhang, Y., and Wang, E. (2012). Identification of landslide type and determination of optimal reinforcement site based on stress field and displacement field. Chin. J. Rock Mech. Eng. 31 (9), 1879–1887.
Yin, Y., Li, B., Wang, W., Zhan, L., Xue, Q., Gao, Y., et al. (2016). Mechanism of the december 2015 catastrophic landslide at the shenzhen landfill and controlling geotechnical risks of urbanization. Engineering 2 (2), 230–249. doi:10.1016/j.eng.2016.02.005
Yong, R., Hu, X., Tang, H., Li, C., Ma, J., and Song, Y. (2013). Model testing and numerical simulation study of evolutionary process of thrust load caused landslide. Rock Soil Mech. 34 (10), 3018–3027.
Zhang, B., Li, Z., Cheng, J., and Deng, B. (2008). Comparison of deformation mechanisms of Maoping and Xintang landslides. J. Yangtze River Sci. Res. Inst. 1 (25), 40–43.
Zhang, J., Li, X., Chi, M., and Lu, T. (2015a). Analysis of formation mechanism and characteristics of landslide disasters. J. Nat. Disasters 24 (6), 42–49.
Zhang, M., Nie, L., Xu, Y., and Dai, S. (2015b). A thrust load-caused landslide triggered by excavation of the slope toe: A case study of the chaancun landslide in dalian city, China. Arab. J. Geosci. 8 (9), 6555–6565. doi:10.1007/s12517-014-1710-6
Zhang, X., Sloan, S. W., and Onate, E. (2018). Dynamic modelling of retrogressive landslides with emphasis on the role of clay sensitivity. Int. J. Numer. Anal. Methods Geomech. 42 (15), 1806–1822. doi:10.1002/nag.2815
Zhang, Y., Kang, Z., and Hou, C. (2010). Research on numerical analysis of landslide cataclysm mechanism and reinforcement treatment scheme in shengli open-pit coal mine, Lecture notes in computer science (including subseries lecture notes in artificial intelligence and lecture notes in bioinformatics). Singapore: Springer-Verlag, 565–572.
Zhou, C., Liu, Z., Dong, L., Shang, W., and Lin, L. (2003). Large deformation fem analysis of slopes fallure. Rock Soil Mech. 24 (4), 644–647+652.
Zou, Z., Tang, H., and Xiong, C. (2012). Geomechanical model of progressive failure for large consequent bedding rockslide and its stability analysis. Chin. J. Rock Mech. Eng. 11 (31), 2222–2231.
H slope height (m)
γ unit natural of soil (N m−3)
γw water density (N m−3)
V volume of soil mass in the slope affected by the seepage (m3)
i hydraulic gradient
φ internal friction angle of soil (°)
C cohesion of soil (N m−2)
θ slope angle (°)
Q the rotation center of sliding arc
R radius of the sliding arc (m)
O origin of coordinates (m)
xa x-coordinate of point A (m)
xd x-coordinate of point D (m)
yd y-coordinate of point D (m)
y1 equation of line OA (m)
y2 equation of line AB (m)
y3 equation of line BD (m)
y4 equation of the circular arc OD (m)
l distance from point B to y-axis (m)
L distance from point D to y-axis (m)
ψ angle between the tangent of the circular arc at point e and the x-axis (°)
h height of the infinitesimal slice (m)
dx width of the infinitesimal slice (m)
dW gravity (N)
dT sliding force (N)
dR sliding resistance (N)
dN vertical force (N)
Fw seepage force (N)
η angle between the groundwater level and the slope surface normal (°)
hO water head at point O (m)
hK water head at point K (m)
hJ water head at point J (m)
FoS Factor of safety
μ Poisson’s ratio
K Bulk modulus (kN m−2)
Keywords: groundwater level, analytical formula, factor of safety (FoS), retrogressive failure, open-pit coal mine
Citation: Chen T, Shu J, Han L, Tovele GSV and Li B (2023) Landslide mechanism and stability of an open-pit slope: The Manglai open-pit coal mine. Front. Earth Sci. 10:1038499. doi: 10.3389/feart.2022.1038499
Received: 07 September 2022; Accepted: 31 October 2022;
Published: 13 January 2023.
Edited by:
Dongdong Yao, China University of Geosciences Wuhan, ChinaReviewed by:
Ping Wang, China Earthquake Administration, ChinaCopyright © 2023 Chen, Shu, Han, Tovele and Li. This is an open-access article distributed under the terms of the Creative Commons Attribution License (CC BY). The use, distribution or reproduction in other forums is permitted, provided the original author(s) and the copyright owner(s) are credited and that the original publication in this journal is cited, in accordance with accepted academic practice. No use, distribution or reproduction is permitted which does not comply with these terms.
*Correspondence: Jisen Shu, anNzaHU4ODhAY3VtdC5lZHUuY24=
Disclaimer: All claims expressed in this article are solely those of the authors and do not necessarily represent those of their affiliated organizations, or those of the publisher, the editors and the reviewers. Any product that may be evaluated in this article or claim that may be made by its manufacturer is not guaranteed or endorsed by the publisher.
Research integrity at Frontiers
Learn more about the work of our research integrity team to safeguard the quality of each article we publish.