 Zhengang Zhang1,2
 Changchun Song1,3*
 Yuedong Guo1*
 Panxing He4Ning Chen1
 Jianzhao Liu1,2Yifei Zhang1,2
 Yunjiang Zuo1,2Xing Zhang1,2
- 1Key Laboratory of Wetland Ecology and Environment, Northeast Institute of Geography and Agroecology, Chinese Academy of Sciences, Changchun, China
- 2University of Chinese Academy Sciences, Beijing, China
- 3School of Hydraulic Engineering, Dalian University of Technology, Dalian, China
- 4Ministry of Education Key Laboratory for Western Arid Region Grassland Resources and Ecology, Xinjiang Agricultural University, Urumqi, China
Since the 1990s, the climate in the Amur River Basin (ARB) has changed, and large-scale wetlands in the region have been reclaimed for paddy fields. The study of the influence of climate change and agricultural expansion on groundwater storage is of great significance to the evaluation of regional water resource balance and the promotion of ecological protection and agricultural development. In this work, the groundwater storage anomaly (GWSA) in the ARB and its drivers were analyzed for the period 2003–2016 using Gravity Recovery and Climate Experiment (GRACE) satellite data, a Global Land Data Assimilation System model, and in situ observations of groundwater levels. Results indicated that 1) the GWSA in the ARB increased at a rate of 2.0–2.4 mm/yr from 2003 to 2016; the GWSA in the upper reaches of the ARB increased, whereas the GWSA in the middle and lower reaches decreased during the study period. 2) The GWSA in the middle and lower reaches of the ARB was greatly influenced by temperature (Tmp) and evapotranspiration (ET). Tmp was positively correlated with GWSA, whereas ET was negatively correlated with GWSA (p < 0.05). 3) Extreme rainfall had a delayed effect on groundwater recharge. Wetland degradation and agricultural development were the main factors causing the decrease of the GWSA in the middle and lower reaches of the ARB. In summary, temperature and evapotranspiration affect groundwater storage by regulating the water–heat balance, wetland reclamation reduces the regional storage capacity, and the irrigation required for reclaimed farmland is the main source of groundwater loss.
Highlights
1. Groundwater storage (GWS) in the upper Amur River Basin (ARB) increased during 2003–2016
2. GWS in the lower ARB reduced due to wetland degradation and agricultural expansion
3. Temperature and evapotranspiration affect GWS by regulating the water–heat balance
Introduction
Groundwater accounts for approximately 30% of the world’s freshwater. As an important part of the global water cycle, groundwater serves as a crucial link between the water cycle and climate change (Konikow and Kendy, 2005; Taylor et al., 2012). Globally, approximately 2.34 × 10⁷ km³ of water is stored in aquifers, accounting for about half of all freshwater and only 2.5% of the total water storage available on the earth (Oki and Kanae, 2006). Between 1900 and 2008, the global groundwater consumption was estimated to be 4.5 × 10³ km3 (Konikow, 2011), which posed a major threat to global water security and potentially led to a decline in agricultural productivity and energy production. Changes in evapotranspiration, atmospheric water vapor, and precipitation cause changes in the global hydrological cycle (IPCC, 2013), which in turn affect subsurface hydrologic dynamics and lead to changes in the recharge and discharge of aquifers (Smerdon, 2017). In addition, the loss of groundwater storage causes problems such as land subsidence, reductions in spring water, and reductions in domestic and agricultural water supply (Konikow and Kendy, 2005; Feng et al., 2013; Gong et al., 2018; Deng et al., 2019; He et al., 2020). At present, there are few studies on the impact of climate change on groundwater storage, especially in areas that are heavily influenced by human activities and sensitive to climate change. Research on these aspects will help provide more accurate scientific guidance for the management of water resources in such regions.
The estimation of groundwater storage is typically achieved using water level monitoring wells. However, our understanding of groundwater storage in basins is limited by the low density and poor distribution of groundwater level monitoring stations in many regions of the world (Deng and Chen, 2016), and by uncertainties related to the storage coefficient used to convert the groundwater level into groundwater storage. In addition to the use of monitoring wells, changes in groundwater storage can be simulated using hydrological models. At the global scale, hydrological models fall into two broad categories, namely land surface models (LSMs) and hydrological models (HMs) of water balance (Feng et al., 2018). Although most LSMs can simulate the water and energy fluxes between the surface and the atmosphere in general circulation models and can generally be used to predict changes in soil moisture and storage, most cannot simulate changes in groundwater storage (Rodell et al., 2004). In addition, the construction of regional groundwater models often requires the collection of several types of hydrogeological data (such as water level, hydrogeological conditions, and aquifer medium), as well as data on land use types, meteorological factors, and other parameters, which is very difficult at the regional scale.
In addition to water level monitoring wells and groundwater models, observations of Earth’s gravitational field could help estimate water storage. The Gravity Recovery and Climate Experiment (GRACE) satellites measure changes in Earth’s gravitational field (Tapley et al., 2004). Since their launch in 2002, the GRACE satellites have demonstrated great application potential in fields such as geodesy, geophysics, oceanography, hydrology, and glaciology (Tapley et al., 2004; Tapley et al., 2019). Terrestrial Water Storage Anomaly (TWSA) observations by GRACE satellites have been widely used to assess the loss or depletion of groundwater storage in major aquifers (Moiwo et al., 2012; Long et al., 2013; MacDonald et al., 2016; Nanteza et al., 2016; Bhanja et al., 2018). GRACE satellite data include monthly anomalies from April 2002 to January 2017; positive anomalies indicate an increase in quality, and negative anomalies indicate a decrease in quality. These anomalies are calculated relative to the time average baseline (2004–2009) (Moghim, 2020). GRACE-FO was launched on 22 May 2018, and continues to track Earth’s water movement, monitoring groundwater storage; the volumes of water in large lakes and rivers, soil moisture, ice caps and glaciers; and sea level changes caused by increased quantities of sea water (Rodell et al., 2009; Long et al., 2017; Xie et al., 2018). The GRACE satellites and their successors, the GRACE-FO satellites, have provided continuous data for groundwater storage analysis (Li et al., 2019). These satellites are particularly important for studying areas with high groundwater losses and low monitoring water levels. Many studies have used GRACE satellites to estimate GWSA in regions such as India (Long et al., 2016), California’s Central Valley (Scanlon et al., 2012), and the North China Plain (Feng et al., 2013). In addition, GRACE satellites have also been used in research on water resources in large permafrost regions (Landerer et al., 2010; Xiang et al., 2016).
The Amur River Basin (ARB) extends across China, Russia, and Mongolia; it is among the most sensitive areas to climate change in the region. Within the basin, there are significant differences in the distribution of human activities, frozen soil exhibits a trend of intensifying degradation, and agricultural development is heavily dependent on groundwater (Wang et al., 2016; Mao et al., 2020). However, in recent years, research on groundwater storage in the ARB has been restricted to the Songhua River Basin (Chen et al., 2018) and northeast China (Zheng et al., 2020); research has not yet been conducted on groundwater storage in the whole basin. Therefore, it is of great importance to elucidate the spatio-temporal heterogeneity of groundwater storage in this basin to study the influence of climate change and human activities on groundwater storage.
In this study, we used GRACE satellite data, Global Land Data Assimilation System (GLDAS) LSM data, and in situ groundwater level data to assess the GWSA of the ARB. The purpose of this study is to reveal the temporal and spatial variations in groundwater storage in the ARB and the factors influencing them. It also aims to ascertain how climate change and human activities (mainly agricultural expansion) affect regional groundwater storage.
Materials and methods
Study area
The ARB (42°N–57°N, 108°E–141°E) extends across Mongolia, China, and Russia and is one of the largest river basins in northeastern Asia, which is an area that is sensitive to global climate change. The area of the basin is approximately 2.08 × 10⁶ km2, and the elevation ranges from 110 to 2,760 m. The terrain is high in the west and low in the east, and the terraces exhibit features that clearly reflect geomorphologic change (Myneni et al., 1997). The ARB is significantly affected by the Pacific monsoon. The eastern part of the basin has a dominantly temperate monsoon climate; it lies at the northernmost edge of the area influenced by the global monsoon climate. The western part of the basin has a dominantly temperate continental climate. Temperature exhibits considerable spatial variation across the basin, with significant differences in temperature observed between its eastern and western portions; the annual average temperature of the basin ranges from −8∼6°C (Wang et al., 2016). The distribution of precipitation in the basin exhibits temporal and spatial variations. The annual precipitation is in the range of 400–600 mm, of which 60%–70% is concentrated during the summer. The precipitation gradually decreases from the coast to the interior of the basin. The river systems in the basin mainly include the main streams of the Heilongjiang, Songhuajiang, and Wusulijiang rivers. The swamp wetlands in the basin have been reclaimed. Large tracts of swampy wetlands in the southern part of the ARB have been converted to cropland. Nearly 60% of the ARB is covered with permafrost, which is important for the existence of wetlands (Avis et al., 2011). Wetlands account for 9% of the ARB, although nearly 22% of the wetland area in the ARB has been lost during the past 40 years (Mao et al., 2020).
In this study, based on factors such as the underlying surface, the location of the basin, and human activities (mainly agricultural development), we selected the northwestern part of the ARB (ANW) and the Sanjiang Plain (SJP) as target areas.
The SJP is one of the most distinctive areas in the ARB. In recent years, with the development of agriculture, the degradation of wetlands and the intensification of human activities, the hydrology and meteorology of the area have undergone significant changes (Guo et al., 2021). From 1954 to 2005, the SJP was severely disturbed by human activities (mainly agricultural development), and 77% of the wetland area was used for agricultural purposes (Wang et al., 2011; Yan et al., 2017). The expansion of irrigated paddy fields in the region has had a significant impact on temperature, and the overexploitation of groundwater has caused a significant decrease in the groundwater level in irrigated areas (Wang et al., 2015). Moreover, rainfall during the rainy season has decreased, and rainfall during the dry season has increased (Bratkič et al., 2012).
The northwestern part of the ARB (ANW) is mainly composed of semiarid steppes and has a continental monsoon climate. The average elevation is approximately 1,000 m, and the annual precipitation is approximately 300–400 mm (Li et al., 2016). The good hydrothermal conditions and broad highland plain topography have resulted in the development of animal husbandry in this area (Li et al., 2016). Meanwhile, basalts have been emplaced across a wide area in this region, which is conducive to the recharge of atmospheric precipitation and the storage of groundwater (Mo et al., 2002).
Data source
Owing to errors in a single product scheme, in this study, we conducted comparative analyses using three datasets, the RL05 dataset from the Centre for Space Research, the University of Texas (CSR), the RL05.1 dataset from the Jet Propulsion Laboratory (JPL), and the RL05a dataset from GeoForschungsZentrum Potsdam (GFZ). TWSA represents the deviation of mass within the vertical range of water, and its unit is equivalent water thickness. TWSA has been widely used in hydrological research, with the anomaly in the relative average equivalent water height between 2003 and 2016 being used to represent changes in terrestrial water storage (including groundwater, soil water, snow water, and canopy water) (Long et al., 2015a). Previous studies have investigated algorithms, theories, and TWSA acquisition in detail (Yin et al., 2003). In this work, data for months in which GRACE satellite observations were unavailable (i.e., Jun. and Jul. 2002; Jun. 2003; Jan. and Jun. 2011; May. and Oct. 2012; Mar., Aug. and Sept. 2013; Feb. and Dec. 2014; and Jun. 2015) were obtained using the arithmetic mean (Long et al., 2015b).
To estimate the value of GWSA, we used the GLDAS Noah model to obtain soil moisture storage (SMS, monthly, 1° spatial resolution), snow water storage (SWS, monthly, 1° spatial resolution), canopy water storage (CWS, monthly, 1° spatial resolution), and evapotranspiration (ET, monthly, 1° spatial resolution) values. The soil moisture data output by the GLDAS Noah hydrological model includes soil moisture data for four layers, namely 0–10, 10–40, 40–100, and 100–200 cm. The sum of the soil moisture in the four layers is regarded as the soil water storage (Rodell et al., 2004).
We used precipitation (Pre, monthly, 0.5° spatial resolution) and temperature (Tmp, monthly, 0.5° spatial resolution) from the TS4.01 dataset from the Climatic Research Unit (CRU), the University of East Anglia (Grotjahn and Huynh, 2018) for the period 2003–2016 as the climate data in this study. The data from meteorological stations in the Sanjiang Plain, Greater Hinggan Mountains, and Songnen Plain were compared with the CRU data, and the correlation coefficient for both datasets exceeded 0.9, confirming the validity of CRU data for the region (Harris and Jones, 2017).
Groundwater storage anomaly calculation
The terrestrial water storage anomaly obtained by inversion of GRACE time-varying gravity field data is expressed as the equivalent water height △hw (φ,λ) (Chen, 2005; Han, 2005; Han et al., 2005):
where θ is the extra latitude of Earth’s center, (φ, λ) are the latitude and longitude of the ground point, (ΔCnm, ΔSnm) is the change of nth order m-order normalized potential coefficient, Pnm () is the normalized nth order mth order associated Legendre function; kn is the nth order load Love number, ρw ≈ 10³ kg/m³ is the density of water, ρe ≈ 5.5 × 10³ kg/m³ is the average density of the solid earth, and R is the average radius of Earth.
The groundwater storage anomaly is given by:
where GWSA is the groundwater storage anomaly, TWSA is the terrestrial water storage anomaly, SWSA is the snow water storage anomaly, SMSA is the soil moisture storage anomaly, and CWSA is the canopy water storage anomaly.
Owing to the small area of the SJP and ANW, the GWSA data obtained from three the institutions (CSR, GFZ, JPL) and GLDAS are essentially the same. Therefore, this study only uses GWSA data obtained by CSR and GLDAS as the follow-up research related to groundwater in the SJP and ANW.
In situ groundwater-level observations
The groundwater depth in the SJP has been observed since the construction of Sanjiang farm in 1997. The data obtained include groundwater depth data for a total of 15 farms in the SJP from 1997 to 2010, and groundwater level data for Honghe farm from 2008 to 2015 (excluding outliers). The observations were conducted at monthly intervals in 15 observation wells (Figure 1). Among them, Sanjiang farm and Honghe farm exhibited little difference in groundwater depth from 2008 to 2010, so we applied arithmetic and average treatment for both. The monthly data were calculated as annual data, and according to the surface elevation of the observed position (55.6 m), the field observation data of groundwater level in the SJP from 1997 to 2015 were finally obtained. The data used in this study are summarized in Table 1.
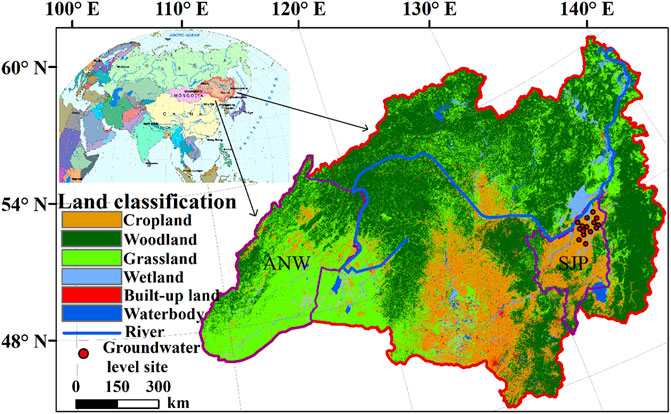
FIGURE 1. Schematic diagram of land classification in the ARB. The northwestern portion of the ARB (ANW) and the Sanjiang Plain (SJP) were selected as the target areas in this study.
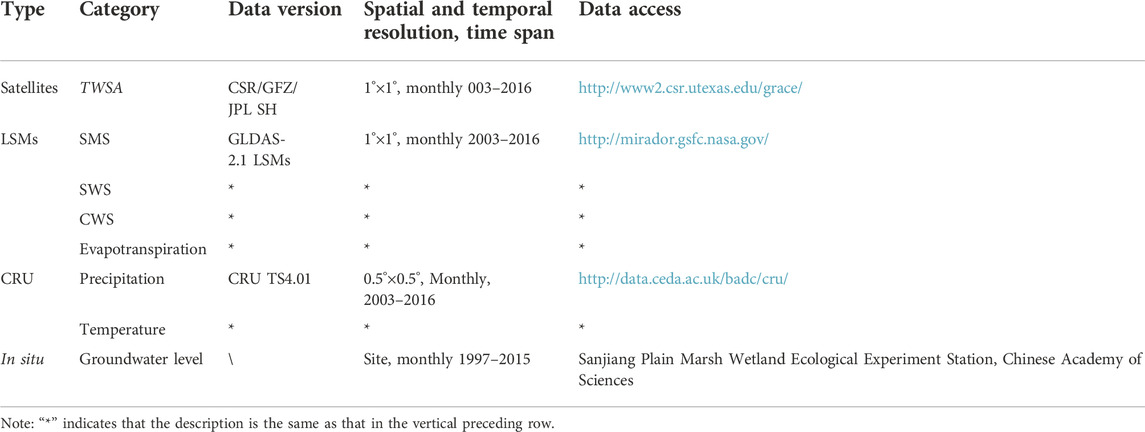
TABLE 1. Summary of the datasets utilized in this study.
Multivariable linear regression analysis
Groundwater storage is influenced by several interrelated factors, and it is difficult to accurately and comprehensively explain the effects of individual factors on groundwater storage. In this study, we accounted for the effects of temperature, rainfall, and evapotranspiration on groundwater storage. Therefore, we used multiple linear regression to calculate the contribution of environmental factors and other variables in the time series to GWSA (Philip G., 2018). The t-test was performed to determine statistical significance. The slope is a linear regression equation fitted using variables. The multiple linear regression model, which is used to express the inter-annual trend of the indicator, is given by:
where GWSA is the groundwater storage anomaly; X1 is precipitation; X2 is temperature; X3 is evapotranspiration, and a, b, and c are the coefficients of the three index factors.
We used R-Studio v1.1.463 software for multiple linear regression, and Origin 2017 software for correlation analysis.
Results
Temporal and spatial distribution of GWSA in the ARB
From 2003 to 2016, the GWSA of the ARB, obtained via inversion by GLDAS and the three institutions (CSR, GFZ, and JPL), showed an increasing trend; the annual variation rates were 2.0 mm/yr (CSR; Figure 2D), 2.4 mm/yr (GFZ; Figure 2E), and 2.2 mm/yr (JPL; Figure 2F). Spatially, the GWSA obtained by the three institutions (Figures 2A–C) showed a significant increase in the upstream portion of the ARB (Mongolia region), and a significant decrease in the downstream region (China’s Sanjiang Plain). In most of the northern portion of the ARB, the GWSA showed an increasing trend. In the southern portion of the ARB (within China), the GWSA showed a decreasing trend. The GWSA peaked in 2008, and after reaching its minimum in 2013, began to increase once again. Regardless of temporal or spatial distribution, the GWSA trends obtained via inversion by the three institutions did not differ significantly, reflecting the good performance of GRACE data in the ARB.
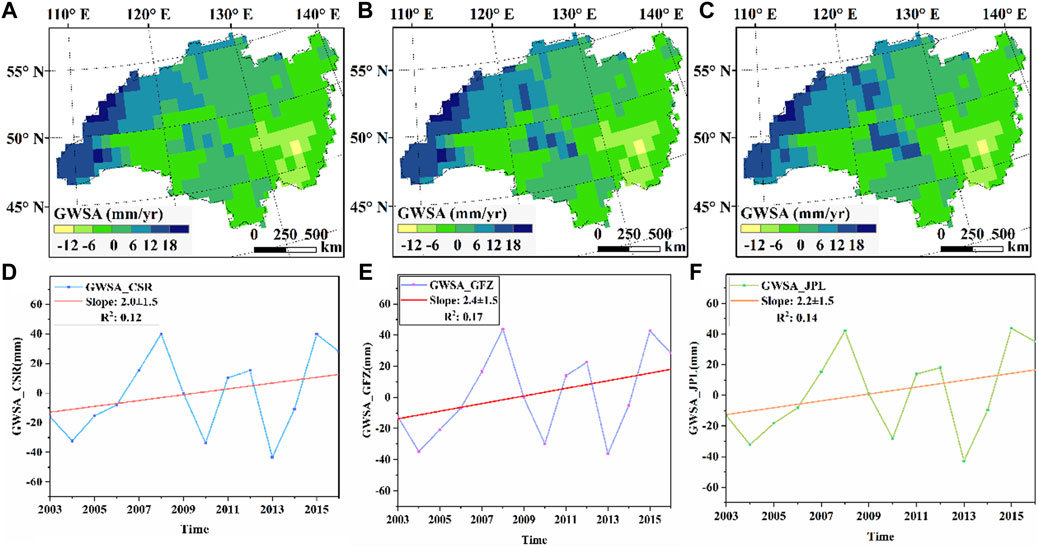
FIGURE 2. GWSA of ARB from 2003 to 2016 and spatiotemporal variation trends. The (A–C) are the spatial-year changes of GWSA in the ARB inversed by CSR, GFZ, and JPL. The (D–F) are the temporal-year changes of GWSA in the ARB inversed by CSR, GFZ, and JPL.
During the period 2003–2016, the fluctuations in the TWSA and SMSA+SWSA+CWSA were essentially consistent (Figure 3A), and the three types of GWSA exhibited a trend opposite to that displayed by SMSA+SWSA+CWSA (Figure 3B). TWSA peaked in March 2014, whereas GWSA exhibited peaks in June 2008 and June 2012.
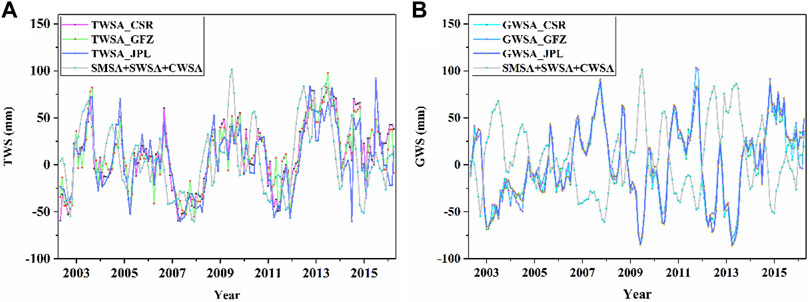
FIGURE 3. Comparative analysis of TWSA (A) and GWSA (B) with SMSA+SWSA+CWSA in ARB from 2003 to 2016.
The monthly GWSA, temperature (Tmp), precipitation (Pre), and evapotranspiration (ET) of the ARB for the 2003–2016 period are shown in Figure 4A. The annual average values of Pre and ET show an increasing trend (Figure 4B). Pre and ET are mainly concentrated in summer; Pre peaked in July 2013 and ET peaked in July 2014. Tmp fluctuated within a relatively small range. From 25 July to 19 August 2013, the ARB received the most extreme precipitation in its history. Moreover, from August to September of 2013, the ARB experienced the worst large-scale flooding event in its history. In 2007, the western part of Jilin Province suffered a severe drought during spring and summer.
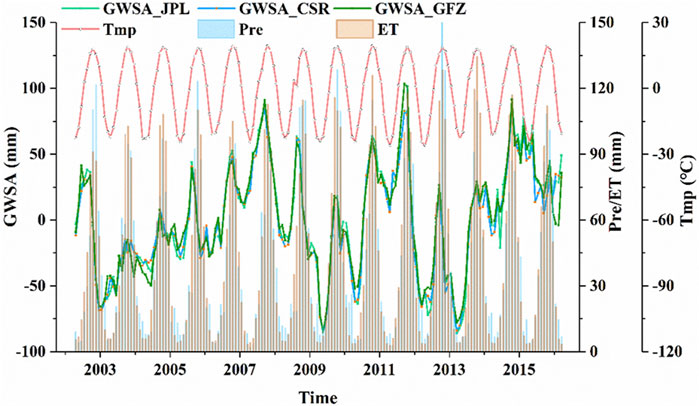
FIGURE 4. Comparison and analysis of GWSA, Pre, Tmp and ET of the ARB from 2003 to 2016.
Multivariate linear correlation analysis revealed that Pre and GWSA were positively correlated in some areas within the ANW (Figure 5A). At the eastern border and in some sourthern areas of the ARB, Pre and GWSA exhibited a more obvious negative correlation (Figure 5A). In most of the eastern and southern areas of the ARB, Tmp and GWSA exhibited a relatively obvious positive correlation (est > 0.4, p < 0.05), and were spatially continuous (Figure 5B). In most areas of the southern part of the ARB, ET and GWSA showed a relatively obvious negative correlation (est < −0.4, p < 0.05). At the northwestern border of the ARB and in the northern area near the lower reaches of the ARB, ET and GWSA showed more obvious negative correlation (Figure 5C).
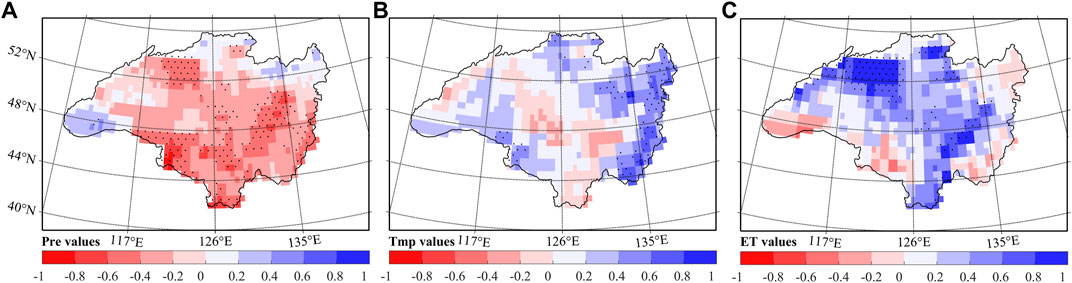
FIGURE 5. Multiple linear regression analysis of GWSA, Pre, Tmp and ET in the ARB. (A–C) respectively show the correlation between GWSA and Pre, Tmp, and ET. The black dots represent statistically significant at the p < 0.05 level.
Agricultural development and GWSA in the SJP
From 2003 to 2016, the GWSA of the SJP decreased at a rate of 7.0 mm/yr (Figure 6B). Spatially, the GWSA of all regions in the SJP showed a decreasing trend. Among them, the GWSA of the northeastern region of the SJP exhibited a higher rate of decline (GWSA < −8 mm/yr, Figure 6A), whereas the southern region of the SJP exhibited a lower rate of decline (GWSA > −4 mm/yr, Figure 6A). However, the overall rate of decline was greater than that of the GWSA of the ARB. From 1997 to 2015, the groundwater level of the SJP decreased at a rate of 0.28 m/yr (Figure 6B). The groundwater level during this period exhibited a trend that was relatively consistent with GWSA. The groundwater level of the SJP dropped by 5.53 m, from 47.28 m in 1997 to 41.75 m in 2016.
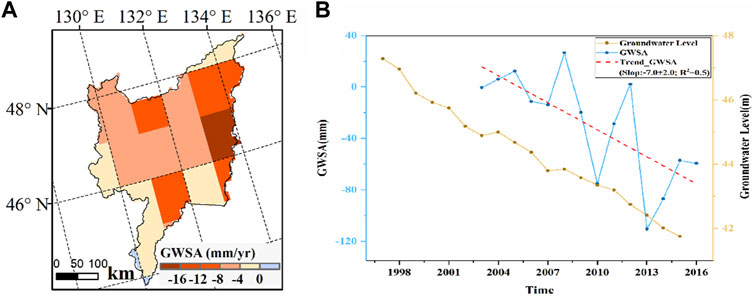
FIGURE 6. Spatial variation of GWSA in the SJP (A), and comparison between the measured groundwater level data (1997–2015) and GWSA (2003–2016) (B).
Since the 1950s, the type of land use in the SJP has changed significantly owing to agricultural expansion and urban development. Between the 1950s and the 1990s, the wetland area decreased most significantly (by approximately 2.72 million ha, Figure 7), whereas the dry land area increased most significantly (by approximately 2.2 million ha, Figure 7). The paddy area showed a sharp increase after 1990. The paddy area increased by about 1 million ha from 1990 to 2015, compared to an increase of about 0.35 million ha from 1950 to 1990 (Figure 7).

FIGURE 7. Land use change in the SJP from 1950 to 2015.
Temporal and spatial distribution of the GWSA in the ANW
From 2003 to 2016, the GWSA in the ANW increased at a rate of 11.3 mm/yr (Figure 8B). Both the western and southern border areas of the ANW showed a significant increase in GWSA (>10 mm/yr, Figure 8A), the GWSA in the eastern border area showed no significant increase, and the central area exhibited a slight decrease. However, the overall increase in the GWSA in the ANW exceeded that in the ARB. The GWSA in the ANW reached its peak in 2015. Between 2003 and 2016, the GWSA in the ANW exhibited an increasing trend in most years. In addition, rainfall and snowfall in the ANW region increased to varying degrees.
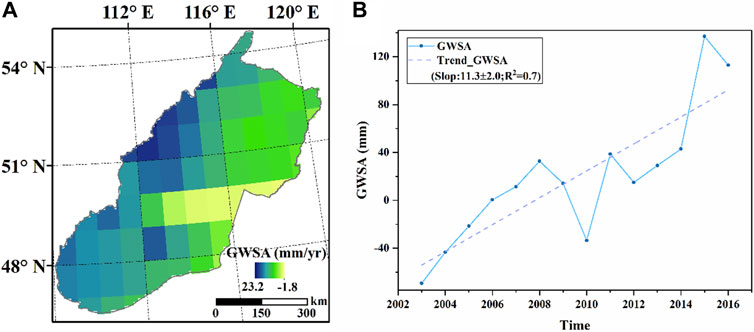
FIGURE 8. Temporal (B) and spatial (A) variation of GWSA in the ANW from 2003 to 2016.
Discussion
Effects of climate change on the GWSA
Climate change directly or indirectly affects changes in groundwater storage through changes in surface water and precipitation. The western part of the ARB is dominated by grasslands and is characterized by a high altitude and a dry climate that is influenced by the Siberian continental monsoon climate with low precipitation. Forest land and wetland are mainly distributed in the eastern part of the ARB, which has high precipitation and is influenced by the Pacific monsoon climate (Yan et al., 2016). The central part of the ARB is dominated by a typical continental monsoon climate that is influenced by the Mongolian high-pressure system. In winter, northwest winds are dominant, and the climate is cold and dry. In summer, hot and rainy days induced by the Pacific subtropical high are dominant (Han et al., 2008).
Seasonal variations in water flow in areas dominated by snowmelt may lead to significant changes in the regional hydrological cycle (Cayan et al., 2001). The melting of snow in the ARB in summer increases the process of groundwater recharge by soil moisture. Compared with non-climate drivers, changes in groundwater caused by climate change are relatively small, because groundwater systems tend to respond more slowly to climate change than surface water systems and have a large time lag (Hanson et al., 2006; Gurdak et al., 2007; Aribisala et al., 2015). However, continuous and severe drought will significantly change the hydraulic characteristics of aquifers, and variability in precipitation will impose stress on water resources. Although changes groundwater levels have a stronger correlation with precipitation than with temperature, the latter exerts a greater influence in shallow aquifers (Ahzegbobor, 2017). Based on daily snow cover data of the MOD10A1/MYD10A1 snow products after cloud removal, Lu et al. (2019) revealed a slight increase in the snow cover area of the ARB from 2002 to 2016 (Lu et al., 2019). This increase in the snow cover area augments the amount of snowmelt that supplies groundwater.
The degradation of permafrost caused by rising temperatures will reduce the capacity of permafrost to store water, and thus reduce winter runoff (Gao et al., 2016). In recent years, global warming has accelerated the degradation of permafrost, resulting in an increase in the recharge of groundwater from the permafrost. In permafrost regions, basins with greater permafrost cover exhibit reduced underground water storage, so the runoff in winter is low and that in summer is high in these basins (Yang et al., 2004; Woo et al., 2008). Moreover, an increase in the permafrost thawing depth will enhance the catchment capacity of the basin, which will increase the amount of water that is released into the base flow in winter and cause changes in evapotranspiration (Yue et al., 2016). In addition, the degradation of permafrost owing to climate change affects the recharge of groundwater by wetlands. Permafrost degradation results in a reduction in wetland area (Avis et al., 2011), which negatively affects the groundwater recharge process and increases the evapotranspiration of water resources. From the 1950s to the 2010s, the total area of permafrost in northeast China decreased from 4.8 × 10⁵ km2 to 3.1 × 10⁵ km2, and the total area of frozen soil decreased by 36.5% (Zhang et al., 2021). These phenomena considerably improved the groundwater recharge conditions in the ARB.
Extreme weather can also affect groundwater systems. Owing to climate change, extreme climate events such as the heat wave in the summer of 2010 and the catastrophic floods in 2013, have occurred frequently in the ARB (Yan et al., 2016). In the northern and central portions of the SJP, the shallow groundwater table rose in 2013 owing to the extreme rainfall (Liu et al., 2016). The depletion of groundwater reserves in 2006, 2009–2011, and 2014–2015 may be related to successive droughts during these periods, whereas the rapid recovery of groundwater reserves from the second half of 2011–2012 may be related to the occurrences of floods and the increases in precipitation (Chen et al., 2016). An increase in temperature will intensify the process of groundwater discharge (primarily the ET value). An increase in evapotranspiration reduces the recharge of groundwater via rainfall and surface water. Wang et al. (2015) found that the groundwater level in the Sanjiang Plain increased significantly after the summer flood in 2013. The summer flood in 2013 had a relatively small impact on shallow groundwater recharge in the eastern part of the Sanjiang Plain (Wang et al., 2015). The increase in the height of the groundwater and the rate of this increase were largest in the western part of the Sanjiang Plain. This could be attributed to the fact that the area is significantly affected by rivers (the Songhua River, Walken River, and other tributaries of the Songhua River) because of their well-developed drainage networks. In contrast, the increase in the height of the shallow groundwater and the rate of this increase were smaller in the eastern part of the Sanjiang Plain. This phenomenon may be attributed to the unusually high precipitation in the summer of 2013 and the large area of land used for agriculture in the region. In 2007, the western part of Jilin Province suffered severe continuous drought in spring and summer, resulting in the loss of 1.387 × 10⁶ ha of arable land. Liu et al. (2016) estimated that the total supply of extreme rainfall across the northern and central parts of the Sanjiang Plain in 2013 was about 41.14 × 10⁸ m3. The annual maximum change in groundwater depth is primarily between 1 and 3 m (Liu et al., 2016). After the extreme rainfall event in 2013, the shallow groundwater level in the northern and central parts of the Sanjiang Plain rose.
The rate of groundwater level decline also depends on land use and distance from rivers. Spatially, the variation of groundwater in irrigated areas is greater than that in non-irrigated areas and groundwater fluctuations in areas near rivers are smaller than those in non-irrigated areas. Zheng et al. (2020) used GRACE to estimate the GWSA of the Northeast China Plain from 2003 to 2016 to be 2.3 ± 0.7 mm/yr (Zheng et al., 2020), which is in good agreement with our results (2.0–2.4 mm/yr). Chang et al. (2015) used artificial neural networks to study the feedback of permafrost groundwater on the Qinghai-Tibet Plateau to climate change, and found that the temperature rises by 0.5°C–1.0°C per decade, the precipitation increases by 10%–20%, and the permafrost groundwater level is predicted to increase by 1.2%–1.4% or 2.5%–2.6% per year (Chang et al., 2015). Bao et al. (2019) investigated the impact of climate change and land cover change on the water balance of the middle reaches of the Yellow River and found that climate variability accounted for 75.8% of the runoff reduction from 1980 to 2000, whereas land cover change accounted for 75.5% of the runoff reduction from 2001 to 2016 (Bao et al., 2019).
Effects of agricultural development on the GWSA
The highly water storage capacity of wetlands has a considerable influence on groundwater recharge. The ARB’s wetlands account for 16% of the world’s wetlands (Mao et al., 2020). The large-scale distribution of wetlands increases the catchment capacity of the basin, which can increase the recharge cycle of groundwater and provide sufficient water for replenishment. The evapotranspiration of water resources was enhanced by wetland degradation caused by the expansion of agricultural land in the ARB (within China). In contrast, the wetland area in the ARB (within Russia) decrease continuously from 1980 to 2010, and then increased from 2010 to 2016; this phenomenon can be attributed to climate change (Mao et al., 2020). The SJP has typical wetland swamps, and the formation of wetlands is closely related to atmospheric precipitation, surface water, and groundwater (Yin et al., 2003). Large portions of the wetlands of the Zeya River at the source of the central freshwater ecotope of the ARB have been destroyed by the construction of a huge reservoir (Egidarev et al., 2016). From 1940 to 2009, the wetland area decreased by about 76%; the wetland area continues to decrease, and currently, the wetland area is less than 10% of its original value. Wetland reclamation in the SJP has increased water consumption through evapotranspiration and has changed the seasonal pattern of energy balance (Guo et al., 2021).
The large-scale reclamation of wetlands reduces the replenishment of groundwater for paddy fields and accelerates the consumption of groundwater. During the past 30 years, the area of the SJP used for paddy fields has expanded by more than 25 times, and the amount of groundwater extraction has increased by 10 times. The proportion of agricultural water used in Heilongjiang Province increased from 71.8% to 88.0% from 2004 to 2015 (Zou et al., 2018) due to the loss and degradation of wetlands. From 1980 to 2010, the total surface water storage capacity of the Sanjiang Plain was reduced by 4.19 × 10⁹ t, the soil storage capacity was reduced by 5.57 × 10⁹ t, and the wetland storage capacity was reduced by 9.47 × 10⁹ t. In 30 years, the wetland storage capacity reduced by nearly half its value (Zou et al., 2018). The amount of groundwater extraction (4.27 × 10⁸ m3/yr) in the Sanjiang Plain wetland-farmland system is about 2.0 times the sum of infiltration from precipitation, wetland, and irrigation (2.30 × 10⁸ m3/yr). Unbalanced groundwater replenishment and drainage is the main reason for the decrease in groundwater depth. Agriculture is relatively well-developed in this region, and the area of rice cultivation has been increasing (Liu et al., 2016; Xin et al., 2020). The irrigation of crops relies on groundwater, which has led to the continuous decline of groundwater levels in the region. Paddy cultivation occupies a large area in the Sanjiang Plain and is heavily dependent on groundwater irrigation; the annual water consumption for irrigation is approximately 45.6 × 10⁸ m3 (liu, 2009). During the period 2003–2016, the precipitation in the SJP exhibited an increasing trend (Liu et al., 2016), but the crops cultivated in the region were rice, corn, and other similar crops. The high demand for agricultural water and the severe degradation of wetlands have resulted in a decreasing trend in the groundwater storage in the region for more than a decade. Li and Jia (2013) showed that 47.2% of the entire arable area of the Jiansanjiang Farming Bureau region was under rice cultivation. A large amount of irrigation water was used to keep the rice paddies inundated (Li and Jia, 2013). About 1.38 × 10⁸ m3/yr of irrigation water infiltrated into the groundwater, accounting for 14.2% of the whole groundwater recharge volume (Li, 2007).
The widespread distribution of marshes in the SJP enables the storage of rainfall from adjacent channels and water systems during the rainy season (Liu et al., 2016), However, the construction of a large number of drainage channels in recent years has reduced the capacity of the marshes to store water and has negatively impacted groundwater recharge. Moreover, the construction of a large number of drainage ditches in the region has increased the regional hydrological gradient and accelerated the process of surface runoff. The forest vegetation at the source of the watershed has been destroyed, and as the proportion of winter snowfall converted into surface runoff has been decreasing, the capacity of forest soil to conserve water resources has been decreasing (Liu et al., 2011). The continuous decrease in groundwater storage in the SJP is also closely related to the significant temporal and spatial differences in groundwater replenishment. Snowmelt, which is concentrated in spring and early summer, and precipitation, which is concentrated during the rainy season, have higher recharge efficiencies (Wang et al., 2014). In situ groundwater level data from this region validate the reduction in groundwater storage inferred by inversion of GRACE data. A previous study has shown that drought conditions are developing in the SJP (Liu et al., 2011). Enhancing the restoration of wetland water resources and the balance of water for agricultural development in the region and improving the regional water storage capacity are essential to the water security of the SJP. The flood regulation of the internal water conservation project in the Sanjiang Plain negatively impacts the flooding process of the water system, thereby reducing the replenishment of surface water resources in the Sanjiang Plain (Liu et al., 2011) and resulting in a decrease in groundwater recharge.
The change in groundwater recharge in the southern part of the Jiansanjiang Farming Bureau region is significantly greater than that in the northern part (Wang et al., 2014). Xu et al. (2012) used δ18O and δD isotopes to prove that the groundwater in the Sanjiang Plain is mainly recharged by precipitation (Xu et al., 2012). Precipitation recharge mainly occurs during June and July, and this accounts for 53.5% of the total groundwater recharge (Wang et al., 2014). However, the sharp increase in agricultural water consumption has negated the effect of the increased precipitation, making it insufficient to replenish the amount of groundwater consumed.
Conclusion
In this study, we compared different GRACE TWS datasets and their influence on the estimation of the GWSA in the ARB in order to provide a basis for the choice of TWS plan for research. The GWSA was evaluated at the regional scale using long-term field observations of the groundwater level in the SJP combined with GRACE satellite data. The good agreement between the in situ groundwater level observations in the SJP and the estimated GWSA demonstrates the application potential of GRACE data for monitoring groundwater dynamics in the ARB. The study found that the GWSA of the ARB increased at a rate of 2.0–2.4 mm/yr from 2003 to 2016. In recent years, increased rainfall, snowmelt caused by rising temperatures, and the degradation of large areas of frozen soil in this region have increased groundwater recharge. The GWSA of the ARB exhibits significant spatial variation. The GWSA of the upstream portion of the ARB (ANW) shows an increasing trend (11.3 mm/yr), whereas the GWSA of the middle and downstream portions of the ARB (SJP) shows a decreasing trend (–7.0 mm/yr). The increase in the GWSA in the ANW can be attributed to the favorable surface and subsurface (lithosphere) conditions and the increase in precipitation, which are conducive to GWSA replenishment. The decrease in the GWSA in the SJP can be attributed to large-scale wetland degradation, the increase in the area under rice cultivation, and the construction of drainage ditches in the region, which has reduced the groundwater storage capacity. Temperature and evapotranspiration primarily influence changes in the GWSA by regulating the hydrothermal balance. The main source of groundwater loss is irrigation water that is needed to reclaim farmland. Future research should focus on the response of regional groundwater storage to long-term climate change and the mechanism underlying the interaction between permafrost degradation and surface and groundwater.
Data availability statement
The original contributions presented in the study are included in the article/supplementary material, further inquiries can be directed to the corresponding authors.
Author contributions
CS and YG conceived the idea for the paper. ZZ did the literature search and extracted data from relevant publications. ZZ led the writing of the paper and made the figures. All authors participated in writing and critically read the final MS.
Funding
This research was funded by the National Natural Science Foundation of China (No. 41730643, No. 42220104009).
Acknowledgments
The author would like to thank the NASA’s Earth Science Division the Goddard Earth Sciences (GES) Data and the Information Services Center (DISC) for providing the GLDAS data.
Conflict of interest
The authors declare that the research was conducted in the absence of any commercial or financial relationships that could be construed as a potential conflict of interest.
Publisher’s note
All claims expressed in this article are solely those of the authors and do not necessarily represent those of their affiliated organizations, or those of the publisher, the editors and the reviewers. Any product that may be evaluated in this article, or claim that may be made by its manufacturer, is not guaranteed or endorsed by the publisher.
References
Ahzegbobor, (2017). Summary of the potential impact of climate change on groundwater resources. J. Hydrol. 23, 159.
Aribisala, J. O., Awopetu, M. S., Ademiliua, O. L., Okunada, E. A., and Adebayo, W. O. (2015). Effect of climate change on groundwater resources in south west, Nigeria. J. Environ. Earth Sci. 5.
Avis, C. A., Weaver, A. J., and Meissner, K. J. (2011). Reduction in areal extent of high-latitude wetlands in response to permafrost thaw. Nat. Geosci. 4, 444–448. doi:10.1038/ngeo1160
Bao, Z., Zhang, J., Wang, G., Chen, Q., Guan, T., Yan, X., et al. (2019). The impact of climate variability and land use/cover change on the water balance in the Middle Yellow River Basin, China. J. Hydrol. X. 577, 123942. doi:10.1016/j.jhydrol.2019.123942
Baur, O., Kuhn, M., and Featherstone, W. E. (2009). GRACE-derived ice-mass variations over Greenland by accounting for leakage effects. J. Geophys. Res. 114, B06407. doi:10.1029/2008jb006239
Bhanja, S. N., Zhang, X. K., and Wang, J. Y. (2018). Estimating long-term groundwater storage and its controlling factors in Alberta, Canada. Hydrol. Earth Syst. Sci. 22, 6241–6255. doi:10.5194/hess-22-6241-2018
Bierkens, M. F. P. (2015). Modelling non-linear water table dynamics and specific discharge through landscape analysis. J. Hydrol. Amster. 3.
Bratkič, A., Šturm, M., Faganeli, J., and Ogrinc, N. (2012). Semi-annual carbon and nitrogen isotope variations in the water column of Lake Bled, NW Slovenia. Biogeosciences 9, 1–11. doi:10.5194/bg-9-1-2012
Cayan, D. R., Dettinger, M. D., Kammerdiener, S. A., Caprio, J. M., and Peterson, D. H. (2001). Changes in the onset of spring in the western United States. Bull. Am. Meteorol. Soc. 82, 399–415. doi:10.1175/1520-0477(2001)082<0399:citoos>2.3.co;2
Chang, J., Wang, G., and Mao, T. (2015). Simulation and prediction of suprapermafrost groundwater level variation in response to climate change using a neural network model. J. Hydrol. X. 529, 1211–1220. doi:10.1016/j.jhydrol.2015.09.038
Chen, H., Zhang, W., Gao, H., and Nie, N. (2018). Climate change and anthropogenic impacts on wetland and agriculture in the songnen and Sanjiang Plain, northeast China. Remote Sens. 10, 356. doi:10.3390/rs10030356
Chen, J. L. (2005). Spatial sensitivity of the gravity recovery and climate experiment (GRACE) time-variable gravity observations. J. Geophys. Res. 110, B08408. doi:10.1029/2004jb003536
Chen, K., Jiang, W. G., He, F. H., and Chen, Z. (2016). Analysis of the characteristics of China's water reserves change based on GRACE data. J. Nat. Res. 23. doi:10.11849/zrzyxb.20161349
Deng, H., and Chen, Y. (2016). Influences of recent climate change and human activities on water storage variations in Central Asia. J. Hydrology 544, 46–57. doi:10.1016/j.jhydrol.2016.11.006
Deng, H., Chen, Y., and Li, Y. (2019). Glacier and snow variations and their impacts on regional water resources in mountains. J. Geogr. Sci. 29 (1), 84–100. doi:10.1007/s11442-019-1585-2
Ding, Y., Ren, G. Y., Zhao, Z. C., Xu, Y., Luo, Y., Li, Q. P., et al. (2007). Detection, causes and projection of climate change over China: An overview of recent progress. Adv. Atmos. Sci. 24, 954–971. doi:10.1007/s00376-007-0954-4
Egidarev, E., Simonov, E., and Darman, Y. (2016). Amur-heilong river basin: Overview of wetland resources, 1–15. doi:10.1007/978-94-007-6173-5_7-2
Feng, W., Shum, C., Zhong, M., and Pan, Y. (2018). Groundwater storage changes in China from satellite gravity: An overview. Remote Sens. 10, 674. doi:10.3390/rs10050674
Feng, W., Zhong, M., Lemoine, J. M., Biancale, R., Hsu, H. T., and Xia, J. (2013). Evaluation of groundwater depletion in North China using the Gravity Recovery and Climate Experiment (GRACE) data and ground-based measurements. Water Resour. Res. 49, 2110–2118. doi:10.1002/wrcr.20192
Gao, T., Zhang, T., Cao, L., Kang, S., and Sillanpää, M. (2016). Reduced winter runoff in a mountainous permafrost region in the northern Tibetan Plateau. Cold Reg. Sci. Technol. 126, 36–43. doi:10.1016/j.coldregions.2016.03.007
Gong, H., Pan, Y., Zheng, L., Li, X., Zhu, L., Zhang, C., et al. (2018). Long-term groundwater storage changes and land subsidence development in the North China Plain (1971–2015). Hydrogeol. J. 26, 1417–1427. doi:10.1007/s10040-018-1768-4
Grotjahn, R., and Huynh, J. (2018). Contiguous US summer maximum temperature and heat stress trends in CRU and NOAA Climate Division data plus comparisons to reanalyses. Sci. Rep. 8, 11146. doi:10.1038/s41598-018-29286-w
Guo, Y., Song, C., Zhang, J., Wang, L., and Sun, L. (2021). Influence of wetland reclamation on land-surface energy exchange and evapotranspiration in the Sanjiang plain, Northeast China. Agric. For. Meteorol. 296, 108214. doi:10.1016/j.agrformet.2020.108214
Gurdak, J. J., Hanson, R. T., McMahon, P. B., Bruce, B. W., McCray, J. E., Thyne, G. D., et al. (2007). Climate variability controls on unsaturated water and chemical movement, high plains aquifer, USAVadose zone J. 6. USA, 533–547. doi:10.2136/vzj2006.0087
Han, S. C. (2005). Precise determination and inversion of low-low satellite-to-satellite tracking data for regional time-variable gravity. J. Immunol. 10. doi:10.1111/j.1537-2995.1973.tb04464.x
Han, S. C., Shum, C. K., Jekeli, C., and Alsdorf, D. (2005). Improved estimation of terrestrial water storage changes from GRACE. Geophys. Res. Lett. 32. doi:10.1029/2005gl022382
Han, Z. S., Jayakumar, R., Ke, L., Hao, W., and Rui, C. (2008). Review on transboundary aquifers in people's republic of China with case study of Heilongjiang-Amur River basin. Environ. Geol. 54, 1411–1422. doi:10.1007/s00254-007-0922-4
Hanson, R. T., Dettinger, M. D., and Newhouse, M. W. (2006). Relations between climatic variability and hydrologic time series from four alluvial basins across the southwestern United States. Hydrogeol. J. 14, 1122–1146. doi:10.1007/s10040-006-0067-7
Harris, I. C., and Jones, P. D. (2017). Cru TS4.01: Climatic Research Unit (CRU) Time-Series (TS) version 4.01 of high-resolution gridded data of month-by-month variation in climate. England: Centre for Environmental Data Analysis. Jan. 1901- Dec. 2016). doi:10.5285/58a8802721c94c66ae45c3baa4d814d0
He, P., Sun, Z., Han, Z., Ma, X., Zhao, P., Liu, Y., et al. (2020). Divergent trends of water storage observed via gravity satellite across distinct areas in China. Water 12, 2862. doi:10.3390/w12102862
IPCC (Intergovernmental Panel on Climate Change) (2013). Climate change and water. United Kingdom: IPCC.
Konikow, L. F. (2011). Contribution of global groundwater depletion since 1900 to sea-level rise. Geophys. Res. Lett. 38. doi:10.1029/2011gl048604
Konikow, L. F., and Kendy, E. (2005). Groundwater depletion: A global problem. Hydrogeol. J. 13, 317–320. doi:10.1007/s10040-004-0411-8
Landerer, F. W., Dickey, J. O., and Güntner, A. (2010). Terrestrial water budget of the Eurasian pan-Arctic from GRACE satellite measurements during 2003–2009. J. Geophys. Res. 115, D23115. doi:10.1029/2010jd014584
Li, H. Y., and Jia, L. N. (2013). Spatial and temporal characteristics of groundwater dynamic in Jiansanjiang area, Heilongjiang province. Res. Gate 8.
Li, W. C. (2007). Research on evaluation and prediction of groundwater resources in Jiansanjiang reclamation are. Northeast Agricultural University. MD thesis.
Li, W., Wang, W., Zhang, C., Wen, H., Zhong, Y., Zhu, Y., et al. (2019). Bridging terrestrial water storage anomaly during GRACE/GRACE-FO gap using ssa method: A case study in China. Sensors (Basel) 19, 4144. doi:10.3390/s19194144
Li, Y. F., Wang, J. L., and Zhu, J. X. (2016). Analysis of Mongolian landscape based on geographical division. Arid. Zone Geogr. 4, 817–827. doi:10.13826/j.cnki.cn65-1103/x.2016.04.017
liu, D., Fu, Q., Ma, Y., and Sun, A. (2009). Annual precipitation series multiple time scale Analysis of major grain production regions in Sanjiang Plain. Int. Fede. Imform. Process. 293, 563. doi:10.19720/j.cnki.issn.1005-9369.2009.12.010
Liu, Y. Y., Jiang, X., Zhang, G. X., Xu, Y. J., Wang, X. H., and Qi, P. (2016). Assessment of shallow groundwater recharge from extreme rainfalls in the Sanjiang Plain, northeast China. Water 8, 440. doi:10.3390/w8100440
Liu, Z. M., Xia, G. L., Lv, X. G., and Chen, Z. K. (2011). Response of water cycle processes in Sanjiang Plain to human activities and climate change in recent 50 years. South-to-North Water Divers. Water Sci. Technol. 9, 68–74. doi:10.3724/sp.j.1201.2011.01068
Liu, Z., Xia, G., Lv, X., and Chen, Z. (2011). Response of water cycle processes in Sanjiang Plain to human activities and climate change in recent 50 years. South-to-North Water Divers. Water Sci. Technol. 9, 68–74. doi:10.3724/sp.j.1201.2011.01068
Long, D., Chen, X., Scanlon, B. R., Wada, Y., Hong, Y., Singh, V. P., et al. (2016). Have GRACE satellites overestimated groundwater depletion in the Northwest India Aquifer? Sci. Rep. 6, 24398. doi:10.1038/srep24398
Long, D., Longuevergne, L., and Scanlon, B. R. (2015a). Global analysis of approaches for deriving total water storage changes from GRACE satellites. Water Resour. Res. 51, 2574–2594. doi:10.1002/2014wr016853
Long, D., Pan, Y., Zhou, J., Chen, Y., Hou, X. Y., Hong, Y., et al. (2017). Global analysis of spatiotemporal variability in merged total water storage changes using multiple GRACE products and global hydrological models. Remote Sens. Environ. 192, 198–216. doi:10.1016/j.rse.2017.02.011
Long, D., Scanlon, B. R., Longuevergne, L., Sun, A. Y., Fernando, D. N., and Save, H. (2013). GRACE satellite monitoring of large depletion in water storage in response to the 2011 drought in Texas. Geophys. Res. Lett. 40, 3395–3401. doi:10.1002/grl.50655
Long, D., Yang, Y., Wada, Y., Hong, Y., Liang, W., Chen, Y., et al. (2015b). Deriving scaling factors using a global hydrological model to restore GRACE total water storage changes for China's Yangtze River Basin. Remote Sens. Environ. 168, 177–193. doi:10.1016/j.rse.2015.07.003
Lu, X. L., Zhang, W. C., Niu, Q., Liu, J., and Gao, H. (2019). Research Gate.Spatio-temporal dynamics of snow cover in Amur River Basin and its relationship with climate factors.
MacDonald, A. M., Bonsor, H. C., Ahmed, K. M., Burgess, W. G., Basharat, M., Calow, R. C., et al. (2016). Groundwater quality and depletion in the Indo-Gangetic Basin mapped from in situ observations. Nat. Geosci. 9, 762–766. doi:10.1038/ngeo2791
Mao, D., Tian, Y., Wang, Z., Jia, M., Du, J., and Song, C. (2020). Wetland changes in the Amur River Basin: Differing trends and proximate causes on the Chinese and Russian sides. J. Environ. Manage. 111670, 111670. doi:10.1016/j.jenvman.2020.111670
Mo, R. G., Shao, X. M., and Zhao, Y. Q. (2002). Discussion on the enrichment law of groundwater in cenozoic basalt in ximeng area, inner Mongolia. Inner Mongolia Coal Economy, 25.
Moghim, S. (2020). Assessment of water storage changes using GRACE and GLDAS. Water Resour. manage. 34, 685–697. doi:10.1007/s11269-019-02468-5
Moiwo, J. P., Lu, W., and Tao, F. (2012). GRACE, GLDAS and measured groundwater data products show water storage loss in Western Jilin, China. Water Sci. Technol. 65, 1606–1614. doi:10.2166/wst.2012.053
Myneni, R. B., Keeling, C. D., Tucker, C. J., Asrar, G., and Nemani, R. R. (1997). Increased plant growth in the northern high latitudes from 1981 to 1991. Nature 386, 698–702. doi:10.1038/386698a0
Nanteza, J., de Linage, C. R., Thomas, B. F., and Famiglietti, J. S. (2016). Monitoring groundwater storage changes in complex basement aquifers: An evaluation of the GRACE satellites over East Africa. Water Resour. Res. 52, 9542–9564. doi:10.1002/2016wr018846
Oguntunde., Philip G., Lischeid., Gunnar, and Dietrich., Ottfried (2018). Relationship between rice yield and climate variables in southwest Nigeria using multiple linear regression and support vector machine analysis. Int. J. Biometeorol. 62, 459–469. doi:10.1007/s00484-017-1454-6
Oki, T., and Kanae, S. (2006). Global hydrological cycles and world water resources. Science 313, 1068–1072. doi:10.1126/science.1128845
Peng, C., Zhou, X. H., and Ku, A. B. (2017). Review on the domestic applications of GRACE gravity satellite data. Ocean. Mapp. 37, 3. doi:10.3969/j.issn.1671-3044.2017.06.003
Rodell, M., Houser, P. R., Jambor, U., Gottschalck, J., Mitchell, K., Meng, C. J., et al. (2004). The global land data assimilation system. Bull. Am. Meteorol. Soc. 85, 381–394. doi:10.1175/bams-85-3-381
Rodell, M., Velicogna, I., and Famiglietti, J. S. (2009). Satellite-based estimates of groundwater depletion in India. Nature 460, 999–1002. doi:10.1038/nature08238
Scanlon, B. R., Longuevergne, L., and Long, D. (2012). Ground referencing GRACE satellite estimates of groundwater storage changes in the California Central Valley, USA. Water Resour. Res. 48. doi:10.1029/2011wr011312
Smerdon, B. D. (2017). A synopsis of climate change effects on groundwater recharge. J. Hydrol. X. 555, 125–128. doi:10.1016/j.jhydrol.2017.09.047
Swenson, S., and Wahr, J. (2002). Methods for inferring regional surface-mass anomalies from Gravity Recovery and Climate Experiment (GRACE) measurements of time-variable gravity. J. Geophys. Res. 107, ETG 3-1–ETG 3-13. doi:10.1029/2001jb000576
Tapley, B. D., Bettadpur, S., Ries, J. C., Thompson, P. F., and Watkins, M. M. (2004). GRACE measurements of mass variability in the Earth system. Science 305, 503–505. doi:10.1126/science.1099192
Tapley, B. D., Watkins, M. M., Flechtner, F., Reigber, C., Bettadpur, S., Rodell, M., et al. (2019). Contributions of GRACE to understanding climate change. Nat. Clim. Chang. 9, 358–369. doi:10.1038/s41558-019-0456-2
Taylor, R. G., Scanlon, B., Döll, P., Rodell, M., van Beek, R., Wada, Y., et al. (2012). Ground water and climate change. Nat. Clim. Chang. 3, 322–329. doi:10.1038/nclimate1744
Wahr, J., Swenson, S., Zlotnicki, V., and Velicogna, I. (2004). Time-variable gravity from GRACE: First results. Geophys. Res. Lett. 31. doi:10.1029/2004gl019779
Wang, A. P. (2010). Analysis and prospect of the status quo of groundwater monitoring in my country. Hydrology 25, 13. doi:10.3969/j.issn.1000-0852.2010.06.013
Wang, L. L., Song, C. C., and Guo, Y. D. (2016). The spatiotemporal distribution of dissolved carbon in the main stems and their tributaries along the lower reaches of Heilongjiang River Basin, Northeast China. Environ. Sci. Pollut. Res. 23, 206–219. doi:10.1007/s11356-015-5528-x
Wang, X. H., Zhang, G. X., and Xu, Y. J. (2014). Spatiotemporal groundwater recharge estimation for the largest rice production region in Sanjiang Plain, Northeast China. J. Water Supply Res. Technol. Aqua 63, 630–641. doi:10.2166/aqua.2014.024
Wang, X., Zhang, G. X., Jun, Y., and Sun, G. (2015). Identifying the regional-scale groundwater-surface water interaction on the Sanjiang Plain, Northeast China. Environ. Sci. Pollut. Res. 22, 16951–16961. doi:10.1007/s11356-015-4914-8
Wang, X., Zhang, G., and Xu, Y. (2015). Impacts of the 2013 extreme flood in northeast China on regional groundwater depth and quality. Water 7, 4575–4592. doi:10.3390/w7084575
Wang, Z., Song, K., Ma, W., Ren, C., Zhang, B., Liu, D., et al. (2011). Loss and fragmentation of marshes in the Sanjiang Plain, northeast China, 1954–2005. Wetlands 31, 945–954. doi:10.1007/s13157-011-0209-0
Woo, M.-K., Kane, D. L., Carey, S. K., and Yang, D. (2008). Progress in permafrost hydrology in the new millennium. Permafr. Periglac. Process. 19, 237–254. doi:10.1002/ppp.613
Xiang, L., Wang, H., Steffen, H., Wu, P., Jia, L., Jiang, L., et al. (2016). Groundwater storage changes in the Tibetan Plateau and adjacent areas revealed from GRACE satellite gravity data. Earth Planet. Sci. Lett. 449, 228–239. doi:10.1016/j.epsl.2016.06.002
Xie, X., Xu, C., Wen, Y., and Li, W. (2018). Monitoring groundwater storage changes in the loess plateau using GRACE satellite gravity data, hydrological models and coal mining data. Remote Sens. 10, 605. doi:10.3390/rs10040605
Xin, F., Xiao, X., Dong, J., Zhang, G., Zhang, Y., Wu, X., et al. (2020). Large increases of paddy rice area, gross primary production, and grain production in Northeast China during 2000-2017. Sci. Total Environ. 711, 135183. doi:10.1016/j.scitotenv.2019.135183
Xu, Y., Yan, B., Luan, Z., Zhu, H., and Wang, L. (2012). Application of stable isotope tracing technologies in identification of transformation among waters in Sanjiang Plain, Northeast China. Chin. Geogr. Sci. 23, 435–444. doi:10.1007/s11769-012-0578-1
Yan, B., Xia, Z., Huang, F., Guo, L., and Zhang, X. (2016). Climate change detection and annual extreme temperature analysis of the Amur River basin. Adv. Meteorology, 1–14. doi:10.1155/2016/6268938
Yan, F., Zhang, S., Liu, X., Yu, L., Chen, D., Yang, J., et al. (2017). Monitoring spatiotemporal changes of marshes in the Sanjiang Plain, China. Ecol. Eng. 104, 184–194. doi:10.1016/j.ecoleng.2017.04.032
Yang, D., Ye, B., and Kane, L. D. (2004). Streamflow changes over siberian yenisei river basin. J. Hydrol. X. 296, 59–80. doi:10.1016/j.jhydrol.2004.03.017
Yin, X., Chu, Y., and Yang, W. (2003). Relationships between marsh and precipitation, terrain surface water, ground water in Sanjiang Plain. Chin. J. Eco-Agriculture 11, 157.
Yue, G., Sheng, Y., Zhang, Y., Li, J., Ding, Y., Ye, B., et al. (2016). Response of hydrological processes to permafrost degradation from 1980 to 2009 in the upper Yellow River basin, China. Hydrol. Res. 47, 1014–1024. doi:10.2166/nh.2016.096
Zhang, Z. Q., Wu, Q.-B., Hou, M. T., Tai, B.-W., and An, Y. K. (2021). Permafrost change in northeast China in the 1950s–2010s. Adv. Clim. Change Res. 12, 18–28. doi:10.1016/j.accre.2021.01.006
Zheng, L., Pan, Y., Gong, H., Huang, Z., and Zhang, C. (2020). Comparing groundwater storage changes in two main grain producing areas in China: Implications for sustainable agricultural water resources management. Remote Sens. 12, 2151. doi:10.3390/rs12132151
Keywords: groundwater storage, grace, climate change, Amur River Basin, agricultural expansion
Citation: Zhang Z, Song C, Guo Y, He P, Chen N, Liu J, Zhang Y, Zuo Y and Zhang X (2023) Effects of climate change and agricultural expansion on groundwater storage in the Amur River Basin. Front. Earth Sci. 10:1037688. doi: 10.3389/feart.2022.1037688
Received: 06 September 2022; Accepted: 27 September 2022;
Published: 09 January 2023.
Edited by:
Guobin Fu, CSIRO Land and Water, AustraliaReviewed by:
Haijun Deng, Fujian Normal University, ChinaZhiming Han, Northwest A & F University, China
Copyright © 2023 Zhang, Song, Guo, He, Chen, Liu, Zhang, Zuo and Zhang. This is an open-access article distributed under the terms of the Creative Commons Attribution License (CC BY). The use, distribution or reproduction in other forums is permitted, provided the original author(s) and the copyright owner(s) are credited and that the original publication in this journal is cited, in accordance with accepted academic practice. No use, distribution or reproduction is permitted which does not comply with these terms.
*Correspondence: Changchun Song, c29uZ2NjQGlnYS5hYy5jbg==; Yuedong Guo, Z3VveXVlZG9uZ0BpZ2EuYWMuY24=