 Changliang Shao
 Yakai Guo2
- 1CMA Meteorological Observation Centre, Beijing, China
- 2CMA Henan Meteorological Bureau, Zhengzhou, China
- 3Beijing Tianhe Xiangyun Culture Media Limited Company, Beijing, China
Two soil moisture content analysis products, each with a spatial resolution of 0.0625° and a temporal resolution of 1 h from 1 October 2015 to 1 October 2021 in the Jing-Jin-Ji area, have been developed and evaluated. Using a quality control (QC) scheme based on the biweight method and a successive correction method (SCM) with different weighting functions introduced from the Cressman and/or Barnes methods, the soil moisture collected from China Land Data Assimilation System version 2.0 was taken as the background data. Two soil analysis products with induced hourly station soil observations were constructed and further compared with in situ observations and satellite products. Results show that with the biweight method, the outliers of soil moisture could be identified, and that the number of these was less than 10% of the actual reported samples. The analysis product is more accurate with the Cressman weighting function than with the Barnes as the root mean square error was reduced by 30% to 0.06, while the correlation coefficient increased by 73% to 0.59, compared to the control. These results indicate that the Cressman product is a useful and promising soil moisture data set. The proposed Cressman method is computationally simple and efficient, so the product can be easily updated to keep pace with significant increases in the volume of soil moisture data. The methods used here for QC, SCM, and comparison could help evaluate and improve land surface models and their soil moisture products.
1 Introduction
A regional climate can be affected by soil moisture, which can change the latent and sensible heat transported to the atmosphere, the reflectance of the surface, and the heat capacity of the ground. Soil moisture also plays an important role in medium- and small-scale atmospheric processes (Ma et al., 2001). Thus, it is important to properly use soil moisture data in the land surface model and to correctly understand the mechanisms underlying the interaction between the atmosphere and soil moisture (Pan and Mahrt, 1987; Chen et al., 1997; Gaertner et al., 2010; Seneviratne et al., 2010; Vereecken et al., 2014; Li et al., 2019; Shi et al., 2019; Song et al., 2019). The accurate measurement of soil moisture is very important for accurately understanding its role in atmospheric and climate processes. Good-quality soil moisture observation is also needed to improve a numerical model and soil moisture data assimilation (Kim and Wang, 2007; Li et al., 2012; Li et al., 2015; Ju et al., 2019). Research on soil moisture variation can be hindered because of the lack of observations with high temporal and spatial resolution (Seneviratne et al., 2010). Therefore, studies of soil moisture content usually depend on retrieved soil moisture data (Lai et al., 2014; Zhu et al., 2019). Remote sensing data from satellites can be used to produce a soil moisture product with high spatial resolution (Njoku et al., 2003; Parkinson, 2003; Qiao et al., 2007; Dabboor et al., 2019). However, low temporal resolution does reduce the accuracy of soil moisture retrieval when such data are used in numerical models (Lan et al., 2015; Fereidoon et al., 2019).
Powered by developing technologies for ground-based soil moisture monitoring, automatic devices have been developed and widely applied (Susha et al., 2014). Since 2004, the China Meteorological Administration has conducted a systematic project of generating soil moisture data using automatic monitoring devices. This project has been in operation since 2009. As of 2020, 2,400 observation stations had been established. In general, the automatic observation system for monitoring soil moisture in China has been developed mainly based on frequency domain reflectometry (Minet et al., 2010). In addition, the data volume and coverage have exceeded all previous traditional manual soil moisture observations. Recently, a growing number of researchers have been utilizing those automatically measured soil moisture data (Zhu and Shi, 2014; Wang and Gong, 2018).
However, automatic soil moisture stations are still sparse, and the spatial distribution of observations from the station system is nonuniform. These constraints have resulted in poor applications of the station data. Thus, a gridded analysis product with soil observations is needed, whereas the successive correction method (SCM) could be selected as a primary regular way of merging station data when considering applications in grid space. The advantage of SCM is that signals with different scales can be captured according to predefined weighting factors. Unlike other assimilation methods such as OI, 3DVAR, and EnKF, SCM needs neither the background error covariance nor the assumption of Gaussian errors of background and observation. Thus, given the sparse distribution of soil moisture data and the nonlinearity of the land surface model or the system, SCM is easier for implementing gridded product analysis and updates to keep pace with large increases in the volume of soil moisture data. In this work, the Cressman scheme (Cressman, 1959; Li, et al., 2017) and the Barnes scheme (Koch, 1983) are used as weighting factors. On this basis, the automatic soil moisture data for the areas of Beijing city, Tianjin city, and Hebei province were integrated into the China Land Data Assimilation System (CLDAS) version 2.0 dataset (Shi et al., 2014) to conduct the hourly soil moisture analysis from 1 October 2015 to 1 October 2021. This area is called Jing-Jin-Ji for short and is located in the middle of northern China. The newly constructed gridded analysis datasets were compared and evaluated against in situ data and Soil Moisture Active Passive (SMAP) satellite retrievals (Entekhabi et al., 2010). Ultimately, the dataset with higher quality can be used for further process studies, as well as for the validation and evaluation of other soil moisture products.
In the following sections, we first introduce the background data from CLDAS V2.0 and the station data (Section 2.1). The quality control (QC) methods are presented (Section 2.2). The algorithms for SCM and validation (Section 2.3) and the experimental design (Section 2.4) are then described. In Section 3, we describe several synthetic experiments to investigate their performances. In Section 4, the results of these cases are discussed. Conclusions are drawn last, in Section 5.
2 Experiments
2.1 CLDAS soil data and station soil data
The CLDAS V2.0 dataset, established and updated by CMA, contains hourly 0.0625° near-surface meteorological variables for mainland China from 2008 to 2021. This dataset merges surface measurements from over 2,400 national automatic weather stations and approximately 40,000 regional CMA automatic weather stations with 0.125° 3-hourly numerical analysis/predicted products from the European Centre for Medium-Range Weather Forecasts to produce the near-surface wind speed, air temperature, and specific humidity. Using these ongoing near-surface data to force the offline land surface model, the finer land products were determined, the accuracy of which depends mainly on the quality of the atmospheric forcing data (Liu, et al., 2019). For this study, the soil moisture product from CLDAS V2.0 was selected as background data to combine with the station soil moisture observations.
This study observed soil moisture volumetric content on the hourly scale, as measured by the automatic soil moisture observation system, including 417 stations lying loosely in the Jing-Jin-Ji area, as shown in Figure 1. It should be noted that all raw soil moisture data used here are in situ observations.
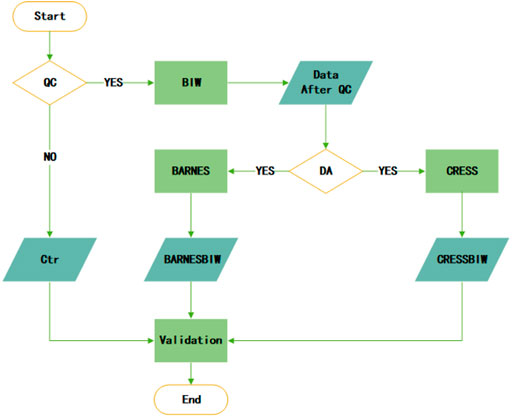
FIGURE 1. Experimental flowchart.
2.2 Quality control
First, extreme values of soil moisture content (larger than 65%) and missing data from the raw data were eliminated. Then, to check the consistency of the background, the biweight technique—which was first described by Lanzante (1996) and further introduced into high spatial-temporal resolution soil moisture applications by Shao et al. (2020)—was applied to remove occasional outliers. The biweight function was defined using the following equation:
where the observation bias
For a given value of
2.3 Data fusion and validation
The SCM can be generally written as follows:
The
The Cressman scheme is defined as follows:
In Eq. 6,
The Cressman scheme with three iterations (Eqs 5, 6) was used in this study to conduct the hourly soil moisture analysis. The scan radii
In the meantime, a refined Barnes scheme was used for comparison. This scheme was originally proposed and refined by Barnes (1964, 1973) and is similar to the Cressman scheme. The main difference between the methods is how they compute the weighting factor,
where
In this study, SMAP retrievals and station observations were used to compare against and/or validate the analysis obtained from each experiment over various temporal and spatial scales. Four metrics (i.e., root mean square error [RMSE], correlation coefficient [Corr], skewness [SKEW], and kurtosis [KURT]) were calculated as follows.
where
2.4 Experiment description
To efficiently induce the station soil moisture data into the grid products, QC and assimilation (DA) were the primary assignment. A brief description of the main procedures of this work is given in Figure 1. The QC process based on the biweight method was carried out using the available station observations. The Ctr was first taken as a comparison candidate and was conducted to generate two comparison candidates, following the assimilation process based on SCM with the diversity of weighting factor. Finally, cross-validation among the different candidate products and validation data was further conducted.
The hourly CLDAS V2.0 soil moisture product was used as the ongoing background data during station soil moisture assimilation. All types of datasets, including CLDAS V2.0, SMAP data, and station data in this study, concentrated on the area 113.2E∼120.0E, 36.0N∼42.7N, which covers Jing-Jin-Ji, as shown in Figure 2.
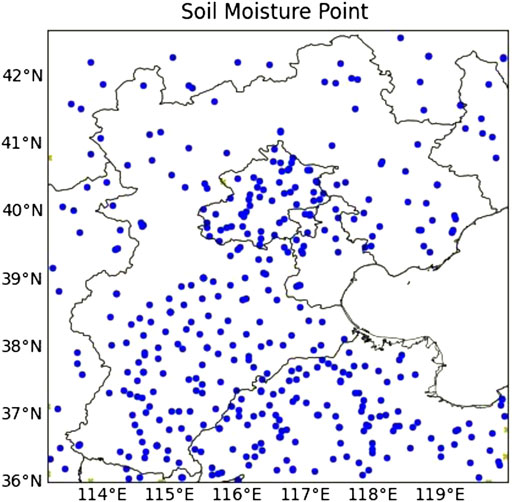
FIGURE 2. Distribution of the soil moisture station in Jing-Jin-Ji.
In addition, as shown in Table 1, data in the Ctr experiment (known as the control experiment) collected from the CLDAS V2.0 soil moisture product had no QC nor assimilation. Meanwhile, the experiments BARNESBIW and CRESSBIW both used the biweight method during QC and applied the SCM method with Barnes and Cressman weight factors, respectively, during observation assimilation. Moreover, to objectively verify the differences between various grid products, station observation and SMAP retravel data were used to compare against the three products, using evaluation indicators including RMSE, Corr, SKEW, and KURT.

TABLE 1. Experimental design.
3 Results
3.1 QC of the station soil moisture
QC was conducted before assimilation as the CLDAS V2.0 grid data are continuously spatial and temporal, whereas raw station observations are discrete, to avoid assimilation distortion induced by countless differences with non-Gaussian noises between background and observation. When all observation and background samples were compared at the station points, the non-Gaussian noises could be greatly improved (Shao et al., 2020).
As shown in Figure 3, our datasets include a total of 720 hourly observations collected at 417 stations from 1 September to 1 October 2020, with one observation record per hour at each station. A total of 300,240 elements were recorded. After rejecting extreme values and missing data, the number of actual records was 292,308, accounting for about 97.36% of the actual reported elements, while after QCBIW, the number of rejected records was 276,518 and the corresponding percentages among actually reported records about 7.7%. Overall, about 10% of the raw data were rejected in total.
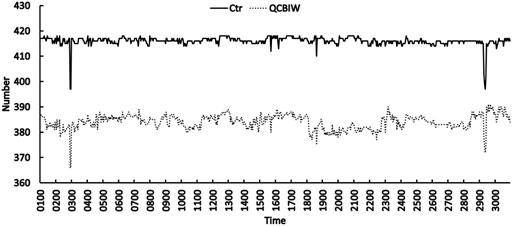
FIGURE 3. Hourly numbers of actual reported (solid line) and valid samples after QC (dotted line) from 1 September to 1 October 2020.
It should be noted that the ongoing results show more consistent behavior during QC, as compared to former research (Shao et al., 2020), because the actual reported rate during the whole QC procedure was higher in this paper. This indicates that SCMs assimilate more realistic soil moisture data into CLDAS V2.0 products.
3.2 Comparisons against station observations
To assess how the two schemes behave differently during the DA process, it was necessary to compare analysis data with station data. Station soil moisture data were used to calculate the RMSEs and Corrs of experiment results. Eighty percent of the whole-station data records after QC (Section 3.1) were used in data fusion, while the remaining 20% were used for additional independent validation. Next, we take the first soil layer, with more temporal-spatial variants, as an example.
The RMSE and Corr between the station and gridded data during the first soil layer [e.g., RMSE (1) and Corr (1)] for each experiment are shown in Figure 4. While distinguished boundary gaps can be found among different soil moisture products, both the CRESS and BARNES experiments can produce better soil moisture than the background (Ctr); at the same time, it is also clear that CRESS is superior to BARNES. In addition, we compared the available ESSMRA data (Naz et al., 2020), which provides long-term surface soil moisture at a high spatiotemporal resolution, with our results. Satellite-derived soil moisture data were assimilated into the community land model (CLM3.5) using an ensemble Kalman filter scheme in ESSMRA. Table 2 shows the average RMSE and Corr values for each experiment, as well as the ESSMRA results. It also shows that the CRESS scheme is superior to the Ctr, BARNES scheme, and ESSMRA, which coincides with the result shown in Figure 4.
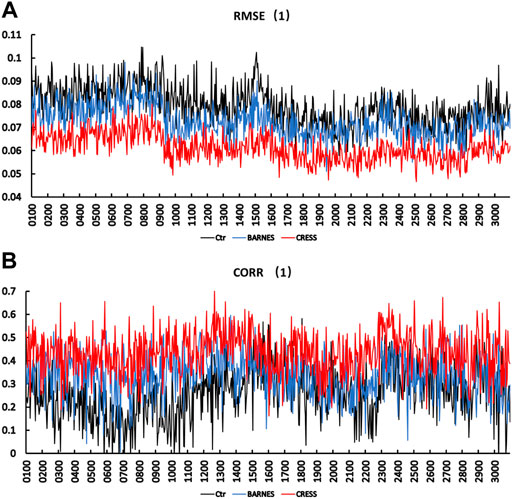
FIGURE 4. Hourly RMSEs (A) and Corrs (B) between station observations and products of each experiment from 1 September to 1 October 2020, including Ctr (black lines), BARNES (blue lines), and CRESS (red lines).
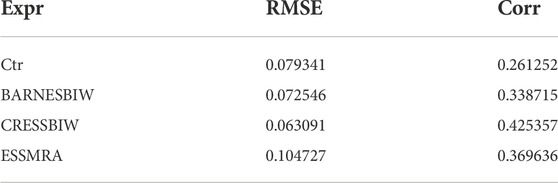
TABLE 2. Average calculation of hourly RMSEs and Corrs between station observations and each product of Ctr, CRESSBIW, and BARNESBIW.
Overall, these results show improved station scale soil moisture when observation was properly induced (e.g., smaller RMSE and larger Corr in CRESS, when compared to observations, than for both in BARNES or Ctr). This indicates that the widely used Cressman weighting factor (e.g., ocean data assimilation) is also suitable for the soil moisture data fusion scheme, and the results of the station scale promise to be statistically improved.
3.3 Comparisons against the SMAP grid dataset
Preliminary validation studies have suggested that SMAP is meeting its performance targets (Chan et al., 2016; Pan et al., 2016), and therefore, the SMAP products were used for cross-validation here. However, the SMAP data records are on a daily scale while the assimilation results are on an hourly scale. Thus, the hourly values for the analysis have been averaged into daily values before validation. As we can see, the spatial distributions of the two analysis products were both more similar to the SMAP than to the background or Ctr, as shown in Figures 5A–F. Thereby, as seen from the difference between analysis and Ctr, the Cressman scheme clearly has a smoother and more reasonable spatial distribution than does the Barnes scheme.
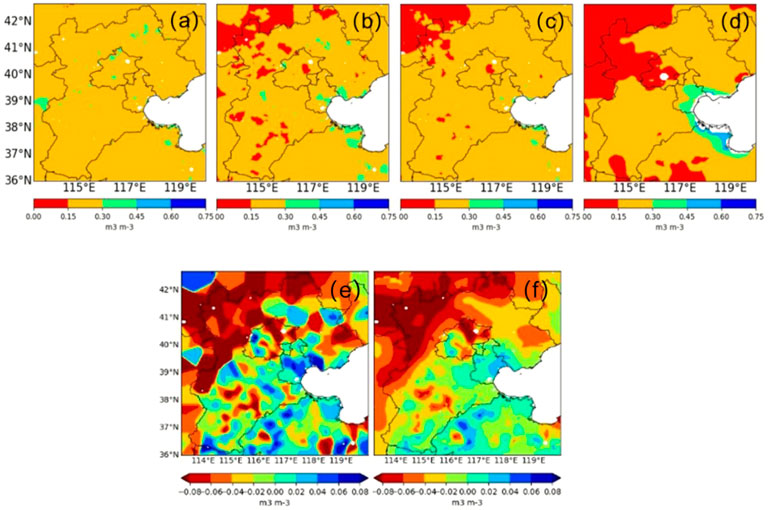
FIGURE 5. Distribution of monthly averages from Ctr (A), BARNES (B), CRESS (C), and SMAP (D). Difference between analysis [i.e., BARNES minus Ctr (E) and CRESS minus Ctr (F)].
In addition, as the daily spatial average surface soil moisture content (Figure 6) suggests, the two analysis products are both closer to the SMAP than to the Ctr and in situ observation. Also, a consistent variant tendency among all products can be observed (e.g., the sudden increase of soil moisture around 15 September), indicating that SMAP agrees well with the others on domain-averaged daily scales. While lower surface soil moisture values can be found in SMAP retrievals than in station data, this should explain the quite different probe methods and also indicates that soil moisture data fusion is necessary.
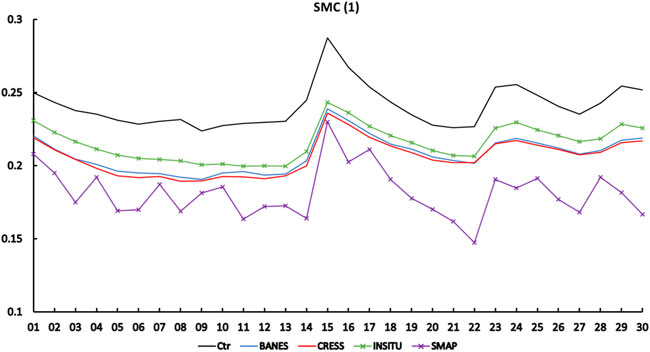
FIGURE 6. Daily average soil moisture content of SMAP (violet cross), station data (green cross), Ctr (black line), BARNES (blue line), and CRESS (red line) from 1 September to 1 October 2020.
Furthermore, as shown in the daily RMSEs and Corrs (Figure 7) and the averaging during the analysis of daily RMSEs and Corrs between SMAP and the analysis of each experiment (Table 3), the Cressman scheme is clearly superior to the Barnes scheme when lower RMSEs and larger Corrs can be found; this is consistent with the results of comparisons against station data. Also, as shown in both the probability density distribution (Figure 8) and the values of skewness and kurtosis (Table 4), the analysis using the Cressman scheme is closest to the Gaussian distribution and has the smallest SKEW and KURT for all validation candidates.
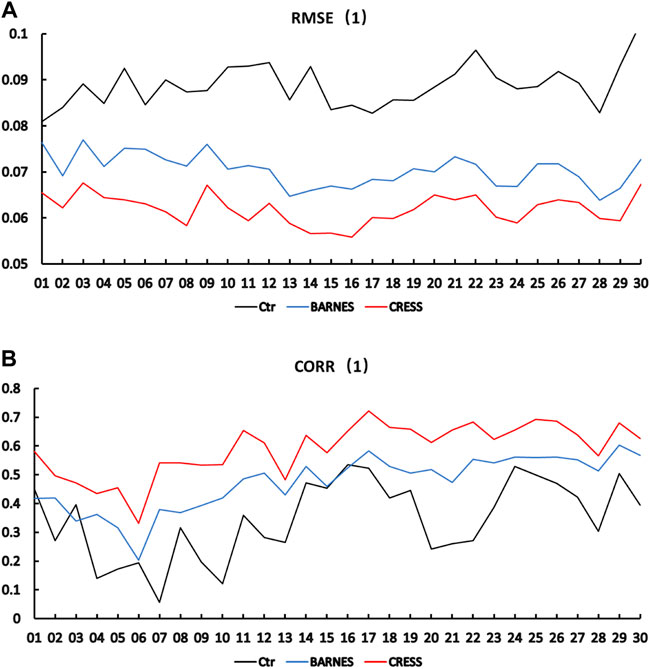
FIGURE 7. Daily RMSEs (A) and Corrs (B) between SMAP and products of each experiment from 1 September to 1 October 2020, including Ctr (black lines), BARNES (blue lines), and CRESS (red lines).

TABLE 3. Comparison of SMAP with Ctr, BARNESBIW, CRESSBIW, ASCAT, and AMSR2.
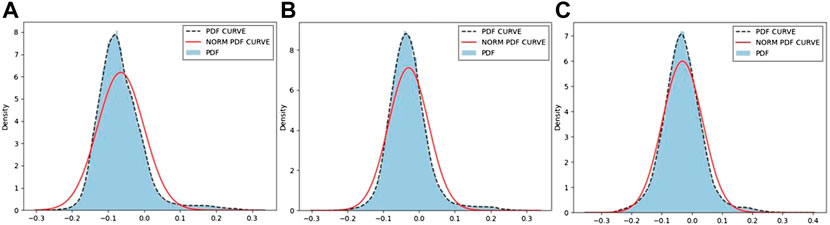
FIGURE 8. Probability density function of deviations between SMAP and products of each experiment from 1 September to 1 October 2020, including Ctr (A), BARNES (B), and CRESS (C).

TABLE 4. Skewness and kurtosis of each product of Ctr, CRESS, and BARNES.
Notably, Burgin et al. (2017) have compared SMAP with products of AMSR2 and ASCAT using the same statistical evaluation indicators, as shown in Table 4. It is clear that the CRESSBIW product is superior to the AMSR2 product. Compared with ASCAT, although the Corr of CRESSBIW is smaller by 9.1%, the RMSE is smaller by 44.6%. Therefore, the CRESSBIW product can capture the comparative daily scale characteristics as satellite-gridded retrievals. In general, all the aforementioned results indicate that the CRESSBIW product is a good choice with a simple SCM assimilation method and a quality promised gridded dataset.
4 Conclusion and discussions
In this work, we developed and evaluated two analysis products using SCMs with Barnes and Cressman weight factors. The hourly CLDAS V2.0 soil moisture content product was adopted as background data, and the hourly automatic soil moisture station data as observations to be assimilated. QC was conducted using the biweight method with the result of eliminating less than 10% of the actual reported data. Then, two hourly soil moisture content analysis products were produced using two schemes, including Barnes and Cressman, with a spatial resolution of 0.0625°. All validation results showed that the analysis product using the Cressman scheme had smaller RMSE and larger Corr than that using the Barnes scheme. In addition, the probability density distribution of deviations from the Cressman scheme analysis was closer to a normal or Gaussian distribution than was that of the Barnes scheme analysis, which should be attributed to the weighting factor. Finally, the Cressman scheme is recommended for use in analysis production with the sources of CLDAS V2.0 soil moisture content product and automatic soil moisture station data in the Jing-Jin-Ji area.
The dataset presented here provides hourly surface soil moisture analysis at a high spatiotemporal resolution and will be beneficial for many hydrological applications across the Jing-Jin-Ji region. Our results indicate that the Cressman product is a useful and promising soil moisture dataset. The proposed Cressman scheme is computationally simple and efficient, so the product can be easily updated to keep pace with large increases in the volume of soil moisture data. These findings will help evaluate and improve numerical models and their corresponding products. The comparison and evaluation steps employed in this work can also be applied to other data sources, for example, to satellite remote sensing products and to soil moisture products produced in other ways. It is noted that the iterations and scan radius specified in this work may be altered when the resolution of the data changes. In the future, new methods for assimilating soil moisture data and optimal weighting factors will be developed to further improve the analysis product.
Data availability statement
The datasets presented in this article are not readily available because they were authorized by China Meteorological Administration. Requests to access the datasets should be directed to Shao Changliang, shchl1@163.com.
Author contributions
SC contributed to the conception and design of the study, organized the database, performed the statistical analysis, and wrote the first draft of the manuscript. SC and GY wrote sections of the manuscript. CY and WJ analysis the data and revised the manuscript. All authors contributed to manuscript revision, and read and approved the submitted version.
Funding
This work was supported by the China Environmental Protection Foundation Blue Mountain Project (CEPFQS202169-28).
Conflict of interest
The author WJ was employed by Beijing Tianhe Xiangyun Culture Media Limited Company.
The remaining authors declare that the research was conducted in the absence of any commercial or financial relationships that could be construed as a potential conflict of interest.
Publisher’s note
All claims expressed in this article are solely those of the authors and do not necessarily represent those of their affiliated organizations, or those of the publisher, the editors, and the reviewers. Any product that may be evaluated in this article, or claim that may be made by its manufacturer, is not guaranteed or endorsed by the publisher.
References
Barnes, S. L. (1964). A technique for maximizing details in numerical weather map analysis. J. Appl. Meteor. 3, 396–409. doi:10.1175/1520-0450(1964)003<0396:atfmdi>2.0.co;2
Barnes, S. L. (1973). Mesoscale objective analysis using weighted time series observations, NOAA Tech. Memo ERL NSSL-62. Norman, Okla: Natl. Severe Storms Lab., 41.
Burgin, M. S., Colliander, A., Njoku, E. G., Chan, S. K., Cabot, F., Kerr, Y. H., et al. (2017). A comparative study of the SMAP passive soil moisture product with existing satellite-based soil moisture products. IEEE Trans. Geosci. Remote Sens. 55 (5), 2959–2971. doi:10.1109/tgrs.2017.2656859
Chan, S. K., Bindlish, R., O'Neill, P. E., Njoku, E., Jackson, T., Colliander, A., et al. (2016). Assessment of the SMAP passive soil moisture product. IEEE Trans. Geosci. Remote Sens. 54 (8), 4994–5007. doi:10.1109/tgrs.2016.2561938
Chen, F., Janjić, Z., and Mitchell, K. (1997). Impact of atmospheric surface-layer parameterizations in the new land-surface scheme of the NCEP mesoscale eta model. Boundary-Layer Meteorol. 85 (3), 391–421. doi:10.1023/a:1000531001463
Cressman, G. P. (1959). An operational objective analysis system[J]. Mon. Wea. Rev. 87, 367–374. doi:10.1175/1520-0493(1959)087<0367:aooas>2.0.co;2
Dabboor, M., Sun, L., Carrera, M. L., Friesen, M., Merzouki, A., McNairn, H., et al. (2019). Comparative analysis of high-resolution soil moisture simulations from the soil, vegetation, and snow (SVS) land surface model using SAR imagery over bare soil. Water 11 (3), 542. doi:10.3390/w11030542
Entekhabi, D., Njoku, E. G., O'Neill, P. E., Kellogg, K. H., Crow, W. T., Edelstein, W. N., et al. (2010). The soil moisture active passive (SMAP) mission. Proc. IEEE 98, 704–716. doi:10.1109/jproc.2010.2043918
Fereidoon, M., Koch, M., and Brocca, L. (2019). Predicting rainfall and runoff through satellite soil moisture data and SWAT modelling for a poorly gauged basin in Iran. Water 11, 594. doi:10.3390/w11030594
Gaertner, M. A., Domínguez, M., and Garvert, M. (2010). A modelling case-study of soil moisture-atmosphere coupling. Q. J. R. Meteorol. Soc. 136 (S1), 483–495. doi:10.1002/qj.541
Ju Fan R, , and Sun, Y. (2019). Immune evolution particle filter for soil moisture data assimilation. Water 11, 211. doi:10.3390/w11020211
Kim, Y. J., and Wang, G. L. (2007). Impact of initial soil moisture anomalies on subsequent precipitation over North America in the coupled land–atmosphere model CAM3–CLM3. J. Hydrometeorol. 8 (3), 513–533. doi:10.1175/jhm611.1
Koch, S. E., Desjardins, M., and Kocin, P. J. (1983). An interactive Barnes objective map analysis scheme for use with satellite and conventional data. J. Clim. Appl. Meteor. 22, 1487–1503. doi:10.1175/1520-0450(1983)022<1487:aiboma>2.0.co;2
Lai, X., Wen, J., Ceng, S. X., Song, H. Q., and Huang, X. (2014). Numerical simulation and evaluation study of soil moisture over China by using CLM4.0 model [J]. Chin. J. Atmos. Sci. (in Chinese) 38 (3), 499–512.
Lan, X., Guo, Z., Tian, Y., Xia, L., and Wang, J. (2015). Review in soil moisture remote sensing estimation based on data assimilation [J]. Advances in Earth Science 30 (6), 668–679.
Lanzante, J. R. (1996). Resistant, robust and non-parametric techniques for the analysis of climate data: Theory and examples, including applications to historical radiosonde station data [J]. Int. J. Climatol. 16, 1197–1226. doi:10.1002/(sici)1097-0088(199611)16:11<1197::aid-joc89>3.0.co;2-l
Li, D. Q., Duan, Y. X., and Zhang, S. W. (2012). Soil moisture measurement and simulation: A review [J]. Advances in Earth Science 27 (4), 424–434.
Li, H., Xu, F., Zhou, W., Wang, D., Wright, J. S., Liu, Z., et al. (2017). Development of a global gridded Argo data set with Barnes successive corrections. J. Geophys. Res. Oceans 122, 866–889. doi:10.1002/2016jc012285
Li, Y., Wang, Y., Zheng, J., and Yang, M. (2019). Investigating spatial and temporal variation of hydrological processes in western China driven by CMADS. Water 11, 435. doi:10.3390/w11030435
Li, Z., Zhou, T., Chen, H., Ni, D., and Zhang, R. (2015). Modelling the effect of soil moisture variability on summer precipitation variability over East Asia. Int. J. Climatol. 35 (6), 879–887. doi:10.1002/joc.4023
Liu, J., Shi, C., Sun, S., Liang, J., and Yang, Z. L. (2019). Improving land surface hydrological simulations in China using CLDAS meteorological forcing data. J. Meteorol. Res. 33 (6), 1194–1206. doi:10.1007/s13351-019-9067-0
Ma, Z. G., Fu, C. B., Xie, L., Chen, W. H., and Tao, S. W. (2001). Some problems in the study on the relationship between soil moisture and climatic change. Advance in Earth Sciences (in Chinese) 16 (4), 563–568.
Minet, J., Lambot, S., Delaide, G., Huisman, J. A., Vereecken, H. A., and Vanclooster, M. A. (2010). A generalized frequency domain reflectometry modeling technique for soil electrical properties determination. Vadose Zone Journal 9, 1063–1072. doi:10.2136/vzj2010.0004
Naz, B. S., Kollet, S., Franssen, H. J. H., Montzka, C., and Kurtz, W. (2020). A 3 km spatially and temporally consistent European daily soil moisture reanalysis from 2000 to 2015. Sci. Data 7, 111. doi:10.1038/s41597-020-0450-6
Njoku, E. G., Jackson, T. J., Lakshmi, V., Chan, T. K., and Nghiem, S. V. (2003). Soil moisture retrieval from AMSR-E. IEEE Trans. Geosci. Remote Sensing 41 (2), 215–229. doi:10.1109/tgrs.2002.808243
Pan, H. L., and Mahrt, L. (1987). Interaction between soil hydrology and boundary-layer development. Boundary-Layer Meteorol. 38 (1-2), 185–202. doi:10.1007/bf00121563
Pan, M., Cai, X., Chaney, N. W., Entekhabi, D., and Wood, E. F. (2016). An initial assessment of SMAP soil moisture retrievals using high-resolution model simulations and in situ observations. Geophysical Research Letters 43, 9662–9668. doi:10.1002/2016gl069964
Parkinson, C. L. (2003). Aqua: An earth-observing satellite mission to examine water and other climate variables. IEEE Trans. Geosci. Remote Sensing 41 (2), 173–183. doi:10.1109/tgrs.2002.808319
Qiao, P. L., Zhang, J. X., and Wang, C. H. (2007). Soil moisture retrieving by AMSR-E microwave remote sensing data [J]. Journal of China University of Mining & Technology 36 (1), 262–265. (in Chinese).
Seneviratne, S. I., Corti, T., Davin, E. L., Hirschi, M., Jaeger, E. B., Lehner, I., et al. (2010). Investigating soil moisture-climate interactions in a changing climate: A review. Earth-Science Reviews 99 (3), 125–161. doi:10.1016/j.earscirev.2010.02.004
Shao, C., Wu, D., and Guo, Y. (2020). Comparison of high spatiotemporal-resolution soil moisture observations with CLM4.0 simulations. Meteorol. Appl. 27 (3), e1912. doi:10.1002/met.1912
Shi, C. X., Jiang, L. P., Zhang, T., Xu, B., and Han, S. (2014). Status and plans of CMA land data assimilation system (CLDAS) project. Geophysical Research Abstracts 16, EGU2014–5671.
Shi, Z., Tao, Y., Jian, Z., and Wu, F. T. (2019). A modeling study of the influence of initial soil moisture on summer precipitation during the East Asian summer monsoon. Dynamics of Atmospheres and Oceans 85, 72–82. doi:10.1016/j.dynatmoce.2018.12.003
Song, Y., Lu, Y., Guo, Z., Xu, X., Liu, T., Wang, J., et al. (2019). Variations in soil water content and evapotranspiration in relation to precipitation pulses within desert steppe in inner Mongolia, China. Water 11, 198. doi:10.3390/w11020198
Susha, L. S. U., Singh, D. N., and Baghini, M. S. (2014). A critical review of soil moisture measurement. Measurement 54 (8), 92–105. doi:10.1016/j.measurement.2014.04.007
Vereecken, H., Huisman, J. A., Pachepsky, Y., Montzka, C., Kruk, J. V. D., Bogena, H., et al. (2014). On the spatio-temporal dynamics of soil moisture at the field scale. Journal of Hydrology 516 (17), 76–96. doi:10.1016/j.jhydrol.2013.11.061
Wang, L. L., and Gong, J. D. (2018). Application of two OI land surface assimilation techniques in GRAPES meso. Meteorological Monthly 44 (7), 857–868.
Zhu, Y., Li, X., Pearson, S., Wu, D., Sun, R., Johnson, S., et al. (2019). Evaluation of fengyun-3C soil moisture products using in-situ data from the Chinese automatic soil moisture observation stations: A case study in henan province, China. Water 11, 248. doi:10.3390/w11020248
Keywords: soil moisture, cross-validation, data assimilation, land surface model, quality control
Citation: Shao C, Guo Y, Cao Y and Wang J (2023) A high-resolution soil moisture content analysis product in Jing-Jin-Ji using the successive correction method. Front. Earth Sci. 10:1037065. doi: 10.3389/feart.2022.1037065
Received: 05 September 2022; Accepted: 14 November 2022;
Published: 13 January 2023.
Edited by:
Dongmei Xu, Nanjing University of Information Science and Technology, ChinaReviewed by:
Ruichun Wang, CMA Earth System Modeling and Prediction Centre, ChinaGuojie Wang, Nanjing University of Information Science and Technology, China
Copyright © 2023 Shao, Guo, Cao and Wang. This is an open-access article distributed under the terms of the Creative Commons Attribution License (CC BY). The use, distribution or reproduction in other forums is permitted, provided the original author(s) and the copyright owner(s) are credited and that the original publication in this journal is cited, in accordance with accepted academic practice. No use, distribution or reproduction is permitted which does not comply with these terms.
*Correspondence: Changliang Shao, c2hjaGwxQDE2My5jb20=