 Yue Zhou
 Rong Wan
 Jing Sun
 Zhengxu Gao2
94% of researchers rate our articles as excellent or good
Learn more about the work of our research integrity team to safeguard the quality of each article we publish.
Find out more
ORIGINAL RESEARCH article
Front. Earth Sci., 06 January 2023
Sec. Atmospheric Science
Volume 10 - 2022 | https://doi.org/10.3389/feart.2022.1036692
This article is part of the Research TopicAtmospheric Physics, Atmospheric Environment, and Atmospheric Effects on Human HealthView all 12 articles
Based on 30 complete wire icing processes lasted longer than 24 h observed from the Enshi, Jinsha, Dacaoping and Shennongding of Shennongjia in mountainous areas of Hubei province during the winter of 2008–2016, the macroscopic effects of rain–fog weather on the ice accretion process were analyzed. Furthermore, the distribution characteristics of key simulation parameters in supercooled fog (SF) and freezing rain (FR) were discussed according to the physical model of icing process. Finally, the evolution characteristics of the simulated ice thickness in rain–fog weather were proposed. Results showed that the duration of ice accretion in mountainous areas is the key factor affecting the maximum ice thickness; the freezing rain is most frequent during the glaze icing process, which leads to the substantial growth of ice thickness. The average growth rates of ice thickness with and without freezing rain are 1.26 mm h−1 and -0.11 mm h−1, respectively. Collision rate is the main parameter for inhibiting ice accretion of SF, with an average value of ∼ 0.1, while freezing rate is the main parameter for inhibiting ice accretion of FR, with an average value of ∼ 0.6. The ice accretion of SF shows the characteristics of periodic growth, while the ice accretion of FR shows the explosive growth of ice thickness, which makes the simulated values of icing closer to the observations. The ice formation efficiency of FR was more than twice that of SF, with a negative feedback mechanism to the ice accumulation of SF.
Since the first 500 kV high-voltage transmission line with the length of 595 km from Pingdingshan to Wuhan in China was put into operation in 1981, seven inter-provincial power grids as well as the five independent provincial (regional) power grids have been put into operation one after another; the total length of 500 kV lines is >20,000 km. As high-voltage transmission lines are usually erected in high-altitude mountainous areas, they are highly vulnerable to freezing rain (FR) and supercooled fog (SF); the cooling droplets condensed on the cable or snow slush frozen on the cable will cause ice coating on cable, which is usually called as “wire icing”. Wire icing will not only affect the normal operation of the transmission network but also cause serious insulator flashover, cable breaking after galloping, damage to the fittings and insulators, tilt and collapse of poles towers, and other accidents (Adhikari and Liu, 2019; Deng et al., 2012; Lu et al., 2022). Since the deployment of China’s 330 and 500 kV high-voltage transmission lines, wire icing disasters have increased and seriously affected the safe and stable operation of the power grid (Wang and Jiang, 2012; Hu et al., 2016; Huang et al., 2021). There were four severe low-temperature snowstorm and ice freezing events hitting the 20 provinces and cities in South China during 10 January 2008–2 February 2008, causing severe influence to the development of economy and security of humans. However, widespread icing disasters are not frequently seen. In winter, high-altitude mountainous areas become icing-prone areas due to low temperature and sufficient water vapor (Lamraoui et al., 2014; Neil et al., 2014), therefore, the local icing disaster has become the focus of attention in the field of power communications.
According to the icing density, ice accretion mainly includes three types: glaze, rime, and mixed-phase of glaze and rime. The glaze is more commonly observed in the South China than in the North China, whereas the rime is more frequently observed in the North China than in the South China; both types of icing are more frequently observed in the mountainous areas than on the plains (Wang, 2011; 2014a; 2014b). Zhao et al. (2010) revealed the spatial distribution and climate change characteristics of freezing weather in China from 1961 to 2008, and demonstrated that the frequency of freezing weather in most areas of China decreased, but the intensity has increased. The continuous invasion of cold air and transportation of large amount of water vapor due to the combined anomalies of atmospheric circulation are the key reasons for the widespread freezing weather (Ding et al., 2008; Kuang et al., 2019; Wang et al., 2020; Zhao et al., 2022). Bernstein (2000) studied the meteorological conditions like temperature, relative humidity, wind speed, wind direction, and precipitation during glaze and rime icing processes, and indicated that the glaze icing requires more stringent meteorological conditions than rime-type icing, whereas the mixed-phase icing has more relaxed requirement on meteorological condition. The FR caused by the “melting process” depends on altitude, thickness, and temperature of the near-surface cold and warm layers (Rauber et al., 2000). Therefore, glaze icing mainly occurs in the plains, with low frequency, while the FR formed by the “supercooled warm-rain process” has looser requirement on the cold layer and warm layer, and is often accompanied by the rime icing in mountainous areas; this makes the mixed-phase icing the most frequently seen in this regions (Gultepe et al., 2014), imposing great safety threat to the transmission lines and communication towers.
The wire icing is essentially the coagulation of supercooled droplets on the surface of the cable. Changes in the number concentration of droplets, average particle size and liquid water content, and other physical parameters dominate the ice accretion intensity, where the rain intensity is the key factor affecting the intensity of glaze icing, has the similar droplet spectrum characteristics with stratiform cloud precipitation (Chen et al., 2011), while the liquid water content determines the intensity of rime icing, with the similar droplet spectrum characteristics to that of advection fog (Niu et al., 2012). The particle size of FR droplets is much larger than that of SF droplets; when it approaches the ground, it not only provides more supercooled water to the icing process but also affects the microphysical process of SF near the ground (Wang et al., 2019a), thereby indirectly affecting the ice accretion process. For the simulation of FR ice accretion processes, Jones (1998) developed a relatively simple ice accretion model of FR, which primarily considers raindrops falling vertically and those blown by wind. Szilder (1994) proposed an ice accretion model considering icicle occurrence, and obtained the size and shape of FR icing by using comprehensive analysis and stochastic theory. However, the magnitude of FR icing mainly depends on the number of supercooled raindrops coagulated on the cable surface (Makkonen, 1998), and the empirical model cannot describe the whole process of icing accurately. Contrarily, the simulation on the SF icing is relatively mature. Makkonen (1984; 2000) proposed the ice accretion model considering collision, capture, and freezing rates of supercooled droplets, and the model can describe the evolution of SF icing. Drage and Hauge (2008) and Nygaard et al. (2011) used this ice accretion model to simulate the icing process of power lines in mountainous areas, and obtained better simulation results compared with the measured values.
In summary, the ice accretion model of SF is highly correlated to the microphysical characteristics of liquid droplets. The occurrence of FR increases supercooled liquid water content in the atmosphere and enhance its contribution to ice accretion. However, it would also affect the microphysical characteristics of SF, which in turn will change the contribution of SF to the development of icing process. To this end, our paper explored the occurrence characteristics of SF and FR in the process of ice accretion in mountainous areas, the influence of the coexistence of FR and SF on the process of ice accretion is analyzed, and the ice thickness during rain–fog weather in mountainous areas is simulated through the physical model of ice accretion, which provides a reference for the meteorological sector to carry out targeted wire icing early warning and disaster assessment and the power sector in decision-making.
In the winter of 2008 and 2009, for the macro-micro characteristics of cloud-precipitation affecting the ice accretion process, two consecutive comprehensive observations were conducted at Enshi (109.27°E, 30.28°N; altitude 1722 m), Jinsha (114.21°E, 29.63°N; altitude 751 m), and Dacaoping of Shennongjia (110.33°E, 31.63°N; altitude 2,593 m) in Hubei (Niu et al., 2012). In addition, five consecutive observations of wire icing were conducted at Enshi, Jinsha, and Shennongding of Shennongjia (110.31°E, 31.45°N; altitude 3,100 m) in the winter of 2012–2016, and a total of 30 complete wire icing processes lasting longer than 24 h were obtained in 7-year field observations. The distribution of the above four sites is shown in Figure 1. The four stations are located in the intermediate and high-altitude mountainous areas in the southwest, southeast, and west of Hubei Province, which basically cover the three main heavy ice areas in Hubei Province (Zhou et al., 2013, 2018); the southwest and southeast areas have Gezhouba Power Plant, Three Gorges Power Station Transmission Project and West-to-East Power Transmission Project, representing the ice accretion process in mountainous areas under the joint action of cold front system and southwest warm-humid airflow. The Shennongjia in the west is a typical representative of ice accretion in high-altitude mountains.
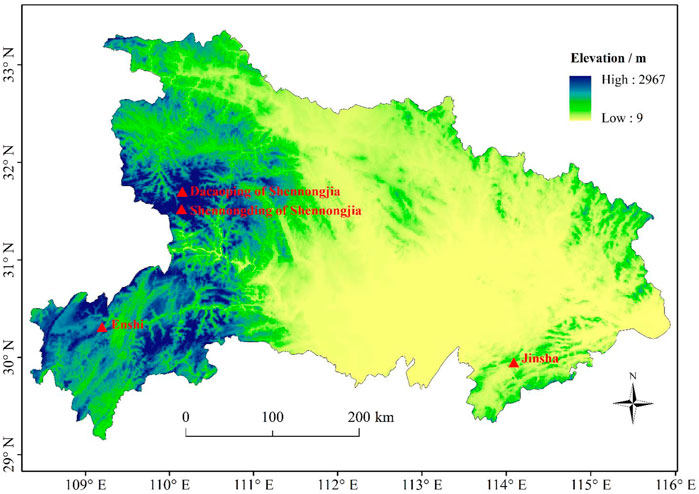
FIGURE 1. Map of study area and distribution of observation sites of wire icing (red triangles) in Hubei in the winter of 2008–2009 and 2012–2016.
The observations mainly included icing photos, ice thickness and weight, cloud amount, weather phenomena, and meteorological elements. The ice accretion observations were made every 1 h in the winter of 2008 and 2009, and every 6 h in the winter of 2012–2016. Icing photos were taken at the same time as ice thickness measured, and icing was weighted once or twice during each ice accretion process when ice thickness reached its maximum. The microphysical characteristics of SF and FR were observed in the winter of 2008 and 2009 using the FM-100 fog droplet spectrometer and the Parsivel raindrop spectrometer, and the specific observation design is described in Reference (Zhou et al., 2013). The temporal resolution of the meteorological elements (temperature, barometric pressure, humidity and wind) is 1 h.
In this study, the evolutions of ice thickness formed by SF and FR are simulated using a physical model based on the collision, capture, and freezing rates of supercooled droplets (Makkonen, 1984) as follows:
where, dM is the icing amount per unit time and dt is the unit time, E1 is the collision rate; E2 is the freezing rate; E3 is the capture rate;
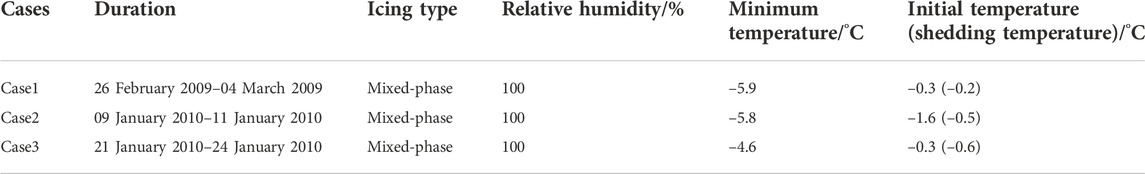
TABLE 1. Overview of the Three Icing Processes at Enshi in winter 2008 and 2009.
The FR lasts for a relatively short period, but has a heavier rain intensity, leading to a higher icing density, while the duration of SF is longer, the rain intensity is lower or even no precipitation occurs, leading to a lower icing density (Makkonen and Ahti, 1995; Ikeda et al., 2007). Figure 2 presents the correlation characteristics between the duration of icing process and maximum ice thickness of rime, glaze, and mixed-phase icing during 30 ice accretion processes at Enshi, Jinsha, and Shennongjia in 7-year field observations, with the percentage of observations with liquid precipitation. It can be seen that, regardless of the type of ice accretion, the duration of icing in mountainous areas is positively correlated with the maximum ice thickness, with a correlation coefficient of 0.52. The increase rate of ice accretion in mountainous areas is usually smaller than that in plain areas, and the long duration is an important characteristic and disaster-causing property (Jasinski et al., 1998; Frohboese and Anders, 2007). The increase rate of maximum ice thickness with the duration during the rime icing cases is similar to the relationship between the two in all cases, with a higher correlation coefficient of 0.88. The correlation coefficient between the two in the cases of glaze icing also reaches 0.78, but the slope of the fitted curve is about twice as high as that in the case of rime icing, which indicates that the duration determines the maximum ice thickness of rime and glaze icing, and that the increase rate of ice thickness in glaze icing is significantly higher than that of the rime icing. The correlation between the maximum ice thickness and the duration is not stable for the mixed-phase icing due to the alternative effect of SF and FR.
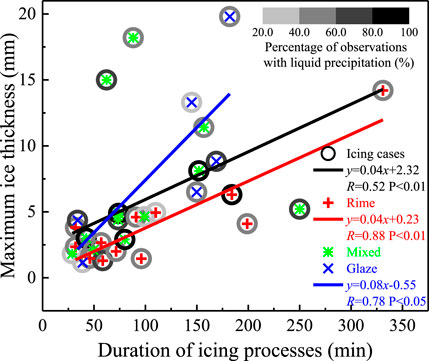
FIGURE 2. The correlation characteristics between the duration and maximum ice thickness of rime (red plus), glaze (blue cross), and mixed-phase (green star) icing during 30 ice accretion processes, with the percentage of observations with liquid precipitation (gray scale; %).
The periods with liquid precipitation to the total observed periods for the entire ice accretion process is calculated as the percentage of liquid precipitation. From Figure 2, we can see that the percentage of liquid precipitation in either type of ice accretion is above 20%, and the average percentage can reach 57% of the total number of observations, which indicates that the intermittent FR is a typical feature of the ice accretion in mountainous areas. At the same time, further analysis of the percentage of observations with liquid precipitation in different icing types revealed that the glaze icing has the lowest percentage of liquid precipitation, with the most concentrated percentage values; while the hard rime ice accretion has the highest percentage of liquid precipitation, with the most scattered percentage values.
The growth rate of ice thickness with and without FR is further compared in Figure 3A, showing that the occurrence of FR does not guarantee a positive ice thickness growth rate. Ice melting as well as breaking off and shedding were observed in both situation, but the cases with a negative ice thickness growth rate without FR was 2.5 times higher than that with FR. In addition, the occurrence of FR made the growth rate of ice thickness reach the maximum value of 7.83 mm·h−1, and the ice thickness growth rate was positive in more than 75% of the observations, and the average ice thickness growth rate was 1.26 mm·h−1; while in the observation without FR, the growth rate of ice thickness was more evenly distributed between −3.0 and 3.0 mm·h−1, centered on 0. The average growth rate was −0.11 mm·h−1, and the variation of ice thickness under the influence of SF was mainly stable, without explosive growth. The correlation characteristics between the rainfall intensity and growth rate of ice thickness deeply illustrate the importance of FR to the ice accretion (Figure 3B). Whether it is the rime icing, glaze icing, or mixed-phase icing, the growth rate of ice thickness is positively correlated with the rainfall intensity, with the correlation coefficient of 0.42, 0.76, and 0.14, respectively, showing the rainfall intensity has the most significant effect on the growth rate of glaze icing.
FIGURE 3. Relationship between the FR and growth rate of ice thickness during the 30 ice accretion processes. (A) Violin and box-whisker plots of the growth rate of ice thickness with and without FR. The central box represents the values from the lower to upper quartiles (25th to 75th percentiles), and the vertical line extends from the minimum to the maximum. The middle hollow square represents the mean value. (B) The correlations between the rainfall intensity and growth rate of ice thickness during the rime (red square), glaze (blue triangle), and mixed-phase (green circle) icing processes.
The different effects of SF and FR on the icing process are given in terms of macro-features in the above section. Then, to reveal the reasons for this difference from the perspective of the physical mechanism of ice accretion, it needs to be quantitatively determined that whether the droplets of SF and FR collide and freeze on the cable. Therefore, in this section, the distributions of the collision rate (E1) and freezing rate (E2) of SF and FR and their correlation characteristics with key physical parameters are analyzed using the observations of microphysical properties of fog/cloud and precipitation during icing processes in Hubei Province in winter of 2008 and 2009.
Figure 4 presents the distributions of the collision and freezing rates of SF and FR during the three icing cases. It can be seen that E1 and E2 show opposite distribution patterns, where the collision rate of SF (Figure 4A) is mostly below 0.15, with a mean value of about 0.1, while the freezing rate (Figure 4B) is mostly above 0.9, with a mean value greater than 0.8. The droplet size of SF on the order of 101 μm prevents them from colliding with the cable due to the ambient flow, while their small size makes them easier to freeze on the cable (Farzaneh, 2008). The collision rate of FR (Figure 4C) is close to 1, while the freezing rate (Figure 4D) vary the most (more than 75% of the values are distributed within the range of 0.2–1), with the average value is still around 0.6, and the droplet size of FR on the order of 101 mm makes almost all of them collide with the cable, while raindrops also tend to flow down along the cable to form into icicles (Makkonen, 2000), which in turn leads to reduce the direct contribution of raindrops to ice accretion. Since the ice thickness simulation is obtained by multiplying the multiple parameters, the extremely low collision rate of SF makes its contribution to ice accretion significantly lower than that of FR in similar scenarios.
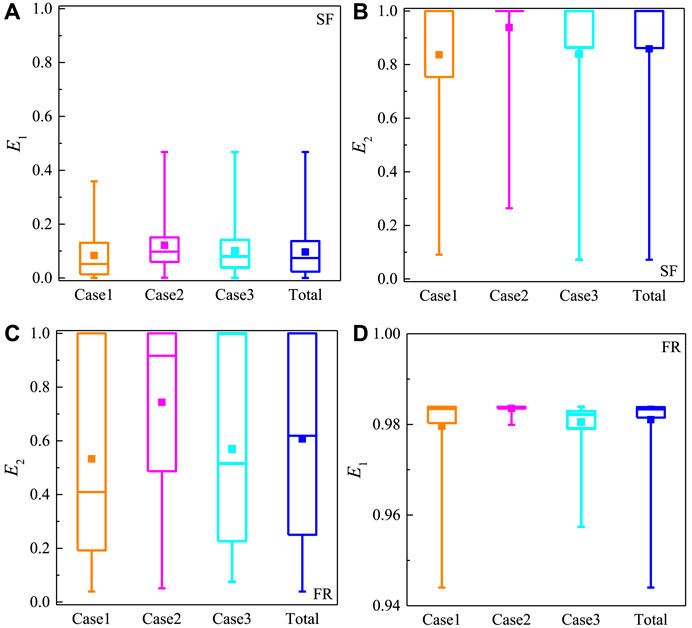
FIGURE 4. Distribution characteristics of collision rates (E1) of supercooled fog (A) and freezing rain (C), and freezing rates (E2) of supercooled fog (B) and freezing rain (D) of the three ice accretion cases in winter of 2008 and 2009. The central box represents the values from the lower to upper quartiles (25th to 75th percentiles), and the vertical line extends from the minimum to the maximum. The middle solid square and line represents the mean value and median value, respectively.
In order to explore the key physical properties affecting the icing process, the correlation characteristics between liquid water content (Clw), median volume diameter (Dmv), wind speed (V), the collision rate (E1), and the freezing rate (E2) during the SF and FR process are given in Figure 5. It is seen that the key physical properties affecting the ice accretion of SF are Dmv, V and Clw in order, with correlation coefficients of 0.66, 0.41 and 0.22 with E1, respectively. Meanwhile, based on the average values of relevant variables with the E1 intervals of the value of 0.05, and the E2 intervals of the value of 0.1, the correlation coefficients increase to more than 0.8, which indicates that these meteorological properties have an obvious impact on E1 and E2 in general, but the degree is different. The droplet size of the SF has the greatest effect on E1 (Figure 5B), especially after Dmv > 15 μm, and the increase of Dmv significantly increases the value of E1, which is similar to the results of ice accretion processes in a Swiss wind farm (Davis et al., 2014); The increase of V leads to the decrease of E1 (Figure 5C), especially when V > 3.5 m·s−1, the mean value of E1 basically remains below 0.1, and only a small number of supercooled droplets will collide with the cable. The correlation between Clw and E1 is the lowest (Figure 5A), even when the value of Clw is greater than 0.2 g·m−3, E1 is mainly distributed within 0.3, which indicates that the increase of liquid water content during the ice accretion of SF in mountainous areas mainly relies on the increase of the number concentration and overall size of fog droplets. The mechanism of significantly increasing liquid water content by forming big droplets through collision-growth process are relatively weak, which is consistent with the microphysical characteristics of SF during these icing cases (Zhou et al., 2013).
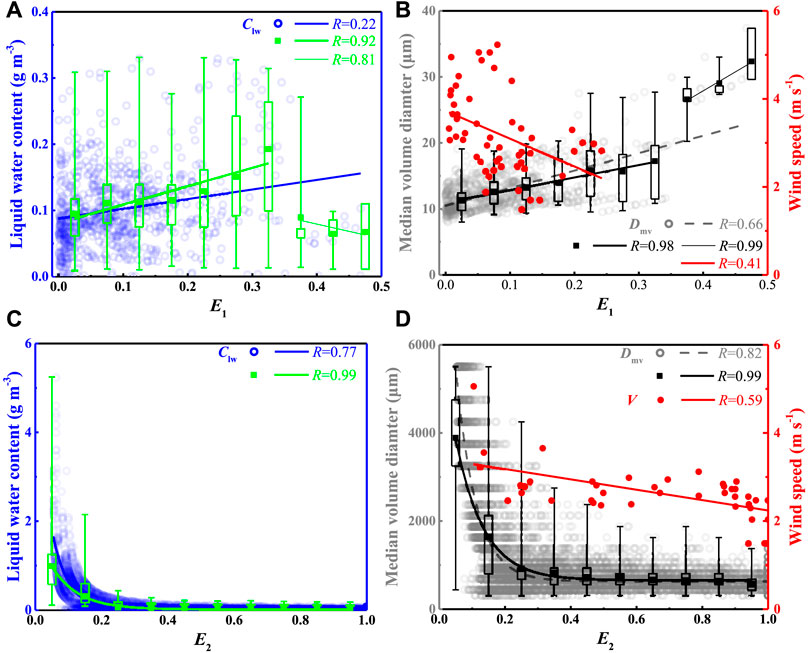
FIGURE 5. Scatter plots comparing collision rate E1 with liquid water content Clw (A), median volume diameter Dmv, and wind speed V (B) during SF process, and freezing rate E2 with liquid water content Clw (C), median volume diameter Dmv, and wind speed V (D) during FR process. The corresponding least-square fitting lines and correlation coefficient (R) are given in the corner of each panel. Box plots also show (A) Clw, (B) Dmv of SF process, and (C) Clw, (D) Dmv of FR process with the E1 intervals of the value of 0.05, and the E2 intervals of the value of 0.1. The central box represents the values from the lower to upper quartiles (25th to 75th percentiles), and the vertical line extends from the minimum to the maximum. The middle solid square represents the mean value.
For the FR process, the freezing rate (E2) is the key parameter that inhibits the increase of ice thickness. It is seen that E2 exponentially decreases with the increase of Clw (Figure 5C) and Dmv (Figure 5D), and the correlation coefficients are 0.77 and 0.82, respectively. When Clw > 0.5 g·m−3, E2 is maintained below 0.2, the corresponding raindrop size is about 1.0 mm; when both the value of Clw and Dmv are small, E2 is distributed within the range of 0–1, and the simulation to ice accretion of FR has higher uncertainty. Similarly, larger wind speed also inhibits the E2 value (Figure 5D), and when the wind speed is 2.5–3.0 m·s−1, E2 has higher uncertainty and mainly distributed within 0–1; when the wind speed is smaller than this value range, E2 is larger than 0.9, and almost all the raindrops can freeze on the cable; while when the wind speed is larger than this value range, E2 is below 0.3, which is significantly lower than its average value.
Figure 6 presents the evolution of the simulated ice thickness during the above three ice accretion processes (Case1, Case2, and Case3) under the joint effect of SF and FR. It can be seen that the ice accretion of SF shows a periodic variation. And Case1 (Figure 6A) showed three significant increases in ice thickness, with an increase of about 7.6 mm, Case2 (Figure 6B) showed three significant ice thickness increases lasting about 200 h during the ice accretion process, with an increase of about 9.1 mm, Case3 (Figure 6C) showed a significant ice thickness increase lasting 160 h during the ice accretion process, with an increase of about 12.2 mm. The significant increase in ice thickness occurred mainly at the initial stage of the ice accretion, and the change in ice thickness during the growth period accounted for more than 90% of the total ice thickness during the process, which was mainly limited by the collision rate of the SF droplets. The effective cross section at the initial stage of the ice accretion was the smallest in the whole process, and more droplets can fall on the cable easily, while with the increase of ice thickness, the effective cross section is amplified significantly, making supercooled droplets that can collide with the cable originally can no longer collide with the cable, which is also the main reason for the relatively stable and unobvious increase of ice thickness in later stage of ice accretion (Wang et al., 2019b). Unless a stronger SF process occurs in the later stage of ice accretion, there are more and bigger droplets to make the ice thickness continue to increase again.
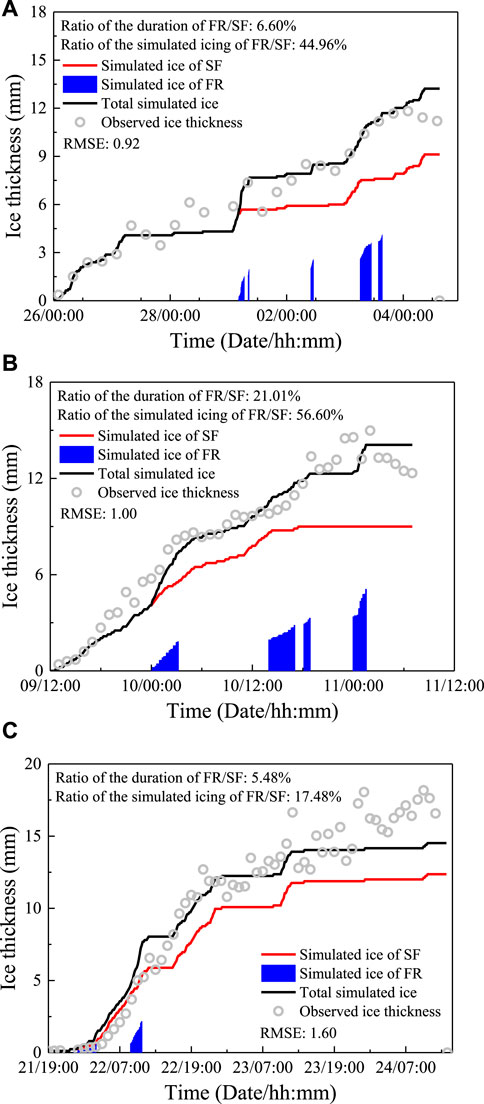
FIGURE 6. Temporal variations of observed ice thickness (gray hollow circle), simulated ice thickness under the effect of supercooled fog (red line), freezing rain (blue column), and joint effect of the both (black line) during ice accretion of Case1 (A), Case2 (B), and Case3 (C) in Hubei Province in winter of 2008 and 2009.
Meanwhile, it can be clearly seen that the duration of FR is short, with the ratio of duration of FR to SF is 6.60, 21.01, and 5.48%, respectively. Although the freezing rate of FR was significantly smaller than the collision rate, the bigger size and larger liquid water content of the raindrops can ensure that enough liquid water is frozen on the cable, promoting the increase of ice thickness significantly.
Statistical analysis of the ratio of the simulated icing of FR to SF was also illustrated in Figure 6. For Case2 and Case3 with weak FR, the ice accretion efficiency of FR to SF which is calculated by the ratio of duration and simulated ice thickness, was about 2.69, and 3.19, respectively, while for Case1, where the FR is stronger, the ice accretion efficiency can reach the value of 6.81. Also, the total ice thickness simulated by the comprehensive consideration of FR and SF can reflect the explosive growth of icing process obviously, and make the simulations closer to the numerical range of observations. Meanwhile, the occurrence of FR leads to the rapid growth of ice thickness during this period, significantly reduce the collision rate of SF droplets, which in turn inhibit the ice accretion efficiency of SF. Generally speaking, there is a negative feedback mechanism of the occurrence of FR on the ice accretion of SF.
During the winter of 2008–2016, the icing properties and key influence factors of 30 complete wire icing processes observed at Enshi, Jinsha, Dacaoping, and Shennongding of Shennongjia in Hubei are investigated, the collision rate and freezing rate of supercooled droplets under rain–fog weather is also analyzed, and the simulation of ice accretion processes is conducted considering the joint effect of FR and SF. The conclusions are as follows:
1) The duration of ice accretion in mountainous areas determined the maximum ice thickness of the process, and the two variables were positively correlated with a correlation coefficient of 0.52. There was the highest increase rate of ice thickness during the glaze icing processes. FR occurred in more than 50% of the icing processes.
2) The occurrence of FR could lead to an explosive increase in ice thickness, with a maximum value of 7.83 mm·h−1 and an average growth rate of 1.26 mm·h−1, while the variation of ice thickness was relatively stable during the icing processes without FR, with the growth rate mainly distributed within the range of −3–3 mm·h−1, and an average growth rate of −0.11 mm·h−1. The growth rate of ice thickness was positively correlated with the rainfall intensity, with the correlation coefficient of 0.42, 0.76, and 0.14, respectively, showing the rainfall intensity had the most significant effect on the growth rate of glaze icing.
3) The collision rate (E1) was the main parameter inhibiting the ice accretion in SF, with the mean value of about 0.1. The median volume diameter (Dmv) of SF had the greatest influence on E1, and when it was larger than 15 μm, the increase of Dmv would significantly increase E1. The increase of wind speed (V) would reduce the value of E1, and when it was larger than 3.5 m·s−1, the mean value of E1 basically stays below 0.1. The correlation between liquid water content (Clw) and E1 was the weakest. The freezing rate (E2), on the other hand, was the main covariate that inhibited the ice accretion of FR, with the mean value of about 0.6. The Dmv, V, and Clw of FR were all negatively correlated with E2, and the distribution range of E2 values was wide (0–1), with large uncertainty.
4) The ice accretion of SF showed the characteristics of periodic growth, with increase of ice thickness of the growth period accounts for more than 90% of the total ice thickness of the process. However, the ice accretion of FR showed the explosive growth of ice thickness, which made the simulated values of icing closer to the observations. The ice formation efficiency of FR was more than twice that of SF, with a negative feedback mechanism to the ice accumulation of SF.
Although the research in this manuscript is helpful to reveal the physical mechanism of the explosive growth of icing process in mountainous areas, the ice accretion properties are mainly obtained through manual observation, which is featured by low temporal resolution, and does not match the macro–microscopic physical quantity observations of cloud and precipitation. These problems are yet to be solved through further researches on the response of ice accretion to changes in physical properties of supercooled droplets by using the automated icing observation equipment in the future.
Publicly available datasets were analyzed in this study. This data can be found here: http://hb.cma.gov.cn/qxfw/index.html.
YZ and RW conducted the study design. YZ, ZG, and JY provided the observational data. JS and ZG assisted with data processing. YZ wrote the paper with the help of RW and JS. RW, ZG, and JY were involved in the scientific interpretation and discussion. All authors provided commentary on the paper.
This research was funded by the National Key R&D Program of China (Grant No. 2018YFC1507201), the National Natural Science Foundation of China (Grant No. 41875170), and the Natural Science Foundation of Hubei Province (Grant No. 2021CFB571).
The authors declare that the research was conducted in the absence of any commercial or financial relationships that could be construed as a potential conflict of interest.
All claims expressed in this article are solely those of the authors and do not necessarily represent those of their affiliated organizations, or those of the publisher, the editors and the reviewers. Any product that may be evaluated in this article, or claim that may be made by its manufacturer, is not guaranteed or endorsed by the publisher.
Adhikari, A., and Liu, C. (2019). Remote sensing properties of freezing rain events from space. J. Geophys. Res. Atmos. 124, 10385–10400. doi:10.1029/2019jd030788
Bernstein, B. (2000). Regional and local influences on freezing drizzle, freezing rain, and ice pellet events. Weather Forecast. 15, 485–508. doi:10.1175/1520-0434(2000)015<0485:raliof>2.0.co;2
Chen, B., Hu, W., and Pu, J. (2011). Characteristics of the raindrop size distribution for freezing precipitation observed in southern China. J. Geophys. Res. 116, D06201. doi:10.1029/2010jd015305
Davis, N., Hahmann, A., Clausen, N., and Žagar, M. (2014). Forecast of icing events at a wind farm in Sweden. J. Appl. Meteorol. Climatol. 53, 262–281. doi:10.1175/jamc-d-13-09.1
Deng, D., Gao, S., Du, X., and Wu, W. (2012). A diagnostic study of freezing rain over Guizhou, China, in January 2011. Q. J. R. Meteorol. Soc. 138 (666), 1233–1244. doi:10.1002/qj.981
Ding, Y., Wang, Z., Song, Y., and Zhang, J. (2008). Causes of the unprecedented freezing disaster in January 2008 and its possible association with the global warming. Acta. Meteor. Sin. 66, 808–825. doi:10.11676/qxxb2008.074
Drage, M., and Hauge, G. (2008). Atmospheric icing in a coastal mountainous terrain: Measurements and numerical simulations, a case study. Cold Reg. Sci. Technol. 53, 150–161. doi:10.1016/j.coldregions.2007.12.003
Frohboese, P., and Anders, A. (2007). Effects of icing on wind turbine fatigue loads. J. Phys. Conf. Ser. 75, 012061. doi:10.1088/1742-6596/75/1/012061
Gultepe, I., Isaac, G., Joe, P., Kucera, P., Theriault, J., and Fisico, T. (2014). Roundhouse (RND) mountain top research site: Measurements and uncertainties for winter alpine weather conditions. Pure Appl. Geophys. 171, 59–85. doi:10.1007/s00024-012-0582-5
Hu, Q., Wang, S., Yang, H., Shu, L., Jiang, X., Li, H., et al. (2016). Effects of icing degree on ice growth characteristics and flashover performance of 220kV composite insulators. Cold Reg. Sci. Technol. 128, 47–56. doi:10.1016/j.coldregions.2016.04.010
Huang, Y., Jiang, X., and Virk, M. (2021). Ice accretion study of FXBW4–220 transmission line composite insulators and anti–icing geometry optimization. Electr. Power Syst. Res. 194, 107089. doi:10.1016/j.epsr.2021.107089
Ikeda, K., Rasmussen, R., Hall, W., and Thompson, G. (2007). Observations of freezing drizzle in extratropical cyclonic storms during IMPROVE–2. J. Atmos. Sci. 64, 3016–3043. doi:10.1175/jas3999.1
Jasinski, W., Noe, S., Selig, M., and Bragg, M. (1998). Wind turbine performance under icing conditions. J. Sol. Energy Eng. 120, 60–65. doi:10.1115/1.2888048
Jones, K. (1998). A simple model for freezing rain ice loads. Atmos. Res. 46, 87–97. doi:10.1016/s0169-8095(97)00053-7
Kuang, X., Zhang, Y., Wang, Z., Huang, D., and Huang, Y. (2019). Characteristics of boreal winter cluster extreme events of low temperature during recent 35 years and its future projection under different RCP emission scenarios. Theor. Appl. Climatol. 138, 569–579. doi:10.1007/s00704-019-02850-8
Lamraoui, F., Fortin, G., Benoit, R., Perron, J., and Masson, C. (2014). Atmospheric icing impact on wind turbine production. Cold Reg. Sci. Technol. 100, 36–49. doi:10.1016/j.coldregions.2013.12.008
Lu, Z., Han, Y., and Liu, Y. (2022). Occurrence of warm freezing rain: Observation and modeling study. JGR. Atmos. 127, e2021JD036242. doi:10.1029/2021jd036242
Makkonen, L., and Ahti, K. (1995). Climatic mapping of ice loads based on airport weather observations. Atmos. Res. 36, 185–193. doi:10.1016/0169-8095(94)00034-b
Makkonen, L. (1984). Modeling of ice accretion on wires. J. Clim. Appl. Meteor. 23, 929–939. doi:10.1175/1520-0450(1984)023<0929:moiaow>2.0.co;2
Makkonen, L. (1998). Modeling power line icing in freezing precipitation. Atmos. Res. 46, 131–142. doi:10.1016/s0169-8095(97)00056-2
Makkonen, L. (2000). Models for the growth of rime, glaze, icicles and wet snow on structures. Philosophical Trans. R. Soc. Lond. Ser. A Math. Phys. Eng. Sci. 358, 2913–2939. doi:10.1098/rsta.2000.0690
Neil, D., Hahmann, A. N., Clausen, N. E., and Zagar, M. (2014). Forecast of icing events at a wind farm in Sweden. J. Appl. Meteorol. Climatol. 53 (2), 262–281. doi:10.1175/jamc-d-13-09.1
Niu, S., Zhou, Y., Jia, R., Yang, J., Lü, J., Ke, Y., et al. (2012). The microphysics of ice accretion on wires: Observations and simulations. Sci. China Earth Sci. 55, 428–437. doi:10.1007/s11430-011-4325-8
Nygaard, B., Kristjánsson, J., and Makkonen, L. (2011). Prediction of in–cloud icing conditions at ground level using the WRF model. J. Appl. Meteorol. Climatol. 50, 2445–2459. doi:10.1175/jamc-d-11-054.1
Rauber, R., Olthoff, L., Ramamurthy, M., and Kunkel, K. (2000). The relative importance of warm rain and melting processes in freezing precipitation events. J. Appl. Meteor. 39, 1185–1195. doi:10.1175/1520-0450(2000)039<1185:triowr>2.0.co;2
Szilder, K. (1994). Simulation of ice accretion on a cylinder due to freezing rain. J. Glaciol. 40, 586–594. doi:10.1017/s0022143000012478
Wang, S., and Jiang, X. (2012). Progress in research on ice accretions on overhead transmission lines and its influence on mechanical and insulating performance. Front. Electr. Electron. Eng. 7 (3), 326–336. doi:10.1007/s11460-012-0197-8
Wang, T., Niu, S., Lü, J., and Zhou, Y. (2019a). Observational study on the supercooled fog droplet spectrum distribution and icing accumulation mechanism in Lushan, Southeast China. Adv. Atmos. Sci. 36, 29–40. doi:10.1007/s00376-018-8017-6
Wang, T., Niu, S., Lü, J., Zhou, Y., and Wang, Y. (2019b). Observation and simulation studies of three types of wire icing. Atmosphere 10, 234. doi:10.3390/atmos10050234
Wang, Z. (2011). Climatic characters and changes of ice freezing days in China. Chin. J. Atmos. Sci. 35, 411–421. doi:10.3878/j.issn.1006-9895.2011.03.03
Wang, Z., Ding, Y., Zhou, B., and Chen, L. (2020). Comparison of two severe low-temperature snowstorm and ice freezing events in China: Role of Eurasian mid-high latitude circulation patterns. Int. J. Climatol. 40, 3436–3450. doi:10.1002/joc.6406
Wang, Z., Xing, H., Liao, L., Su, B., Zhao, Q., Feng, Y., et al. (2014a). The development of drug resistance mutations K103N Y181C and G190A in long term Nevirapine-containing antiviral therapy. AIDS Res. Ther. 33, 36–48. doi:10.1186/1742-6405-11-36
Wang, Z., Yang, S., Ke, Z., and Jiang, X. (2014b). Large–scale atmospheric and oceanic conditions for extensive and persistent icing events in China. J. Appl. Meteorol. Climatol. 53, 2698–2709. doi:10.1175/jamc-d-14-0062.1
Zhao, P., Xiao, H., Liu, J., and Zhou, Y. (2022). Precipitation efficiency of cloud and its influencing factors over the Tibetan plateau. Int. J. Climatol. 42 (1), 416–434. doi:10.1002/joc.7251
Zhao, S., Gao, G., Zhang, Q., Wang, Z., and Yin, S. (2010). Climate characteristics of freezing weather in China. Meteor. Mon. 36, 34–38.
Zhou, Y., Niu, S., Gao, Z., and Yang, J. (2018). Research to the influence factors on shedding processes of three–types icing. Cold Reg. Sci. Technol. 155, 300–307. doi:10.1016/j.coldregions.2018.08.024
Keywords: supercooled fog mixed with freezing rain, icing model, collision rate, freezing rate, wire icing
Citation: Zhou Y, Wan R, Sun J, Gao Z and Yang J (2023) Influence of key parameters of ice accretion model under coexisting rain and fog weather. Front. Earth Sci. 10:1036692. doi: 10.3389/feart.2022.1036692
Received: 05 September 2022; Accepted: 16 September 2022;
Published: 06 January 2023.
Edited by:
Honglei Wang, Nanjing University of Information Science and Technology, ChinaReviewed by:
Ying Wang, Gansu Meteorological Bureau, ChinaCopyright © 2023 Zhou, Wan, Sun, Gao and Yang. This is an open-access article distributed under the terms of the Creative Commons Attribution License (CC BY). The use, distribution or reproduction in other forums is permitted, provided the original author(s) and the copyright owner(s) are credited and that the original publication in this journal is cited, in accordance with accepted academic practice. No use, distribution or reproduction is permitted which does not comply with these terms.
*Correspondence: Rong Wan, d2Fucm9uZ0B3aGloci5jb20uY24=
Disclaimer: All claims expressed in this article are solely those of the authors and do not necessarily represent those of their affiliated organizations, or those of the publisher, the editors and the reviewers. Any product that may be evaluated in this article or claim that may be made by its manufacturer is not guaranteed or endorsed by the publisher.
Research integrity at Frontiers
Learn more about the work of our research integrity team to safeguard the quality of each article we publish.