 Mengxi Ren1†
 Liugen Zheng
95% of researchers rate our articles as excellent or good
Learn more about the work of our research integrity team to safeguard the quality of each article we publish.
Find out more
ORIGINAL RESEARCH article
Front. Earth Sci. , 31 October 2022
Sec. Geochemistry
Volume 10 - 2022 | https://doi.org/10.3389/feart.2022.1035792
This article is part of the Research Topic Advances in Geochemistry and Macromolecular Structure of Coal View all 8 articles
The polycyclic aromatic hydrocarbon (PAH) pollution process in mining areas, particularly coal mining areas, has accelerated because of coal chemical production and gangue accumulation. In this study, PHAs concentrations in surface soil was determined via gas chromatography–mass spectrometry. The composition, spatial distribution and sources of PAHs were analyzed, and their potential carcinogenic risks were evaluated.Results showed a wide PAH concentration range (218–1548 ng g−1). The high molecular weight proportion in contaminated areas was significantly higher than in uncontaminated areas. Clear differences in PAH distribution were detected in contaminated areas, with higher concentrations in the soils near an industrial park and coal gangue piles. The results of positive matrix factorization (PMF) in contaminated area revealed that coking, oil and biomass combustion, and vehicle emissions and coal combustion, contributed 31%, 26%, 24%, and 19%, respectively, to the detected PAHs. In contrast with the 10% contribution rate of the coking source in uncontaminated areas. The Monte Carlo method was used to assess the cancer risk to residents in the study areas. The carcinogenic health risk values for adults in the contaminated areas was higher than the safety standard (2.92 × 10⁻⁶) prescribed by the United States Environmental Protection Agency at 95% confidence level. Sensitivity analysis showed that the relative exposure duration (ED) and soil surface area of skin exposure were the most significant parameters for adults, and ED and body weight for children. The cancer risk for both adults and children in contaminated areas was five times than that in uncontaminated areas.
Industrial activities, such as coal mining create economic value, but together with factors such as urbanization, cause pollution of the surrounding environment (Chen et al., 2021; Zhang et al., 2021; Ren et al., 2022). Polycyclic aromatic hydrocarbon (PAH) pollution in soils is attracting and increasing attention (Huang et al., 2016; Ugwu and Ukoha, 2016; Jiang et al., 2022), as these contaminants accumulate in soil for an extended period and organisms cannot absorb them easily (Zhang et al., 2020). There are a variety of solid wastes left behind after mining, washing, and combusted of coal; for example, coal gangue and fly ash, which may contain high PAHs concentrations (Li et al., 2021; Chen et al., 2022). Particles from coal combustion and the accumulation of solid waste are released into the natural environment and imported into the surrounding soil through atmospheric deposition, causing PAH contamination (Abdel-Shafy and Mansour, 2016).
PAHs are hydrocarbons comprising two or more benzene rings (Kuang et al., 2011) and adducts and epoxides formed by binding with deoxyribonucleic acid (DNA). Both actions detrimentally affect the DNA and cause mutagenesis in imperative destinations of the genome (Munoz and Albores, 201). Therefore, PAHs have carcinogenic, teratogenic, and mutagenic effects in humans and the environment. Notably, 16 widespread PAHs in the environment have been declared priority contaminants by the United States Environmental Protection Agency (US-EPA) (US-EPA, 1991a). Contaminants are released into the environment (aquatic and terrestrial ecosystems and the atmosphere) by natural processes (e.g., forest fires, volcanic eruptions, and tree secretions) and anthropogenic activities (e.g., fossil fuel combustion, oil leaks, and vehicle emissions) (Kozak et al., 2017; Varjani et al., 2017; Adeniji et al., 2019). The high deposition rates of PAHs in soil and sediment are caused by their high hydrophobicity. They are adsorbed strongly by soil particles, with the soil ecosystem becoming the final PAH sink (Lasota and Błon´ska, 2018).
To date, Chinese and foreign research on PAHs in mining soil has mainly focused on the analysis of PAH concentrations, sources, ecological risk assessment and health risk. Liu et al. (2012) analyzed the distribution characteristics of soil PAHs around Tiefa coal mine in Liaoning Province, and obtained four pollution sources according to principal component analysis. Huang et al. (2016) studied sixteen PAHs in multimedia environment from the Heshan coal district of Guangxi Soil and water guidelines and the incremental lifetime risk (ICLR) were used to assess the health risk. Yakovleva et al. (2020) surveyed PAH concentrations in soils and moss Pleurozium schreberi (Wild. ex. Brid.) Mitt. in the Bolshezemelskaya tundra at the sites affected by coal mining and compared them to the control ecosystems. However, there are relatively few studies on the quantitative source analysis and carcinogenic risk assessment of PAHs in coal-related comprehensive industrial areas are relatively few.
Our research was carried out in a typical coal mining pollution area (Huaibei mining area), one of the 14 most important coal production bases in China due to its substantial coal reserves and high mining capacity. The mining area is a collection of coal mining and processing (coal preparation plants, coking plants, and coal-fired power plants, etc.). The region around the mining area is densely populated, and farmland is widely distributed (Sun et al., 2009). The local soil system has been considerably affected by nearly 60 years of coal mining and processing (Shang et al., 2016). However, there is still a lack of understanding about the extent and origin of PAHs in coal mining soil and their effects on human health.
Accordingly, the main objectives of this study were to 1) analyze the concentration and composition of PAHs in soils under the influence of coal mine emissions, 2) determine the pollution contribution rate of PAHs in such soils, 3) and simulate carcinogenic health risks for adults and children exposed to such contaminants by employing the Monte Carlo model to compare the possible exposure risks of coal mining areas and farmland areas.
The selected research area is the largest coal mining subsidence area in Suixi County, in the southwest of Huaibei City. The geographical coordinates are east longitude 116o34′25″–116o44′27″ and north latitude 33o36′50–″33o40′47.″ The local elevation increases from the southeast (+20.78 m) to the northwest (+28.58 m). The area has a warm, temperate, sub-humid monsoon climate characterized by four distinct seasons, namely a warm spring, hot summer, cool autumn, and cold winter. The average annual temperature in 2020 was 14.1°C. Rainfall is concentrated mostly in July and August, and the average annual rainfall is 906–1007 mm (Ren et al., 2022).
Three large underground mines are located in the research area, which is a typical hidden coal mine area in North China, with coal reserves of more than 4 billion tonne, and annual output of 26 million tonne. An industrial park was built here in 2005 to accommodate, e.g., coal-fired power plants, coal preparation plants, and coking plants with various functions, such as coal mining and coal byproduct processing. Long-term coal mining has led to a large range of subsidence areas surrounded by coal gangue and other by-product residues. Cambisols (Shajiang–Aquic cambisols) is the main soil type in accordance with the World Reference Base (WRB) soil classification system, and the parent material is fluvio–lacustrine sediments (Cooperative research group on Chinese soil taxonomy, 2001).
The soil in the study area was divided into polluted and unpolluted areas considering factors such as land use status, location of waste stacking area, constructed activity area, and the distribution of pollution sources in the mining area. 17 soil samples were collected from the contaminated area located near the industrial park, where solid gangue is accumulated and strong anthropogenic activities occur. Further, 10 samples were collected from the uncontaminated area that about 10 km away from the contamination sources, and the land use was mainly agricultural cultivation, as well as farmland in the north of the study area. Gangue and fly ash samples were collected from the largest local dump, and coal samples were taken from fresh raw coal mined in the study area (Figure 1).
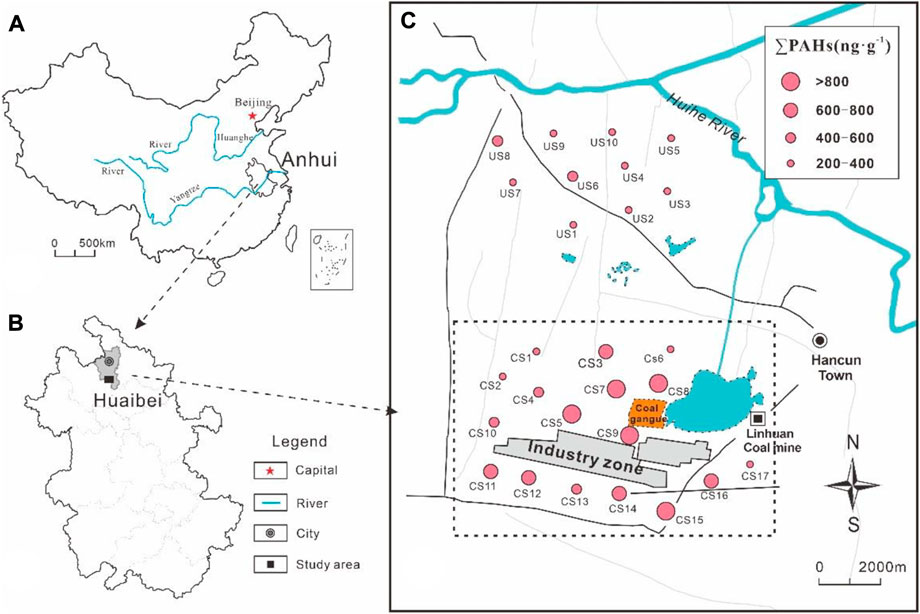
FIGURE 1. Sampling locations and spatial distribution of polyaromatic hydrocarbons in the study site. (The circle represents the topsoil; The size of the circle indicates the ∑16PAHs concentration; CS, contaminated; US, uncontaminated; (A): China; (B): Anhui Province; (C): study area).
All collected samples were freeze-drying to constant weight and debris such as root and gravel was removed. Samples sieved to <2 mm, subsequent approximately 20 g of dried samples was placed in prewashed cellulose fibre (30 × 100 mm). Operations it in acetone-dichloromethane solvent for 16–18 h (refluxed four to six times per hour). And concentrate eluent to 2 ml on a nitrogen blower (MD200, China), purified using activated magnesium silicate.
The 16 PAH target compounds in our study are naphthalene (Nap), acenaphthylene (Acy), acenaphthene (Ace), fluorene (Flu), phenanthrene (Phe), anthracene (Ant), fluoranthene (Flua), pyrene (Pyr), benzo [a] anthracene (BaA), chrysene (Chr), benzo [b] fluoranthene (BbF), benzo [k] fluoranthene (BkF), benzo [a] pyrene (BaP), indeno [1,2,3-cd] pyrene (InP), dibenzo [a, h] anthracene (DbA), and benzo [g,h,i] perylene (BghiP).
Activated copper powder (2 g) was added to the magnesium silicate column for desulfurization, and the concentrated extract was transferred to the rinsed column and eluted using a dichloromethane-n-hexane mixture. The eluate was collected, concentrate and add internal standard, and set the volume to 1ml, and stored in a refrigerator for testing. A gas chromatography–mass spectrometry (GC–MS) coupling instrument (Q Exactive GC, Thermo Fisher Scientific, United States) and a gas chromatographic column (TG-WAXMS), size: 30 m × 0.25 mm × 0.25 μm, were employed for the analyses. Heating proceeded as follows: heating to 60°C, with 10°C·min−1 increments up to 150°C; 4°C·min−1 increments up to 280°C, held for 10 min; 4°C·min−1 increments up to 280°C, held for 10 min; 2°C·min−1 increments up to 290°C, held for 10 min.
We conducted quantitative analysis employing the external standard peak area method and 8-point standard curve, considering the US National Institute of Standards and Technology (NIST) mass spectrometry library and the chromatographic peak retention time for qualitative analysis.
Standard curves drawn from the peak areas of the 16 PAHs mixed standards with different gradient concentrations (AccuStandard Inc., United States). Correlation coefficient for each PAH calibration curve was higher than 0.995. Quality control was performed by measuring the blank samples, parallel samples, and matrix-labeled samples. The detection limit in our experiment was 0.08–1.7 ng L−1, the detection rate of the target PAHs in the blank samples was 0 -, and the relative deviation of three parallel samples was <15%. The 2-fluoro-1, 1-Biphenyl, and p-terbenyl-D14 was added to all the samples at the start of the extraction, standard recovery rate was set to 64 ± 9%, 78 ± 12%, and 80 ± 14%, respectively, to correct errors in sample processing and analysis.
Data were standardized by logarithmic processing to fit the normal distribution before spatial distribution and uncertainty analyses could be performed. Positive matrix factorization (PMF) data analysis was conducted, employing the US-EPA PMF 5.0 model. Uncertainty analysis was performed to determine the health risks posed by soil PAHs in the study area, using Oracle Crystal Ball v11.1.2.3 software (Oracle Corporation, United States).
The PMF quantitative source analysis model (US EPA, 2014) is based on the multivariate factor analysis method, i.e., an efficient data analysis technique proposed by Paatero and Tapper (1993). (Paatero and Tapper, 1993). The method has been applied successfully for PAHs source analysis in water, atmosphere, soil, and sediments (Lang et al., 2013; Kwon and Choi, 2014; Ren et al., 2021). We used the PMF 5.0 model to analyze the soil in the study area. The model was considered as I × j dimensional matrix X, and X was decomposed into the pollution source contribution matrix g (i×k) and the pollution source composition spectrum matrix f (k×j), after which the measured sample concentration could be expressed as:
where Xij for the sample concentration matrix X means the concentration of the j species in the i sample, p is the number of pollution sources, gik is the contribution of the k pollution source to the i sample, fkj is the concentration of the j species in the kth source, and eij represents residuals.
The model imposes non-negative constraints (gik≥0 and fkj≥0). When the weighted value of Q of the square of the residual to the uncertainty ratio reaches a minimum, model factorization is the optimal result.
where Q is the cumulative residual, and the optimal solution of PMF model operation is the minimum Q. The calculation formula for the uncertainty of each sample/pollutant type is:
where MDL is the method detection limit (ng L−1), EF is the error coefficient, and c is the concentration of the sample/pollutant (ng L−1).
The human body takes up soil PAHs mainly through ingestion and dermal contact (Zhang et al., 2015). The risk posed by the inhalation of these contaminants is considered lower than that of ingestion or dermal exposure (10−3–10−6). As the cancer risk is not significant, this factor has been disregarded in extensive studies (Huang et al., 2018). Our study used a recommended risk assessment model (US-EPA, 1991b) for quantitative assessment of the health risk among adults and children posed by ingestion of and dermal exposure to the PAHs in the study area. As regards the carcinogenic risk, a value of >10−4 indicates a higher potential health risk, and an internal carcinogenic risk in the range of 10−6–10−4 points to cumulative cancer risks. However, at a risk value of <10−6, carcinogenic effects are considered unlikely (US-EPA, 1989).
The total carcinogenic risk (TCR) of PAHs is assessed by evaluating the human health hazard posed by the toxicity, risk exposure routes, and risk receptor response of the pollutants. The toxicity equivalent (TEQ) theory was proposed by the US-EPA (1993), and the total toxicity of the PAH mixture is calculated based on the toxicity equivalent factor (TEF) of a single PAH. The TEFs of the 16 priority PAH pollutants were calculated based on the standard values for agricultural land in the soil environmental quality index of Canada (CCME 2010). These TEQs will be used in the risk calculations.
where the expression in square brackets indicates the mass concentration of a single PAH compound in the soil sample (mgPAH·kgsoil−1), and the subscript numbers indicate the rings.
Chronic daily intake (CDI) of PAHs indicates the amounts of PAHs in the soil received through the exposed end. The ingestion and dermal contact exposure risks are calculated by Eqs 5, 6.
where CDIingestion is the CDI from ingestion (mgPAHkgbody weight−1d−1), CDIdermal is the CDI for dermal exposure (mgPAHkgbody weight−1d−1), IR is the ingestion rate (mgsoild−1), EF is the exposure frequency (d year−1), ED is exposure duration (year), CF is the conversion factor (10−6mgPAHngPAH−1×10⁻³gsoilmgsoil−1 = 10−9mgPAHgsoilngPAH−1mgsoil−1), BW is body weight (kg), ATc is average life span (d), SA is the available skin surface area for contact (cm2), AF is the dermal adherence factor (mgsoilcm−2d−1), and DAF is the dermal absorption factor (0.13).
The sum of the risks for the different PAH exposure routes is the TCR, expressed by Eqs 7, 8.
where CSF is the cancer slope factor (mgPAH−1kgbody weightd), i stands for repeating of the equation for ingestion and dermal contact.
Monte Carlo is a probabilistic simulation method that relies on variable definitions to formulate assumptions and determine a probabilistic model for selected parameters. The results of multiple stochastic simulations are also used for obtaining risk values of the selected risk assessments (Bai et al., 2011; Liang et al., 2013). Monte Carlo simulations were used for carcinogenic risk assessment and sensitivity studies (Chen and Liao, 2006). The variables for uncertainty analysis are shown in Table 1. The number of stochastic simulation iterations was set to 10,000. The confidence level was determined as 95%, and the output results are presented as probability distribution histograms.
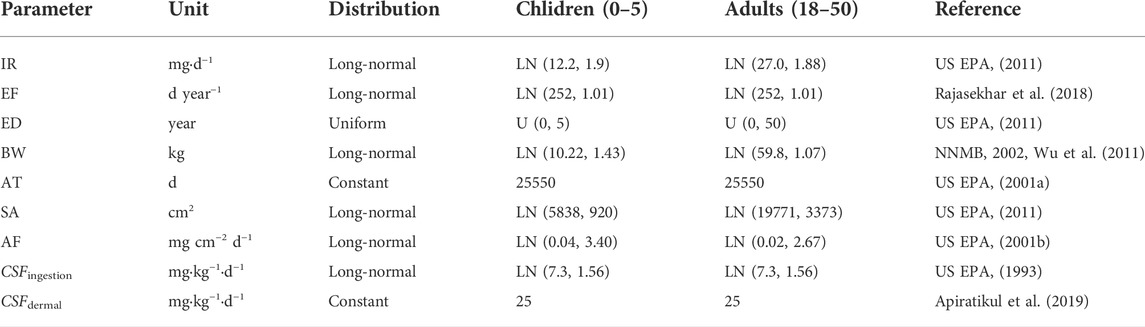
TABLE 1. Distributions and parameters of variables for TCR.
The results for the PAH concentrations in the soil samples from the study area are listed in Supplementary Tables S1, S2. In the contaminated area (CS), the ∑16PAHs concentration ranged between 218 and 1548 ng g−1 (mean = 769 ng g−1), which is beyond the range of typical endogenous PAHs in Chinese soil (1–10 ng g−1) (Edwards, 1983). The PAH concentration in uncontaminated soils (US) ranged between 219 ng g−1 and 440 ng g−1 (mean = 360 ng g−1), i.e., this variation range was smaller than that of the contaminated area (Figure 2). Maliszewska-Kordybach (1996) defined the degree of PAH contamination in soils at three levels, and all the samples in the uncontaminated areas are classified as weakly contaminated soils (∑16PAHs range 200–600 ng g−1). In the contaminated area, seven samples were derived from a normal contaminated area, five from a moderately polluted area (∑16PAHs range 600–1000 ng g−1), and five from heavily contaminated soils (∑16PAHs >1000 ng g−1). The highest soil value in the contaminated area is CS9 (1548 ng g−1), and the particular area is close to the gangue and fly ash yard. In the contaminated area, the ∑16TEQs values range between 5.5 and 246 ng g−1 (mean = 101 ng g−1). The value range in the uncontaminated areas is 11–76 ng g−1 (mean = 22 ng g−1).
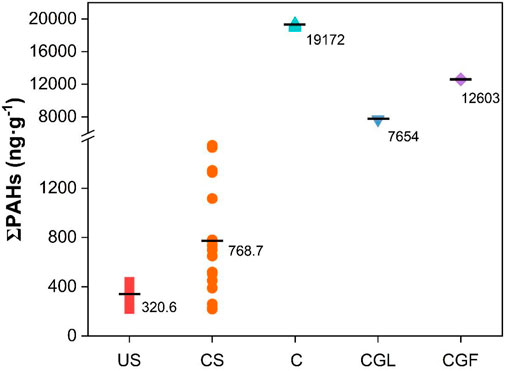
FIGURE 2. PAHs concentrations in contaminated soil, uncontaminated soil, coal, coal gangue (lump), coal gangue (fresh).
The PAH concentrations in the study area were compared with those in soils from other parts of China to obtain a clearer understanding of the local concentrations. As shown in Table 2, the ∑16PAHs level of soils in the study area is moderate but exceeds the levels in sediments of Adriatic Sea (Magi et al., 2002), farmland soils in Shanghai (Jia et al., 2017) and in soils of the Central Himalaya range (Bi et al., 2016). However, the value is lower than that in the urban soils of Novocherkassk, Seoul, and Shanghai (Wang R. W. et al., 2013; Sushkova et al., 2019; Tarafdar et al., 2020) that are affected by anthropogenic pollution sources such as dense traffic and combustion of fossil fuels. Moreover, the value in the study area is lower than the value range (371–4073 ng g−1) in the suburbs of Beijing (Cao et al., 2020) and comparable to the range (440–1360 ng g−1) in the industrial zone of Tianjin Binhai New Area (Zhu et al., 2014).
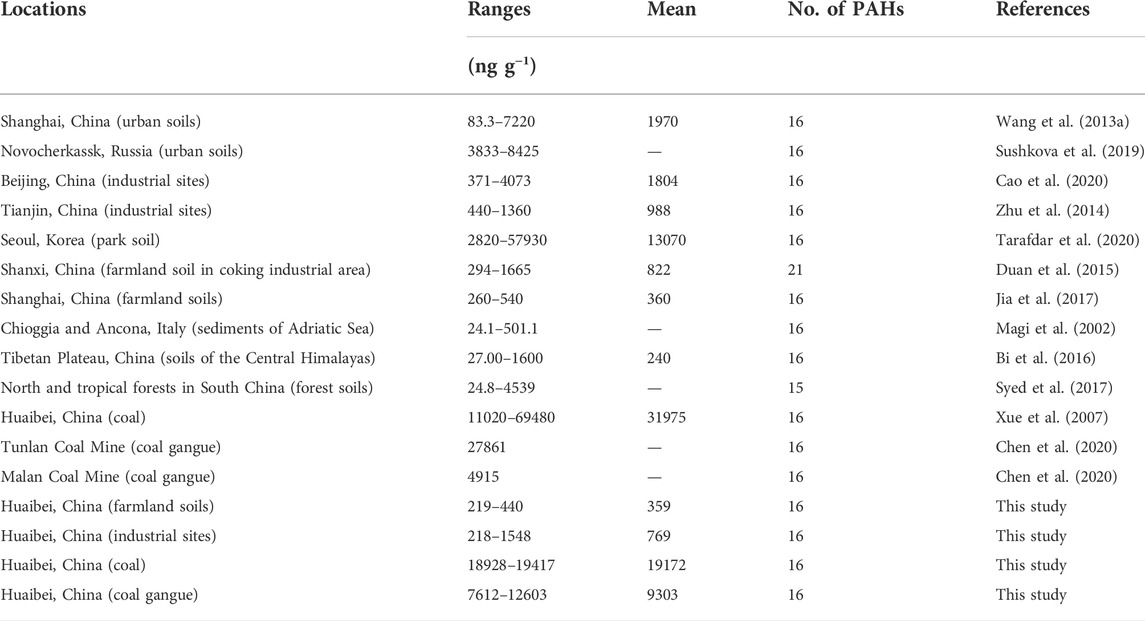
TABLE 2. Concentrations of total PAHs in soil in selected sites worldwide (ng g−1).
In conclusion, the level of PAH concentrations in the study area is moderate. The ∑16PAHs and ∑16TEQs values indicate the approximate degree of health risks, with a higher value indicating a greater health risk. The specific quantitative and ambiguous cancer risk indices are discussed in detail further on.
The soils in the contaminated and uncontaminated areas were analyzed further according to the concentrations of the individual PAHs (Supplementary Tables S1, S2). Table 3 shows the average concentration ratio of all the individual PAHs in the contaminated and uncontaminated areas (AvgUS/AvgCS) > 1. This result indicates that the contribution of PAHs in the study area derives mainly from industrial activities such as coal mining, burning, and coking. The differences between the average values of the individual PAH concentrations in CS and US were analyzed statistically employing a t-test (sample size <30). The results show that at the p < 0.01 level, the CS average PAH concentrations of Ant, Flua, and Bbf are significantly higher than those of the US. This result could be ascribed to fossil fuel and coal combustion and coking processes, which are the main sources of PAH pollution in soils of contaminated areas (Ho et al., 2009; Yang et al., 2013).
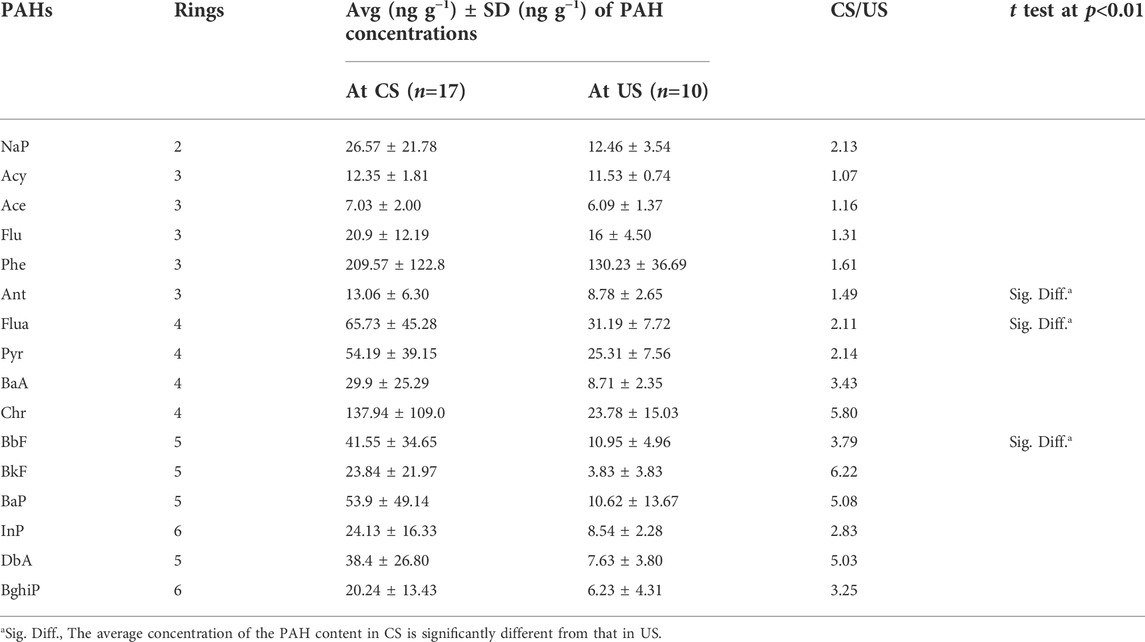
TABLE 3. Comparison of individual PAH concentrations in the soil samples from the contaminated area and uncontaminated area.
The PAH and TEQ concentrations in coal (C) and fresh coal gangue (CGF) are substantially more positive than those reported by Wang R. W. et al. (2013) (Supplementary Table S3). The concentrations of PAHs in coal vary considerably according to the type of the coal, e.g., the Linhuan mining area has mainly coking coal, fat coal, and ⅓ coking coal, with the highest concentration of PAHs being found in the coking coal stage (Xue et al., 2007). The CGF has a similar sedimentary environment and coal formation law, and the degree of coal deterioration and carbon concentration in gangue affects the PAH concentrations (Stout and Emsbo-Mattingly, 2008). Compared with C and CGF (19173 ng g−1 and 12604 ng g−1, respectively), the concentration of ∑16PAHs in coal gangue lumps (CGL) (mean = 4655 ng g−1) is the lowest, and the high ring number of individual PAHs is reduced considerably. This difference could be related to the decomposition of macromolecules after weathering and the structure being looser and easier to extract (Chen et al., 2020).
The composition profiles of soil, coal, and gangue PAHs in the study area were analyzed. The results show that the composition of PAHs varies in the different samples (Figure 3).
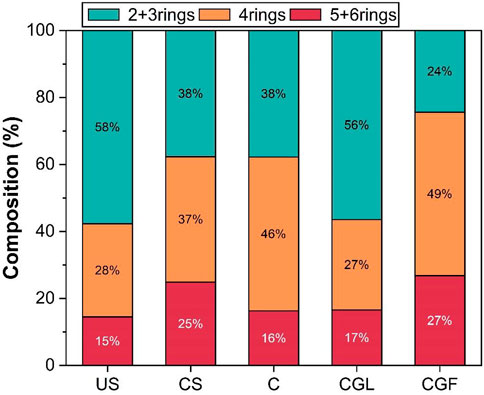
FIGURE 3. Composition of PAHs concentrations in contaminated soil, uncontaminated soil, coal, coal gangue (lump), coal gangue (fresh).
In uncontaminated soils, the highest contribution rate of Phe to ∑16PAHs is 41 ± 7.5%, followed by Flua and Pyr that contribute 9.7 ± 1.4% and 8.2 ± 3.2%, respectively. The overall proportion is low molecular weight (LMW) (58%) > moderate molecular weight (MMW) (28%) > high molecular weight (HMW) (15%). The contribution of Chr to ∑16PAHs is increased in the contaminated soil (14 ± 8.2%), with Phe, Flua, and Pyr contributing decreased (31 ± 18%, 7.2 ± 3.3%, and 5.7 ± 2.5%, respectively) than those in the uncontaminated area. However, the HMW ratio increases significantly (25%).
In Coal and coal gangue, MMW (46%) > LMW (38%) > HMW (16%) in C, the contribution rate of four rings PAHs increased considerably and that of Pyr reached 21 ± 1.1%. The contribution rate of the different CGF rings was consistent with that of C, and the contribution proportion of CGL after weathering was similar to that of soil in the contaminated area.
The spatial distribution of PAHs in the study area, indicating a higher concentration in CS than in the US (Figure 1). The spatial distribution could be related to industrial production and human activity in the region. The concentration of PAHs in the industrial park is the highest, probably because 1) Coal in the Linhuan mining area, mainly coking coal, fat coal, and ⅓ coking coal, contains significant amounts of PAHs. (Burmistrz P. and Burmistrz M. 2013). 2) Significant amounts of wastewater containing PAHs are produced in the coal coking and washing processes. Although standard treatment processes for industrial wastewater before discharge are available, PAHs cannot be removed completely (Li et al., 2012; Chen et al., 2020). 3) After coal is mined, the PAHs in the soil are not affected directly for a long time; however, coal transportation implies frequent vehicle traffic in the research area, with the combustion of automobile fuel releasing a large number of organic pollutants (Wang et al., 2012). The high PAH concentrations around CS5, CS7, CS8, and CS9 derive from the diffusion of coal dust into the topsoil and the release of native PAHs (Yun et al., 2017). This finding indicates that the industrial activities in the area do affect the PAH concentrations in the soil. Further, direct emissions from traffic and combustion increase the concentrations of PAHs in the soil.
The characteristic ratio method is based on the composition of PAHs emitted from different pollution sources and the relative difference in concentration between the homologues. The ratio of the isomer concentration of PAHs in the measured samples was compared with the ratio of the isomer concentration of the pollution source to qualitatively determine the source of the PAHs. As this method is simple and convenient, it is widely used to identify the sources.
The diagnostic ratio method is used based on the following premises: the proportion of PAHs of different types of emission sources is significantly different; no significant difference in the proportion of PAHs in the same type of emission source, and the most important is the mass balance of the chemical elements. However, the difference in chemical reactivity, volatility, and solubility of PAH species may introduce bias but to minimize this error, the diagnostic ratio with similar physicochemical properties of PAHs should be used (Ravindra et al., 2008). We used Flua/(Flua + Pyr), Ant/(Ant + Phe), InP/(InP+BghiP), and BaA/(BaA + Chr) for analyzing the PAH sources in the study area (Bucheli et al., 2004; Devi et al., 2016; Cai et al., 2017). Reference values and the interpretation of their potential sources are summarized for analysis of the results (Supplementary Table S4).
The PAH characteristic ratio results are shown in Figure 4. The (Ant)/(Ant+Phe) ratio of all the samples is less than 0.10 (except CS3) and, compared with CGF and CGL, the ratio is similar, indicating that petroleum is the source. The BaA/(BaA + Chr) value range is >0.35, indicating coal and biomass combustion as sources. The (Flua)/(Flua + Pyr) ratio exceeds 0.4, being mainly 0.5–0.63, which points to petroleum, coal, and biomass combustion. No BghiP was detected in the sampling points in either the contaminated or the uncontaminated areas. In CS, the InP/(InP + BghiP) value of nine sample points is <0.2, with six samples ranging from 0.2 to 0.5, mainly indicating petroleum and petroleum combustion as the sources. In contrast, the values of US of eight sample points are between 0.2 and 0.5, mainly indicating combustion sources. Some differences occur in the PAH sources between CS and US, with the characteristic ratios of US, CGL, and CGF being more similar.
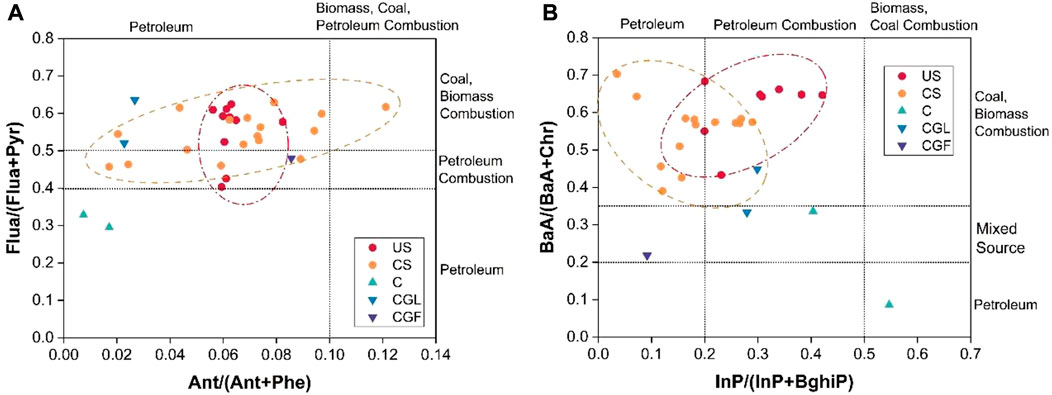
FIGURE 4. Diagnostic ratios of PAHs in contaminated soil, uncontaminated soil, coal, gangue. (US, uncontaminated soil; CS, contaminated soil; C, coal; CGL, coal gangue (lump); CGF, coal gangue (fresh))
The proportion of isoforms could vary from source to receptor, increasing the uncertainty of source recognition. We used the PMF model for further identification of the pollution sources and quantitative assessment of the effects of various PAH sources in the study area (Liang et al., 2019).
The EPA PMF 5.0 model was employed for quantitative analysis of the sources of 16 PAHs in soil samples from uncontaminated areas located in contaminated areas. Factors 3–7 were selected iteratively 20 times, and the “Robust” mode was used to eliminate the influence of individual extreme values. The contaminated area soil model finally selected four factors for quantitative analysis of the PAH sources. The optimal model operation result was obtained with the 18th run. After stable operation (CS1 and CS17 with standard residuals exceeding 3 were excluded), the QRobust and Qtrue value was 127.8, and residual analysis showed that all the sample residues were between −3 and 3. The model showed a good fit. The uncontaminated areas were analyzed using the same method, with the ninth run producing the optimal result. The QRobust and Qtrue value was 52.1, the residual analysis of all the samples was between −3 and 3, and the model structure was credible. Linear regression equations were established to calculate the contribution rates of the different sources. We used the normalized total PAH concentration as the dependent variable and the factor contribution matrix determined by PMF analysis as the independent variable.
The optimal result was selected and the PMF source analyzed, with the model run results shown in Figure 5. Among the main representatives of factor 1 in the contaminated soil, Nap and Chr have the highest factor load, with Nap usually indicating an incomplete combustion process, which is ascribed generally to a combustion-related source (Simcik et al., 1999). However, Chr usually indicates industrial coal burning (Li et al., 2003). Factor 1 likely reflects coal combustion as a source, with this factor contribution of 19%. The profile of factor 2 is dominated by Chr, BbF, BkF, InP, and Bghip. Among these, Chr, BbF, and BkF are markers for the traffic tunnel (Ho et al., 2009). Reports indicate InP and Bghipare as typical tracers of vehicle sources (Larsen and Baker, 2003; Zuo et al., 2007). Factor 2 is identified as vehicle emissions, with a contribution of 24%. In factor 3, Phe and Flua have the highest factor loadings. The contaminants Flua and Phe are sometimes used as indicators for coke oven sources (Yang et al., 2013; Zuo et al., 2007); therefore, factor 3 is interpreted as a coking source. Factor 4 is dominated by Nap, Phe, Chr, Bap, Chr, and BaP, which are used to trace diesel oil and biomass combustion (Cao et al., 2020). This factor contributes 26%.
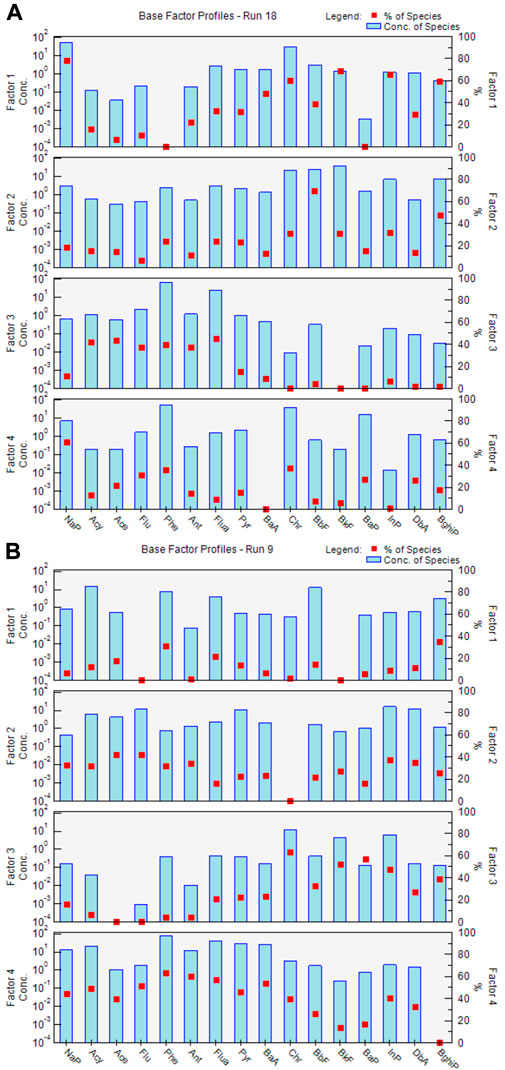
FIGURE 5. The source profiles of PAHs derived from the PMF model: (A) contaminated soil; (B) uncontaminated soil.
In the uncontaminated soil, factor 1 shows relatively high loadings of Acy, Phe, Flua, BbF, Bghip, Flua, and Chr. Reports indicate Acy, Phe, and Flua as the main components of coking (Rachwał et al., 2015); therefore, factor 1 identified the source as coking, with a factor contribution of 10%. In factor 2, Acy derives from the biomass burning process, with Flu, Pyr, InP, and DbA, and Flu, Pyr, InP, and DbA are identified as coal combustion emissions (Qin et al., 2014; Wang et al., 2015). Therefore, factor 2 represents a mixed source of biomass and coal combustion, with this factor contributing 10%. In factor 3, Chr, InP, and BkF mainly represent the products of diesel combustion (Larsen and Baker, 2003; Ho et al., 2009; Zuo et al., 2007); therefore, factor 3 indicates a traffic source, with a contribution of 27%. The main components of major factor 4 are NaP, Ant, Phe, Acy, Flua, Pyr, and BaA. The highest loadings are Phe and Flua, which are emitted by coal and biomass combustion (Wang X. T. et al., 2013, 2015). Therefore, factor 4 indicates the combustion source of coal and biomass, with a contribution of 53%.
PMF model was used to calculate the contribution rate of pollution sources to soil in study area. In contaminated soil the main pollution sources are coking, oil and biomass combustion, and vehicle emissions and coal combustion, with contributions of 31%, 26%, 24%, and 19%, respectively. And the results in uncontaminated soil are dominated by coal and biomass combustion, vehicle emissions, and coking, contributing 80%, 10%, and 10%, respectively. The PAH pollution sources in the soils of both the contaminated and the uncontaminated areas were similar, but the contribution rates differed. The contribution rate of coking to the pollution sources in the contaminated area soils is 31%. In contrast, coal and biomass combustion is the main source in the uncontaminated area, with the total contribution rate reaching 80%.
The PAH source analysis showed relatively severe coking pollution in the contaminated area. Coal mining, the coal coking industry, and similar enterprises do pose health risks to people, and the residential area around the mining area and industrial park has been exposed to low doses of PAHs for more than 60 years. Therefore, it is important to determine the health risk posed by PAHs in the study area.
Considering the cancer risk to residents in the study area, quantitative risk assessment was conducted using the formula BaPeq (4–8). Adults and children were assessed for health risks according to the classification of soils in the contaminated and uncontaminated areas. The result of the risk assessment for cancer was TCRCSAdult (1.23 × 10⁻⁶) > TCRCSChildren (4.12 × 10⁻⁷) > TCRUSAdult (2.70 × 10⁻⁷) > TCRUSChildren (9.03 × 10⁻⁸). The carcinogenic risk was higher in the contaminated area than in the uncontaminated area, and the risk was higher for adults than for children. The acceptable cancer risk level is TCRs 10−6 (Chen et al., 2018) and, our result, TCRCSAdult (1.23 × 10⁻⁶), shows a potential carcinogenic risk to adults.
The Monte Carlo method was applied as a statistical tool to assess cancer risks and conduct sensitivity studies. The total carcinogenic health risk values for adults and children were simulated under the ingestion and dermal contact routes in the contaminated and uncontaminated areas (CSAdult, CSChildren, USAdult, USChildren), respectively. The simulation results were compared with the health risk assessment results to verify their accuracy. Conducting multi-parametric analysis converted the uncertainty in health risk assessment into probability.
Estimated carcinogenic health risk values for adults and children at the 5% and 95% confidence levels were obtained after 10,000 randomized simulations in two regions (Figures 6,7) (Jiang et al., 2021). As the results Figure 6A], the predicted value range of CSAdult is 5.1 × 10⁻⁸–1.7 × 10⁻⁵ (mean = 1.1 × 10⁻⁶), and the 95% possible carcinogenic risk value is 2.9 × 10⁻⁶. Compared with the results for adults [Figure 6B], for CSChildren, the predicted value range is 1.8 × 10⁻⁹–4.1 × 10⁻⁶ (mean = 2.0 × 10⁻⁷), and the 95% possible carcinogenic risk value is 5.8 × 10⁻⁷. As shown in Figure 7A, the range of predicted values for USAdult is 7.9 × 10⁻⁹–3.9 × 10⁻⁶ (mean = 2.4 × 10⁻⁷), and the 95% possible carcinogenic risk value is 6.6 × 10⁻⁷. Figure 7B shows the predicted range of 2.2 × 10⁻¹⁰–1.1 × 10⁻⁶ (mean = 4.6 × 10⁻⁸) for USChildren, with a 95% possible carcinogenic risk value of 1.77 × 10⁻⁷. The log-normal fitting results are basically consistent with the predicted values. According to the US-EPA description of the acceptable cancer risk level for PAHs, the cancer risk for adults slightly exceeds the safety limits only in the simulated contaminated areas. The 95% probable cancer risk value for adult in study area lower than PAHs present in the soils from Jiaozhou Bay wetland (7.08 × 10⁻⁵) (Yang et al., 2014), but higher than the potential carcinogenic risks of in Liaohe estuarine reed wetland soils (1.14 × 10⁻⁷) (Lang et al., 2018). For children in study area lower than PAHs present in uncovered playground surface soil (1.29 × 10⁻⁶) in Seoul (Tarafdar et al., 2020), but higher than the potential carcinogenic risks of in Liaohe estuarine reed wetland soils (7.8 × 10⁻⁸) (Lang et al., 2018). Notably, the cancer risk for adults and children is five times that in the uncontaminated areas.
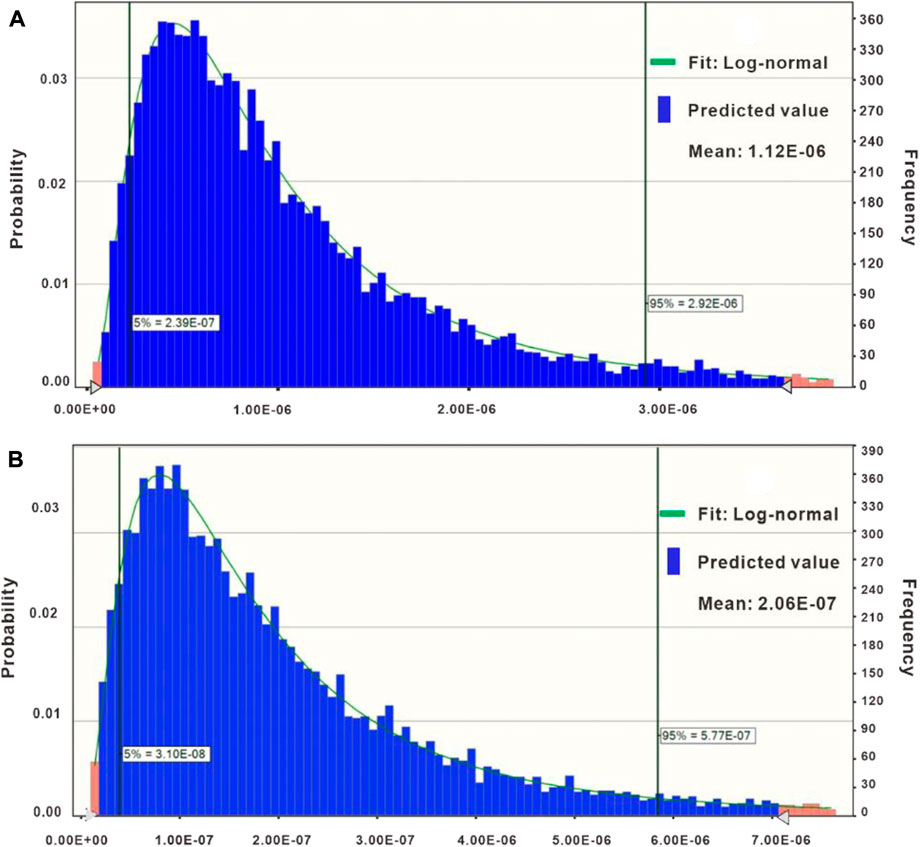
FIGURE 6. Histogram of cancer risk assessment for contaminated soil: (A) adult total carcinogenic risk; (B) children total carcinogenic risk.
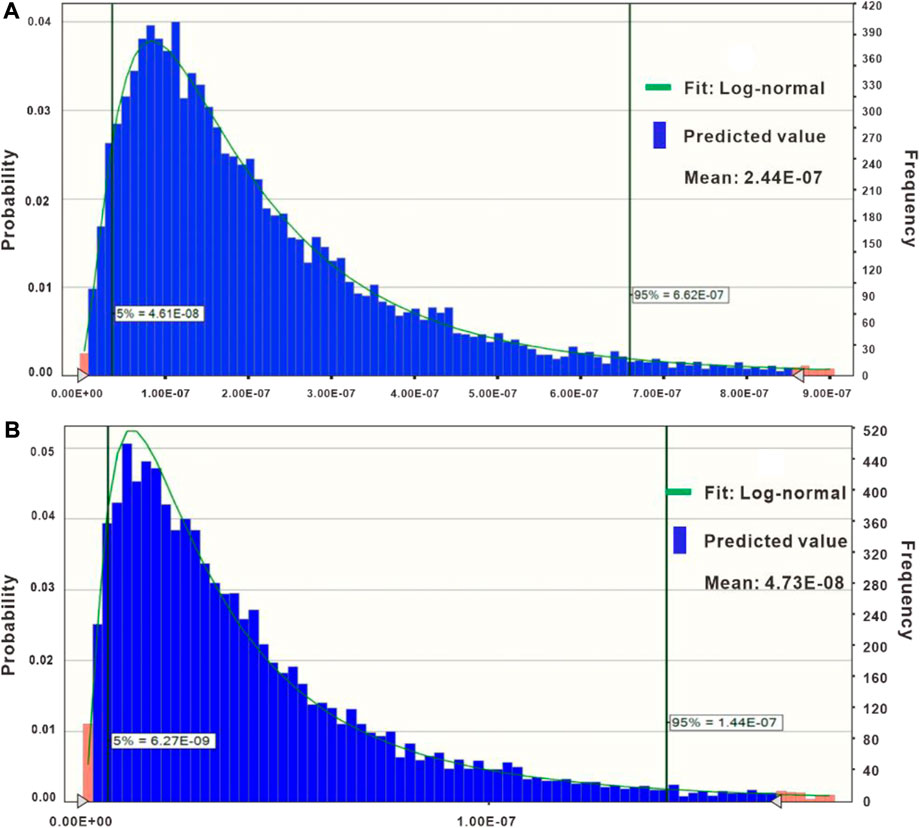
FIGURE 7. Histogram of cancer risk assessment for uncontaminated soil: (A) adult total carcinogenic risk; (B) children total carcinogenic risk.
We conducted a quantitative sensitivity study of each parameter of carcinogenic risk by calculating the rank linkage coefficient between each hypothesis for simulation runs and each prediction. The correlation coefficient provides an important proportion of the change in the forecast over the assumptions. The sensitivity of the selected parameters to carcinogenic risk is listed in Table 4. The tornado plots indicate the magnitudes (positive or negative) of parameter sensitivity correlations during the four simulations. In CSAdult, the ED assumption has the most significant effect on uncertainty in the overall risk outcome (72.6%), followed by the corresponding adhesion factor of the assumption on the available skin contact surface area (SA) (26.4%). A survey conducted by Yang et al. (2015) also indicated ED and SA as key parameters. The most sensitive parameters in the cancer risk modeling of CSChildren increased the contribution of ED (85.4%) and significantly decreased that of SA (7.8%) compared with these contributions for adults. The third place (at −6.6%) is occupied by BW (the negative value indicates that an increase in the assumption is associated with a decrease in the forecast). Wu et al. (2011) also reported that BW is a more important factor. The sensitivity ranking of USAdult and USChildren is consistent with the contaminated area. The most sensitive parameter to cancer risk in USChildren is ED (84.3%), followed by BW (−7.8%), and SA (7.5%). The sensitivity advantage of BW over the contaminated areas is 7.8% in USChildren. Sensitivity analysis reveals that efforts should be made to overcome the advantages of the probability distribution of two parameters (ED and SA) in adults, and (ED and BW) in children to improve the stable quality of risk assessment.
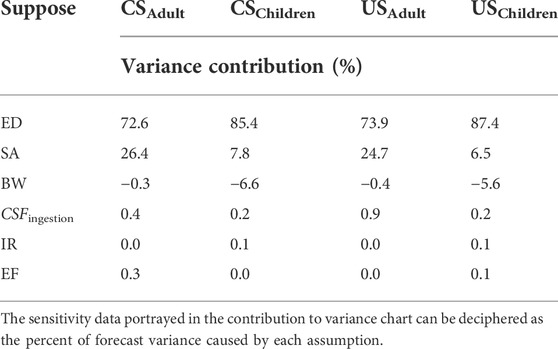
TABLE 4. Sensitivity analysis of the risk parameters.
Overall, in this study, the probability density functions and confidence intervals of health risks were determined using the Monte Carlo method, and uncertainty analysis was conducted to determine the effects of various parametric variables on the stability of the assessment. The simulation results combined with the health risks to obtain risk assessment results that are more comprehensive. Moreover, most parameters selected in this study refer to existing research results, e.g., the BaPeq value for DbA environmental exposure is 1 (Tsai et al., 2004). This value is probably an underestimation of the true effectiveness of the compound, as another study indicated a BaPeq of 5 (Nisbet and LaGoy, 1992). The probability distribution of exposure parameters, such as ingestion rate (IR) and SA, copied from the quality set of the US-EPA, probably does not fully match the situation in China, implying that they are uncertain parameters for the survey. Accordingly, further studies are required to determine the exact situation in China.
Herein, 16 potential PAHs in soils from 27 sampling a typical coal mine area were examined to study their spatial distribution, possible sources and carcinogenic risk assessments.
(1) The ∑16PAH contamination ranges from light to severe. The concentrations of ∑16PAHs and the values of ∑16TEQs in soils from the contaminated areas exceeded those from the uncontaminated areas.
(2) The diagnostic binary ratio and PMF used to determine the source and contribution ratio in contaminated and uncontaminated areas indicated that the results in CS were dominated by coking operations, oil and biomass combustion, and vehicle fuel and coal combustion, with values of 31%, 26%, 24%, and 19%, respectively. In contrast, in the uncontaminated areas, the PAHs derived mainly from coal and biomass combustion, vehicle fuel combustion, and coking operations, with contributions of 80%, 10%, and 10%, respectively.
(3) This first uncertainty survey of carcinogenic risk from PAH exposure in the mining soil of East China showed that the 95% cancer risk from contaminated areas in adult group (2.9 × 10⁻⁶) is higher to the standards set by USEPA. The carcinogenic risk of the contaminated area was five times that of the uncontaminated area, both in adult group and children group.
The original contributions presented in the study are included in the article/Supplementary Material, further inquiries can be directed to the corresponding author.
MR: Methodology, Formal analysis, Software, Formal analysis, Writing-original draft, Visualization. JH: Data curation, Validation, Writing-review and editing. YZ: Supervision. LZ: Conceptualization, Resources, Project administration, Funding acquisition.
This project was supported by the National Natural Science Fund Project of China (No. 42072201), Natural Science Foundation of Anhui Province (No. 1608085QD79), and Scientific and Technological Project of Huaibei Mining Industry (Group) Co., Ltd. (HK-2018-1 and Y06151717).
We acknowledge the editors and reviewers for providing suggestions regarding the language and extensive discussion that have greatly improved this manuscript.
Authors YZ, XD, XW were employed by Huaibei Coal Mining Group Corporation.
The remaining authors declare that the research was conducted in the absence of any commercial or financial relationships that could be construed as a potential conflict of interest.
All claims expressed in this article are solely those of the authors and do not necessarily represent those of their affiliated organizations, or those of the publisher, the editors and the reviewers. Any product that may be evaluated in this article, or claim that may be made by its manufacturer, is not guaranteed or endorsed by the publisher.
The Supplementary Material for this article can be found online at: https://www.frontiersin.org/articles/10.3389/feart.2022.1035792/full#supplementary-material
Abdel-Shafy, H. I., and Mansour, M. S. (2016). A review on polycyclic aromatic hydrocarbons: Source, environmental impact, effect on human health and remediation. Egypt. J. Petroleum 25, 107–123. doi:10.1016/j.ejpe.2015.03.011
Adeniji, A., Okoh, O., and Okoh, A. (2019). Levels of polycyclic aromatic hydrocarbons in the water and sediment of Buffalo River Estuary, South Africa and their health risk assessment. Arch. Environ. Contam. Toxicol. 76, 657–669. doi:10.1007/s00244-019-00617-w
Apiratikul, R., Pongpiachan, S., and Hashmi, M. Z. (2019). Health risk assessment of polycyclic aromatic hydrocarbons in coastal soils of Koh Samed Island (Thailand) after the oil spill incident in 2013. Mar. Pollut. Bull. 150 (1), 110736. doi:10.1016/j.marpolbul.2019.110736
Bai, X. R., Tang, J. C., Shi, R. G., and Yang, J. (2011). Soil contamination and health hazard analysis of nickel based on Monte-Carlo simulation. J. Saf. Environ. 11 (5), 123–126.
Bi, X., Luo, W., Gao, J., Lan, X., Guo, J., Zhang, Q., et al. (2016). Polycyclic aromatic hydrocarbons in soils from the central-himalaya region: Distribution, sources, and risks to humans and wildlife. Sci. Total Environ. 556, 12–22. doi:10.1016/j.scitotenv.2016.03.006
Bucheli, T. D., Blum, F., Desaules, A., and Gustafsson, O. (2004). Polycyclic aromatic hydrocarbons, black carbon, and molecular markers in soils of Switzerland. Chemosphere 56, 1061–1076. doi:10.1016/j.chemosphere.2004.06.002
Burmistrz, P., and Burmistrz, M. (2013). Distribution of polycyclic aromatic hydrocarbons in coke plant wastewater. Water Sci. Technol 68 (11), 2414–2420.
Cai, C. Y., Li, J. Y., Wu, D., Wang, X. L., Tsang, D. C. W., Li, X. D., et al. (2017). Spatial distribution, emission source and health risk of parent PAHs and derivatives in surface soils from the Yangtze River Delta, eastern China. Chemosphere 178, 301–308. doi:10.1016/j.chemosphere.2017.03.057
Cao, W., Geng, S. Y., Zou, J., Wang, Y. Y., Guo, Y. Q., Zhu, Y., et al. (2020). Post relocation of industrial sites for decades: Ascertain sources and human risk assessment of soil polycyclic aromatic hydrocarbons. Ecotoxicol. Environ. Saf. 198, 110646. doi:10.1016/j.ecoenv.2020.110646
CCME (Canadian Council of Ministers of the Environment) (2010). “Polycyclic aromatic hydrocarbons,” in Canadian soil quality guidelines for protection of environmental and human health (Canadian soil quality guidelines).
Chen, D., Wen, X. Q., Zeng, F. G., and Huang, D. M. (2020). Distribution of polycyclic aromatic hydrocarbons in coal gangue with different metamorphic degrees. IOP Conf. Ser. Earth Environ. Sci. 514, 022056. doi:10.1088/1755-1315/514/2/022056
Chen, S. C., and Liao, C. M. (2006). Health risk assessment on human exposed to environmental polycyclic aromatic hydrocarbons pollution sources. Sci. Total Environ. 366, 112–123. doi:10.1016/j.scitotenv.2005.08.047
Chen, X., Jiang, C. L., Zheng, L. G., Zhang, L. Q., Fu, X. J., Chen, S., et al. (2021). Evaluating the Genesis and dominant processes of groundwater salinization by using hydrochemistry and multiple isotopes in a mining city. Environ. Pollut. 283, 117381. doi:10.1016/j.envpol.2021.117381
Chen, X., Zheng, L. G., Sun, R. Y., Liu, S., Li, C., Chen, Y., et al. (2022). Mercury in sediment reflecting the intensive coal mining activities: Evidence from stable mercury isotopes and Bayesian mixing model analysis. Ecotoxicol. Environ. Saf. 234, 113392. doi:10.1016/j.ecoenv.2022.113392
Chen, Y. N., Zhang, J. Q., Zhang, F., Liu, X. P., and Zhou, M. (2018). Contamination and health risk assessment of PAHs in farmland soils of the Yinma river basin, China. Ecotoxicol. Environ. Saf. 156, 383–390. doi:10.1016/j.ecoenv.2018.03.020
Cooperative research group on Chinese soil taxonomy (2001). Chinese soil taxonomy. Beijing. New York: Science Press.
Devi, N. L., Yadav, I. C., Qi, S. H., Yang, D., Zhang, G., and Raha, P. (2016). Environmental carcinogenic polycyclic aromatic hydrocarbons in soil from himalayas, India: Implications for spatial distribution, sources apportionment and risk assessment. Chemosphere 144, 493–502. doi:10.1016/j.chemosphere.2015.08.062
Duan, Y. H., Shen, G. F., Tao, S., Hong, J. P., Chen, Y. C., Xue, M., et al. (2015). Characteristics of polycyclic aromatic hydrocarbons in agricultural soils at a typical coke production base in Shanxi, China. Chemosphere 127, 64–69. doi:10.1016/j.chemosphere.2014.12.075
Edwards, N. T. (1983). Polycyclic aromatic hydrocarbons (PAH's) in the terrestrial environment—a review. J. Environ. Qual. 12, 427–441. doi:10.2134/jeq1983.00472425001200040001x
Ho, K. F., Ho, S. S. H., Lee, S. C., Cheng, Y., Chow, J. C., Watson, J. G., et al. (2009). Emissions of gas- and particle-phase polycyclic aromatic hydrocarbons (PAHs) in the Shing Mun Tunnel, Hong Kong. Atmos. Environ. X. 43, 6343–6351. doi:10.1016/j.atmosenv.2009.09.025
Huang, H. F., Xing, X. L., Zhang, Z. Z., Qi, S. h., Yang, D., Yuen, D. A., et al. (2016). Polycyclic aromatic hydrocarbons (PAHs) in multimedia environment of heshan coal district, Guangxi: Distribution, source diagnosis and health risk assessment. Environ. Geochem. Health 38 (5), 1169–1181. doi:10.1007/s10653-015-9781-1
Huang, Z. Y., Wu, C. C., Bao, L. J., Wang, X. P., Muir, D., Zeng, E. Y., et al. (2018). Characteristics and potential health risk of rural Tibetans exposure to polycyclic aromatic hydrocarbons during summerperiod. Environ. Int 118, 70–77.
Jia, J. P., Bi, C. J., Guo, X., Wang, X. P., Zhou, X. X., and Chen, Z. L. (2017). Characteristics, identification, and potential risk of polycyclic aromatic hydrocarbons in road dusts and agricultural soils from industrial sites in shanghai, China. Environ. Sci. Pollut. Res. 24 (1), 605–615. doi:10.1007/s11356-016-7818-3
Jiang, C. L., Zhao, D. S., Chen, X., Zheng, L. G., Li, C., and Ren, M. X. (2022). Distribution, source and ecological risk assessment of polycyclic aromatic hydrocarbons in groundwater in a coal mining area, China. Ecol. Indic. 136, 108683. doi:10.1016/j.ecolind.2022.108683
Jiang, C. L., Zhao, Q., Zheng, L. G., Chen, X., Li, C., and Ren, M. X. (2021). Distribution, source and health risk assessment based on the Monte Carlo method of heavy metals in shallow groundwater in an area affected by mining activities, China. Ecotoxicol. Environ. Saf. 224, 112679. doi:10.1016/j.ecoenv.2021.112679
Kozak, K., Ruman, M., Kosek, K., Karasiński, G., Stachnik, L., and Polkowska, Z. (2017). Impact of volcanic eruptions on the occurrence of PAHs compounds in the aquatic ecosystem of the southern part of west Spitsbergen (Hornsund Fjord, Svalbard). Water 9, 42. doi:10.3390/w9010042
Kuang, Y. W., Zhou, G. Y., Wen, D. Z., Li, J., and Sun, F. f. (2011). Analysis of polycyclic aromatic hydrocarbons in tree-rings of Masson pine (Pinus massoniana L.) from two industrial sites in the Pearl River Delta, south China. J. Environ. Monit. 13 (9), 2630–2637. doi:10.1039/c1em10166h
Kwon, H. O., and Choi, S. D. (2014). Polycyclic aromatic hydrocarbons (PAHs) in soils from a multi-industrial city, South Korea. Sci. Total Environ. 470-471 (2), 1494–1501. doi:10.1016/j.scitotenv.2013.08.031
Lang, Y. H., Yang, X., Wang, H., Yang, W., and Li, G. L. (2013). Diagnostic ratios and positive matrix factorization to identify potential sources of PAHs in sediments of the Rizhao offshore, China. Polycycl. Aromat. Compd. 33 (2), 161–172. doi:10.1080/10406638.2012.762935
Lang, Y., Zhao, H., Liu, B., and Zhu, C. (2018). The levels and potential carcinogenic risks of PAHs in Liaohe estuarine reed wetland soils. Arch. Environ. Contam. Toxicol. 74 (3), 452–460. doi:10.1007/s00244-017-0499-1
Larsen, R. K., and Baker, J. E. (2003). Source apportionment of polycyclic aromatic hydrocarbons in the urban atmosphere: A comparison of three methods. Environ. Sci. Technol. 37, 1873–1881. doi:10.1021/es0206184
Lasota, J., and Błon´ska, E. (2018). Polycyclic aromatic hydrocarbons content in contaminated forest soils with different humus types. Water Air Soil Pollut. 229, 204. doi:10.1007/s11270-018-3857-3
Li, A., Jang, J. K., and Scheff, P. A. (2003). Application of EPA CMB8.2 model for source apportionment of sediment PAHs in Lake Calumet Chicago. Environ. Sci. Technol. 37 (13), 2958–2965. doi:10.1021/es026309v
Li, C., Zheng, L., Jiang, C., Chen, X., and Ding, S. (2021). Characteristics of leaching of heavy metals from low-sulfur coal gangue under different conditions. Int. J. Coal Sci. Technol. 8 (4), 780–789. doi:10.1007/s40789-021-00416-6
Li, W. H., Chen, B., and Ding, X. C. (2012). Environment and reproductive health in China: Challenges and opportunities. Environ. Health Perspect. 120 (5), 184–185. doi:10.1289/ehp.1205117
Liang, C. P., Jang, C. S., Chen, J. S., Wang, S. W., Lee, J. J., and Liu, C. W. (2013). Probabilistic health risk assessment for ingestion of seafood farmed in arsenic contaminated groundwater in Taiwan. Environ. Geochem. Health 35, 455–464. doi:10.1007/s10653-012-9507-6
Liang, M., Liang, H. D., Rao, Z., and Hong, X. P. (2019). Characterization of polycyclic aromatic hydrocarbons in urban-rural integration area soil, north China: Spatial distribution, sources and potential human health risk assessment. Chemosphere 234, 875–884. doi:10.1016/j.chemosphere.2019.06.119
Liu, J., Liu, G., Zhang, J., Yin, H., and Wang, R. (2012). Occurrence and risk assessment of polycyclic aromatic hydrocarbons in soil from the Tiefa coal mine district, Liaoning, China. J. Environ. Monit. 14 (10), 2634–2642. doi:10.1016/s0269-7491(01)00321-9
Magi, E., Bianco, R., Ianni, C., and Carro, M. D. (2002). Distribution of polycyclic aromatic hydrocarbons in the sediments of the Adriatic Sea. Environ. Pollut. 119, 91–98.
Maliszewska-Kordybach, B. (1996). Polycyclic aromatic hydrocarbons in agricultural soils in Poland: Preliminary proposals for criteria to evaluate the level of soil contamination. Appl. Geochem. 11 (1-2), 121–127. doi:10.1016/0883-2927(95)00076-3
Munoz, B., and Albores, A. (2011). “DNA damage caused by polycyclic aromatic hydrocarbons: Mechanisms and markers,” in Selected topics in DNA repair, 124–145.
Nisbet, I. C. T., and LaGoy, P. K. (1992). Toxic equivalency factors (TEFs) for polycyclic aromatic hydrocarbons (PAHs). Regul. Toxicol. Pharmacol. 16, 290–300. doi:10.1016/0273-2300(92)90009-x
NNMB (2002). Diet and nutritional status of rural population. Hyderabad, India: Report by National Institute of Nutrition. Indian Council of Medical Research.
Paatero, P., and Tapper, U. (1993). Analysis of different modes of factor analysis as least squares fit problems. Chemom. Intell. Lab. Syst. 18, 183–194. doi:10.1016/0169-7439(93)80055-m
Qin, L., Han, J., He, X., and Lu, Q. (2014). The emission characteristic of PAHs during coal combustion in a Fluidized bed combustor. Energy Sources Part A Recovery Util. Environ. Eff. 36, 212–221. doi:10.1080/15567036.2010.536830
Rachwał, M., Magiera, T., and Wawer, M. (2015). Coke industry and steel metallurgy as the source of soil contamination by technogenic magnetic particles, heavy metals and polycyclic aromatic hydrocarbons. Chemosphere 138, 863–873. doi:10.1016/j.chemosphere.2014.11.077
Rajasekhar, B., Nambi, I. M., and Govindarajan, S. K. (2018). Human health risk assessment of ground water contaminated with petroleum PAHs using Monte Carlo simulations: A case study of an Indian metropolitan city. J. Environ. Manage. 205, 183–191. doi:10.1016/j.jenvman.2017.09.078
Ravindra, K., Sokhi, R., and Grieken, R. V. (2008). Atmospheric polycyclic aromatic hydrocarbons: Source attribution, emission factors and regulation. Atmos. Environ. X. 42 (13), 2895–2921. doi:10.1016/j.atmosenv.2007.12.010
Ren, C. B., Zhang, Q. Q., Wang, H. W., and Wang, Y. (2021). Characteristics and source apportionment of polycyclic aromatic hydrocarbons of groundwater in hutuo river alluvial-pluvial fan, China, based on PMF model. Environ. Sci. Pollut. Res. 28 (8), 9647–9656. doi:10.1007/s11356-020-11485-6
Ren, M. X., Zheng, L. G., Wang, D. D., Chen, X., Dong, X. L., Wei, X. P., et al. (2022). Copper isotope ratios allowed for quantifying the contribution of coal mining and combustion to total soil copper concentrations in China. Environ. Pollut. 308, 119613. doi:10.1016/j.envpol.2022.119613
Shang, W. Q., Tang, Q., Zheng, L. G., and Cheng, H. (2016). Chemical forms of heavy metals in agricultural soils affected by coal mining in the Linhuan subsidence of Huaibei Coalfield, Anhui Province, China. Environ. Sci. Pollut. Res. 23 (23), 23683–23693. doi:10.1007/s11356-016-7599-8
Simcik, M. F., Eisenreich, S. J., and Lioy, P. J. (1999). Source apportionment and source/sink relationships of PAHs in the coastal atmosphere of Chicago and Lake Michigan. Atmos. Environ. X. 33, 5071–5079. doi:10.1016/s1352-2310(99)00233-2
Stout, S. A., and Emsbo-Mattingly, S. D. (2008). Concentration and character of PAHs and other hydrocarbons in coals of varying rank – implications for environmental studies of soils and sediments containing particulate coal. Org. Geochem. 39 (7), 801–819. doi:10.1016/j.orggeochem.2008.04.017
Sun, Y. Z., Fan, J. S., Qin, P., and Niu, H. Y. (2009). Pollution extents of organic substances from a coal gangue dump of Jiulong Coal Mine, China. Environ. Geochem. Health 31 (1), 81–89. doi:10.1007/s10653-008-9158-9
Sushkova, S., Minkina, T., Deryabkina, I., Rajput, V., Antonenko, E., Nazarenko, O., et al. (2019). Environmental pollution of soil with PAHs in energy producing plants zone. Sci. Total Environ. 655 (10), 232–241. doi:10.1016/j.scitotenv.2018.11.080
Syed, J. H., Iqbal, M., Zhong, G., Katsoyiannis, A., Yadav, I. C., Li, J., et al. (2017). Polycyclic aromatic hydrocarbons (PAHs) in Chinese forest soils: Profile composition, spatial variations and source apportionment. Sci. Rep. 7, 2692. doi:10.1038/s41598-017-02999-0
Tarafdar, A., Oh, M. J., Nguyen-Phuong, Q., and Kwon, J. H. (2020). Profiling and potential cancer risk assessment on children exposed to PAHs in playground dust/soil: A comparative study on poured rubber surfaced and classical soil playgrounds in Seoul. Environ. Geochem. Health 42, 1691–1704. doi:10.1007/s10653-019-00334-2
Tsai, P. J., Shih, T. S., Chen, H. L., Lee, W. J., Lai, C. H., and Liou, S. H. (2004). Assessing and predicting the exposures of polycyclic aromatic hydrocarbons (PAHs) and their carcinogenic potencies from vehicle engine exhausts to highway toll station workers. Atmos. Environ. X. 38, 333–343. doi:10.1016/j.atmosenv.2003.08.038
Ugwu, K. E., and Ukoha, P. O. (2016). Analysis and sources of polycyclic aromatic hydrocarbons in soil and plant samples of a coal mining area in Nigeria. Bull. Environ. Contam. Toxicol. 96 (3), 383–387. doi:10.1007/s00128-016-1727-5
US EPA (US Environmental Protection Agency) (2014). Priority pollutant list. https://www.epa.gov/sites/production/files/2015-09/documents/priority-pollutant-list-epa.pdf (Accessed December 22, 2018).
US EPA (US Environmental Protection Agency) (1993). Provisional guidance for quantitative risk assessment of polycyclic aromatic hydrocarbons. Washington DC: US-EPA.
US EPA (US Environmental Protection Agency) (2011). “Risk assessment guidance for superfund,” in Part A: Human health evaluation manual; Part E, supplemental guidance for dermal risk assessment.
US EPA (US Environmental Protection Agency) (2001a). Risk assessment guidance for superfund (RAGS) volume III—part A: Process for conducting probabilistic risk assessment. Off emerg remedial response US environ prot agency III. https://www.epa.gov/sites/production/files/2015-09/documents/rags3adt_complete.pdf.1385
US EPA (US Environmental Protection Agency) (1989). Risk assessment guidance for superfund. In: Human health evaluation manual. Retrieved from https://www.epa.gov/sites/production/files/2015-09/documents/rags_a.pdf.
US EPA (US Environmental Protection Agency) (1991a). Risk assessment of guidance for superfund. Volume 1 - human health evaluation manual (part b, development of risk-based preliminary goals). Retrieved from https://epa-prgs.ornl.gov/radionuclides/HHEMB.pdf.
US EPA (US Environmental Protection Agency) (1991b). Role of the baseline risk assessment in superfund remedy selection decisions. Washington, D.C., 20460.
US EPA (US Environmental Protection Agency) (2001b). Supplemental guidance for developing soil screening levels for superfund sites. OSWER 9355, 4–24.
Varjani, S. J., Joshi, R. R., Kumar, P. S., Srivastava, V. K., Kumar, V., Banerjee, C., et al. (2017). “Polycyclic aromatic hydrocarbons from petroleum oil industry activities: Effect on human health and their biodegradation,” in Waste bioremediation, energy, environment, and sustainability (Singapore: Springer), 185–199.
Wang, C., Wu, S., Zhou, S. L., Wang, H., Li, B., Chen, H., et al. (2015). Polycyclic aromatic hydrocarbons in soils from urban to rural areas in nanjing: Concentration, source, spatial distribution, and potential human health risk. Sci. Total Environ. 527-528, 375–383. doi:10.1016/j.scitotenv.2015.05.025
Wang, R. W., Liu, G. J., Zhang, J. M., Chou, C. L., and Liu, J. J. (2013a). Abundances of polycyclic aromatic hydrocarbons (PAHs) in 14 Chinese and American coals and their relation to coal rank and weathering. Energy fuels. 24 (11), 6061–6066. doi:10.1021/ef1010622
Wang, X. T., Miao, Y., Zhang, Y., Li, Y. C., Wu, M. H., and Yu, G. (2013b). Polycyclic aromatic hydrocarbons (PAHs) in urban soils of the megacity shanghai: Occurrence, source apportionment and potential human health risk. Sci. Total Environ. 447, 80–89. doi:10.1016/j.scitotenv.2012.12.086
Wang, Z., Yang, P., Wang, Y., and Ma, X. (2012). Urban fractionation of polycyclic aromatic hydrocarbons from Dalian soils. Environ. Chem. Lett. 10, 183–187. doi:10.1007/s10311-011-0341-3
Wu, B., Zhang, Y., Zhang, X. X., and Cheng, S. P. (2011). Health risk assessment of polycyclic aromatic hydrocarbons in the source water and drinking water of China: Quantitative analysis based on published monitoring data. Sci. Total Environ. 410, 112–118. doi:10.1016/j.scitotenv.2011.09.046
Xue, J., Liu, G. J., Niu, Z., Chou, C. L., Qi, C. C., Zheng, L. G., et al. (2007). Factors that influence the extraction of polycyclic aromatic hydrocarbons from coal. Energy fuels. 21 (2), 881–890. doi:10.1021/ef0605753
Yang, B., Zhou, L., Xue, N., Li, F., Li, Y., Vogt, R. D., et al. (2013). Source apportionment of polycyclic aromatic hydrocarbons in soils of huanghuai plain, China: Comparison of three receptor models. Sci. Total Environ. 443, 31–39. doi:10.1016/j.scitotenv.2012.10.094
Yang, Q., Chen, H., Li, B., and Li, F. (2015). Polycyclic aromatic hydrocarbons (PAHs) in indoor dusts of Guizhou, southwest of China: status, sources and potential human health risk. PLoS One 10, 1–17.
Yakovleva, E. V., Gabov, D. N., Kondratenok, B. M., and Dubrovskiy, Y. A. (2020). Two-year monitoring of PAH in the soils and Pleurozium schreberi under the impact of coal mining. Polycycl. Aromat. Compd. 41 (10), 2055–2070. doi:10.1080/10406638.2019.1709213
Yang, W., Lang, Y. H., and Li, G. L. (2014). Cancer risk of polycyclic aromatic hydrocarbons (PAHs) in the soils from Jiaozhou Bay wetland. Chemosphere 112, 289–295. doi:10.1016/j.chemosphere.2014.04.074
Yun, Y., Gao, R., Yue, H. F., Liu, X. F., Li, G. K., and Sang, N. (2017). Polycyclic aromatic hydrocarbon (PAH)-containing soils from coal gangue stacking areas contribute to epithelial to mesenchymal transition (EMT) modulation on cancer cell metastasis. Sci. Total Environ. 580, 632–640. doi:10.1016/j.scitotenv.2016.12.010
Zhang, J., Liu, F., Huang, H., Wang, R., and Xu, B. (2020). Occurrence, risk and influencing factors of polycyclic aromatic hydrocarbons in surface soils from a large-scale coal mine, Huainan, China. Ecotoxicol. Environ. Saf. 192, 110269. doi:10.1016/j.ecoenv.2020.110269
Zhang, J., Qu, C., Qi, S., Cao, J., Zhan, C., Xing, X., et al. (2015). Polycyclic aromatic hydrocarbons (PAHs) in atmospheric dustfall from the industrial corridor in Hubei Province, Central China. Environ. Geochem. Health 37 (5), 891–903. doi:10.1007/s10653-014-9647-y
Zhang, L. Q., Zhou, H. H., Chen, X., Liu, G. J., Jiang, C. L., and Zheng, L. G. (2021). Study of the micromorphology and health risks of arsenic in copper smelting slag tailings for safe resource utilization. Ecotoxicol. Environ. Saf. 219, 112321. doi:10.1016/j.ecoenv.2021.112321
Zhu, Y. Y., Tian, J., Wei, E. Q., and Wei, F. S. (2014). Characteristicssources apportionment and ecological risks assessment of polycyclic aromatic hydrocarbons in soils of TianjinChina. , Environ. Chem. 33 (2), 248–255.
Keywords: polycyclic aromatic hydrocarbons, soil contamination, positive matrix factorization model, source analysis, monte carlo
Citation: Ren M, Zheng L, Hu J, Chen X, Zhang Y, Dong X, Wei X and Cheng H (2022) Characterization of polycyclic aromatic hydrocarbons in soil in a coal mining area, East China: Spatial distribution, sources, and carcinogenic risk assessment. Front. Earth Sci. 10:1035792. doi: 10.3389/feart.2022.1035792
Received: 03 September 2022; Accepted: 30 September 2022;
Published: 31 October 2022.
Edited by:
Dun Wu, Anhui Jianzhu University, ChinaReviewed by:
Carlos German Massone, Pontifical Catholic University of Rio de Janeiro, BrazilCopyright © 2022 Ren, Zheng, Hu, Chen, Zhang, Dong, Wei and Cheng. This is an open-access article distributed under the terms of the Creative Commons Attribution License (CC BY). The use, distribution or reproduction in other forums is permitted, provided the original author(s) and the copyright owner(s) are credited and that the original publication in this journal is cited, in accordance with accepted academic practice. No use, distribution or reproduction is permitted which does not comply with these terms.
*Correspondence: Liugen Zheng, bGd6aGVuZ0B1c3RjLmVkdS5jbg==
†Present address: Mengxi Ren; Liugen Zheng, School of Resources and Environmental Engineering, Anhui Province Engineering Laboratory for MineEcological Remediation, Anhui University, Hefei, Anhui, China
Disclaimer: All claims expressed in this article are solely those of the authors and do not necessarily represent those of their affiliated organizations, or those of the publisher, the editors and the reviewers. Any product that may be evaluated in this article or claim that may be made by its manufacturer is not guaranteed or endorsed by the publisher.
Research integrity at Frontiers
Learn more about the work of our research integrity team to safeguard the quality of each article we publish.