 Peng Kong
 Rong Liu1,2*
95% of researchers rate our articles as excellent or good
Learn more about the work of our research integrity team to safeguard the quality of each article we publish.
Find out more
ORIGINAL RESEARCH article
Front. Earth Sci. , 11 January 2023
Sec. Economic Geology
Volume 10 - 2022 | https://doi.org/10.3389/feart.2022.1034332
This article is part of the Research Topic Gas-Water-Rock Interaction and Multi Physical Field Coupling Mechanism View all 16 articles
In the process of coal mine production, rock burst accidents near faults occur frequently. In order to further reveal the induced mechanism of fault slip rock burst, a numerical simulation method for dynamic calculation of fault slip under the influence of mining is proposed, and the law of fault slip and dynamic response characteristics of the stope are studied. The study shows that with the working face getting closer to the fault, the fault activity and the number of high-energy microseismic events increase significantly, and the fault slip dynamic load has a significant impact on the vibration velocity and abutment stress of coal and rock mass near the stope. Under the effect of a strong fault slip dynamic load, the coal and rock mass in the area with peak abutment stress undergo plastic failure and release a large amount of energy, and the potential of fault slip rock burst is high. The evaluation index Icd of rock burst hazard under fault slip dynamic load is proposed, and the rock burst hazard of working face passing through the fault is analyzed. The research results provide a theoretical basis for further revealing the induced mechanism and hazard assessment of fault slip rock bursts.
Rock burst is the sudden release of elastic energy accumulated in coal and rock mass under certain conditions. When a rock burst occurs, it is often accompanied by loud noise, strong instantaneous vibration, and shock waves, resulting in the throwing out of coal and rock mass, the instantaneous sinking of the roof, or the sudden bulging of the floor. It can destroy the equipment and cause severe deformation or even closure of the roadway in serious cases (Jiang et al., 2020; Xue et al., 2020; Li et al., 2021a; Li et al., 2021b). According to the different inducing factors of rock burst, Ortlepp and Stacey (1994) divided rock burst into three categories: the strain rock burst, the coal pillar rock burst, and the fault slip rock burst. Ortlepp’s classification of rock burst and corresponding shock source and magnitude is given in Table 1. The strain rock burst often occurs in the area with peak abutment stress or at the elastic–plastic interface of coal and rock mass. The strain rock burst causes large-scale expansion of the plastic failure area of coal and rock mass and the ejection of coal and rock mass. The coal pillar rock burst is mainly caused by sudden instability and failure of the coal pillar, which is induced by the concentrated static load of the coal pillar exceeding the bearing capacity of coal and rock mass. The main sources of high static load are the stress of primary rock and mining-induced stress. The main failure form caused by a coal pillar rock burst is the pressure failure of the coal pillar or the instantaneous bulging of the floor. Compared with the other two types of rock bursts, the fault slip rock burst has higher source energy and a larger damage range. Fault slip rock burst is caused by the instability and failure of coal and rock mass near the mining space due to the dynamic disturbance of fault slip microseismicity, and the severity of rock burst is closely related to the size of fault slip microseismic event. Moreover, the location of microseismic source–induced dynamic load disturbance may be far away from the rock burst appearance location.
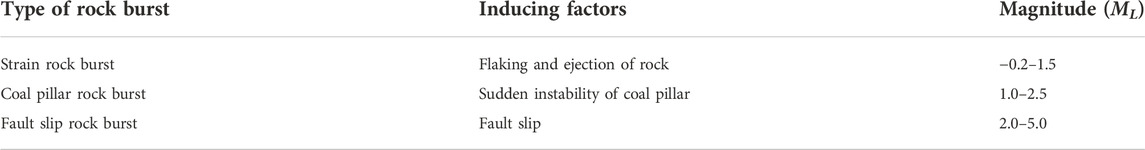
TABLE 1. Rock burst classification, source, and magnitude.
With the gradual depletion of coal resources in shallow and easily mined coal seam areas, the geological situation of coal mining in China is deteriorating. In particular, coal mines in the eastern and northeast regions are generally affected by complex geological conditions, and the fault structure is one of the most common geological structures in the process of coal mine production. The wide distribution of fault structures has a significant impact on the distribution of abutment stress (Xue et al., 2021; Li et al., 2022; Si et al., 2022) and the characteristics of overburden movement (Wang et al., 2018; Wang et al., 2019). Lai et al. (2016) studied the influence range of dynamic pressure during mining in fault fracture areas through the field monitoring method. The result indicated that the roadway deformation shows obvious asymmetric change characteristics during the working face passing through the fault, the roadway deformation near the fault side was greater, and the bolt stress and surrounding rock stress concentration increased significantly. Luo et al. (2014) and Wang et al. (2014) carried out a similar material simulation test for a mining panel near the F16 reverse fault in Yuejin Coal Mine. The research result showed that with the increase of mining depth of the working face and the decrease of the fault coal pillar size, the degree of coal pillar stress concentration increased significantly. In addition, the dynamic load provided by the fault slip is one of the main factors that induce rock burst. Zhu et al. (2016) studied the law of fault activation in the mining of deep and extra-thick coal seam through on-site microseismic analysis and numerical simulation; they divided the whole process of mining-induced fault activation into three stages: stress manifestation, energy storage, and structural activation.
The continuous disturbance to the fault during mining the panel is likely to cause fault slip, and the process of fault slip is often accompanied by strong microseismic events. The strong microseismicity causes severe dynamic load disturbance to the coal and rock mass in the stope, and the rock burst hazard of the stope increases significantly. Affected by complex geological conditions, more than 50 rock burst accidents occurred during mining in the Longfeng Coal Mine, Guizhou Province. A total of 36 rock bursts were related to the fault structure, and 31 occurred in the roadway near the fault (Li et al., 2018). From 2008 to 2014, a total of 20 rock bursts occurred in Qianqiu Coal Mine and Yuejin Coal Mine affected by the F16 reverse fault. The accidents caused dozens of deaths, and the length of the roadway damaged by the rock bursts reached more than 1,000 m (Cai et al., 2021). On 22 February 2020, when mining Panel 2305S through the FD8 fault, a serious rock burst occurred in Xinjulong Coal Mine. The accident caused four deaths and severely damaged about 500 m of the roadway. The source of the fault slip microseismic event which induced the rock burst was 160 m above the coal seam, and the source energy reached 4.2 × 10⁷ J. Therefore, a microseismic event with large energy released by the fault slip is one of the important factors causing the violent appearance of mine pressure and even inducing rock burst disaster.
In the research on the mechanism of fault slip activation–induced microseismic events, Brace and Byerlee put forward the hypothesis of seismic stick slip by analyzing the results of rock shear tests, and they believed that the unstable slip of stress reduction on the fault was caused by the existence of large normal stress on the fault (Brace and Byerlee, 1966). Compared with the joints with weak fillings, the frequency and energy released during the shear process of clean joints are higher (Meng et al., 2017). In addition, the roughness of joints is also an important factor affecting fault activation–induced microseismic events (Zhou et al., 2016; Si et al., 2021a; Wang et al., 2021). The higher the roughness of joints, the greater the potential of fault slip releasing strong microseismicity. In terms of numerical simulation research, Zhu studied the focal characteristics of the fault under the influence of mining. The research results showed that the greater the mining depth, the greater the seismic moment of fault slip induced by mining.
Scholars have carried out a lot of research on the effect of fault mining action and have achieved fruitful results. However, at present, the understanding of the induced mechanism of fault slip rock burst is not clear, especially, the research on the shear slip law of fault induced by mining, the fault slip microseismic characteristics, and the dynamic response of surrounding rock under fault slip dynamic load is not enough. Based on the engineering background of mining the panel through the fault, the research methods, including field investigation, laboratory test, theoretical analysis, and numerical simulation, were applied in this study. A systematic study was carried out on the evolution of microseismic events induced by fault slip under the influence of mining, the dynamic response characteristics of stope under fault slip dynamic load, the mechanism of fault slip rock burst, and the rock burst hazard. The research results can provide theoretical guidance for understanding the induced mechanism of fault slip rock bursts and provide a certain reference for hazard assessment and prevention of fault slip rock bursts.
The average thickness of the coal seam in the Dongtan Coal Mine 14310 Panel is 8 m. The mining technology is comprehensive mechanized top coal caving mining, and the retreating full caving method is used to manage the roof. The direct roof of the coal seam is mudstone with an average thickness of about 4 m. The basic roof is mainly composed of siltstone and sandstone. The roof of the coal seam is relatively hard, especially since the average uniaxial compressive strength of sandstone in the roof reaches 102 MPa. The coal seam and roof of the panel have a weak rock burst tendency. The working face has a buried depth of 540 m, a width of 230 m, and a strike length of 1000 m. The geological structure of the working face is complex, in which the NF6 normal fault crosses through the panel, with a fault dip of 60° and a drop of 6–10 m. In the actual mining process, the working face crosses through the footwall of the NF6 normal fault. NF6 normal fault has a great impact on mining. The layout of Panel 14310 and fault location are shown in Figure 1.
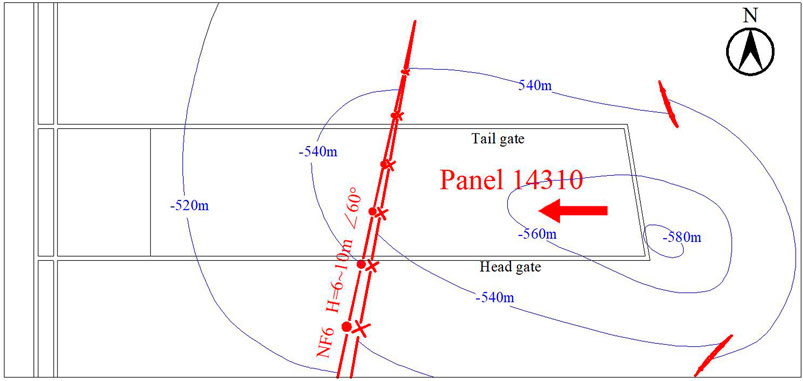
FIGURE 1. Layout of panel 14310 in Dongtan Coal Mine.
The distribution of microseismic events during Panel 14310 of the Dongtan Coal Mine mined through the fault is shown in Figure 2 (Kong et al., 2022). It can be seen that there was a concentrated area of microseismic events near the fault when mining the panel through the fault. Moreover, the number and energy level of microseismic events near the roof fault were much greater than those near the floor fault, indicating that the roof fault was more active than the floor fault affected by mining. The distribution height of microseismic events near the fault was larger than that of the complete roof area, and the energy level was high. Microseismic events with energy greater than 5 × 10³ J had mostly occurred near the roof fault plane and were induced by fault slip.
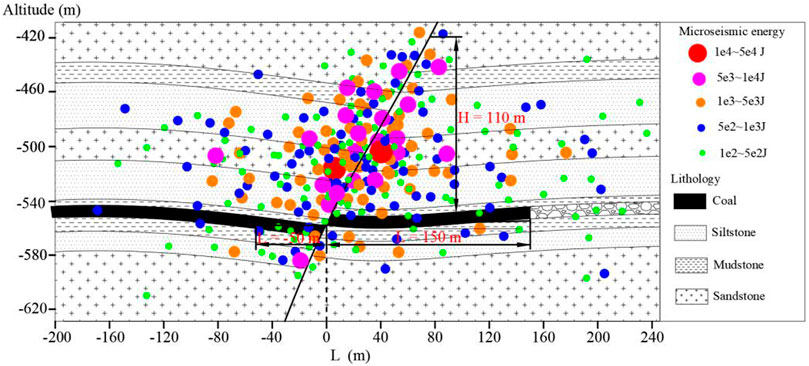
FIGURE 2. Distribution of microseismic events when mining the panel through the fault.
In order to analyze the occurrence law of microseismic events and fault activity when mining Panel 14310 through the fault of Dongtan Coal Mine, the microseismic events during the mining period in Dongtan Coal Mine from July 17 to August 26 (the working face was 108 m away from the fault to 56 m across the fault) were statistically processed, and the b value of microseismic events was calculated.
Gutenburg and Richter have conducted long-term research on natural seismicity and found that the relationship between earthquake occurrence frequency (lgN) and earthquake magnitude (M) met the power–law relationship. They put forward the relationship between earthquake magnitude and earthquake frequency, namely, the G-R relationship (Scholz, 1968; Wang, 2012):
where M is the earthquake magnitude, N≥(M) represents the number of earthquakes with a magnitude greater than or equal to M, and a and b are constants. The value of b represents the magnitude of earthquake intensity. The larger the value of b, the larger the proportion of low-energy earthquakes, and the earthquake intensity is low. The smaller the value of b, the larger the proportion of high-energy earthquakes, and there is a high possibility of strong earthquakes or rock bursts. Therefore, the b value can be used as an index to evaluate the strength level of an earthquake somewhere. The research showed that the occurrence law of mine microseismic events also followed the same law. The smaller the b value, the greater the potential of a strong mine microseismic event or rock burst.
When calculating the G-R relationship of microseismic events when mining the panel through the fault, the energy level lgE was used instead of the magnitude M, so Eq. 1 can be expressed as
The b value was calculated with three days as the time interval. The microseismic events and energy levels within three days were counted, and the microseismic events were classified according to the energy. In order to ensure the accuracy of the calculation, the microseismic events were divided into nine levels. The energy level division and the setting of M(lgE) are shown in Table 2. After dividing the energy level according to the table, the number N of microseismic events at each energy level was counted, and the value of lgN was calculated. Linear fitting was performed on the corresponding data of lgE and lgN, and the b value of the working face at different mining positions was obtained.
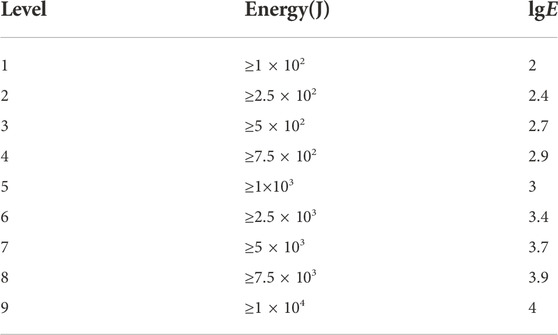
TABLE 2. Division of energy levels for microseismic events.
The b value of microseismic event when the working face advanced to different positions is shown in Figure 3. It can be seen that the b value varied greatly when the working face was at different positions. From July 17 to July 28, the distance from the working face to the fault was 108–64 m, and the b values were 1.2, 1.14, 1.14, and 1.16, respectively. The b value generally showed a slightly decreasing trend, but the decreasing range was very small, and the b value had been maintained at a high level. It illustrated that there were few microseismic events with high energy in this mining stage. From July 29 to July 31, the distance from the working face to the fault was 64–52 m, and the b value decreased sharply from 1.16 to 0.66, indicating that the frequency of high-energy microseismic events increased significantly.
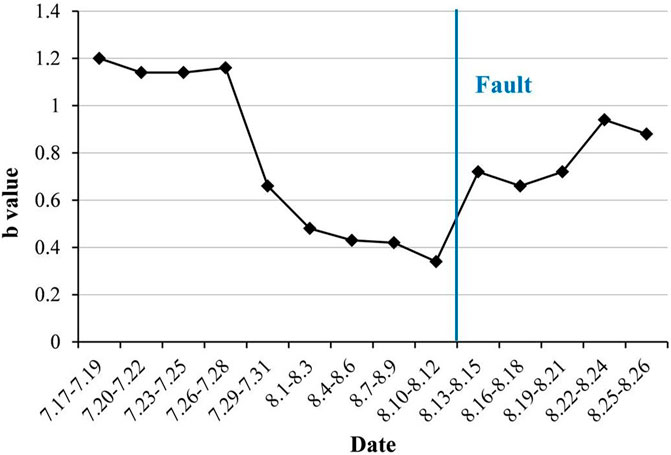
FIGURE 3. b Value of microseismic event when mining the panel through the fault.
From August 1 to August 12, the distance from the working face to the fault was 52–4 m, and the b values were 0.48, 0.43, and 0.34, respectively. The b value was kept at a low level. As the working face got close to the fault, the b value decreased gradually. It showed that with the working face getting closer to the fault, the frequency of high-energy microseismic events increased significantly. According to Figure 2, large energy microseismic events were mostly concentrated near the fault. It can be seen that when the working face advanced near the area, the fault activity was intense under the influence of mining. Microseismic events with large energy released by fault slip dislocation occurred frequently. Microseismic events with large energy may induce rock burst accidents easily, and the hazard of rock bursts is high.
From August 13 to August 26, the working face advanced from 4 m away from the fault to 56 m across the fault, and the b values were 0.66, 0.72, 0.94, and 0.88, respectively. The value b showed a gradually increasing trend basically. It showed that the frequency of large energy microseismic events released by fault slip decreased, the degree of disturbance to the working face decreased, and the hazard of fault slip rock burst decreased.
The fault zone is cut by widely distributed structural planes, and their mechanical behavior is significantly affected by structural planes. In engineering practice, the fault structural plane is not straight and often shows rough characteristics. The mechanical properties and shear slip characteristics of the rough structural surface are quite different from those of the flat and smooth structural surface. Especially during the stick slip process of the hard rough structural surface, the energy level released by the shear wear of the bulge is higher (Zhou et al., 2016; Si et al., 2021a; Wang et al., 2021). Therefore, an in-depth study of the mechanical properties of rough structural planes is of great significance for revealing the law of fault slip.
The hard sandstone in the roof of Dongtan Coal Mine played an important role in roof movement and fault slip, so the direct shear test was carried out on the sandstone structural plane in the hard roof of Dongtan Coal Mine to test the law of fault shear slip and determine the weakening parameters of fault shear slip. The test specimen was a cuboid with a size of 100 mm high by 110 mm wide by 110 mm long. First, the complete cuboid rock specimens were split to form a rough structural plane to simulate that in a natural state. Then, the randomly generated structural plane was scanned using a 3D laser scanner to obtain the coordinate point cloud data of the rough structural plane. 3D laser scanning was carried out at Qingdao Research Institute of Xi’an Jiaotong University. The measurement speed of the scanner is 18000 measurements/second, the measurement accuracy reaches 0.05 metrological level, the volume accuracy is 0.02 mm + 0.2 mm/m, and the resolution is 0.1 mm. The point cloud data of rough structural surface obtained by 3D laser scanning is shown in Figure 4. The measurement accuracy can meet the requirements for calculating the roughness of structural surfaces. Finally, the structural plane roughness was calculated, and the roughness of the structural plane was obtained based on Eqs 3 and 4 (Tse and Cruden, 1979).
where JRC is the joint roughness coefficient, Z2 is the root mean square of the average slope of the joint contour line, Dx is the spacing between two points, and M is the number of Dx on the whole rough line.
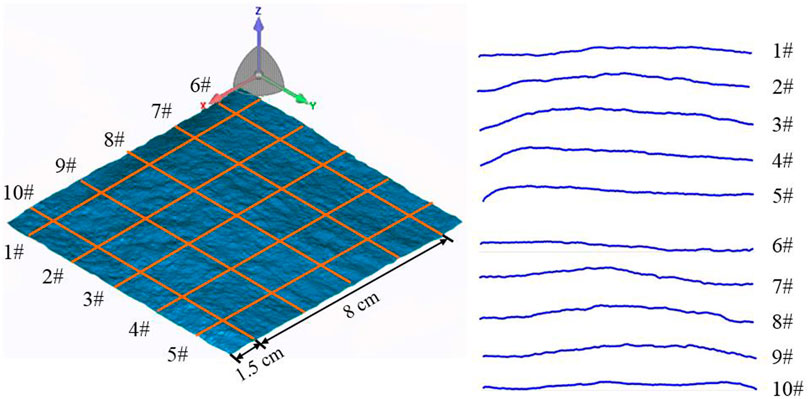
FIGURE 4. Point cloud data of the rough structural plane and layout of survey line.
The direct shear test under different normal stress conditions was carried out on the rough structural surface, and four tests were carried out. The normal stress was 2, 4, 10, and 14 MPa, respectively. The roughness of the four rough structural surfaces was 9.77, 9.89, 10.06, and 10.18, respectively. The structural plane roughness of the four specimens had little difference, and the roughness of the specimens can be considered the same. The direct shear test adopts the deep soft rock nonlinear test system of the China University of Mining and Technology, and the direct shear rate during the test is 0.004 mm/s.
Figure 5 shows the shear stress-strain curve of the rough structural plane under different normal stress conditions. It can be seen that the shear strength of the structural plane increased along with the normal stress. When the normal stress in the process of direct shear was 2, 6, 10, and 14 MPa, the shear strength of the structural plane was 6.6, 10.5, 15.2, and 19.7 MPa, respectively. It showed that under the condition of the same roughness, the larger the normal stress was, the less likely the rough structural plane was to shear failure. The difference between the peak shear stress and the shear stress after shear failure was defined as the shear stress drop. When the normal stress was 2, 6, 10, and 14 MPa, the shear stress drop was 2.9, 4.9, 5.5, and 5.9 MPa, respectively. Therefore, the shear strength and shear stress drop of the structural plane increased with the increase of normal stress in the process of direct shear of the rough structural plane. The higher the normal stress, the more obvious the stick slip characteristics in the shear slip process of the structural plane.
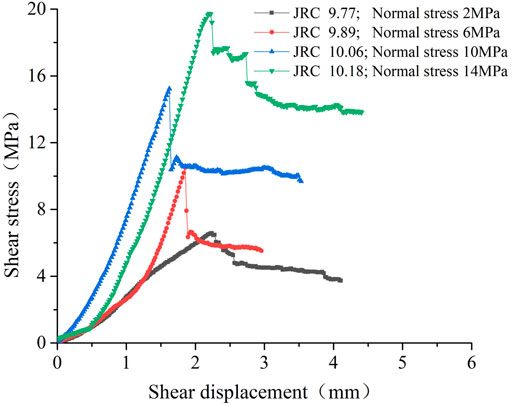
FIGURE 5. Shear stress-strain curves of the structural plane under different normal stress and JRC conditions.
The structural plane roughness after direct shear was scanned using a three-dimensional laser again, and the structural plane roughness after direct shear was calculated to study the slip weakening characteristics of the rough structural plane. The roughness after direct shear of the rough structural plane under different normal stress conditions is shown in Figure 6. It can be seen that the higher the normal stress, the greater the reduction value of structural surface roughness after direct shear. When the normal stress was 2 MPa, the reduction value of roughness after direct shear was 2.09. When the normal stress was 14 MPa, the roughness reduction after direct shear was 4.21. The roughness of the structural plane decreased exponentially with the increase of normal stress. The decrease of roughness after direct shear of the rough structural plane meant that the physical and mechanical properties of the structural plane would decay in varying degrees after direct shear. The significant reduction of roughness after direct shear was the main reason why the structural plane showed stick slip characteristics and released a lot of energy in the shear process. The higher the normal stress of the structural plane, the more obvious the slip weakening characteristics and the higher the released energy level in the direct shear process.

FIGURE 6. JRC value of the structural plane after shear under different normal stress.
The FLAC3D numerical simulation model of Panel 14310 in Dongtan Coal Mine was established, as shown in Figure 7. The model was 710 m long, 450 m wide, and 180 m high. There are 316,664 gridpoints and 301,995 zones in the model, and the mesh size meets the accuracy requirements of numerical calculation. According to the actual occurrence characteristics of NF6 normal fault, the dip angle of the interruption layer in the numerical model was set as 60°, and the drop was set as 8 m. The mining situation of the working face passing through the fault from the footwall was simulated. In order to eliminate the influence of the boundary effect in the process of numerical calculation, the distance between the panel and the model boundary should be not less than 100 m; the buried depth of the simulated coal seam was 540 m, and the unit weight of the unsimulated rock above the model was assumed to be 25 KN/m3 (Kong et al., 2019; Si et al., 2021b). It was calculated that the equivalent load of the unsimulated rock stratum was 10.8 MPa, and the load was applied to the upper boundary of the model. According to the in-situ stress test results, the lateral pressure coefficient of the model along the fault inclination direction was set as 0.6, and the lateral pressure coefficient along the fault strike direction was set as 0.8.
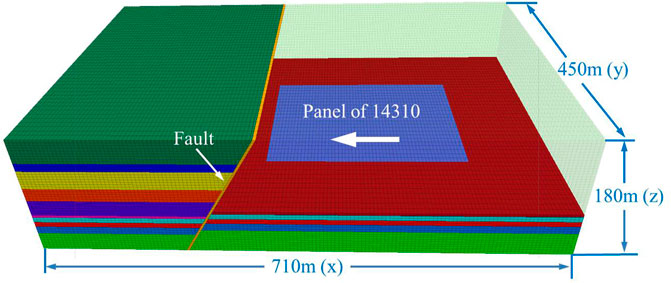
FIGURE 7. Numerical simulation model.
Mohr–Coulomb strain softening model was adopted for coal and rock mass in the numerical simulation. In the Mohr–Coulomb strain softening model, the strength parameters show a linear attenuation trend with the increase of equivalent plastic strain and finally attenuate to the residual value after the plastic failure of coal and rock mass. The research shows that the ratio of residual cohesion to initial cohesion of coal and rock mass generally ranges from 1/2 (Zhang et al., 2015) to 1/40 (Yan et al., 2013), so the ratio of residual cohesion to initial cohesion was taken as 1/5 in this study. Table 3 shows the mechanical parameters of coal and rock mass in the process of numerical simulation. The fault is simulated by an improved ubiquitous-joint model, and the model can take the slip weakening characteristics in the process of fault slip into consideration and reduce the roughness value after fault slip under different normal stress conditions. The parameters of the rock mass in the fault zone were taken as 1/5 of the sandstone parameters in the coal seam roof, the joint dilatancy angle was taken as 0, the initial roughness (JRC) was taken as 10, and the rock wall strength of the structural plane (JCS) was 102 MPa. The roughness value of the rough structural plane after sliding under different normal stress conditions can be referred to in Figure 9.
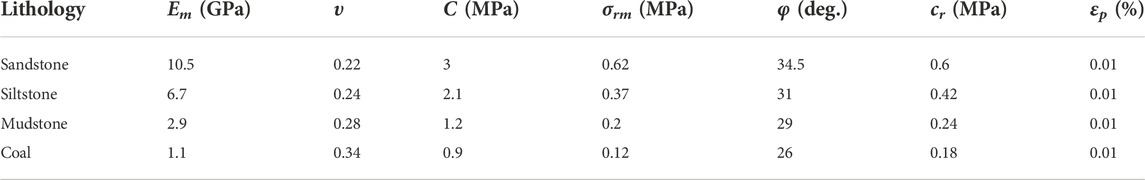
TABLE 3. Coal and rock mass properties in numerical simulation.
In this simulation, the fault slip law and dynamic response characteristics of 14,310 working faces in the Dongtan Coal Mine were numerically simulated. The numerical simulation process can be mainly divided into two parts. The first part was the excavation process of the panel. The numerical simulation calculation of the excavation process of the panel adopted static analysis, and the length of the panel excavated each time was determined as 10 m. During the static calculation, the boundary of the model is fixed.
The second part of the numerical simulation after the excavation of the panel was the dynamic analysis of fault slip. In order to eliminate the reflection and refraction of waves by the model boundary, the boundary condition of the model changed into a viscous boundary in the process of dynamic calculation. Based on the first step, the fault slip source M0 after the excavation of the working face can be obtained, and the calculation of fault slip seismic moment M0 is shown in Eq. 5. In Eq. 5, G is the stiffness of the fault plane, A is the area of fault shear slip, and D is the shear displacement of the fault. The fault slip seismic moment M0 was applied to the element near the corresponding fault in the form of a couple so as to carry out dynamic analysis and study the dynamic response characteristics of the surrounding rock of the stope under the dynamic load of fault slip (Domański and Gibowicz, 2008; Wang and Cai, 2017). The research shows that using local damping to simulate the dynamic analysis of rock mechanics can achieve ideal results, and the local damping of rock is generally 2%–5%, so the local damping is selected as 5% in the dynamic calculation (Jiang et al., 2020). The next cycle would be carried out after the dynamic calculation was completed; another 10 m working face was excavated for the next round of static calculation to obtain the corresponding fault slip source M0, and then the dynamic analysis was carried out until the working face was mined through the fault. The whole process of numerical simulation is shown in Figure 8. The numerical simulation method can be used to analyze the dynamic response characteristics of coal and rock mass under the dynamic load of fault slip so as to provide a basis for studying the rock burst hazard under the dynamic load of fault slip.
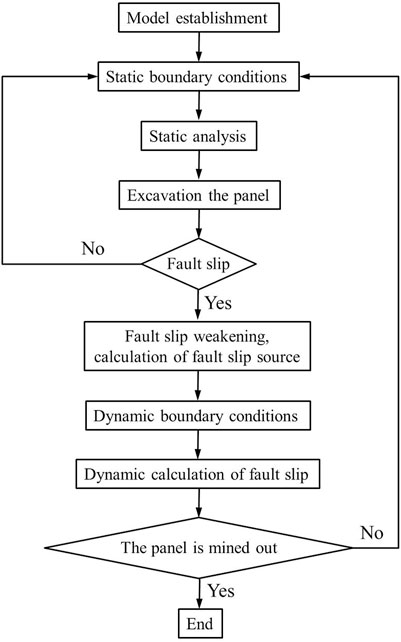
FIGURE 8. Flow chart of dynamic calculation.
Figure 9 shows the comparison between the fault slip seismic moment M0 in the actual mining process of the working face and the value calculated by numerical simulation. The mining situation and fault stress state of the working face in the process of the numerical simulation were consistent with the actual situation on site. The fault slip source M0 monitored on site was obtained by converting the energy of microseismic event near the fault and by empirical Eqs 6 and 7 (Mutke et al., 2009), where E is the energy of microseismic event and ML is Richter magnitude. Considering the complexity of mining conditions in the actual production process and many factors affecting the fault slip microseismicity, although the numerical simulation results were different from the specific values of the field monitoring results, the general trend of the two was highly consistent. The correlation coefficient of seismic moment between the numerical simulation results and the field monitoring results is 0.86, which proves that the numerical simulation method has certain reliability and application value for the rock burst hazard assessment and mining design of the panel.
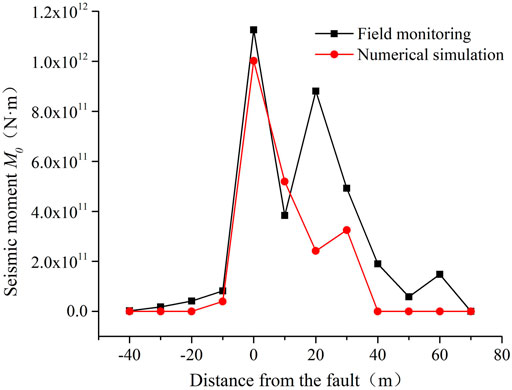
FIGURE 9. Comparison of fault slip seismic moment (M0) between field monitoring and numerical simulation.
Figure 10 shows the cloud map of fault shear stress and shear displacement when the working face advanced to different positions. It can be found that when the working face gradually advanced from the footwall of the fault to 30 m away from the fault, the fault began to slip under the influence of mining, the shear stress in the fault slip area decreased and released energy, and the fault slip area was 52–68 m above the coal seam. The fault area close to the coal seam maintained good stability, and the shear stress level was high, which accumulated a lot of elastic properties. With the continuous advancement of the working face near the fault, the degree of mining disturbance to the fault was increasing, and the range of fault slip area extended from the high fault plane to the fault plane near the roof of the coal seam. When the working face advanced to 10 and 0 m away from the fault, the fault slip range and fault slip displacement increased sharply, affected by mining, and the shear stress in the fault slip area close to the coal seam dropped suddenly, releasing a lot of energy. The fault slip microseismic event was large, and the rock burst hazard was significantly increased under the influence of a strong fault slip dynamic load.
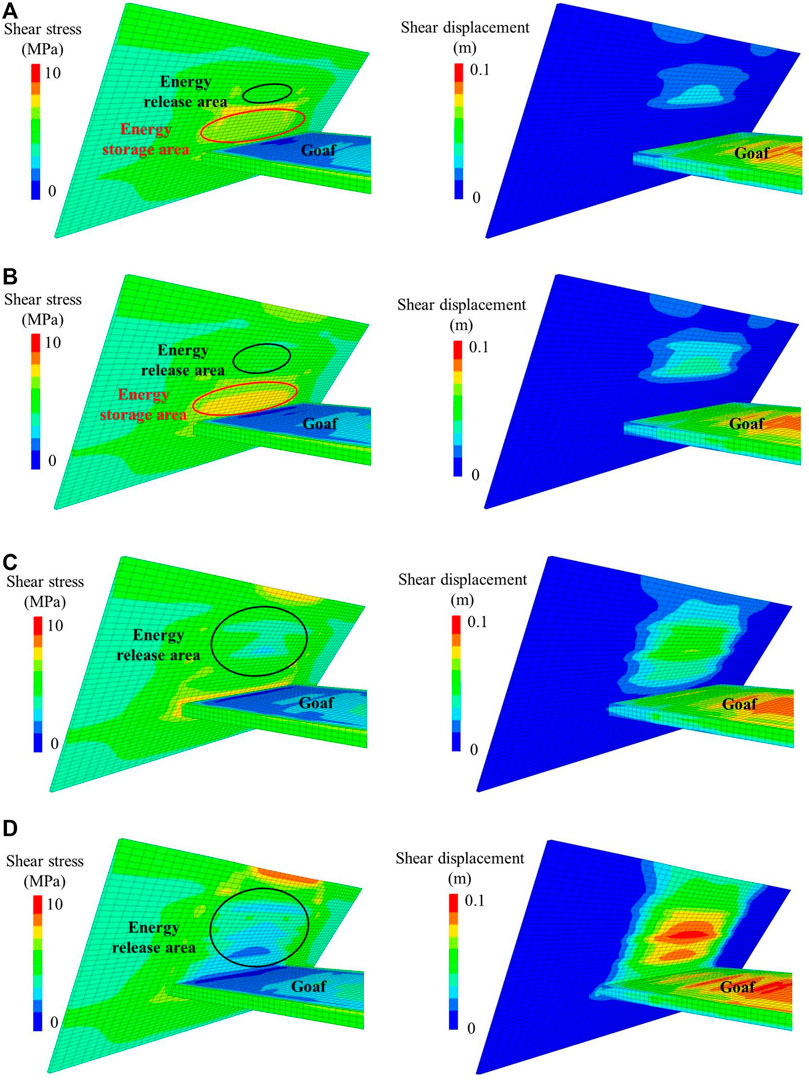
FIGURE 10. Shear stress and shear slip of the fault when mining the panel to different positions. (A) The working face is 30 m away from the fault. (B) The working face is 20 m away from the fault. (C) The working face is 10 m away from the fault. (D) The working face is 0 m away from the fault.
The propagation of fault slip dynamic load can cause vibration and even damage coal and rock mass. Therefore, the influence of fault slip dynamic load on coal and rock mass near the stope can be judged by studying the vibration velocity when the working face advanced to different positions. Figure 11 shows the nephogram of vibration velocity when the working face advanced to 30 and 10 m away from the fault (the nephogram of vibration velocity was taken from the middle part of the panel at y = 225 m). It can be observed from the figure that during the advancement of the working face, fault slip first caused the vibration of the coal and rock mass near the fault; the closer it was to the fault, the greater the vibration velocity of the coal and rock mass. Over time, the seismic waves travel from the source position of the fault to all around after the shear slip of the fault. The energy of seismic waves decreased during transmission, so the vibration velocity of coal and rock mass farther away from the source of fault slip was smaller. However, when the source of fault slip was large enough, the dynamic load released by fault slip would still cause large vibration of coal and rock mass near the working face.
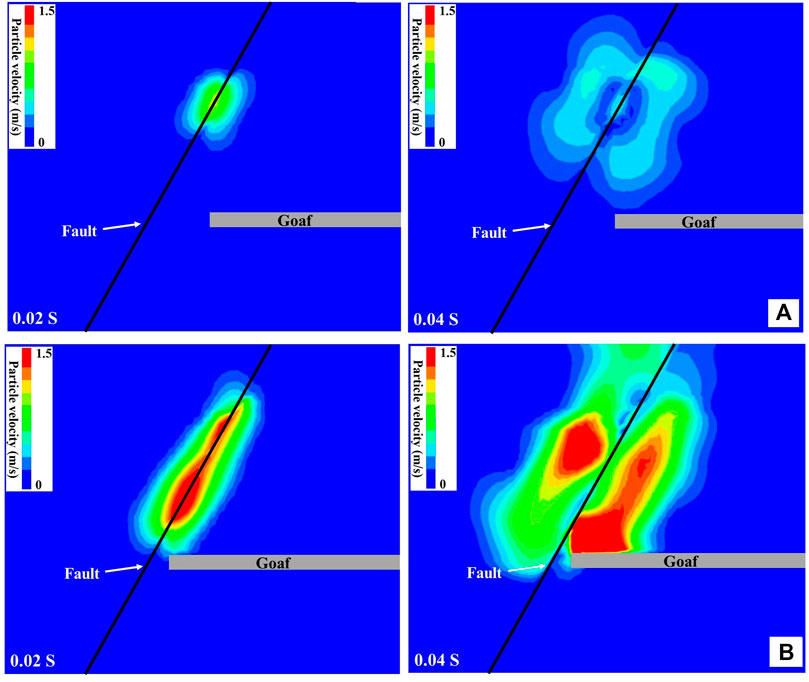
FIGURE 11. Particle velocity nephogram of the working face at different positions. (A) The working face is 30 m away from the fault. (B) The working face is 10 m away from the fault.
Figure 12 shows the peak particle vibration velocity (PPV) in the area with peak advance abutment pressure at different advancing positions of the working face. It can be seen from Figures 11 and 12 that when the working face advanced to 30 and 20 m away from the fault, the PPV of the coal and rock mass at this location were 0.55 and 0.48 m/s, respectively. When the fault slip dynamic load propagated to the coal and rock mass in the area with peak abutment pressure, the fault slip source was small, and the dynamic load disturbance to the coal and rock mass in the area with peak abutment pressure was small. When the working face advanced to 10 m away from the fault, a large area slip occurred in the fault, the fault slip source increased obviously, and the PPV of coal and rock mass in the area with peak abutment pressure increased to 0.68 m/s. When the working face advanced to the fault position, the fault lost the support of the coal pillar completely, and the slip range extended from the high fault plane to the fault plane at the basic top. The fault slip source increased further, and the fault slip source was close to the coal seam. The PPV of coal and rock mass in the area with peak abutment pressure reached 1.47 m/s. According to previous studies (Mutke et al., 2009; Mutke et al., 2015; Wang et al., 2022), a PPV of about 1 m/s was enough to induce rock burst, which would cause severe deformation of the roadway or rock fall, thus, the rock burst hazard would be greatly increased. When the working face crossed through the fault, the influence degree of mining on the fault decreased, and the PPV of coal and rock mass in the area with peak abutment pressure decreased significantly to 0.14 m/s. When the working face advanced to 20 m across the fault, the mining would have little effect on the fault, and the mining would not be affected by the dynamic load of the fault slip anymore.
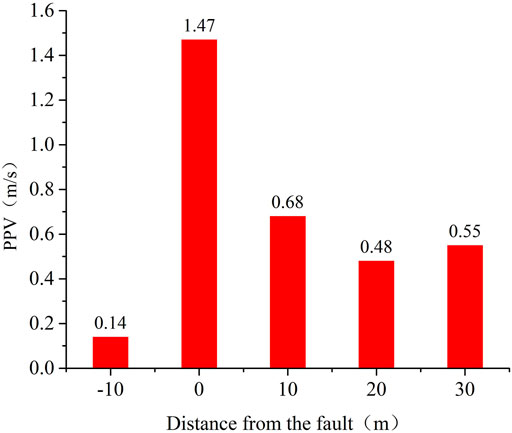
FIGURE 12. PPV evolution with retreat mining.
The dynamic load released by fault slip has a significant influence on the coal and rock mass near the mining space. In severe cases, it may result in great damage to coal and rock mass in a high static load stress area near the working face with the release of a large amount of elastic energy, which may induce a fault slip–type rock burst. Therefore, it is of great significance to study the dynamic response of coal and rock mass in the area with peak advance abutment stress of working face under dynamic load to evaluate the hazard of rock burst. Figure 13 shows the variation of the coal and rock mass under dynamic load. It can be seen that the dynamic response characteristics of the peak abutment stress varied greatly when the working face advanced to different positions. The peak abutment stress vibrated to varying degrees under the fault slip load and gradually tended to be stable after the action of dynamic load. Especially when the working face was 10 m away from the fault and advanced to the fault position, the abutment stress oscillated violently after being loaded by the fault slip and then decreased significantly.
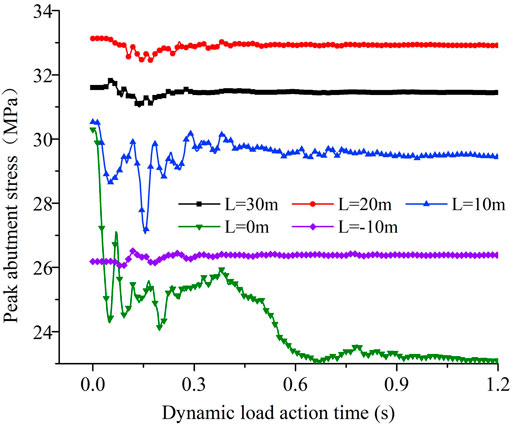
FIGURE 13. Variation of peak abutment stress under dynamic load.
Figure 14 shows the dynamic response of advanced abutment stress when the working face advanced to different positions. It can be seen from Figures 13, 14 and 16 that when the working face advanced to 20 m away from the fault, before the action of dynamic load, the peak value of abutment stress was located 15 m in front of the working face. Affected by the fault stress barrier, the stress concentration of the coal pillar was high, and the peak abutment stress was 33.1 MPa. The fault slip dynamic load caused stress reduction of coal and rock mass about 20 m ahead of the working face. Because the fault slip dynamic load was small so the degree of stress reduction was small, and the stress reduction value of coal and rock mass in the area with peak abutment stress was only 0.2 MPa. When the working face advanced 10 m away from the fault, the peak value of advance abutment stress occurred in the coal and rock mass area of the hanging wall of the fault before the action of dynamic load, and the peak abutment stress decreased to 30.5 MPa. After the action of dynamic load, the area where the advance abutment stress decreased extended to about 45 m in front of the working face, and the reduction of the peak value for the abutment stress was 1.1 MPa. It indicated that the disturbance range and degree of dynamic load of fault slip on coal and rock mass in front of working face after the plastic failure of fault coal pillar significantly increased compared with that when fault coal pillar remained stable. When the working face advanced to 0 m away from the fault, the disturbance range and degree of dynamic load on coal and rock mass near the working face increased further. The area where the abutment stress decreased after dynamic loading extended to the range of 50 m ahead of the working face, while the coal and rock mass in the area with peak abutment pressure occurred severe plastic failure under the influence of strong fault slip dynamic load, and the stress decreased to 5.5 MPa. The rock burst hazard increased significantly. When the working face mined through the fault, the peak abutment stress before the action of fault slip dynamic load decreased to 26.2 MPa, and the disturbance of fault slip dynamic load on coal and rock mass near the working face was small. The dynamic load of fault slip only caused stress reduction of a small part of coal and rock mass in the plastic area and caused a slight stress increase of coal and rock mass in the area with peak abutment stress. The hazard of fault slip rock burst decreased significantly.
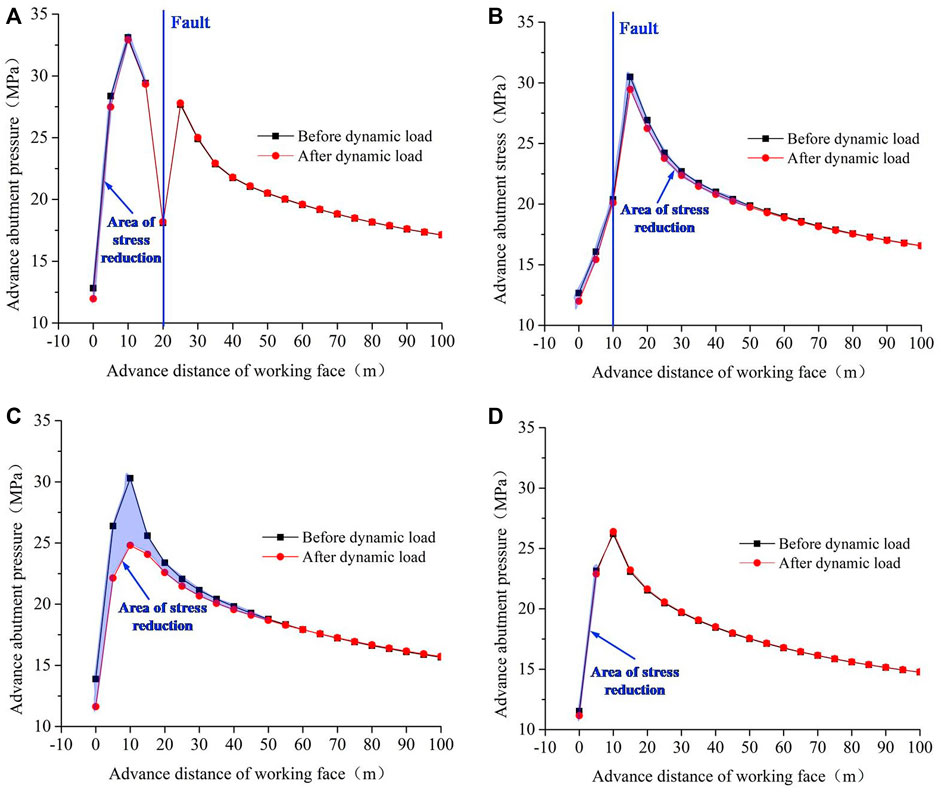
FIGURE 14. Dynamic response of advanced abutment stress. (A) The working face is 20 m away from the fault. (B) The working face is 10 m away from the fault. (C) The working face is 0 m away from the fault. (D) The working face mined through the fault for 10 m.
Based on the stress superposition principle (Jiang et al., 2015), some scholars superimposed the self-weight stress, mining stress, and tectonic stress in the mining process to obtain the total stress of the coal body σs. The ratio of total stress to uniaxial compressive strength [σc] of the coal body was used as the judgment index to divide the rock burst hazard. The formula of judgment index Ic for rock burst hazard was expressed as
According to the rock burst hazard judgment index Ic, the rock burst hazard was divided into four levels: no hazard, slight hazard, moderate hazard, and severe hazard. The classification of rock burst hazard is shown in Table 4.
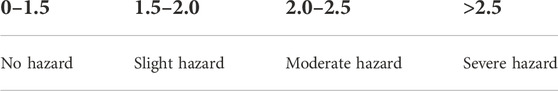
TABLE 4. Classification of rock burst danger levels.
The field detection and numerical simulation results showed that when mining near the fault, the fault slip source induced by mining produced a dynamic load on the coal and rock mass near the working face. When the disturbance degree of fault slip dynamic load was large enough, that is, the sum of the maximum fault slip dynamic load and the static load of coal in the limit equilibrium area was greater than the strength of coal, the superposition of dynamic and static loads resulted in damage to the coal body, and, in severe cases, the coal body was severely damaged, and a large amount of elastic energy was released which would induce fault slip rock burst. The dynamic load stress disturbance generated by transmission of fault slip source to coal mass near the working face was closely related to the vibration velocity of coal. Considering that the vibration velocity near the coal and rock mass in the mining space can be not only obtained by the numerical simulation method but also monitored on-site by a microseismic system, the vibration velocity of the coal and rock mass near the mining space can be used as an index parameter to study the disturbance degree of fault slip source to the coal and rock mass near the working face. The maximum vertical dynamic load stress due to slip load of fault in the area with peak abutment pressure σd can be expressed as
where, ρ is the density of coal, C is the propagation velocity of wave, and v0 is the peak vibration velocity in the vertical direction of coal.
Because the dynamic load of fault slip had a great influence on the coal and rock mass near the working face, the static load stress and the dynamic load stress of fault slip should be considered when evaluating the rock burst hazard of the working face near the fault. Combining Eq. 8 and Eq. 9, Icd can be expressed as Eq. 10 for judging rock burst hazard under fault slip dynamic load, and the classification of rock burst hazard is still as shown in Table 4.
Based on index Icd, the rock burst hazard was analyzed through the static load stress and the vibration velocity of coal and rock mass in the area with peak abutment stress under fault slip dynamic load. Considering that there was little difference between the peak vertical vibration velocity of coal and rock mass in the area with peak abutment pressure and the peak particle vibration velocity (PPV) of coal and rock mass, so the peak vertical vibration velocity of coal and rock mass in the area with peak abutment pressure was taken as the value of PPV. The propagation speed of the longitudinal wave was 4300 m/s, and the coal density and compressive strength were 1400 kg/m3 and 15 MPa, respectively, based on the test results. The division of rock burst hazard degree during the working face mining through the fault is shown in Figure 15.
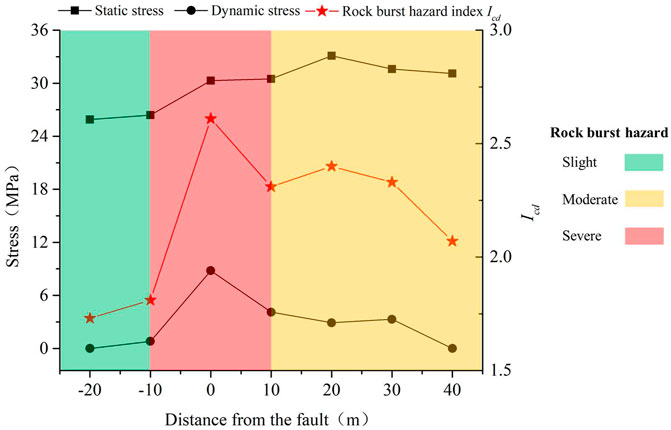
FIGURE 15. Classification of rock burst hazard.
It can be seen from Figure 15 that the fault blocked the distribution of the static load stress to a certain extent. The static load stress before the working face crossed the fault was larger than that after the working face crossed the fault, but the variation of the static load stress at the working face was smaller than that of the dynamic load stress of the fault slip. Fault slip type rock burst was affected by both static load stress level and fault slip dynamic load. When the working face was passing through the fault (10 m away from the fault to 10 m across the fault), the hazard of rock burst was the highest due to the superposition of high static load and strong fault slip dynamic load. The hazard of rock burst assessment result was consistent with the actual production situation on site, which proved that the rock burst hazard assessment method had certain reliability.
During the mining period, with the working face getting closer to the fault, the number of high-energy microseismic events released by fault slip increases significantly, and the fault slip rock burst hazard is high. After the working face is mined through the fault, the disturbance degree of mining to the fault decreases, the occurrence frequency and energy level of microseismic events decrease, and the hazard of fault slip rock burst is small. The b value representing microseismic intensity gradually decreases as the working face gets closer to the fault. The b value gradually increases after the working face crosses through the fault. The b value of a microseismic event can be used as an index to evaluate fault activity and early warning of fault slip rock bursts.
The dynamic calculation of fault slip and its dynamic response under the influence of mining was carried out by FLAC3D numerical simulation software, and the whole process of numerical simulation of “mining–fault slip release dynamic load–mining spatial dynamic response” was realized. Mining induces fault slip and weakens and releases dynamic load, which has a significant impact on the vibration velocity and abutment stress of coal and rock mass near mining space. The vibration velocity and the reduction value of peak abutment stress both reach the highest when the working face advances near the fault. Under the effect of strong fault slip dynamic load, the coal and rock mass in the area with peak abutment stress undergo plastic failure and release large amounts of elastic energies, and the hazard of fault slip rock burst is high.
Considering the stress disturbance caused by the fault slip dynamic load on the coal and rock mass near the working face, the hazard of rock burst judgment index Icd was proposed. The hazard of rock burst when the working face mined through the fault was analyzed, and the rock burst hazard when the working face passed through the fault was divided, which provided a new idea for the rock burst hazard assessment under the influence of fault.
The original contributions presented in the study are included in the article/Supplementary Material; further inquiries can be directed to the corresponding author.
Conceptualization: PK and RL; methodology: PK; software: PK; validation: LX, ZL, and ZZ; formal analysis: CX; resources: CX; data curation: ZZ; writing—original draft preparation: PK; writing—review and editing: RL; visualization: LX and ZL; project administration: RL.
The research of this study was sponsored by the Natural Science Foundation of Anhui Province (2208085QE144), the National Natural Science Foundation of China (U21A20110), the National Natural Science Foundation of China (52104073), and Start-up Fund for Introducing Talents and Scientific Research of Anhui University of Science and Technology (13210151).
Author ZL and ZZ were employed by Yankuang Energy Group Company Limited. Author CX was employed by Jinan Urban Construction Group.
The remaining authors declare that the research was conducted in the absence of any commercial or financial relationships that could be construed as a potential conflict of interest.
All claims expressed in this article are solely those of the authors and do not necessarily represent those of their affiliated organizations, or those of the publisher, the editors, and the reviewers. Any product that may be evaluated in this article, or claim that may be made by its manufacturer, is not guaranteed or endorsed by the publisher.
Brace, W. F., and Byerlee, J. D. (1966). Stick-slip as a mechanism for earthquakes. Science 153 (3739), 990–992. doi:10.1126/science.153.3739.990
Cai, W., Dou, L., Si, G., and Hu, Y. (2021). Fault-induced coal burst mechanism under mining-induced static and dynamic stresses. Engineering 7 (5), 687–700. doi:10.1016/j.eng.2020.03.017
Domański, B., and Gibowicz, S. J. (2008). Comparison of source parameters estimated in the frequency and time domains for seismic events at the Rudna copper mine, Poland. Acta Geophys. 56 (2), 324–343. doi:10.2478/s11600-008-0014-1
Jiang, F., Shu, C., and Wang, C. (2015). Impact risk appraisal of stope working faces based on stress superimposition. Chin. J. Rock Mech. Eng. 34 (12), 2428–2435.
Jiang, L., Kong, P., Zhang, P., Shu, J., Wang, Q., Chen, L., et al. (2020). Dynamic analysis of the rock burst potential of a longwall panel intersecting with a fault. Rock Mech. Rock Eng. 53 (4), 1737–1754. doi:10.1007/s00603-019-02004-2
Kong, P., Jiang, L., Jiang, J., Wu, Y., Chen, L., and Ning, J. (2019). Numerical analysis of roadway rock-burst hazard under superposed dynamic and static loads. Energies 12 (19), 3761. doi:10.3390/en12193761
Kong, P., Yuan, A., Liu, Y., and Li, Z. (2022). Study on fault slip dynamic response and rock burst potential under the influence of different horizontal stresses. Geomatics, Nat. Hazards Risk 13 (1), 1321–1341. doi:10.1080/19475705.2022.2073831
Lai, X., Zheng, J., and Jiang, X. (2016). Influential range assessment of dynamic pressure in fault zone with broken rock masses[J]. J. Min. Saf. Eng. 33 (02), 361–366.
Li, D., Li, Y., Masoumi, H., and Chen, J. (2021). An analytical model for axial performance of rock bolts under constant confining pressure based on continuously yielding criterion. Tunn. Undergr. Space Technol. 113, 103955. doi:10.1016/j.tust.2021.103955
Li, D., Masoumi, H., and Ming, C. (2021). A constitutive model for cable bolts exhibiting cone shaped failure mode. Int. J. Rock Mech. Min. Sci. 145, 104855.
Li, D., Shirani Faradonbeh, R., Lv, A., Wang, X., and Roshan, H. (2022). A data-driven field-scale approach to estimate the permeability of fractured rocks. Int. J. Min. Reclam. Environ., 1–17. doi:10.1080/17480930.2022.2086769
Li, P., Cai, M., and Guo, Q. (2018). Research situations and development tendencies of fault slip rockburst in coal mine. Harbin Gongye Daxue Xuebao/Journal Harbin Inst. Technol. 50 (3), 1–17.
Luo, H., Li, Z., and Wang, A. (2014). Study on the evolution law of stress field when approaching fault in deep mining[J]. J. China coal Soc. 32 (02), 322–327.
Meng, F., Zhou, H., Wang, Z., Zhang, L., Kong, L., Li, S., et al. (2017). Influences of shear history and infilling on the mechanical characteristics and acoustic emissions of joints. Rock Mech. Rock Eng. 50 (8), 2039–2057. doi:10.1007/s00603-017-1207-1
Mutke, G., Dubiński, J., and Lurka, A. (2015). New criteria to assess seismic and rock burst hazard in coal mines/nowe kryteria dla oceny zagrożenia sejsmicznego I tąpaniami W kopalniach węgla kamiennego. Archives Min. Sci. 60 (3), 743–760. doi:10.1515/amsc-2015-0049
Mutke, G., Lurka, A., and Dubiński, J. (2009). “Seismic monitoring and rock burst hazard assessment in deep polish coal mines-case study of rock burst on April 16, 2008 in Wujek-Slask coal mine[C],” in 7th International Symposium on Rockburst and Seismicity in Mines (RASiM 7): Controlling Seismic Hazard and Sustainable Development of Deep Mines. Editors C. A. Tang (Rinton Press), 1413–1424.
Ortlepp, W. D., and Stacey, T. R. (1994). Rockburst mechanisms in tunnels and shafts. Tunn. Undergr. Space Technol. 9 (1), 59–65. doi:10.1016/0886-7798(94)90010-8
Scholz, C. (1968). The frequency-magnitude relation of microfracturing in rock and its relation to earthquakes. Bull. Seismol. Soc. Am. 58 (1), 399–415. doi:10.1785/bssa0580010399
Si, L., Zhang, H., Wei, J., and Hongkai, H. (2021). Modeling and experiment for effective diffusion coefficient of gas in water-saturated coal. Fuel 284. 118887, doi:10.1016/j.fuel.2020.118887
Si, S., Wei, J., Xi, Y., Wang, H., Wen, Z., Li, B., et al. (2021). The influence of long-time water intrusion on the mineral and pore structure of coal. Fuel 290, 119848. doi:10.1016/j.fuel.2020.119848
Si, L., Xi, Y., Wei, J., Wang, H., Zhang, H., Xu, G., et al. (2022). The influence of inorganic salt on coal-water wetting angle and its mechanism on eliminating water blocking effect. J. Nat. Gas. Sci. Eng. 103, 104618. doi:10.1016/j.jngse.2022.104618
Tse, R., and Cruden, D. M. (1979). Estimating joint roughness coefficients. Int. J. Rock Mech. Min. Sci. Geomechanics Abstr. 16 (5), 303–307. doi:10.1016/0148-9062(79)90241-9
Wang, A., Pan, Y., Li, Z. H., Liu, C. S., Han, R. J., Xiang, F., et al. (2014). Similar experimental study of rockburst induced by mining deep coal seam under fault action[J]. Rock Soil Mech. 35 (9), 2486–2492.
Wang, H., Jiang, Y., and Jiang, C. (2019). Characteristics of overlying strata movement in double fault area under the dynamic pressure[J]. J. Min. Saf. Eng. 36 (03), 513–518.
Wang, P., Jiang, L., Jiang, J., Zheng, P., and Li, W. (2018). Strata behaviors and rock burst–inducing mechanism under the coupling effect of a hard, thick stratum and a normal fault. Int. J. Geomech. 18 (2), 04017135. doi:10.1061/(asce)gm.1943-5622.0001044
Wang, S. (2012). The horstfault mine quake’s mechanism and monitoring analysis in Dong Tan Colliery [D]. fuxin china: Liao Ning Technical University.
Wang, X., and Cai, M. (2017). Numerical modeling of seismic wave propagation and ground motion in underground mines. Tunn. Undergr. Space Technol. 68, 211–230. doi:10.1016/j.tust.2017.05.019
Wang, Z., Linlin, G., Qingzhao, Z., and Bo-An, J. (2021). Influence of initial stress and deformation states on the shear creep behavior of rock discontinuities with different joint roughness coefficients[J]. Rock Mech. Rock Eng. 54 (11), 1–14. doi:10.1007/s00603-021-02633-6
Wang, X., Li, J., Zhao, X., and Liang, Y. (2022). Propagation characteristics and prediction of blast-induced vibration on closely spaced rock tunnels. Tunn. Undergr. Space Technol. 123, 104416. doi:10.1016/j.tust.2022.104416
Xue, Y., Xu, T., Wasantha, P. L. P., Yang, T. h., and Fu, T. f. (2020). Dynamic disaster control of backfill mining under thick magmatic rock in one side goaf: A case study. J. Cent. South Univ. 27, 3103–3117. doi:10.1007/s11771-020-4532-6
Xue, Y., Xu, T., Zhu, W., Heap, M. J., Heng, Z., and Wang, X. (2021). Full-field quantification of time-dependent and -independent deformation and fracturing of double-notch flawed rock using digital image correlation. Geomech. Geophys. Geo-energ. Geo-resour. 7, 100. doi:10.1007/s40948-021-00302-0
Yan, S., Bai, J., Wang, X., and Huo, L. (2013). An innovative approach for gateroad layout in highly gassy longwall top coal caving. Int. J. Rock Mech. Min. Sci. 59, 33–41. doi:10.1016/j.ijrmms.2012.11.007
Zhang, K., Zhang, G., Hou, R., Wu, Y., and Zhou, H. (2015). Stress evolution in roadway rock bolts during mining in a fully mechanized longwall face, and an evaluation of rock bolt support design. Rock Mech. Rock Eng. 48, 333–344. doi:10.1007/s00603-014-0546-4
Zhou, H., Meng, F., Zhang, C., Hu, D., Lu, J., and Xu, R. (2016). Investigation of the acoustic emission characteristics of artificial saw-tooth joints under shearing condition. Acta Geotech. 11 (4), 925–939. doi:10.1007/s11440-014-0359-3
Keywords: rock burst, fault, dynamic response, microseismic, hazard assessment
Citation: Kong P, Liu R, Xing L, Li Z, Xu C and Zhang Z (2023) Study on the dynamic response and the hazard of rock burst under the influence of fault slip. Front. Earth Sci. 10:1034332. doi: 10.3389/feart.2022.1034332
Received: 01 September 2022; Accepted: 27 September 2022;
Published: 11 January 2023.
Edited by:
Leilei Si, Henan Polytechnic University, ChinaReviewed by:
Yanchao Xue, Northeastern University, ChinaCopyright © 2023 Kong, Liu, Xing, Li, Xu and Zhang. This is an open-access article distributed under the terms of the Creative Commons Attribution License (CC BY). The use, distribution or reproduction in other forums is permitted, provided the original author(s) and the copyright owner(s) are credited and that the original publication in this journal is cited, in accordance with accepted academic practice. No use, distribution or reproduction is permitted which does not comply with these terms.
*Correspondence: Rong Liu, cWlhbnh1bnNlbkAxNjMuY29t
Disclaimer: All claims expressed in this article are solely those of the authors and do not necessarily represent those of their affiliated organizations, or those of the publisher, the editors and the reviewers. Any product that may be evaluated in this article or claim that may be made by its manufacturer is not guaranteed or endorsed by the publisher.
Research integrity at Frontiers
Learn more about the work of our research integrity team to safeguard the quality of each article we publish.