 Zizheng Guo
 Bixia Tian1
 Jun He
 Danqing Song
- 1School of Civil and Transportation Engineering, Hebei University of Technology, Tianjin, China
- 2Hebei Key Laboratory of Earthquake Disaster Prevention and Risk Assessment, Sanhe, China
- 3Tianjin Municipal Engineering Design & Research Institute (TMEDI), Tianjin, China
- 4Faculty of Engineering, China University of Geosciences, Wuhan, China
- 5State Key Laboratory of Hydroscience and Engineering, Department of Hydraulic Engineering, Tsinghua University, Beijing, China
Accurate landslide susceptibility maps are relevant for stakeholders to take effective measures and perform land use planning. The present research aims at using three data-driven approaches to generate landslide susceptibility map for the middle Yellow River catchment (northwest China) and comparing their performances, including the weighted information value (WIV), where the IV model was integrated with analytic hierarchy process (AHP), the support vector machine (SVM) and the random forest (RF) models. A landslide inventory map including 684 historical landslides was generated first by visual interpretation of remote sensing images combined with a field survey. A total of 14 thematic layers were applied to serve as the landslides influencing factors. The Pearson correlation coefficient analyzed the correlation among these factors, and the C5.0 decision tree algorithm determined the factor importance. The results demonstrated the correlation between every two factors were all less than 0.5. Three factors (including distance to road, distance to river, and slope) were the most important contributions to the landslide occurrences in the region, whereas five factors (including NDWI, plan curvature, profile curvature, surface roughness, and aspect) had minor importance. All the models predict that most of the historical landslides are identified in moderate and high susceptibility areas. For the prediction percentage of landslides in high susceptibility areas, both SVM and RF models exceed 70%. The RF model represented the best performance, with high susceptibility zones accounting for 21.9% and landslide numbers accounting for 90.5%. The comparison among the receiver operating characteristic curves indicated that the accuracy was higher in the RF model than in the other two models: the area under the curve (AUC) for the RF was 0.904, whereas that for the WIV and the SVM were 0.845 and 0.847, respectively. Hence, the RF was proven suitable for assessing the landslide susceptibility in the region. Current results can provide valuable references for future studies and landslide risk mitigation strategies.
1 Introduction
Landslides cause significant economic losses and fatalities every year and have been one of the deadliest natural hazards worldwide (Petley, 2012; Froude and Petley, 2018; Guo et al., 2020a). In mountainous areas, landslide risks are a common phenomenon due to external conditions, including human activities and extreme climatic events. One third of the geohazards in China occur in the Loess Plateau, among which 85% are landslides, which is one of the most disastrous geohazards in the area. According to field investigations, around 15,000 geohazards occurred in the Loess Plateau of Shaanxi province with an average density of over six per square kilometer (Zhuang et al., 2018). During the decade, the several fatal landslides have been reported in the region. For instance, Zhuang and Peng (2014) researched on a landslide that occurred on 17 September 2011 in Xi’an, which caused 32 deaths.
As the starting risk assessment step, landslide susceptibility analysis provides helpful information on landslide spatial distribution (Tian et al., 2019). Therefore, it has been considered foundational research for local authorities to conduct accurate landslide susceptibility analysis. Commonly-used models for landslide susceptibility mapping can be roughly classified into three categories, namely expert-based, physical (or deterministic), and data-driven models (Goetz et al., 2011; Huang et al., 2017; Reichenbach et al., 2018; Medina et al., 2021). Expert-based models are usually considered qualitative techniques that mainly rely on the overall knowledge about the hazard responsible experts possess to describe the phenomenon (Sezer et al., 2017). Physically-based models combine the slope failure mechanics and geotechnical parameters and consider the infinite slope model as the calculation criterion (He et al., 2021). Standard Physically-based models include TRIGRS (Ciurleo et al., 2019), Scoops3D (He et al., 2021), SINMAP (Lin et al., 2021), and FSLAM (Medina et al., 2021), which can assess landslide susceptibility and hazard by considering rainfall condition (Li et al., 2021). However, determining the hydromechanical properties of rock and soil is a conceptual and operational challenge for this model. In contrast, data-driven models assume that landslides in the future are more likely to occur under conditions that are identical/similar to where the past events happened (Zêzere et al., 2017). These models simulate the landslide probability through the deep analysis of the statistical or nonlinear relationship between historical landslides and environmental variables. Therefore, data-driven models typically express a higher apparent prediction ability and objectivity than other models (Achour and Pourghasemi, 2020; Huang et al., 2020). An evident increase has been observed in the literature during the last decade regarding the studies on the landslide susceptibility assessment by using this type of models (Goetz et al., 2015; Huang et al., 2017; Chen et al., 2019; Dou et al., 2020). Within this subject, two kinds of models are mainly included, namely statistically-based and machine learning models. Some methods have been widely mentioned and applied, for example frequency ratio (Yilmaz, 2009), analytical hierarchy process (Shirzadi et al., 2017), logistic regression (Zhang et al., 2018), random forest (Nhu et al., 2020a), artificial neural network (ANN) (Huang et al., 2017), support vector machine (SVM) (Dou et al., 2020), deep learning neural networks (Nhu et al., 2020b) and so on. Additionally, some recent advances in data processing techniques show that ensemble learning methods can further improve the performance of machine learning methods and alleviate their limitations (Bui et al., 2019; Pham et al., 2019).
Benefit from the fast development of GIS and remote sensing (RS) techniques recently, various types of landslide-related factors have been included in the data-driven models, including but not limited to geomorphological, hydrological, geological, and environmental factors. However, the best combination of influencing factors for a given landslide inventory is still an open issue. On one side, stakeholders attempt to consider more factors in the analysis to include more helpful information. On the other side, researchers must balance the model complexity and performance. More factors may result in better model accuracy but reduce the model efficiency due to more considerable complexity (Crozier and Glade, 2005; Tang et al., 2020), which is still a challenge in the landslide susceptibility assessment. Additionally, few researchers have discussed the geomorphological significance of factors (Segoni et al., 2020) or explained the relevance of a single factor in slope stability/instability. The conditional independence of landslide influencing factors also has not been considered extensively (Pereira et al., 2012). The relevance and independence of considered factors are of great importance for the quality of data-driven models (Reichenbach et al., 2018). Some approaches have been proposed and employed to investigate the factor contribution during landslide susceptibility modelling, such as principal component analysis, information gain ratio, forward elimination, and multicollinearity techniques (Pham et al., 2019; Nsengiyumva and Valentino, 2020; Tang et al., 2020; Chen and Chen, 2021). In this study, the Pearson correlation coefficient was applied to calculate independence between factors, and the C5.0 decision tree method was considered to evaluate the factor importance.
Some previous studies have compared the performances of different data-driven models, including bivariate, multivariate, and machine learning techniques (Yilmaz, 2009; Kouli et al., 2014; Bueechi et al., 2019; Moayedi et al., 2019). Most comparative results showed that the multivariate techniques are superior to bivariate techniques (Rossi et al., 2010), whereas machine learning algorithms are better than both. However, the comparison study considering both the factor independence and importance was few. For landslide-prone areas, comparing model performance may be essential because it can help local land use planning and civil protection.
Regarding the investigation of regional landslide susceptibility in the Loess Plateau of China, some researchers have made efforts, for instance, Niu et al. (2018), Tang et al. (2020) and Mao et al. (2022). However, most of these studies were conducted at a county scale (<500 km2), and the ones over larger areas are missing. Considering this, the main objective of the present study is to determine a suitable model to create effective landslide susceptibility maps for the middle stream of the Yellow River (China) (>1000 km2), and reveal important factors for landslide occurrence. Very few studies have been made to asses landslide susceptibility in the region before. Specifically, our objectives include: 1) considering different types of influencing factors as model inputs and evaluating their independence and contribution to landslide occurrence; 2) generating landslide susceptibility maps by using three data-driven techniques (WIV, SVM, RF), and 3) the comparison of model performances to determine a better model for assessing landslide susceptibility in the region.
The structure of the paper is organized as follows: in Section 2, we introduce the general settings of the study area, whereas methodologies and datasets applied are described in Section 3. Section 4 presents and analyses the test results. In Section 5 the results are discussed and compared with other studies. In Section 6, we make a conclusion.
2 Study area
The middle stream of the Yellow River of northwestern China was selected as the study area, which lies within longitude 110°30′0″–110°0′0″E and latitude 37°10′0′′–37°40′0″N and expands from Shaanxi Province (West) to Shanxi Province (East) (Figure 1). The total area is approximately 1,661 km2 with a length of ∼62 km, containing seven counties. The most representative geomorphology unit is the Loess Plateau, which has been proved as a typical landslide-prone area (Zhang and Liu, 2010; Zhuang et al., 2018).
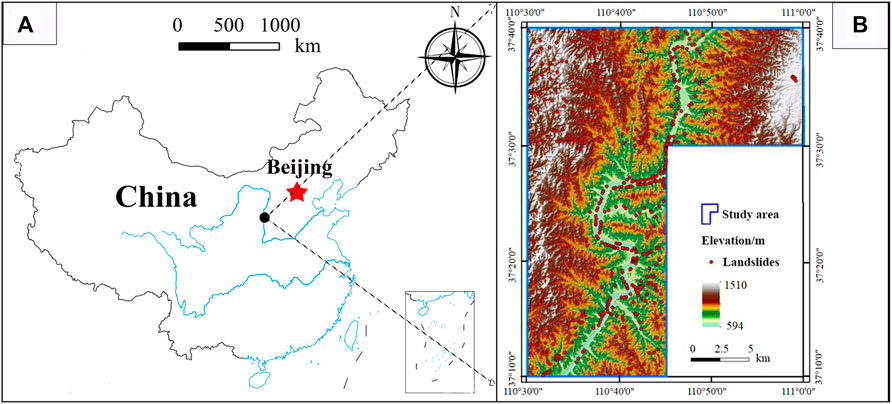
FIGURE 1. (A) Location of the study area, where the two blue lines represent the two biggest rivers in China, namely the Yangtze River and the Yellow River, whereas the blue boundary shows the coastline of China; (B) Spatial distribution of the landslides in the study area, and the digital elevation mode is used as the base map.
The region’s elevation varies from 590 to 1500 m above sea level, with a lower elevation in the center part because the Yellow River flows through here, which is the second biggest river in China. From the geology perspective, the main geological structure within the area is the Wangjiahui anticline which has a direction of NW 30°. The lithology units include the strata from the Cambrian System to the Quaternary, with the primary outcrop sediment being the loess and the interlayer of sandstone and mudstone (Figure 2). The climate regime is temperate arid climate, with an average annual precipitation of 460 mm. The temporal-spatial variation of rainfall is evident: the rainfall season is generally during July and September, which can account for nearly 70% of the annual rainfall. The southern part has more rainfall than the northern part (Tang et al., 2020; Tang et al., 2022).
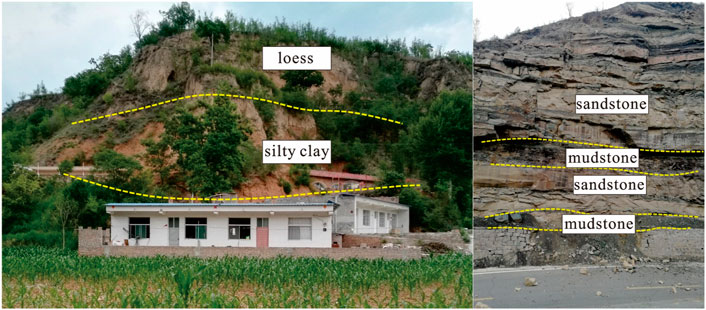
FIGURE 2. Typical vertical distribution of soil and lithology in the study area.
Topographically, the middle stream of the Yellow River has an appropriate individuality to explore and compare the data-driven techniques in simulating landslide susceptibility. Moreover, the vegetation cover is not extensive due to the local environment, which cannot provide enough protection when the rainfall infiltrates (Guo et al., 2020b). Under such geological conditions, the government reported several landslides, which have caused considerable losses (Peng et al., 2019; Dai et al., 2021). For example, Zhuang and Peng (2014) introduced a landslide that occurred on 17 September 2011 in Xi’an, which caused 32 deaths. Although these landslides have posted evident risk to residents and local authorities, no comparative studies by using data-driven techniques have been proposed to conduct the spatial prediction of landslide distribution. Hence, these backgrounds in the regional settings make the area an ideal case study.
3 Materials and methodology
3.1 Description of landslide inventory
Landslide inventory mapping is critical for regional susceptibility assessment, representing the essential characteristics of landslides, such as the location, area, volume, and so on (Fell et al., 2008; Pradhan, 2013). Additionally, it is essential information in the validation phase because users need to compare the reallocation of landslides with the predictive results (Wu et al., 2020; Huang et al., 2021). This study determined the landslide by field investigation and satellite images. The satellite images included a LandsatTM8 image and a Google Earth image for early identification of potential landslides. The field investigation was a detailed field survey conducted by China Geological Survey (Xi’an Center) in 2018. The location of each landslide was recorded by the portable GPS equipment in the field and reprojected into the map. The details were determined from the archived landslide report. We also conducted some interviews with local residents and stakeholders to collect some supplementary information. During the next phase, all the characteristics of the landslides were stored in the attribute table in GIS and linked to the spatial location of landslides.
In the inventory map, there are a total of 684 landslides identified in the area, among which 414 landslides are in Shaanxi Province, and 270 landslides are in Shanxi Province. The depths (h) of these landslides range from 0.5 to 30 m, which can be divided into three levels specially, including shallow landslides (h ≤ 10 m), moderate-depth landslides (10 m < h ≤ 25 m) and deep-seated landslides (h > 25 m). As seen in Figure 3A, the number of deep-seated landslides are the smallest accounting for only ∼8% of the total landslides. Regarding the volume (Figure 3B), approximately 85% of the landslides have the volume less than 1 × 10⁵ m3, whereas only 6 landslides have volume more than 106 m3, and all of them developed on the banks of the Yellow River. The primary materials that consist of landslides are sandstone and loess. Given the updated landslide classification method (Hungr et al., 2014), most of the historical inventory points are Earth slides, among which only 2.2% are Earth flows (the number is 15). From the perspective of triggering factors, rainfall and human activities are the most common reasons to induce these landslides.
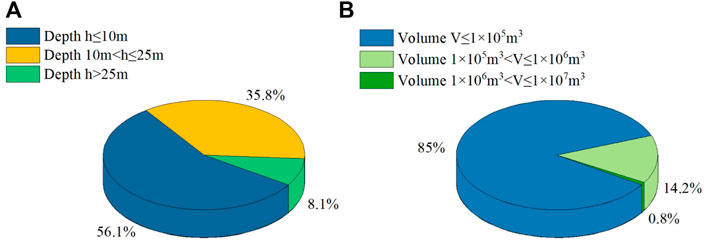
FIGURE 3. (A) Percentage of landslides with different depths; (B) Percentage of landslides with different volumes.
3.2 Landslide influencing factors
Selecting input factors is a fundamental task for assessing landslide susceptibility because it determines which information can be included in the modelling process. In this study, 14 factors were considered as the input parameters based on the understanding/knowledge of loess landslide mechanisms of the study area (Tang et al., 2020) and previous similar literature (Catani et al., 2013; Dou et al., 2020). These factors can be classified into five types: 1) geomorphological factors, 2) geological factors, 3) hydrological factors, 4) environmental factors, and 5) triggering factors. All the aspets associated with landslide occurrence are included in these factors, and all the considred factors can be found in previous studies. The data sources we used for these factors are shown in Table 1. The role each factor plays in the landslide occurrence and their preparations are described below.

TABLE 1. The data sources used in this study and their detailed information.
Elevation (Figure 4A): Elevation indicates the difference between landslide potential energy and human engineering activities, and it also has an impact on the environmental conditions on slopes (e.g., climate and vegetation, etc.). The DEM of the study area was obtained from an open-source website (http://www.gscloud.cn/). The resolution was selected as 30 m which has been proven to be the ability for quantitative assessment of geomorphological processes (Purinton and Bookhagen, 2017).
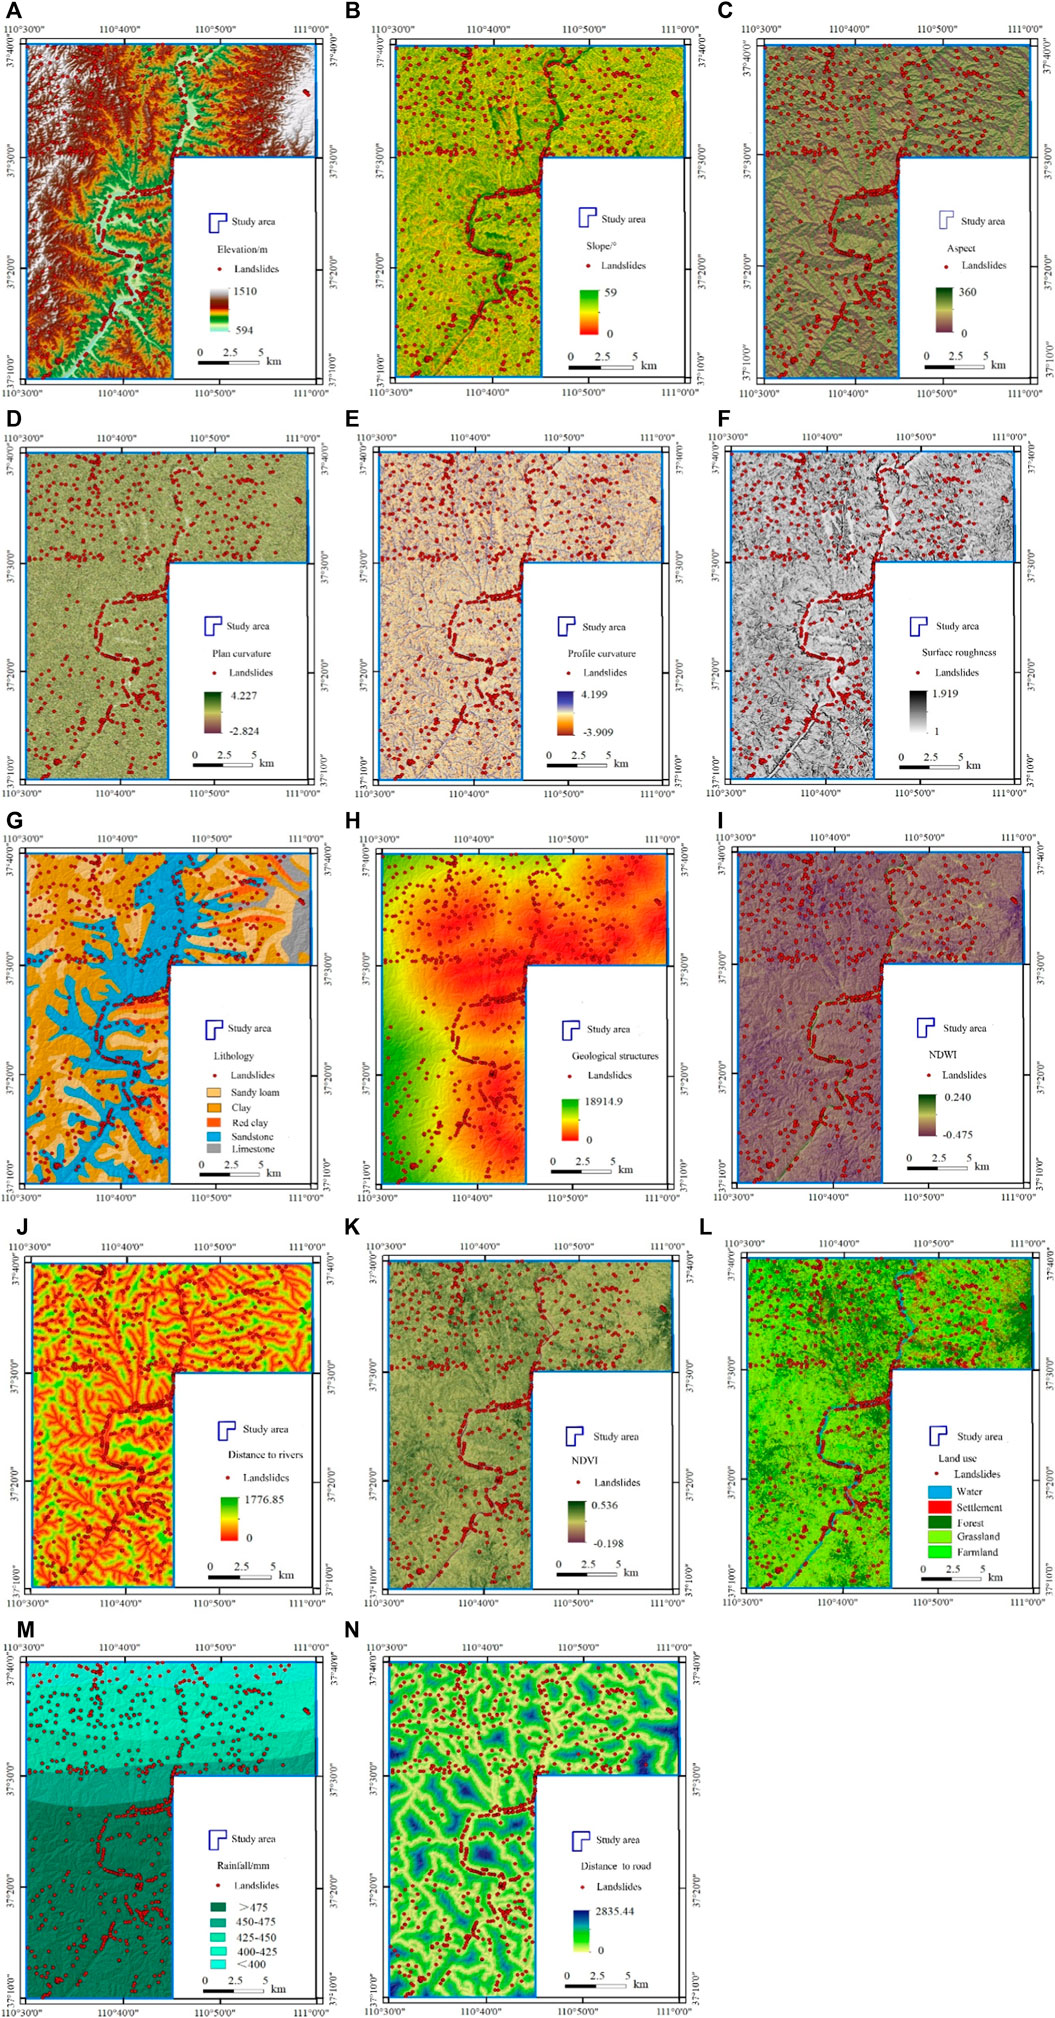
FIGURE 4. (Continued).
Slope (Figure 4B): Slope can express the steepness at every cell surface can contribute much to slope stabilities (Liu and Duan, 2018). The slope was generated by DEM in the GIS environment, which ranges from 0 to 59°.
Aspect (Figure 4C): Aspect can cause the difference in microclimate (e.g., sun exposure and temperature) and impact vegetation on slopes. The study area’s aspect can be extracted using DEM. It can be divided into eight directions (north, south, west, east, northwest, northeast, southwest, southeast) and a flat area (the value is −1).
Plan curvature (Figure 4D): This factor can control the flowing water across land surface, thus influencing deposition and erosion. The values of plan curvature in the area varies from −2.825 to 4.227.
Profile curvature (Figure 4E): This factor controls the acceleration and deceleration of flows through slopes so that the flow process can be influenced. It was also derived from the DEM, and the values are from −3.908 to 4.199.
Surface roughness (Figure 4F): Surface roughness refers to the ratio of ground surface area to its projected area and is a macro indicator reflecting the surface morphology (Goetz et al., 2015). It was obtained by calculating the ratio between the surface area of a slope and the projected area in the vertical direction. It is also equal to the standard deviation of slope (SDS) (Atkinson et al., 1998); thus, the equation for this factor is as:
Lithology (Figure 4G): It is considered as the material basis for various geological disasters and plays an essential role in controlling the landslides development (Catani et al., 2013). China Geological Survey provided this thematic layer. The geological features were divided into five units according to formation ages and geotechnical properties, including sandy loam, clay, red clay, sandstone, and limestone. The classification was based on the Chinese Soil Taxonomy (Gong et al., 2001).
Geological structures (Figure 4H): Many physical processes (e.g., deformation) on the slopes are related to geological movements; thus, geological structures are essential for landslide susceptibility assessment. Moreover, the geological structures also influence the joints and fractures on the slopes (Vick et al., 2020). This map came from the geology map, and the Euclidean distance from every pixel to the nearest geological structure was calculated.
NDWI (Figure 4I): NDWI can reflect the influence of rivers on the land surface (Wang et al., 2020). It was mainly from the Landsat 8 TM remote sensing (RS) images. Mathematically, it can be calculated by the spectral reflectance of different bands in the images as follows:
where P (Green) represents the spectral reflectance of the green band, whereas P (NIR) is that of the near infrared band, in this study, NDWI ranged from −0.475 to 0.240.
Distance to rivers (Figure 4J): Rivers can cut and erode river banks, and river water level fluctuations can reshape the topography and affect the groundwater of slopes. Similar to the distance to geological structures, the Euclidean distance was calculated from every cell to the nearest river to represent the effects of rivers.
NDVI (Figure 4K): NDVI reveals the greenness degree of a specific area and can influence hydrological processes on slopes. It was also obtained from the RS images. The equation is as follows (Chang et al., 2020):
where P (Red) is the spectral reflectance of the red band, and P (NIR) is that of the near-infrared band.
Land use (Figure 4L): Land use refers to the impact of human beings on the natural environment (Shu et al., 2019; Hürlimann et al., 2022) and affects the root cohesion as well as the hydrological process. The study area mainly has five types of land use: water, settlement, forest, grassland, and farmland.
Rainfall (Figure 4M): Rainfall is the most common triggering factor for landslides. It is still debated its role in the landslide susceptibility assessment because it is a predictive variable sensitive to temporal changes (Goetz et al., 2015). However, it was included in the current analysis since the archived profiles showed that most landslides in the inventory were induced by rainfall. This is similar to that in some existing literature (e.g., Catani et al., 2013; Medina et al., 2021). The average annual rainfall map during the past decades was created in GIS, and it showed that the rainfall in the south part was higher than that in the north part.
Distance to road (Figure 4N): The study area is highly populated, so human activities are also an essential factor in triggering landslides. Many national roads, highways, and railways are distributed in the area, so we used the distance to roads as a proxy to reflect the human activity intensity.
3.3 Factor independence test and importance calculation (C5.0 decision tree)
The preliminary selection of factors in this study mostly depends on the expert experience and the literature review of other research (Catani et al., 2013; Guo et al., 2021). The independence and importance test of influence factors has a significant influence on the susceptibility modelling, reducing the complexity of the calculation process and improving the accuracy of landslide susceptibility assessment. Although the above 14 influence factors have different geological backgrounds, they have an internal correlation to landslide susceptibility. Hence, the Pearson correlation coefficient method was first employed to calculate the selected factors’ independence. Different influencing factors have different contributions to the performance of susceptibility mapping, so the importance calculation is also necessary to indicate how much environmental factors can affect landslide events (Zhu et al., 2022). In the present study, the C5.0 decision tree model (Hwang et al., 2009) was applied. The C5.0 algorithm considers the information gain ratio (IGR) method to calculate the importance, which allows obtaining the level of uncertainty reduction based on a probability measure. The best solution was achieved by the decision tree growing downward with the split calculation using the maximum IGR. The IGR (GainRatio) can be denoted as follows (Guo et al., 2021):
where Sq is a subset of the training data set D randomly selected by Bootstrap resampling, and m is the predictor variable. Split(Sq,m) represent the split information. Gains(Sq,m) represent the information gain, which can be denoted as:
where H(x) is the entropy of data set x, V(m) is the value range of predictor variable m, SV is a subset of the set Sq.
Additionally, the boosting algorithm was proposed to improve the model robustness, and to reduce the classification error (Dou et al., 2020). Moreover, a cross-validation method was adopted to evaluate the model’s performance. This method is beneficial for addressing the overfitting issue and improving model generalization capability (Yao et al., 2008). The package built in the R software was applied to implement the C5.0 DT model, where a function was developed to determines the importance of input data by computing the percentage of factors falling into the training data set.
3.4 Landslide susceptibility models
3.4.1 Weighted information value model
The information value model is a statistically-based method, which can integrate the subjective experience of engineering experts and the objective characteristics of the correlation between influence factors and landslides. This model has clear objectives and has been applied for regional landslide susceptibility assessments (Bhandary et al., 2013; Bourenane et al., 2015). The IV model calculates the information value of each evaluation factor of different grades (Wang et al., 2019), and the expression is as follows:
where, S is the region’s total area; N is the number of landslide disasters; Si is the area of the i-th factor; Ni is the number of landslide disasters in the i-th factor; Ii is the VI given to the class of a parameter. Ii < 0 shows that the failure possibility of the landslide in this class is less than the stability possibility. This factor has a lower contribution to landslide susceptibility; Ii > 0 indicates that the failure possibility of landslide is higher than that of stability.
However, the traditional IV model does not consider the difference in the “contribution” of triggering factors to the landslide. In this study, we applied the AHP method (Saaty, 2008) to improve this drawback and calculated the weighted information value (WIV) by summing the product of the correlation weight of each factor and its classification IV (He et al., 2019). The equation is as follows:
where Wi is the weight of the ith factor, and L is the landslide susceptibility index (LSI).
3.4.2 Random forest model
The RF model is commonly considered to assemble many random decision trees, called classified regression trees (CART). One of the fundamental techniques is the bootstrap resampling technique, which randomly and repeatedly selects some samples in the training set to train the decision tree and generates other trees to compose a random forest. Following multiple decision trees being randomly generated, the samples can choose the best classification according to the statistical results of each decision tree. The formation of the decision tree requires the complete splitting of leaf nodes, and each leaf node cannot continue splitting (Pradhan, 2013). The advantages of the RF model include that (Zhang et al., 2020): overfitting can be avoided to a certain degree due to randomly choosing samples in the decision tree, and anti-noise ability can be enhanced; this model can calculate high-dimensional samples without feature engineering. Therefore, this research chooses the RF model to evaluate the landslide susceptibility of the region.
3.4.3 Support vector machine model
The SVM model is an intelligent algorithm for the binary classification of statistical data. This model maps the above 14 influence factor databases from the original space to a higher dimensional space through a kernel function; thus, the samples become linearly separable in the space and analyze the maximum spacing between the positive and negative classifications of disaster points and non-disaster points. The optimal hyperplane is searched in the space to separate the samples to maximize the sample interval and then classify the samples through the classification decision function (Goetz et al., 2015). {xi, yi} is a character vector of the sample data, in which i=1,2,…,l, xi∈Rn, yi∈{−1, +1}, l is the number of samples whereas n represents the input dimension. Nonlinear mapping Φ (x) maps the sample from the input space to the feature one. The classification hyper-plane can be calculated as wΦ(x) + b=0, where w, b are the coefficients of the classification decision function. The optimal hyper-plane needs a maximum 2/‖w‖, which can be transformed into a quadratic programming problem. The Lagrange multiplier method is proposed to solve this equation:
where ξi is the relaxation factor, and C is the penalty parameter. The duality principle is proposed to calculate the above formula. The simplified Lagrange high-dimensional mapping function can be expressed as follows:
where K(xi, xj) is the kernel function. The SVR model can then be established as:
The kernel function mentioned above method is used to simplify the high-dimensional space problem into a low-dimensional space problem. In this study, we adopted the RBF (radial basis kernel function) since it is the most widely applied one in the literature (Zhou et al., 2016).
3.5 Modelling procedure
The proposed landslide susceptibility modelling procedure for the middle Yellow River catchment includes the following phases:
(i) The grid unit was determined as the susceptibility assessment unit. The cell resolution was set as 30 m × 30 m of the 1:50000 scale, with 1,849,962 units. The grid-point turning function was proposed in the GIS environment to transfer the influence factors and obtain the attribute data of all influence factors in the region. Due to the different value ranges of each influencing factor, it is necessary to normalize the attribute of each factor to the [0, 1] closed interval to ensure unity in the evaluation results. After establishing the influencing factors system, the AHP approach was applied to compute the weight of factors. The geological background of the region constructed the judgment matrix of landslide influencing factors. As seen in Table 2, the expert experience was employed to summarize the normalized weight of each weight. The results of different statistical indicators (random index = 1.58; consistency index = 0.092; consistency ratio = 0.058 < 0.1; λmax = 15.191) showed that the matrix passed the consistency check.
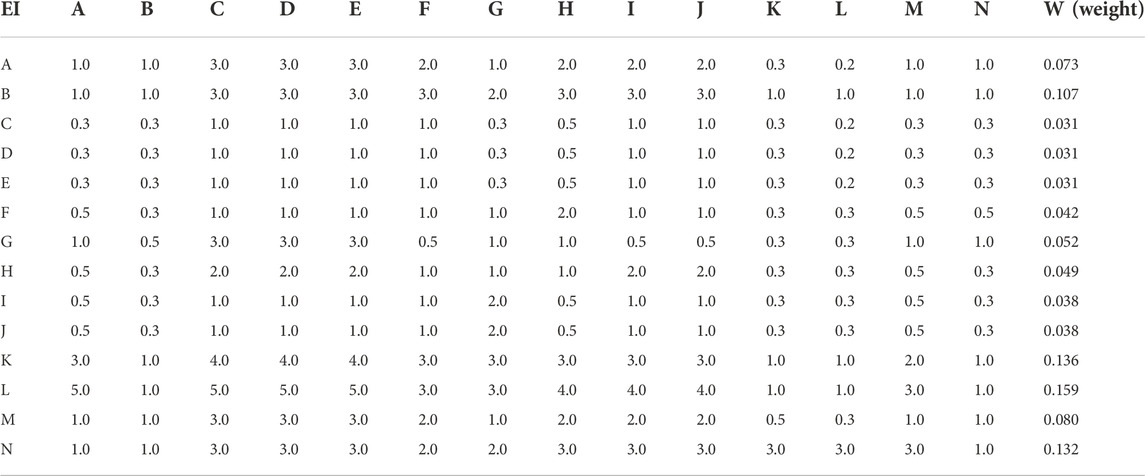
TABLE 2. AHP judgement matrix for the 14 influencing factors.
(ii) The 684 landslide points investigated in the field were proposed as landslide samples, and the attributes of influence factors were extracted into the samples in the GIS environment. According to the principle of non-landslide point extraction, 684 non-landslide samples were randomly selected in the buffer areas 500 m outside the landslide point range. The distance between non-landslide points is more significant than 100 m. Similarly, the influence factor attributes were extracted from non-landslide samples. In the MATLAB environment, 547 landslide and non-landslide samples (80% of the entire dataset) were randomly divided as the training dataset for susceptibility assessment. In contrast, the remaining 20% were used as the test dataset. 1,849,962 grids of the study area were substituted into the trained model for prediction, which obtained the susceptibility distribution map of the whole area.
(iii) The SVM and the RF models were implemented in Matlab software to compute the landslide susceptibility. The SVM model with RBF considered non-negative relaxation variables to determine the optimal hyper-plane improved the optimization of the samples with classification errors, and simulated the train and test set samples. The k-fold cross-validation method determined the two critical parameters, namely the penalty factor C and kernel function parameter g, and finally obtained the optimal parameters c = 0.7579 and g = 0.5843 (Figure 5A). There were 1,094 test samples, 995 successful predictions, and 99 failures, and the accuracy of training set samples was 90.95% (Figure 5B). There were 274 test samples, 238 of which were predicted successfully and 36 failed, and the accuracy of test samples was 86.86% (Figure 5C).
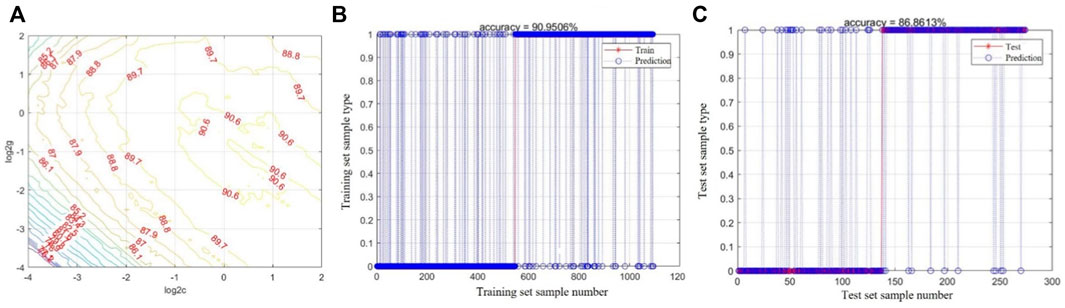
FIGURE 5. (A) c, g optimal value; (B) Training set prediction results; (C) Test set prediction results.
The RF model adopted the bootstrap approach to extract 500 samples from the training data that have been put back to form 500 decision trees and randomly choose 12 influencing factors from 14 factors. The optimal factor set was proposed as the growth and splitting node of the decision tree for model operation. The created RF classifier was introduced for sample prediction, and the results represent that it has good prediction performance (Figure 6A). There were 1,092 test samples, 1,090 successful predictions, and 2 failures, and the accuracy of training set samples was 99.82% (Figure 6B). There were 274 test samples, 246 of which were predicted successfully and 28 failed, and the accuracy of test samples was 87.97% (Figure 6C).
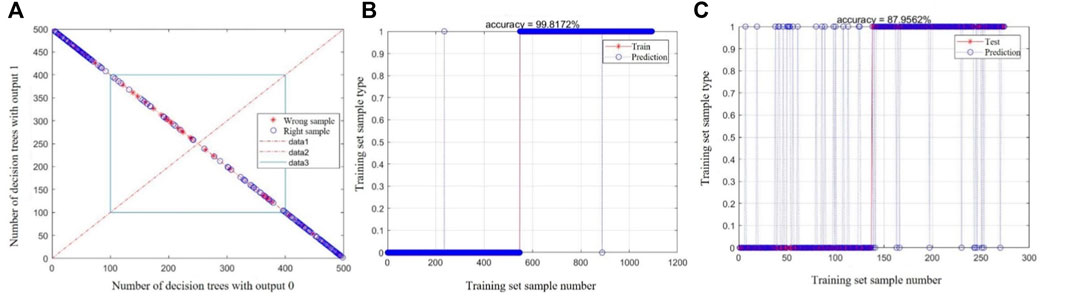
FIGURE 6. (A) The RF model performance analysis; (B) Training set prediction results; (C) Test set prediction results.
4 Results
4.1 Analysis of influencing factors
The bivariate correlation analysis in SPSS software was adopted to analyze the independence of the above 14 factors. The correlation coefficient R [−1, 1] is the judgment index of the calculation result. As shown in Table 3, the results represent that the correlation coefficient |R| max = 0.486 < 0.5, thus indicating the influencing factors have little influence on the susceptibility assessment of landslide disasters, and the selection is reasonable.
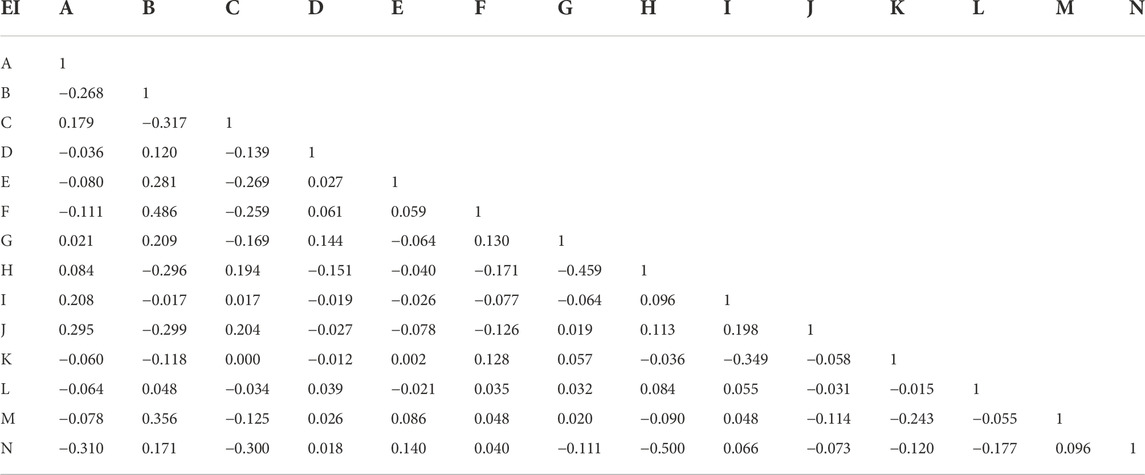
TABLE 3. Correlation analysis result of landslide-affecting factors.
As we can see in Figure 7, five factors among the total 14 factors had higher contributions during the landslide susceptibility modeling, including distance to road (IM = 1), distance to river (IM = 0.97), slope (IM = 0.93), rainfall (IM = 0.92), elevation (IM = 0.91). The contributions of lithology (IM = 0.67), land use (IM = 0.42), geological structure (IM = 0.32), and NDVI (IM = 0.32) were moderate. The other five factors represented low contribution, including NDWI, plan curvature, profile curvature, surface roughness, and aspect. The importance calculation results are consistent with the weight calculated by the AHP in Table 2, in which the distance to road (W = 0.159), distance to river (W = 0.136), rainfall (W = 0.132), and slope (W = 0.132) have higher weights, which verifies the rationality of the subjective weight results and the objective importance of the model calculation. Overall, the results reveal that the two triggering factors (distance to river and rainfall) are of more importance than other factors for the landslide occurrance of the middle stream of the Yellow River catchment. In addition, no factor had a negative importance value, therefore all the factors are reasonable to be included to conduct landslide susceptibility assessment.
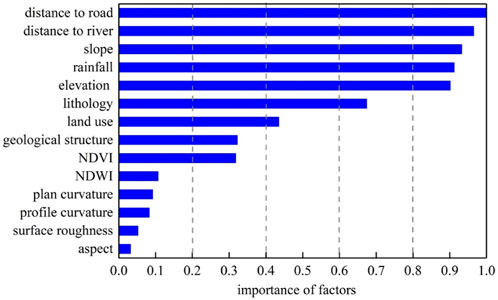
FIGURE 7. The importance of factors obtained from the C5.0 decision tree model.
Eqs 4, 5 was used to calculate the IV of different grades of each influencing factor in the GIS environment, and then the IV was multiplied by the factor weight to obtain the WIV and ranking of each factor. Table 4 summarizes the ratio between the number of landslides distributed within a specific influencing factor to the total number (Ni/N), the ratio between the area of landslides distributed within a specific influencing factor to the entire region (Si/S), IV (I), weight, WIV, and the rank for each level of each influencing factor. According to the results, the IV in the area ranges from −2.11 to 2.47. The WIV of the first six factors are as follows: distance to road (0–100 m), rainfall (>475 mm), distance to rivers (0–100 m), slope (23°–59°), NDWI (0.008–0.240), land use (settlement). These factors significantly influence the development of the historical landslides of the study site.

TABLE 4. Calculation of the IVs of the landslide influencing factors.
4.2 Landslide distribution in different landslide susceptibility maps
The WIV of different ranges of each factor calculated in Table 4 was assigned by ArcGIS and superimposed by the ArcGIS grid calculator to determine the region’s landslide susceptibility index (LSI). The distribution range of LSI ranges from −0.838 to 0.940 (Figure 8A). The LSI predicted by SVM and RF methods were assigned to the corresponding grids of the study area through ArcGIS software to obtain susceptibility maps. The range of LSIs of the study area from the SVM and random forest models is between −4.236 and 1.807 (Figure 8B) and between 0 and 1 (Figure 8C), receptivity. The natural breakpoint method was adopted to divide the susceptibility distribution map (SDM) calculated by the three data-driven models: high, moderate, low, and very low (Figure 9). The results showed that high susceptibility zona is consistent with the spatial distribution of the landslides inventory points. The values of Ni/N and Si/S are shown in Figure 10. All the indicators increased with the susceptibility level, thus indicating that these models predicted the landslide-prone/non-prone areas well. Each level of the WIV model accounts for a relatively uniform proportion of the total area. The area of high susceptibility accounts for 10.8% of the total area, whereas the landslide number accounts for 57.8% of the total points. In contrast, the area with a very low susceptibility level accounts for 33.2% of the entire region, but the number of landslides accounts for only 2.5% of all the inventory points. For the landslide number identified in the high susceptibility level area, both SVM and RF models exceeded 70%, thus indicating that most landslides were predicted successfully. The RF had the best performance: the area of high susceptibility accounts for 21.9%, whereas the landslide number accounts for 90.5%, the very low susceptibility area, its area accounts for 39.4% of the total area, while the number of landslides accounts for only 0.7%. These results demonstrated that the RF approach better predicted historical landslides in high susceptibility level regions, and the resulting landslide susceptibility map was more efficient.
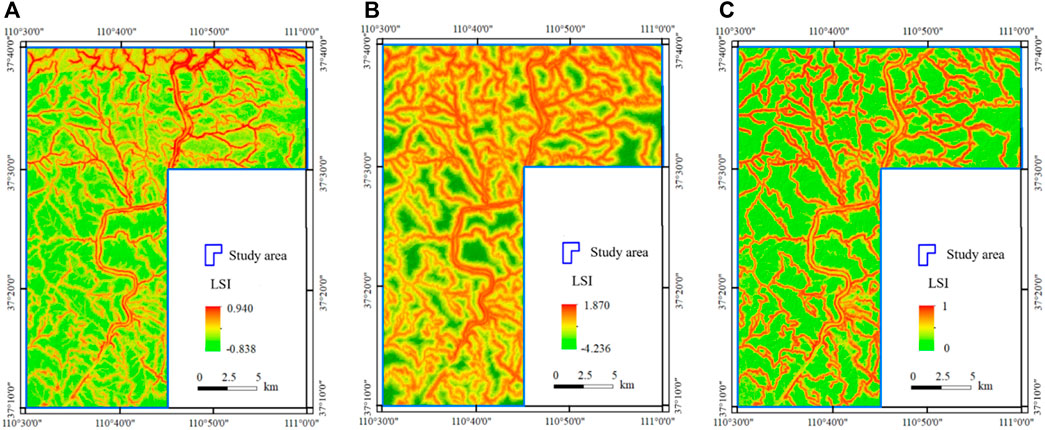
FIGURE 8. LSI maps obtained from different models: (A) WIV model, (B) SVM model, (C) RF mode.
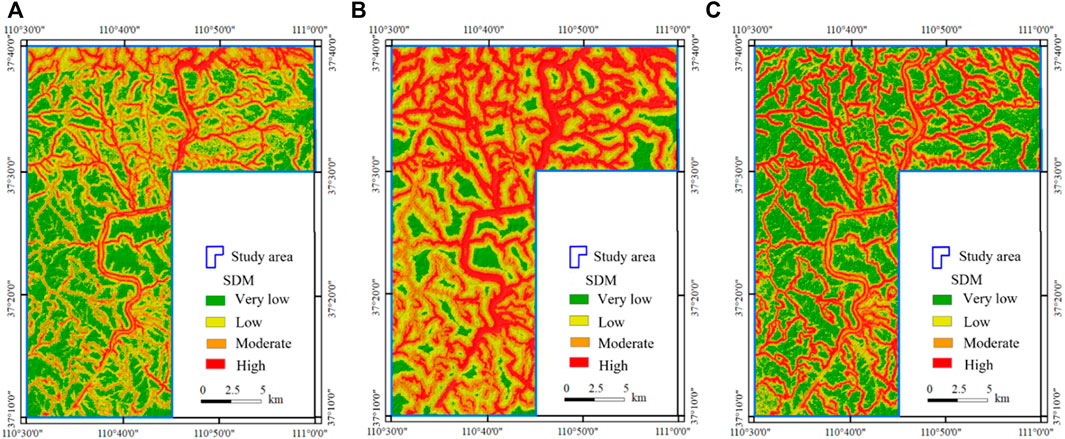
FIGURE 9. Landslide susceptibility level maps obtained from different models: (A) WIV model, (B) SVM model, (C) RF model.
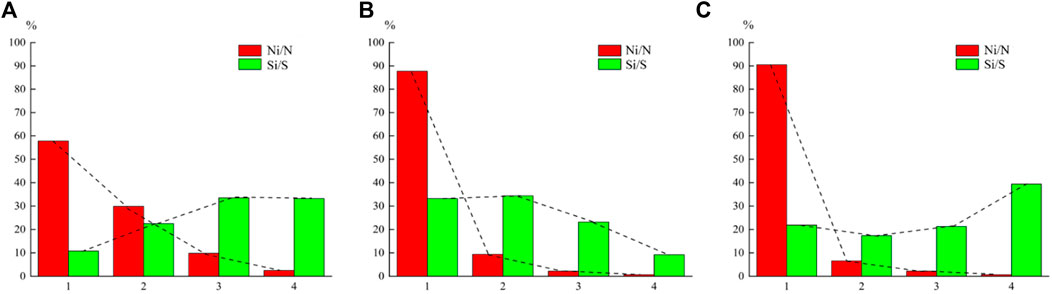
FIGURE 10. Statistical indicators of the historical landslides in each susceptibility level: (A) WIV model, (B) SVM model, (C) RF model.
4.3 Model validation and comparison
The model validation is critical for both the model fitness evlauation and the quality assessment of the generated landslide susceptibility maps (Guzzetti et al., 2005). In the present study, the confusion matrix-based statistical index was proposed to evaluate the prediction ability of these models, and the receiver operating characteristic (ROC) was generated. As seen in Figure 11, the area under the ROC curves (AUC) of the three used models is all over 0.8, representing that these models all have prediction ability in the landslide susceptibility assessment and can provide a reference for current government risk management strategies. The RF model achieved excellent performance of AUC 0.9035, while the SVM model and WIV model are AUC 0.8472, 0.8446 respective. There are only 5 landslide points in the very-low susceptibility area obtained from the SVM and RF models, accounting for 0.7% of inventory points. Although the WIV model can quantify the relationship between factors and landslide occurrence, expert judgments are predominantly non-qualitative and empirical; thus, the error is higher than that from machine learning models. The validation results of SVM and RF models are more objective and accurate. Combined with the ROC curves for the three models, the prediction ability of random forest is significantly better than that of the WIV and SVM approaches, and the assessment results of the landslide susceptibility in the study area agree better with the observations from remote sensing images and field investigation.
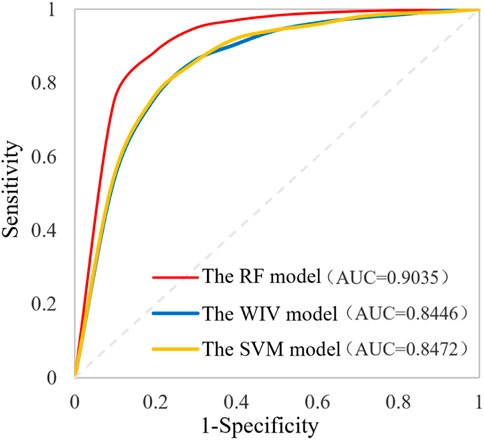
FIGURE 11. The ROC curves of the three data-driven models in landslide susceptibility assessment.
5 Discussion
5.1 Relationship between landslide susceptibility and planning
The susceptibility mapping results from all the three models indicated that the northern part of the study area is more susceptible to landsliding than the southern part. Moreover, it is evident that the highest susceptibility zone is mainly along with the Yellow River. This agrees well with the spatial distribution of historical inventory points. Previous studies in the Loess Plateau also observed similar results. For instance, a landslide susceptibility mapping conducted in the Yangou Watershed (Gao and Zhang, 2022) showed that the very high susceptibility is the area along the river and road. Our statistical results showed that 62% of landslides are located at the areas with the distances to the river smaller than 300 m. In the three landslide susceptibility maps, the high susceptibility level in this area accounted for 78%, 82% and 79% of the total area with high susceptibility level, respectively. As previous literature concluded (Fell et al., 2008; Skilodimou et al., 2019; Guo et al., 2020c), the landslide susceptibility zonation can be used as a guide for land use planning because it is most commonly required at the local government level for planning urban development. This is also supported by the present study, which advised that the area nearby the large river may be not suitable to develop urban and major infrastructures. This can be explained by the weak engineering geology properties of loess that has been widely reported by other studies (Zhuang et al., 2018): Several severe landslide occurrences were triggered under hydraulic conditions due to the collapsibility and porosity of loess (e.g., Zhao and Zhao, 2020). Nevertheless, the current situation of the middle Yellow River catchment is that most settlements are still located along with the riverbanks because the topography is quite flat in this area. However, the human engineering activities following the high urbanization may result in more landslides especially shallow small-scale ones (Figure 12). Such situations highlight an open issue in the Loess Plateau, namely that the contradiction between environments (natural hazards, soil erosion, and so on) and land use requirement. For example, a recent detailed statistic (Xu et al., 2017) in the landslides on the Loess Plateau showed that with the development of the Chinese economy, residential areas on the Loess Plateau are rapidly expanding along steep slope terraces and adverse destabilization from human activities, which is the major cause of landslides. Hence, the improvement of ecological conditions is a operational challenge for local authorities. Fortunately, the policies of local authority during the past decade encourage planting and afforestation, which have evidently reduced risks of loess landslides (Tang et al., 2020).
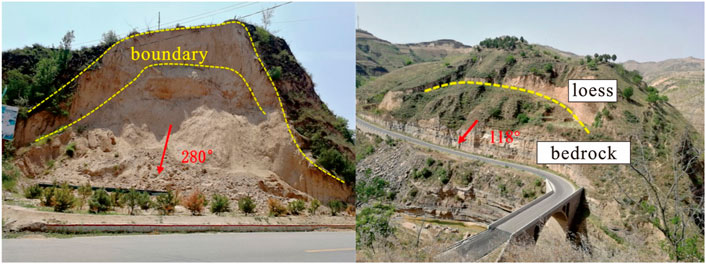
FIGURE 12. Typical shallow landslides triggered by human engineering activities.
5.2 Insights for the factor combination used for modelling
One of main objectives of the present study is to reveal the role of various influencing factors in the landslide susceptibility of the study area, because very limited similar efforts have been made for the loess environments (Zhuang et al., 2015). Our results indicated three factors (distance to road, distance to river, and slope) which are more important for landslide occurrence, whereas five factors have evidently smaller importance (NDWI, plan curvature, profile curvature, surface roughness, and aspect). Hence, if the time or economic cost of end-users (or civil protection department) are limited, these factors can be skipped, turning to those really matter. Some previous studies for this region confirmed the current results. For example, Gao and Zhang (2022) obderved that the high landslide susceptibility area in the middle stream of the Yellow River is commonly characterized by a larger slope. However, it should be also noted that some studies present different results. Tang et al. (2020) find that rainfall and land use are are more important for the occurrences of the landslides in the Loess Plateau. Such comparisons lead us to conclude that the contribution of factors may depends much on local geological settings.
A simple test of landslide susceptibility assessment without these five factors showed that the accuracy of final results did not change much: the AUC values were 0.9017 (RF model), 0.8541 (WIV model) and 0.8658 (SVM model), respectively. It can be seen that some scenarios even had better performance, which agreed well with what stated by Glade and Crozier (Glade and Crozier, 2005): adding data into the combination of input data can improve the performance of a model with a given complexity, but the prediction ability of the model decreases if the data availability continues to increase. Hence, it is important to find a better combination of influencing factors to improve the performance of regional landslide susceptibility mapping in the future.
6 Conclusion
The middle Yellow River catchment in China is prone to landslides, but few studies focused on regional landslide susceptibility modelling in this area. The present study employed three data-driven approaches to generate regional landslide susceptibility maps for the region and tried to reveal the contributions of different influencing factors. The Pearson’s correlation coefficient among influencing factors showed that all the selected 14 factors were conditionally independent. The results obtained from the C5.0 decision tree approach revealed the most critical factors for the landslide occurrance of the area, namely distance to road, distance to river, and slope. Validation and comparison results by using the ROC curve demonstrated that the RF model (AUC = 0.904) had a high accuracy than WIV (AUC = 0.845) and SVM (AUC = 0.847) models. The RF model identified 97.1% of historical landslide inventoty points in the area with high susceptibility level, whereas only 0.7% of landslides were located at the low susceptibility zones. Overall, the three techniques have been confirmed as promising models for the landslide susceptibility assessment in China’s Loess Plateau, particularly the RF model. Conclusively, the current results may be helpful for future landslide risk management and mitigation in areas with similar geological and environmental settings. Potential future works for us are to find a better combination of influencing factors to improve the performance of landslide susceptibility mapping, and use the results to guide local land use planning.
Data availability statement
The raw data supporting the conclusion of this article will be made available by the authors, without undue reservation.
Author contributions
Conceptualization, ZG and BT; methodology, ZG and TZ; software, GL and TZ; validation, DH, JH, and DS; formal analysis, ZG and BT; resources, ZG and DH; writing—original draft preparation, ZG, GL, and TZ; writing—review and editing, BT and DH; visualization, GL and JH; supervision, and DS; project administration DH; funding acquisition, DH.
Funding
This research is funded by Hebei Key Laboratory of Earthquake Disaster Prevention and Risk Assessment (Grant No. FZ223202), National Natural Science Foundation of China (No. 41902290; No. 41972297), Natural Science Foundation of Hebei Province (No. D2020202002; No. D2021202002; No. D2022202005), Talents in Hebei Provincial Education Office (No. SLRC2019027).
Conflict of interest
The authors declare that the research was conducted in the absence of any commercial or financial relationships that could be construed as a potential conflict of interest.
Publisher’s note
All claims expressed in this article are solely those of the authors and do not necessarily represent those of their affiliated organizations, or those of the publisher, the editors and the reviewers. Any product that may be evaluated in this article, or claim that may be made by its manufacturer, is not guaranteed or endorsed by the publisher.
References
Achour, Y., and Pourghasemi, H. R. (2020). How do machine learning techniques help in increasing accuracy of landslide susceptibility maps? Geosci. Front. 11 (3), 871–883. doi:10.1016/j.gsf.2019.10.001
Atkinson, P. M., Massari, R., and Unwin, D. (1998). Generalised linear modelling of susceptibility to landsliding in the central Apennines, Italy. Comput. Geosci. 24 (4), 373–385. doi:10.1016/S0098-3004(97)00117-9
Bhandary, N. P., Dahal, R. K., Timilsina, M., and Yatabe, R. (2013). Rainfall event-based landslide susceptibility zonation mapping. Nat. Hazards (Dordr). 69 (1), 365–388. doi:10.1007/s11069-013-0715-x
Bourenane, H., Bouhadad, Y., Guettouche, M. S., and Braham, M. (2015). GIS-based landslide susceptibility zonation using bivariate statistical and expert approaches in the City of Constantine (northeast Algeria). Bull. Eng. Geol. Environ. 74 (2), 337–355. doi:10.1007/s10064-014-0616-6
Bueechi, E., Klimeš, J., Frey, H., Huggel, C., Strozzi, T., and Cochachin, A. (2019). Regional-scale landslide susceptibility modelling in the cordillera blanca, Peru—a comparison of different approaches. Landslides 16 (2), 395–407. doi:10.1007/s10346-018-1090-1
Bui, D. T., Shahabi, H., Omidvar, E., Shirzadi, A., Geertsema, M., Clague, J., et al. (2019). Shallow landslide prediction using a novel hybrid functional machine learning algorithm. Remote Sens. 11 (8), 931. doi:10.3390/rs11080931
Catani, F., Lagomarsino, D., Segoni, S., and Tofani, V. (2013). Landslide susceptibility estimation by random forests technique: sensitivity and scaling issues. Nat. Hazards Earth Syst. Sci. 13 (11), 2815–2831. doi:10.5194/nhess-13-2815-2013
Chang, Z., Du, Z., Zhang, F., Huang, F., Chen, J., Li, W., et al. (2020). Landslide susceptibility prediction based on remote sensing images and GIS: Comparisons of supervised and unsupervised machine learning models. Remote Sens. (Basel). 12 (3), 502. doi:10.3390/rs12030502
Chen, X., and Chen, W. (2021). GIS-based landslide susceptibility assessment using optimized hybrid machine learning methods. Catena 196, 104833. doi:10.1016/j.catena.2020.104833
Chen, L., Guo, Z., Yin, K., Shrestha, D. P., and Jin, S. (2019). The influence of land use and land cover change on landslide susceptibility: a case study in zhushan town, xuan’en county (hubei, China). Nat. Hazards Earth Syst. Sci. 19, 2207–2228. doi:10.5194/nhess-19-2207-2019
Ciurleo, M., Mandaglio, M. C., and Moraci, N. (2019). Landslide susceptibility assessment by TRIGRS in a frequently affected shallow instability area. Landslides 16 (1), 175–188. doi:10.1007/s10346-018-1072-3
Crozier, M. J., and Glade, T. (2005). “Landslide hazard and risk: Issues, concepts and approach,” in Landslide hazard and risk. Editors T. Glade, M. Anderson, and M. J. Crozier (Chichester, West Sussex, England: John Wiley & Sons), 1–40.
Dai, C., Li, W., Wang, D., Lu, H., Xu, Q., and Jian, J. (2021). Active landslide detection based on sentinel-1 data and InSAR Technology in zhouqu county, gansu province, northwest China. J. Earth Sci. 32 (5), 1092–1103. doi:10.1007/s12583-020-1380-0
Dou, J., Yunus, A. P., Bui, D. T., Merghadi, A., Sahana, M., Zhu, Z., et al. (2020). Improved landslide assessment using support vector machine with bagging, boosting, and stacking ensemble machine learning framework in a mountainous watershed, Japan. Landslides 17 (3), 641–658. doi:10.1007/s10346-019-01286-5
Fell, R., Corominas, J., Bonnard, C., Cascini, L., Leroi, E., and Savage, W. Z. (2008). Guidelines for landslide susceptibility, hazard and risk zoning for land use planning. Eng. Geol. 102 (3-4), 85–98. doi:10.1016/j.enggeo.2008.03.022
Froude, M. J., and Petley, D. N. (2018). Global fatal landslide occurrence from 2004 to 2016. Nat. Hazards Earth Syst. Sci. 18 (8), 2161–2181. doi:10.5194/nhess-18-2161-2018
Gao, H., and Zhang, X. (2022). Landslide susceptibility assessment considering landslide volume: A case study of Yangou watershed on the Loess Plateau (China). Appl. Sci. 12 (9), 4381. doi:10.3390/app12094381
Glade, T., and Crozier, M. J. (2005). “A review of scale dependency in landslide hazard and risk analysis,” in Landslide hazard and risk. Editors T. Glade, M. G. Anderson, and M. J. Crozier (Chichester: Wiley), 75–138.
Goetz, J. N., Guthrie, R. H., and Brenning, A. (2011). Integrating physical and empirical landslide susceptibility models using generalized additive models. Geomorphology 129 (3-4), 376–386. doi:10.1016/j.geomorph.2011.03.001
Goetz, J. N., Brenning, A., Petschko, H., and Leopold, P. (2015). Evaluating machine learning and statistical prediction techniques for landslide susceptibility modeling. Comput. Geosci. 81, 1–11. doi:10.1016/j.cageo.2015.04.007
Gong, W. J., Lei, W. J., Chen, Z. C., Gao, Y. X., Zeng, S. G., Zhang, G. L., et al. (2001). Chinese soil Taxonomy. Beijing: Science Press.
Guo, Z., Chen, L., Gui, L., Du, J., Yin, K., and Do, H. M. (2020a). Landslide displacement prediction based on variational mode decomposition and WA-GWO-BP model. Landslides 17, 567–583. doi:10.1007/s10346-019-01314-4
Guo, Z., Yin, K., Liu, Q., Huang, F., Gui, L., and Zhang, G. (2020b). Rainfall warning of creeping landslide in Yunyang County of Three Gorges Reservoir based on displacement ratio model. Earth Sci. 45 (2), 672–684. doi:10.3799/dqkx.2019.005
Guo, Z., Chen, L., Yin, K., Shrestha, D. P., and Zhang, L. (2020c). Quantitative risk assessment of slow-moving landslides from the viewpoint of decision-making: A case study of the three gorges reservoir in China. Eng. Geol. 273, 105667. doi:10.1016/j.enggeo.2020.105667
Guo, Z., Shi, Y., Huang, F., Fan, X., and Huang, J. (2021). Landslide susceptibility zonation method based on C5.0 decision tree and K-means cluster algorithms to improve the efficiency of risk management. Geosci. Front. 12, 101249. doi:10.1016/j.gsf.2021.101249
Guzzetti, F., Reichenbach, P., Cardinali, M., Galli, M., and Ardizzone, F. (2005). Probabilistic landslide hazard assessment at the basin scale. Geomorphology 72 (1-4), 272–299. doi:10.1016/j.geomorph.2005.06.002
He, H., Hu, D., Sun, Q., Zhu, L., and Liu, Y. (2019). A landslide susceptibility assessment method based on GIS Technology and an AHP-weighted information content method: A case study of southern anhui, China. ISPRS Int. J. Geoinf. 8 (6), 266. doi:10.3390/ijgi8060266
He, J., Qiu, H., Qu, F., Hu, S., Yang, D., Shen, Y., et al. (2021). Prediction of spatiotemporal stability and rainfall threshold of shallow landslides using the TRIGRS and Scoops3D models. Catena 197, 104999. doi:10.1016/j.catena.2020.104999
Huang, F., Yin, K., Huang, J., Gui, L., and Wang, P. (2017). Landslide susceptibility mapping based on self-organizing-map network and extreme learning machine. Eng. Geol. 223, 11–22. doi:10.1016/j.enggeo.2017.04.013
Huang, F., Cao, Z., Guo, J., Jiang, S. H., and Li, S. (2020). Comparisons of heuristic, general statistical and machine learning models for landslide susceptibility prediction and mapping. Catena 191, 104580. doi:10.1016/j.catena.2020.104580
Huang, Y., Xu, C., Zhang, X., Xue, C., and Wang, S. (2021). An updated database and spatial distribution of landslides triggered by the milin, tibet Mw6.4 Earthquake of 18 november 2017. J. Earth Sci. 32 (5), 1069–1078. doi:10.1007/s12583-021-1433-z
Hungr, O., Leroueil, S., and Picarelli, L. (2014). The Varnes classification of landslide types, an update. Landslides 11 (2), 167–194. doi:10.1007/s10346-013-0436-y
Hürlimann, M., Guo, Z., Puig-Polo, C., and Medina, V. (2022). Impacts of future climate and land cover changes on landslide susceptibility: Regional scale modelling in the Val d’ Aran region (Pyrenees, Spain). Landslides 19, 99–118. doi:10.1007/s10346-021-01775-6
Hwang, S., Guevarra, I. F., and Yu, B. O. (2009). Slope failure prediction using a decision tree; a case of engineered slopes in South Korea. Eng. Geol. 104 (1-2), 126–134. doi:10.1016/j.enggeo.2008.09.004
Kouli, M., Loupasakis, C., Soupios, P., Rozos, D., and Vallianatos, F. (2014). Landslide susceptibility mapping by comparing the WLC and WofE multi-criteria methods in the West Crete Island, Greece. Environ. Earth Sci. 72 (12), 5197–5219. doi:10.1007/s12665-014-3389-0
Li, Q., Huang, D., Pei, S., Qian, J., and Wang, M. (2021). Using physical model experiments for hazards assessment of rainfall-induced debris landslides. J. Earth Sci. 32 (5), 1113–1128. doi:10.1007/s12583-020-1398-3
Lin, W., Yin, K., Wang, N., Xu, Y., Guo, Z., and Li, Y. (2021). Landslide hazard assessment of rainfall-induced landslide based on the CF-SINMAP model: a case study from wuling mountain in hunan province, China. Nat. Hazards (Dordr). 106 (1), 679–700. doi:10.1007/s11069-020-04483-x
Liu, J., and Duan, Z. (2018). Quantitative assessment of landslide susceptibility comparing statistical index, index of entropy, and weights of evidence in the shangnan area, China. Entropy (Basel). 20 (11), 868. doi:10.3390/e20110868
Mao, Z., Shi, S., Li, H., Zhong, J., and Sun, J. (2022). Landslide susceptibility assessment using triangular fuzzy number-analytic hierarchy processing (TFN-AHP), contributing weight (CW) and random forest weighted frequency ratio (RF weighted FR) at the Pengyang county, Northwest China. Environ. Earth Sci. 81, 86. doi:10.1007/s12665-022-10193-3
Medina, V., Hürlimann, M., Guo, Z., Lloret, A., and Vaunat, J. (2021). Fast physically-based model for rainfall-induced landslide susceptibility assessment at regional scale. Catena 201, 105213. doi:10.1016/j.catena.2021.105213
Moayedi, H., Osouli, A., Bui, D. T., Kok Foong, L., Nguyen, H., and Kalantar, B. (2019). Two novel neural-evolutionary predictive techniques of dragonfly algorithm (DA) and biogeography-based optimization (BBO) for landslide susceptibility analysis. Geomatics, Nat. Hazards Risk 10 (1), 2429–2453. doi:10.1080/19475705.2019.1699608
Nhu, V. H., Shirzadi, A., Shahabi, H., Chen, W., Clague, J. J., Geertsema, M., et al. (2020a). Shallow landslide susceptibility mapping by random forest base classifier and its ensembles in a semi-arid region of Iran. Forests 11 (4), 421. doi:10.3390/f11040421
Nhu, V. H., Mohammadi, A., Shahabi, H., Ahmad, B. B., Al-Ansari, N., Shirzadi, A., et al. (2020b). Landslide susceptibility mapping using machine learning algorithms and remote sensing data in a tropical environment. Int. J. Environ. Res. Public Health 17 (14), 4933. doi:10.3390/ijerph17144933
Niu, Q., Dang, X., Li, Y., Zhang, Y., Lu, X., and Gao, W. (2018). Suitability analysis for topographic factors in loess landslide research: a case study of gangu county, China. Environ. Earth Sci. 77, 294. doi:10.1007/s12665-018-7462-y
Nsengiyumva, J. B., and Valentino, R. (2020). Predicting landslide susceptibility and risks using GIS-based machine learning simulations, case of upper Nyabarongo catchment. Geomatics, Nat. Hazards Risk 11 (1), 1250–1277. doi:10.1080/19475705.2020.1785555
Peng, J., Wang, S., Wang, Q., Zhuang, J., Huang, W., Zhu, X., et al. (2019). Distribution and genetic types of loess landslides in China. J. Asian Earth Sci. 170, 329–350. doi:10.1016/j.jseaes.2018.11.015
Pereira, S., Zêzere, J. L., and Bateira, C. (2012). Technical Note: Assessing predictive capacity and conditional independence of landslide predisposing factors for shallow landslide susceptibility models. Nat. Hazards Earth Syst. Sci. 12 (4), 979–988. doi:10.5194/nhess-12-979-2012
Petley, D. (2012). Global patterns of loss of life from landslides. Geol. (Boulder) 40 (10), 927–930. doi:10.1130/G33217.1
Pham, B. T., Jaafari, A., Prakash, I., and Bui, D. T. (2019). A novel hybrid intelligent model of support vector machines and the MultiBoost ensemble for landslide susceptibility modeling. Bull. Eng. Geol. Environ. 78 (4), 2865–2886. doi:10.1007/s10064-018-1281-y
Pradhan, B. (2013). A comparative study on the predictive ability of the decision tree, support vector machine and neuro-fuzzy models in landslide susceptibility mapping using GIS. Comput. Geosci. 51, 350–365. doi:10.1016/j.cageo.2012.08.023
Purinton, B., and Bookhagen, B. (2017). Validation of digital elevation models (DEMs) and comparison of geomorphic metrics on the southern Central Andean Plateau. Earth Surf. Dynam. 5 (2), 211–237. doi:10.5194/esurf-5-211-2017
Reichenbach, P., Rossi, M., Malamud, B. D., Mihir, M., and Guzzetti, F. (2018). A review of statistically-based landslide susceptibility models. Earth. Sci. Rev. 180, 60–91. doi:10.1016/j.earscirev.2018.03.001
Rossi, M., Guzzetti, F., Reichenbach, P., Mondini, A. C., and Peruccacci, S. (2010). Optimal landslide susceptibility zonation based on multiple forecasts. Geomorphology 114 (3), 129–142. doi:10.1016/j.geomorph.2009.06.020
Saaty, T. L. (2008). Decision making with the analytic hierarchy process. Int. J. Serv. Sci. 1 (1), 83–98. doi:10.1504/ijssci.2008.017590
Segoni, S., Pappafico, G., Luti, T., and Catani, F. (2020). Landslide susceptibility assessment in complex geological settings: sensitivity to geological information and insights on its parameterization. Landslides 17 (10), 2443–2453. doi:10.1007/s10346-019-01340-2
Sezer, E. A., Nefeslioglu, H. A., and Osna, T. (2017). An expert-based landslide susceptibility mapping (LSM) module developed for Netcad architect software. Comput. Geosci. 98, 26–37. doi:10.1016/j.cageo.2016.10.001
Shirzadi, A., Chapi, K., Shahabi, H., Solaimani, K., Kavian, A., and Ahmad, B. B. (2017). Rock fall susceptibility assessment along a mountainous road: an evaluation of bivariate statistic, analytical hierarchy process and frequency ratio. Environ. Earth Sci. 76, 152. doi:10.1007/s12665-017-6471-6
Shu, H., Hürlimann, M., Molowny-Horas, R., Gonzalez, M., Pinyol, J., Abanco, C., et al. (2019). Relation between land cover and landslide susceptibility in Val d'Aran, Pyrenees (Spain): Historical aspects, present situation and forward prediction. Sci. Total Environ. 693, 133557. doi:10.1016/j.scitotenv.2019.07.363
Skilodimou, H. D., Bathrellos, G. D., Chousianitis, K., Youssef, A. M., and Pradhan, B. (2019). Multi-hazard assessment modeling via multi-criteria analysis and GIS: a case study. Environ. Earth Sci. 78, 47. doi:10.1007/s12665-018-8003-4
Tang, Y., Feng, F., Guo, Z., Feng, W., Li, Z., Wang, J., et al. (2020). Integrating principal component analysis with statistically-based models for analysis of causal factors and landslide susceptibility mapping: A comparative study from the Loess Plateau area in Shanxi (China). J. Clean. Prod. 277, 124159. doi:10.1016/j.jclepro.2020.124159
Tang, Y., Guo, Z., Wu, L., Hong, B., Feng, W., Su, X., et al. (2022). Assessing debris flow risk at a catchment scale for an economic decision based on the LiDAR DEM and numerical simulation. Front. Earth Sci. (Lausanne). 10, 821735. doi:10.3389/feart.2022.821735
Tian, Y., Xu, C., Ma, S., Xu, X., Wang, S., and Zhang, H. (2019). Inventory and spatial distribution of landslides triggered by the 8th august 2017 MW 6.5 jiuzhaigou Earthquake, China. J. Earth Sci. 30 (1), 206–217. doi:10.1007/s12583-018-0869-2
Vick, L. M., Böhme, M., Rouyet, L., Bergh, S. G., Corner, G. D., and Lauknes, T. R. (2020). Structurally controlled rock slope deformation in northern Norway. Landslides 17 (8), 1745–1776. doi:10.1007/s10346-020-01421-7
Wang, Q., Guo, Y., Li, W., He, J., and Wu, Z. (2019). Predictive modeling of landslide hazards in Wen County, northwestern China based on information value, weights-of-evidence, and certainty factor. Geomatics, Nat. hazards risk 10 (1), 820–835. doi:10.1080/19475705.2018.1549111
Wang, Y., Feng, L., Li, S., Ren, F., and Du, Q. (2020). A hybrid model considering spatial heterogeneity for landslide susceptibility mapping in Zhejiang Province, China. Catena 188, 104425. doi:10.1016/j.catena.2019.104425
Wu, W., Xu, C., Wang, X., Tian, Y., and Deng, F. (2020). Landslides triggered by the 3 august 2014 ludian (China) mw 6.2 Earthquake: An updated inventory and analysis of their spatial distribution. J. Earth Sci. 31 (4), 853–866. doi:10.1007/s12583-020-1297-7
Xu, X. Z., Guo, W. Z., Liu, Y. K., Ma, J. Z., Wang, W. L., Zhang, H. W., et al. (2017). Landslides on the Loess Plateau of China: a latest statistics together with a close look. Nat. Hazards (Dordr). 86, 1393–1403. doi:10.1007/s11069-016-2738-6
Yao, X., Tham, L. G., and Dai, F. C. (2008). Landslide susceptibility mapping based on support vector machine: A case study on natural slopes of Hong Kong, China. Geomorphology 101 (4), 572–582. doi:10.1016/j.geomorph.2008.02.011
Yilmaz, I. (2009). Landslide susceptibility mapping using frequency ratio, logistic regression, artificial neural networks and their comparison: A case study from kat landslides (tokat—Turkey). Comput. Geosci. 35 (6), 1125–1138. doi:10.1016/j.cageo.2008.08.007
Zêzere, J. L., Pereira, S., Melo, R., Oliveira, S., and Garcia, R. (2017). Mapping landslide susceptibility using data-driven methods. Sci. Total Environ. 589, 250–267. doi:10.1016/j.scitotenv.2017.02.188
Zhang, M., and Liu, J. (2010). Controlling factors of loess landslides in Western China. Environ. Earth Sci. 59 (8), 1671–1680. doi:10.1007/s12665-009-0149-7
Zhang, T., Han, L., Chen, W., and Shahabi, H. (2018). Hybrid integration approach of entropy with logistic regression and support vector machine for landslide susceptibility modeling. Entropy 20 (11), 884. doi:10.3390/e20110884
Zhang, Y., Wu, W., Qin, Y., Lin, Z., Zhang, G., Chen, R., et al. (2020). Mapping landslide hazard risk using random forest algorithm in guixi, jiangxi, China. ISPRS Int. J. Geoinf. 9 (695), 695. doi:10.3390/ijgi9110695
Zhao, B., and Zhao, Y. Q. (2020). Investigation and analysis of the xiangning landslide in Shanxi province, China. Nat. Hazards (Dordr). 103, 3837–3845. doi:10.1007/s11069-020-04109-2
Zhou, C., Yin, K., Cao, Y., and Ahmed, B. (2016). Application of time series analysis and PSO–SVM model in predicting the Bazimen landslide in the Three Gorges Reservoir, China. Eng. Geol. 204, 108–120. doi:10.1016/j.enggeo.2016.02.009
Zhu, L., Wang, G., Huang, F., Li, Y., Chen, W., and Hong, H. (2022). Landslide susceptibility prediction using sparse feature extraction and machine learning models based on GIS and remote sensing. IEEE Geosci. Remote Sens. Lett. 19, 1–5. doi:10.1109/LGRS.2021.3054029
Zhuang, J., and Peng, J. (2014). A coupled slope cutting-a prolonged rainfall-induced loess landslide: a 17 october 2011 case study. Bull. Eng. Geol. Environ. 73 (4), 997–1011. doi:10.1007/s10064-014-0645-1
Zhuang, J., Peng, J., Iqbal, J., Liu, T., Liu, N., Li, Y., et al. (2015). Identification of landslide spatial distribution and susceptibility assessment in relation to topography in the Xi’an Region, Shaanxi Province, China. Front. Earth Sci. 9, 449–462. doi:10.1007/s11707-014-0474-3
Keywords: landslide susceptibility, weight, data-driven model, decision tree, influencing factors, GIS
Citation: Guo Z, Tian B, Li G, Huang D, Zeng T, He J and Song D (2023) Landslide susceptibility mapping in the Loess Plateau of northwest China using three data-driven techniques-a case study from middle Yellow River catchment. Front. Earth Sci. 10:1033085. doi: 10.3389/feart.2022.1033085
Received: 31 August 2022; Accepted: 29 September 2022;
Published: 10 January 2023.
Edited by:
Shenghua Cui, Chengdu University of Technology, ChinaReviewed by:
Yong Zheng, Chongqing Jiaotong University, ChinaHiman Shahabi, University of Kurdistan, Iran
Heping Shu, Lanzhou University, China
Copyright © 2023 Guo, Tian, Li, Huang, Zeng, He and Song. This is an open-access article distributed under the terms of the Creative Commons Attribution License (CC BY). The use, distribution or reproduction in other forums is permitted, provided the original author(s) and the copyright owner(s) are credited and that the original publication in this journal is cited, in accordance with accepted academic practice. No use, distribution or reproduction is permitted which does not comply with these terms.
*Correspondence: Da Huang, ZGFodWFuZ0BoZWJ1dC5lZHUuY24=