 Boren Li
 Liping Fan
 Ce Jiang
 Shirong Liao3*
- 1Institute of Geophysics, China Earthquake Administration, Beijing, China
- 2Guangdong Earthquake Agency, Guangzhou, China
- 3Fujian Earthquake Agency, Fuzhou, China
- 4Key Laboratory of Earthquake Source Physics, China Earthquake Administration, Beijing, China
Accurate detection of P-wave arrivals has important applications in real-time seismic data processing, such as earthquake monitoring and earthquake early warning. The Sichuan and Yunnan regions, where the China Seismic Experimental Site (CSES) is located, has frequent strong earthquakes and large amount small earthquakes, resulting in serious earthquake disasters. In this paper, we modify the UNet++ network structure and use 490,000 event waveform data and 78,000 noisy data from the CSES as the data set, and analyze the effects of the training set quality, labeled data and loss function on the model performance to obtain a new P-wave detection model-CSESnet. The recall, precision and F1 score of this model are 94.6%, 85.4% and 89.7%, respectively. The tests in Beijing Capital Circle (BCC) indicates the performance of the CSESnet decrease little and has good generalization. The test in Luxian M6.0 earthquake shows that CSESnet can also predict the P-wave arrival times of large earthquakes and process strong motion data very well. CSESnet provides a new detection model to improve the earthquake detection capability in CSES.
1 Introduction
In earthquake waveforms, P-wave, S-wave and surface wave are the three main groups of wave trains. P-wave is the first wave group to arrive in an earthquake due to its faster propagation speed than S-wave and surface wave. Automatic detection of P-wave is very important for real-time seismological studies, such as earthquake early warning and earthquake rapid reporting (Ma et al., 2013). In addition, accurate picking of P-wave arrivals can provide reliable basic data for high-precision earthquake location and body wave travel time tomography (Lei, 2000; Di Stefano et al., 2006; Husen et al., 2009; Lomax et al., 2009; Tian et al., 2009).
Sichuan-Yunnan region is located on the southeastern margin of the Tibetan Plateau. Due to the eastward extrusion of the crustal material of the Tibetan Plateau, the geological tectonic movement is very active. Moderate and strong earthquakes occur frequently in this region. There have been 25 earthquakes with magnitude larger than 7.0 in history (Yi et al., 2002; Wen, 2018). According to statistics from the China Earthquake Networks Center, one earthquake of magnitude M8.0 (Wenchuan earthquake), two earthquakes of magnitude M7.0 (Lushan earthquake and Jiuzhaigou earthquake), and more than 20 earthquakes of magnitude M6.0–6.9 have occurred in the region since 2000, caused huge casualties and property damage. In recent years, the frequency of microseismic activity in Sichuan-Yunnan region has increased rapidly with industrial activities, such as shale gas exploitation and reservoir storage (Lei et al., 2019). The average number of earthquakes in this region is more than 40,000 per year, accounting for about 42% of the annual number of earthquakes in Chinese mainland (Dai et al., 2019).
In order to reduce earthquake disasters, the China Earthquake Administration (CEA) has started to build an earthquake early warning system in Sichuan-Yunnan region since 2016 (Peng et al., 2021). Currently, there are more than 3400 seismic stations in Sichuan and Yunnan, including 516 broadband stations, 575 acceleration stations, and 2313 low-cost micro-electro-mechanical systems (MEMS) accelerometer stations. The average inter-station distance is 15 km. The system successfully provided early warnings for the 21 May 2021 Yangbi M6.4 earthquake in Yunnan and the 16 September 2021 Luxian M6.0 earthquake in Sichuan. Current earthquake detection algorithms in early warning systems mainly use traditional methods, such as STA/LTA and AIC to detect earthquakes (Allen, 1978; Leonard and Kennett, 1999; Ma et al., 2013; Wenzel and Zschau, 2014; Wu and Lin, 2014). Although the detection efficiency is high, it cannot effectively distinguish P and S-waves, the picking accuracy of P-wave is low, and it needs tune parameters at different stations. Jamming signals generated by lightning, traffic activity, instrument calibration, or instrument malfunction occasionally cause false triggers in the earthquake early warning system, resulting in unnecessary economic losses and public panic (Li et al., 2018; Zhang et al., 2021). The false triggers caused by calibration signals occurred in the earthquake warning system on 5 October 2021, indicating that the earthquake detection algorithm of the warning system needs to be further improved. Since 2021, the CEA has started to build the China Seismic Experimental Site (CSES) in Sichuan-Yunnan region, covering an area of 780,000 km2, with more than 700 new broadband seismic stations and more than 300 short-period seismic stations planned. By then, the number of seismic stations in the experimental site will reach nearly 5,000 seismic stations. There is an urgent need to develop new automatic processing algorithms for both earthquake early warning and real-time data processing for the large number of seismic stations in the CSES.
In recent years, deep learning-based earthquake detection methods represented by U-net have been rapidly developed (Zhu and Beroza, 2019; Liu et al., 2020; Ross et al., 2020; Jiang C. et al., 2021; Jiang Y. et al., 2021). At present, the better deep learning-based seismic phase picking algorithms are developed based on the U-net structure, such as PhaseNet (Zhu and Beroza, 2019), Unet_cea (Zhao et al., 2019), APP (Liu et al., 2020), RED-PAN (Liao et al., 2022). U-net (Ronneberger et al., 2015) was first applied in the field of medical image segmentation. These seismic phase picking algorithms leverage the ability of U-net to apply the two-dimensional image information identified by the target or target boundary to one-dimensional waveform sequence data to identify the seismic phase position information (i.e., seismic arrival time). U-net adopts a symmetric downsampling-upsampling structure: the downsampling part consists of multiple convolutional network layers, and the upsampling part uses multiple deconvolution layers that increase layer by layer. The two parts are symmetrical one by one. Among them, the upsampling layer in the U-net structure also combines the high-resolution feature information (skip connection) generated by the convolution (downsampling path) of the same layer to obtain more accurate information. U-net can better solve the information lost in the downsampling stage in the convolution operation by fusing feature information layer by layer. However, due to the inherent hierarchical model structure of U-net, U-net may lose edge information of large targets or small target information in downsampling and upsampling (Zhou et al., 2018). To solve the problem of insufficient capture detail features of U-net, Zhou (Zhou et al., 2018) proposed the UNet++ network with the addition of multi-scale feature fusion, which achieves better target segmentation than U-net.
In this paper, we selected UNet++ (Zhou et al., 2018) as the backbone network, and modified its network structure according to the characteristics of earthquake waveforms. The earthquake detection model CSESnet was trained using 490,000 event waveform data and 78,000 noise data from 2013 to 2019 in Sichuan-Yunnan region. The generalization of the model was tested using data from the BCC. The model was used to detect the recent moderate-to-strong earthquakes in CSES. The processing performance of the method on velocity and acceleration records, as well as the feasible application prospects in earthquake early warning in Chinese mainland, were analyzed.
2 Data
In this study, 3-component event waveforms above ML1.0 recorded from 2013 to 2019 by the seismic network in Sichuan-Yunnan region (Longitude: 96.0° to 109.0°E; Latitude: 21.0° to 35.0°N) were collected as training data, using 161,234 events recorded by 270 stations (Figure 1). The sampling rate is 100 Hz. There are a total of 497,303 waveforms. The magnitude distribution, epicentral distance, signal-to-noise ratio, and P-wave travel time curve statistics of the dataset are shown in Figure 2 and Figure 3. We divided the dataset (497, 303 event waveforms) into three groups: training set, validation set, and test set. Among them, the training set has 397,303 waveform data (about 80%), which is used for model training. The validation set has 50,000 (about 10%), which is used for model tuning and model selection. The test set has 50,000 (about 10%) for testing the model performance. PhaseNet (Zhu and Beroza, 2019) does not use noise data in the training set, which would make it possible to detect noise as earthquake. To improve the detection ability of the model, we added 78,000 noise data to the training dataset. The noise data is waveforms from 35 s to 5 s before the arrival of the P-wave of the earthquake. Some waveforms containing earthquakes are excluded based on the earthquake catalog and theoretical arrival times.
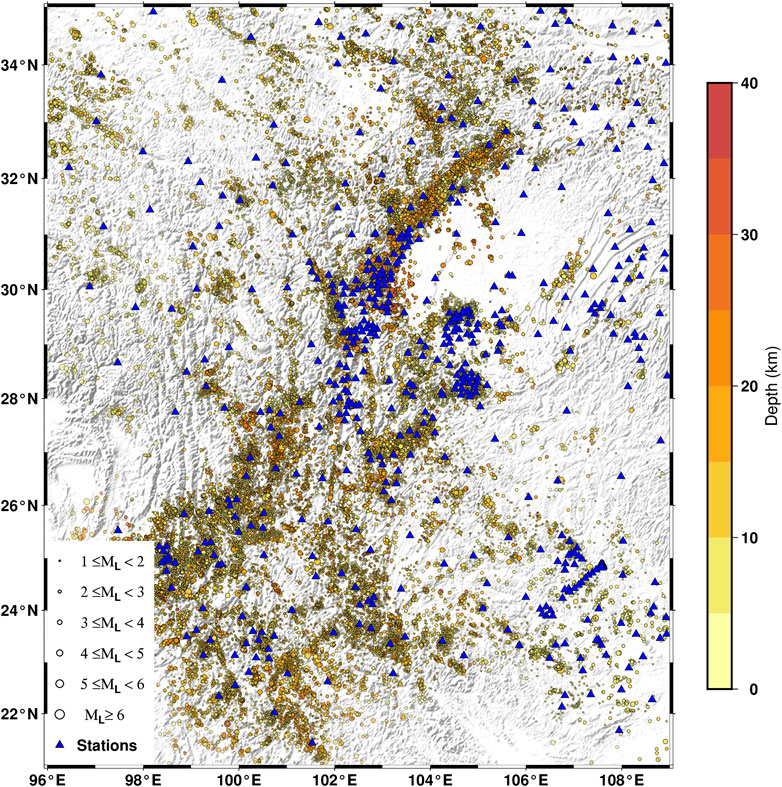
FIGURE 1. Distribution of seismic stations and earthquake epicenters in Sichuan-Yunnan region.
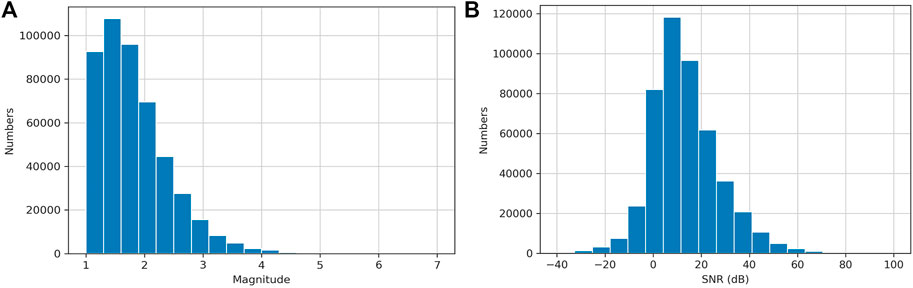
FIGURE 2. Magnitude distribution of the training set (A), signal-to-noise ratio distribution of the training set (B).
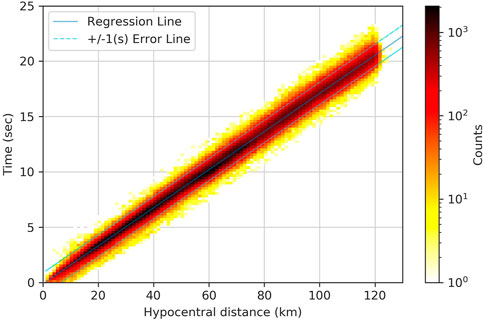
FIGURE 3. P-wave travel time curve of the training set.
Since earthquake location and early warning mainly use relatively close stations, we only select waveforms from stations within 120 km epicentral distance, corresponding to an S-P travel time difference of about 15 s (Figure 4). The training data are three-component waveform data. In order to include the complete P-wave train in the training data as much as possible, we select a 5 s window before the P-wave and a 25 s tail wave after the P-wave arrival time, for a total of 30 s waveform window. To reduce the sensitivity of the model to the P-wave arrival time and improve the generalization of the model, the starting point of the time window is randomly distributed 5 s before the P-wave arrival, and the length of the time window remains 30 s.
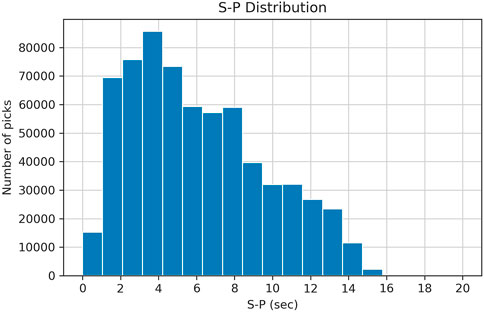
FIGURE 4. S—P time difference distribution.
The quality of the dataset, such as signal-to-noise ratio, epicentral distance, and label quality, has an important impact on the model performance (Zhang et al., 2016; Mousavi et al., 2020; Northcutt et al., 2021). To ensure the quality of the training set and the accuracy of P-wave arrivals, the datasets used in this paper all use the manually processed earthquake waveform and phase arrival information. To further screen the data, we use the theoretical travel time curves to filter out the data with large deviations (> 3 s) from the theoretical P-wave travel time. Figure 3 shows the filtered P-wave travel time curves.
In order to preserve as many of the original features of the P-wave as possible, the data is preprocessed by removing the mean and linear trend, and amplitude standardization. The amplitude is divided by the standard deviation of the data after removing the mean. The amplitude standardization process ensures that the waveform data of different magnitudes are in the same order of magnitude, reduces the influence of large variance data, and speeds up the convergence of the model during training.
3 Methods
3.1 Network model
The process of earthquake detection is similar to image recognition. While identifying earthquakes from continuous waveforms is similar to distinguishing the contours of a target in image vision, phase picking is similar to accurately locating the boundaries of this target (P-wave arrival time). However, unlike 2D/3D arrays for image processing, the earthquake waveforms to be detected are 1D time series data. We adopt the UNet++ network structure (Zhou et al., 2018) as the backbone network and modify it according to the characteristics of earthquake waveform data and earthquake phase arrival picking. It mainly includes: changing the input data from 2D to 1D; adding batch normalization (Batch Normalization, BN for short) to the network nodes to improve the training speed and accuracy of the model; replacing MaxPooling with a convolution of step size four (strided convolution for short) to improve the sensitivity of spatial location (Soomro et al., 2019); and using all convolution operations for the down sampling branch (convolution retains spatial information), which is different from the traditional convolution-activation-pooling operation (pooling corrupts spatial information in segmentation task), so it is more sensitive to the seismic phase position.
Figure 5 shows the structure of the modified network. The input is the 1D earthquake waveform data in three channels, and the output is the probability distribution function (pdf) of the P-wave in a single channel. The last layer of the network gives the probability of the P-wave by a sigmoid function with values between [0, 1]. According to the preset value of the threshold the, if it is greater than the (e.g., 0.5), it is considered as a P-wave. The peak of the pdf is chosen as the predicted arrival time of the P-wave. The other part with smaller pdf than the threshold is considered as “noise” (possibly real noise or S-wave).
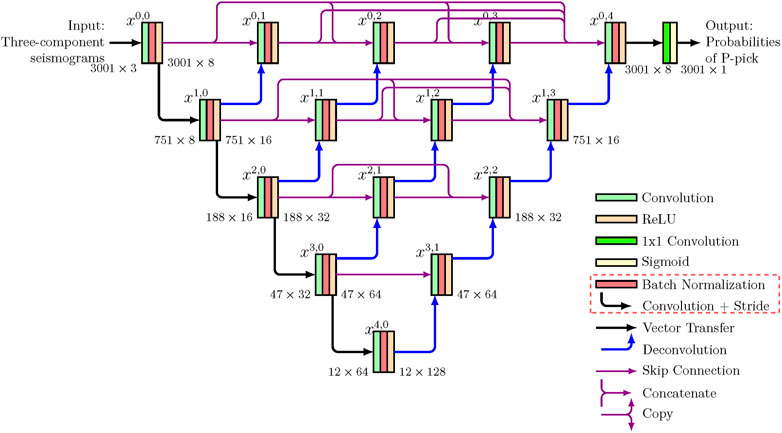
FIGURE 5. Structure of CSESnet earthquake detection network. The rectangular block indicates that operations such as convolution, batch normalization and activation functions that constitute the convolution block. The feature map is denoted by
The feature map in UNet++ networks can be expressed by the following equation:
Where,
3.2 Batch normalization processing
Previous studies (Ioffe and Szegedy, 2015; Ba et al., 2016; Ulyanov et al., 2016; Wu and He, 2018; Yao et al., 2021) have shown that Batch Normalization (BN) can accelerate the training speed of network models and improve model accuracy, which is a major breakthrough in the field of deep learning. There is no batch normalization layer in the original UNet++ network. To prevent the problems of slow gradient update and slow model convergence caused by uneven distribution of inputs in each hidden layer of the neural network, we add a batch normalization layer BN to the convolutional block (convolutional and non-linear activation layers) of the UNet++ network. Batch normalization can be expressed by Eqs 3–5. Eqs 3, 4 normalize the input features in the middle hidden layer of the network, so that each feature has a mean of 0 and a variance of 1. Eq. 5 is a linear transformation of the normalized data (Eqs 3, 4) to restore the expressiveness of the data itself.
Where
3.3 Label functions
The training model generally uses manually labeled P-wave arrival time information as label data. There are three types of arrival labels commonly used: rectangular (Zhao et al., 2019), triangular, and Gaussian distribution (Zhu and Beroza, 2019; Mousavi et al., 2020). In this study, the seismic phase arrival labels are represented by the truncated Gaussian probability distribution function (pdf) (Eq. 6), that is, the location of the manually picked P-wave seismic phase is the center of the Gaussian distribution (the point where the peak of the pdf is 1) at a set standard deviation σ of the Gaussian function (width of the Gaussian distribution). Different widths of the Gaussian distribution affect the arrival picking accuracy of the model.
3.4 Loss function
The design of the loss function is an important component of deep learning model training. UNet++ essentially classifies each sample point in the earthquake waveform (P-wave or noise). The sample points corresponding to the P-wave seismic phase are used as positive samples, which account for a small proportion of the sample points in the entire waveform time window. This imbalance of positive and negative samples can cause the loss function to be dominated by non-seismic phase sample points, and the model is not easily converged during training and insensitive to the judgment of seismic phase sample points. For this reason, we use a weighted cross-entropy loss function to solve the problem of positive and negative sample imbalance (Eq. 7).
Where BCE is balanced cross entropy;
3.5 Training model
We use the Adam optimizer to train the model on the training set. The learning rate adopts a dynamic adjustment strategy, and the initial learning rate is set to 0.01 and the learning rate is reduced by a factor of 0.1 every 20 epochs. Each model was trained for 100 epochs. Use the validation set to select hyperparameters for the training model, such as learning rate, batch size, and number of convolutional kernels. Finally, the training model consisting of the set of hyperparameters with the smallest value of the loss function was finally selected as the optimal model, and the β in the cross-entropy loss function was chosen as 5 after a series of tests. In the training, it was found that the batch size, the selection of the learning rate, and the selection of the σ value of the Gaussian distribution of the label function would affect the model performance.
4 Results and Discussion
4.1 Evaluation metrics
Model evaluation plays a very important role in the seismic phase picking algorithm. Only by choosing appropriate evaluation metrics that match the seismic phase picking problem, can the performance of different models be assessed objectively. The accuracy of the phase arrivals and the number of detections are the two main indicators both for traditional and deep learning methods. In the field of deep learning seismology, precision, recall and F1 score are three key metrics for evaluating the performance of each model. In this paper, we define precision (P), recall (R), F1-score (F1), mean error (μ), standard deviation (σ), mean absolute error (μabs), and standard deviation of absolute error (σabs) based on the error of predicting arrival time versus manually-picked arrival times.
Where, TP (true positive) is the number of picks which peak probability greater than 0.3 (positive picks) and the residuals between the predicted and the manual phases are less than 0.5 s (true picks). FP (false positive) is the number of picks which peak probability greater than threshold 0.3 and the residuals are larger than 0.5 s. FN (false negative) represents the number of picks (non-TP) that are not picked up. μ is an average calculated based on the difference between the predicted and manually picked phase arrival times. σ is the standard deviation of the difference between the predicted and manually picked phase arrival times. μabs is an average calculated from the absolute value of the difference between the predicted and manual picks. σabs is the standard deviation calculated from the absolute value of the difference between the predicted and manual picks.
4.2 Model improvement
The improvements to the original UNet++ network structure in this paper mainly include two aspects: adding BN and replacing the maximum pooling with strided convolution. In order to evaluate the improved effect, we conducted four tests (Table 1). Among them, the original UNet++ model has been improved to handle one-dimensional three-channel waveform data. The BN model adds a batch normalization layer (BN) to the original UNet++ model. The strided convolution model is adopted to replace the max pooling layer in the original UNet++ model with a strided convolution (with step size of 4). The BN+ strided convolution model adds a batch normalization layer (BN) to the original UNet++ model and replaces the maximum pooling layer with a step size convolution.
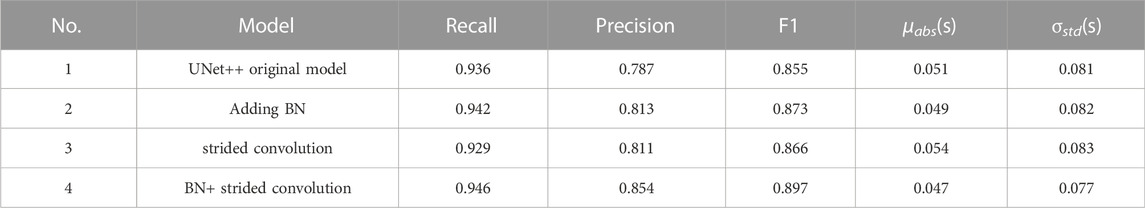
TABLE 1. Performance comparison after different improvements.
The four models are trained with the same dataset, the same network configuration (loss function and optimization algorithm), and the same hyperparameters (learning rate, number of batches, training epoch, etc.). As can be seen in Table 1, with the addition of the batch normalization layer (BN) and the replacement of the strided convolution to the final model, the recall rate (R) is improved by only 1%, but the precision (P) is improved significantly, about 7%. The mean (μabs) and standard deviation (σabs) are reduced by 1%. The experimental results show that the improvements, such as batch normalization and strided convolution replacement, can improve the precision of the seismic phase and reduce false pick (FP).
4.3 Label function
The picking accuracy of the seismic phase arrival time is related to the signal-to-noise ratio of the waveform, the type of seismic phase and the dominant frequency. Generally, P-wave seismic phase pickup error is less than S-wave, and high frequency signal pick up error is lower than low frequency signal. Optimizing the labeling of the arrival time can further improve the accuracy of arrival detection. At present, U-net-based seismic phase picking models mostly use Gaussian distribution functions in labeling the arrivals of training samples, such as PhaseNet (Zhu and Beroza, 2019), APP and APP++ (Liu et al., 2020; Jiang et al., 2021), and ARRU-Net (Liao et al., 2021). However, previous studies did not discuss in detail the effect of label width on precision and recall. The seismic phase arrival time is represented by Gaussian distribution, which is actually a regularization technique for label smoothing. Follow Zhu et al. (2019) and Liao et al. (2021), a truncated Gaussian distribution function representation is used in this study. We tested different window lengths of the Gaussian distribution function (0.1 s, 0.15 s, 0.2 s, 0.3 s, and 0.4 s, Figure 6A), and generated training label datasets according to different window lengths. Model training is performed on different labeled datasets. The same test dataset is used to evaluate the effect of the window length (standard deviation σ) of the Gaussian distribution function on model performance.
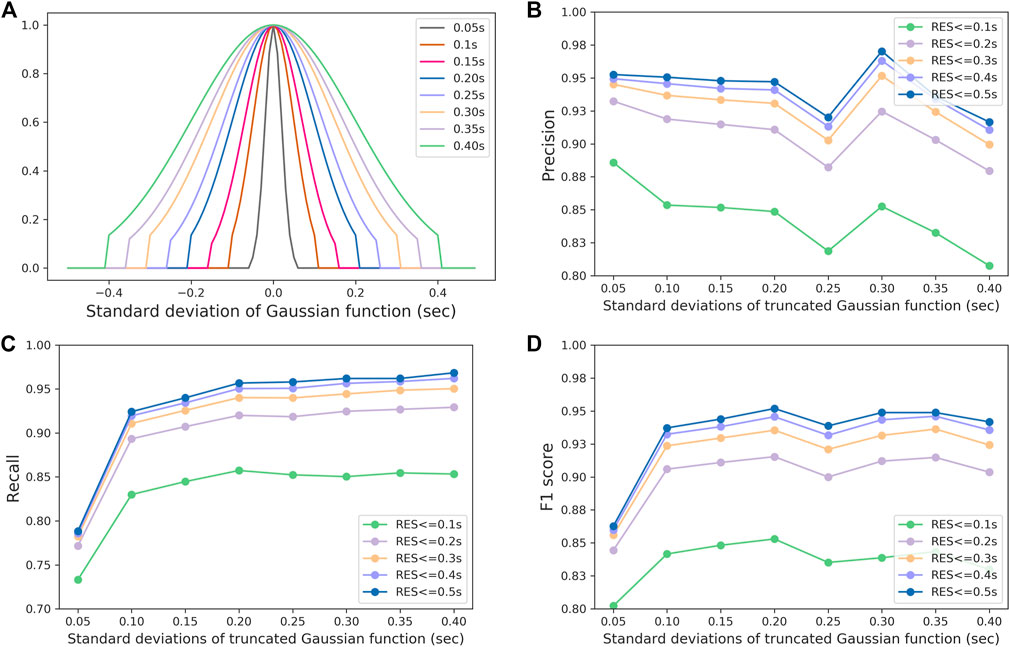
FIGURE 6. Labeling functions with different truncated Gaussian distribution widths (standard deviations) and their effects on the performance of the training model. Illustration of different truncated Gaussian distribution window lengths (A). Effect of truncated Gaussian window width on precision (B). Effect of truncated Gaussian window width on recall (C). Effect of truncated Gaussian window width on F1 score (D). RES in the figure indicates the absolute value of the residuals of predicted and manual picks.
To fully test the effect of this parameter on the model, we set the residuals of predicted and manual picks to five intervals of [−0.1, 0.1]s, [−0.2, 0.2]s, [−0.3, 0.3]s, [−0.4, 0.4]s, and [−0.5, 0.5]s to evaluate the changes in precision, recall, and F1-score. As can be seen from Figure 6, as the window length of the Gaussian distribution function increases, the precision changes slightly, and the recall is gradually increasing and then decreasing. At 0.4 s length, the precision decreases sharply [from 95% to 92%, RES (residual) = 0.5]. When the Gaussian window length was 0.2 s, the recall reached 95%. The experimental results show that the variations in precision, recall and F1-score can be up to 11% when using different window lengths. When the window length is 0.2 s, the training model had the best evaluation metrics and the highest F1-score. Liao et al. (2021) also got similar conclusions.
4.4 Test results
We use a test set to evaluate the performance of the CSESnet model. The test set is composed of 50,000 randomly selected earthquake waveforms from the 2013–2019 dataset, which does not include in the training set. The test results of the CSESnet are shown in Table 2. The model predicted 59,195 P-wave phases. In addition to P, R, F1, μ, σ, μabs, and σabs, we also use the picking rate as a quantitative metric to directly test the percentage of predicted seismic phases in a certain picking error. The picking rate is defined as the number of true positive picks divided by manually picked phases in [−0.2, 0.2]s. On the test set, the picking error in [−0.2, 0.2]s was 44,316, with a picking rate of 88.6%. Figure 7 shows the picking error (Tpred-Tmanual) distribution of the arrival times automatically picked by the CSESnet model and manually labeled phase. As seen in Table 2, the recall (R) is significantly higher than the precision (P), and the model is less likely to miss the manual picks, which is also in line with the initial expectation of our model—to improve the recall rate. In the seismic phase picking stage, trying to detect as many phases as possible within a reasonable range without missing the phases, because it is difficult to automatically complete the missed phases in the subsequent processing, but the detected phases can be eliminated by phase association.
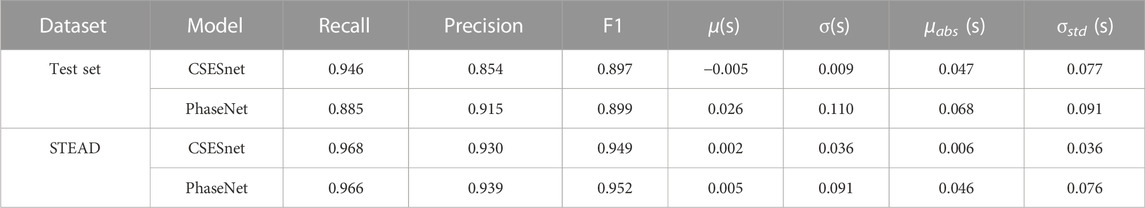
TABLE 2. P-wave picking performance of CSESnet and PhaseNet on test set and STEAD.
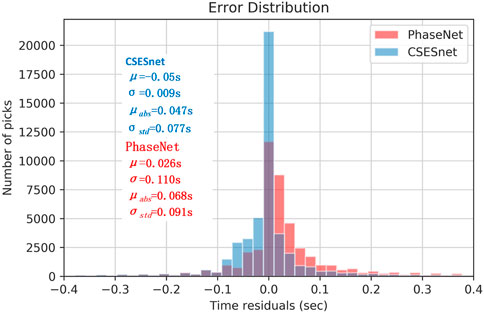
FIGURE 7. Error distribution of predicted versus manually picked phases for CSESnet and PhaseNet on the test set. The histogram indicates the distribution of the arrival pickup error Tpred-Tmanual of the CSESnet and PhaseNet on the test set.
4.5 Model generalization in BCC
In order to evaluate the generalization ability of the CSESnet, we selected the Beijing Capital Circle (BCC) as the test area. The geological structure of the BCC is completely different from that of Sichuan-Yunnan region. This region has thick deposit basin and its seismic waveforms differ from those in Sichuan-Yunnan region. We selected 36,000 waveform data from the BCC from 2018 to 2021 for test and compared the detection performance of CSESnet and PhaseNet. The magnitude distribution of the test data in BCC was ML1.0 to 4.0. It can be seen in Table 3 that the recall of CSESnet has a slightly drop (about 3%) and a relatively large reduction in precision (about 10%) when used in BCC. It shows that even if the area is changed, CSESnet can ensure that the seismic phases are detected with low missing rate (the ratio of missed detections and ground truth). In contrast, the recall of PhaseNet in BCC is 79%. Compared with the test results in Northern California (Zhu and Beroza, 2019), the recall dropped from 96% to 79%. It indicates that it may miss a large number of earthquakes if PhaseNet is directly applied to BCC. Figure 8 shows the distribution of the picking error (Tpred-Tmanual) between the prediction and manual picking of the two models on the test set of the BCC. Among them, within the time error range of [−0.2, 0.2]s, our model picks up 31,666 P-wave seismic phase data, with a picking rate of 87%, while PhaseNet picks up 26,947 P-wave seismic phases, with a picking rate of 74%. This indicates that the seismic phase picked by the CSESnet is more accurate than PhaseNet.
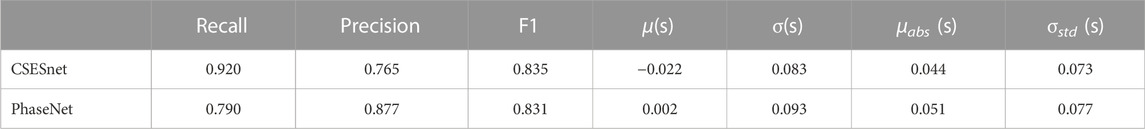
TABLE 3. Comparison of the performances of CSESnet and PhaseNet in BCC.

FIGURE 8. Comparison of the prediction results of CSESnet and PhaseNet in BCC. The blue bars indicate the distribution of the arrival picking error Tpred-Tmanual of the CSESnet. The red bars indicate the distribution of the arrival picking error of PhaseNet on the same dataset.
4.6 Application in Luxian M6.0 earthquake
At present, most of the earthquake detection models are mainly tested with micro and small earthquakes. There are few researches focusing on the detection of moderate and strong earthquakes. If these deep learning models can be used for large earthquakes, and the picking accuracy is high, then they will have extensive applications in the earthquake early warning systems, i.e., they can reduce the false triggering of EEW, improve the arrival picking accuracy, and then improve the precision of earthquake location.
In order to test the effectiveness and generalization of CSESnet, especially for the detection of moderate and strong earthquakes and whether it can be used for detection of earthquake signals recorded by different instruments (e.g., velocity and acceleration records), we selected the Luxian M6.0 earthquake that occurred on 16 September 2021 in Sichuan Province as an example. This earthquake is a strong earthquake that has occurred in CSES in recent years, and was recorded very well by the surrounding densely distributed broadband and acceleration seismic stations. We used CSESnet and PhaseNet to detect the waveforms of the Luxian earthquake and compared their performances.
The stations within 120 km epicentral distance have two types of sensors, such as broadband seismometers and accelerometers. Among them, there are 24 broadband seismometers and 63 accelerometers. The test results are shown in Table 4. Within the time error range of [−0.2, 0.2]s, CSESnet picks up 73 P-wave seismic phase data, with a picking rate of 83.9%. While PhaseNet picks up 56 P-wave seismic phases, with a picking rate of 64.3%.
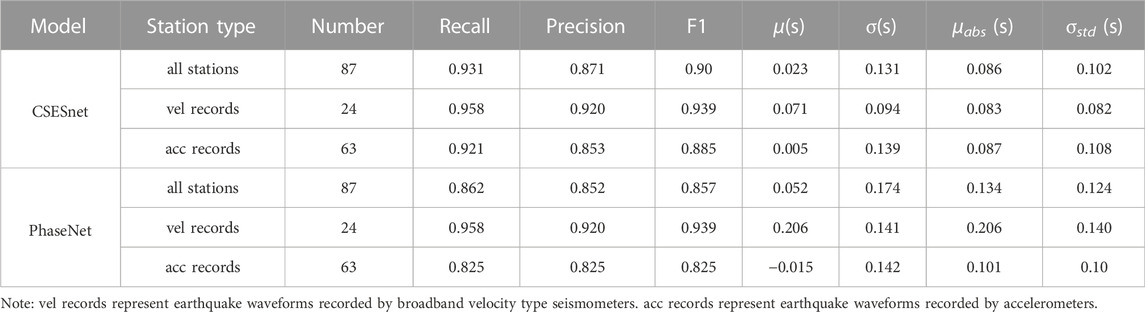
TABLE 4. Comparison of the performances of CSESnet and PhaseNet with Luxian M6.0 earthquake data.
In the detection of all stations, the recall rate of CSESnet is about 7% higher than that of PhaseNet, and its precision is about 2% higher, lower mean value and standard deviation (Table 4). Although CSESnet only uses broadband velocity waveforms during training, the detection performance on acceleration waveforms is also good. The index, such as precision, recall and F1-score are higher than those of the PhaseNet by about 3%–10%. Although the training data of PhaseNet contains a variety of instruments, such as high broadband (HH), broadband (BH), short-period (EH) velocity waveforms and high-gain (HN) acceleration waveforms (Zhu and Beroza, 2019), while CSESnet was trained with pure broadband waveform data, also achieved high performance metrics. This shows that CSESnet has good generalization for different instrument types, and can be used for processing acceleration waveforms. About 84% of the seismic stations in CSES are accelerometer stations. CSESnet provides a new algorithm for P-wave detection in CSES.
5 Conclusion
In this paper, we trained an earthquake detection model-CSESnet with 490,000 earthquake waveform data and 78,000 noise waveform data from 2013 to 2019 in Sichuan-Yunnan region with improved UNet++. We tested and compared the performance of CSESnet with PhaseNet. CSESnet shows higher recall and better generalization than PhaseNet. CSESnet can detect both small and strong earthquakes, as well as processing waveforms recorded by acceleration and MEMS instruments. CSESnet can accurately identify P-waves and pick precise arrival times. These advantages suggest that CSESnet can be adopted in earthquake early warning systems after extensive tests.
CSESnet doesn’t adopt a fully connected layer and can process waveforms less than 30 s. It can be used not only for real-time detection of short-time windows, but also for detection of long-time windows or continuous waveforms.
In the follow-up work, we will further improve the network structure so that it can detect both P- and S-waves simultaneously. We will further reduce the false detection rate and improve the generalization ability of the current model by adding more abundant noise datasets, waveform records of accelerometers and MEMS waveforms.
Data availability statement
Waveform data used in this study are provided by Data Management Centre of China National Seismic Network at Institute of Geophysics, China Earthquake Administration. The earthquake bulletins were obtained from the China Earthquake Networks Center. The figures in the paper are plotted using GMT 6.0 (Generic Mapping Tools) and the Python Matplotlib library (https://matplotlib.orghttps://matplotlib.org). The CSESnet model can be obtained at https://github.com/borenli08/CSESnet.
Author contributions
BL designed the method and programmed the codes; all authors participated in writing, revising, and approving the final manuscript.
Funding
This work was funded by the National Key R & D Program of China (2021YFC3000702), the Natural Science Foundation of China (U2139205) and the Special Fund for Basic Research Operations of the Institute of Geophysics, China Earthquake Administration (DQJB22Z01 and DQJB22X08).
Acknowledgments
Thanks to the Data Management Centre of China National Seismic Network for preparing the waveform data and the China Earthquake Networks Center for providing earthquake bulletin data. Thanks to Yijian Zhou of the University of California, Riverside for valuable discussions on this article. The CSESnet is developed on the Keras framework (https://keras.io).
Conflict of interest
The authors declare that the research was conducted in the absence of any commercial or financial relationships that could be construed as a potential conflict of interest.
Publisher’s note
All claims expressed in this article are solely those of the authors and do not necessarily represent those of their affiliated organizations, or those of the publisher, the editors and the reviewers. Any product that may be evaluated in this article, or claim that may be made by its manufacturer, is not guaranteed or endorsed by the publisher.
References
Allen, R. V. (1978). Automatic earthquake recognition and timing from single traces. Bull. Seismol. Soc. Am. 68, 1521–1532. doi:10.1785/bssa0680051521
Ba, J. L., Kiros, J. R., and Hinton, G. E. (2016). Layer normalization. https://arxiv.org/abs/1607.06450. doi:10.48550/arXiv.1607.06450
Dai, G., Miao, C., and Zhai, L. (2019). Unified earthquake cataloging of China seismographic network. Earthq. Res. China 35, 192–203. doi:10.3969/j.issn.1001-4683.2019.01.018
Di Stefano, R., Aldersons, F., Kissling, E., Baccheschi, P., Chiarabba, C., and Giardini, D. (2006). Automatic seismic phase picking and consistent observation error assessment: Application to the Italian seismicity. Geophys. J. Int. 165, 121–134. doi:10.1111/j.1365-246X.2005.02799.x
Husen, S., Diehl, T., and Kissling, E. (2009). The effects of data quality in local earthquake tomography: Application to the Alpine region. GEOPHYSICS 74, WCB71-WCB79. doi:10.1190/1.3237117
Ioffe, S., and Szegedy, C. (2015). Batch normalization: Accelerating deep network training by reducing internal covariate shift, Proceedings of the 32nd International Conference on Machine Learning (PMLR), 448–456. Lille France, July 2015, Available at: https://proceedings.mlr.press/v37/ioffe15.html [Accessed January 20, 2022].
Jiang, C., Fang, L., Fan, L., and Li, B. (2021). Comparison of the earthquake detection abilities of PhaseNet and EQTransformer with the Yangbi and Maduo earthquakes. Earthq. Sci. 34, 425–435. doi:10.29382/eqs-2021-0038
Jiang, Y., Ning, J., and Li, C. (2021). Automatic seismic phase picking method APP++ based on deep learning and array strategy and its application in sichuan-yunnan region. North China Earthq. Sci. 39, 1–9. doi:10.3969/j.issn.1003
Lei, J. S. (2000). Brief analysis on study development for the traval time tomography of body wave in China region. Northwest. Seismol. J. 22, 471–474.
Lei, X., Wang, Z., and Su, J. (2019). The december 2018 ML 5.7 and january 2019 ML 5.3 earthquakes in south sichuan basin induced by shale gas hydraulic fracturing. Seismol. Res. Lett. 90, 1099–1110. doi:10.1785/0220190029
Leonard, M., and Kennett, B. L. N. (1999). Multi-component autoregressive techniques for the analysis of seismograms. Phys. Earth Planet. Interiors 113, 247–263. doi:10.1016/S0031-9201(99)00054-0
Li, Z., Meier, M. A., Hauksson, E., Zhan, Z., and Andrews, J. (2018). Machine learning seismic wave discrimination: Application to earthquake early warning. Geophys. Res. Lett. 45, 4773–4779, doi:10.1029/2018gl077870
Liao, W., Lee, E., Mu, D., Chen, P., and Rau, R. (2021). ARRU phase picker: Attention recurrent-residual U-net for picking seismic P- and S-phase arrivals. Seismol. Res. Lett. 92, 2410–2428. doi:10.1785/0220200382
Liao, W. Y., Lee, E. J., Chen, D. Y., Chen, P., Mu, D., and Wu, Y. M. (2022). RED-PAN: Real-time earthquake detection and phase-picking with multi-task attention network. IEEE Trans. Geosci. Remote Sens., 1, 1, 11, –1. doi:10.1109/TGRS.2022.3205558
Liu, F., Jiang, Y., Ning, J., Zhang, J., and Zhao, Y. (2020). An array-assisted deep learning approach to seismic phase-picking. Chin. Sci. Bull. 65, 1016–1026. doi:10.1360/TB-2019-0608
Lomax, A., Michelini, A., and Curtis, A. (2009). Earthquake location, direct, global-search methods. Encycl. Complex. Syst. Sci., 2449–2473. doi:10.1007/978-0-387-30440-3_150
Ma, Q., Jin, X., Li, S. Y., Chen, F. W., Liao, S. R., and Wei, Y.-X. (2013). Automatic P-arrival detection for earthquake early warning. Chin. J. Geophys. 56, 2313–2321. doi:10.6038/cjg20130718
Mousavi, S. M., Ellsworth, W. L., Zhu, W., Chuang, L. Y., and Beroza, G. C. (2020). Earthquake transformer—An attentive deep-learning model for simultaneous earthquake detection and phase picking. Nat. Commun. 11, 3952. doi:10.1038/s41467-020-17591-w
Northcutt, C., Jiang, L., and Chuang, I. (2021). Confident learning: Estimating uncertainty in dataset labels. J. Artif. Intell. Res. 70, 1373–1411. doi:10.1613/jair.1.12125
Peng, C., Jiang, P., Ma, Q., Wu, P., Su, J., Zheng, Y., et al. (2021). Performance evaluation of an earthquake early warning system in the 2019–2020 M6.0 changning, sichuan, China, seismic sequence. Front. Earth Sci. 9, 1–13. doi:10.3389/feart.2021.699941
Ronneberger, O., Fischer, P., and Brox, T. (2015). U-Net: Convolutional networks for biomedical image segmentation. in Medical image Computing and computer-assisted intervention – MICCAI 2015 lecture notes in computer science., eds. N. Navab, J. Hornegger, W. M. Wells, and A. F. Frangi (Cham: Springer International Publishing), 234–241. doi:10.1007/978-3-319-24574-4_28
Tian, Y., Zhao, D., Liu, C., and Teng, J (2009). A review of body-wave tomography and its applications to studying the crust and mantle structure in China. Earth Sci. Front. 16, 347–360. doi:10.3321/j.issn:1005-2321.2009.02.026
Ulyanov, D., Vedaldi, A., and Lempitsky, V. (2016). Instance normalization: The missing ingredient for fast stylization. https://arxiv.org/abs/1607.08022.
Wen, X. (2018). The 2008 Wenchuan, 2013 Lushan and 2017 Jiuzhaigou earthquakes, Sichuan, in the last more than one thousand years of rupture history of the eastern margin of the Bayan Har block. Acta Seismol. Sin. 40, 255–267. doi:10.11939/jass.20170211
Wenzel, F., and Zschau, J. (2014). Early warning for geological disasters: Scientific methods and current practice. Springer, Berlin Heidelberg Available at: http://books.google.com.hk/books?id=NcZFngEACAAJ.
Wu, Y., and He, K. (2018). Group normalization. in, 3–19. Available at: https://openaccess.thecvf.com/content_ECCV_2018/html/Yuxin_Wu_Group_Normalization_ECCV_2018_paper.html [Accessed March 29, 2022].
Wu, Y. M., and Lin, T. L. (2014). “A test of earthquake early warning system using low cost accelerometer in hualien, taiwan,” in Early warning for geological disasters advanced technologies in Earth sciences., eds. F. Wenzel, and J. Zschau (Springer, Berlin Heidelberg), 253–261. Available at: http://link.springer.com/chapter/10.1007/978-3-642-12233-0_13 [Accessed October 25, 2014].
Yao, Z., Cao, Y., Zheng, S., Huang, G., and Lin, S. (2021). Cross-iteration batch normalization. in, 12331–12340. Available at: https://openaccess.thecvf.com/content/CVPR2021/html/Yao_Cross-Iteration_Batch_Normalization_CVPR_2021_paper.html [Accessed March 29, 2022].
Yi, G. X., Wen, X. Z., and Xu, X.-W. (2002). Study on recurrence behaviors of strong earthquakes for several entireties of active fault zones in Sichuan-Yunnan region. Earthq. Res. China 18, 267–276. doi:10.3969/j.issn.1001-4683.2002.03.006
Zhang, J., Wu, X., and Sheng, V. S. (2016). Learning from crowdsourced labeled data: A survey. Artif. Intell. Rev. 46, 543–576. doi:10.1007/s10462-016-9491-9
Zhang, X., Zhang, M., and Tian, X. (2021). Real-time earthquake early warning with deep learning: Application to the 2016 M 6.0 central apennines, Italy earthquake. Geophys. Res. Lett. 48, 1–10. doi:10.1029/2020GL089394
Zhao, M., Chen, S., Fang, L., and Yuen, D. A. (2019). Earthquake phase arrival auto-picking based on U-shaped convolutional neural network. Chin. J. Geophys. 62, 3034–3042. doi:10.6038/cjg2019M0495
Zhou, Z., Rahman Siddiquee, M. M., Tajbakhsh, N., and Liang, J. (2018). UNet++: A nested U-net architecture for medical image segmentation. in Deep learning in medical image analysis and multimodal learning for clinical decision support lecture notes in computer science., eds. D. Stoyanov, Z. Taylor, G. Carneiro, T. Syeda-Mahmood, A. Martel, L. Maier-Heinet al. (Cham: Springer International Publishing), 3–11. doi:10.1007/978-3-030-00889-5_1
Keywords: earthquake detection, phase picking, earthquake early warning, Unet++, China Seismic Experimental Site (CSES)
Citation: Li B, Fan L, Jiang C, Liao S and Fang L (2023) CSESnet: A deep learning P-wave detection model based on UNet++ designed for China Seismic Experimental Site. Front. Earth Sci. 10:1032839. doi: 10.3389/feart.2022.1032839
Received: 31 August 2022; Accepted: 29 November 2022;
Published: 13 January 2023.
Edited by:
Zefeng Li, University of Science and Technology of China, ChinaReviewed by:
Wuyu Liao, National Cheng Kung University, TaiwanXiong Zhang, East China University of Technology, China
Copyright © 2023 Li, Fan, Jiang, Liao and Fang. This is an open-access article distributed under the terms of the Creative Commons Attribution License (CC BY). The use, distribution or reproduction in other forums is permitted, provided the original author(s) and the copyright owner(s) are credited and that the original publication in this journal is cited, in accordance with accepted academic practice. No use, distribution or reproduction is permitted which does not comply with these terms.
*Correspondence: Shirong Liao, bGlhb3NoaXJvbmdAZmplYS5nb3YuY24=; Lihua Fang, ZmxoQGNlYS1pZ3AuYWMuY24=