- 1School of Environmental Science and Engineering, Yancheng Institute of Technology, Yancheng, China
- 2Laboratory for Climate Studies, National Climate Center, China Meteorological Administration, Beijing, China
- 3College of Physical Science and Technology, Yangzhou University, Yangzhou, China
- 4Southern Marine Science and Engineering Guangdong Laboratory (Zhuhai), Zhuhai, China
During the “Dragon Boat Water” season in 2022, record-breaking anomalous rainfall occurred over South China (SC). In this study, the causes of anomalous rainfall are investigated by using the novel moisture budget equation of three-pattern circulations. The results show that the anomalous rainfall over SC caused by the horizontal, meridional, and zonal circulations was −10 mm, 168 mm, and 45.3 mm, which contribute −5%, 86%, and 23% of the actual rainfall anomaly (195.1 mm), respectively, suggesting that the meridional circulation contributes most to anomalous rainfall, followed by zonal circulation, and horizontal circulation contributes negatively. Further analysis based on the three-pattern decomposition of the global atmospheric circulation shows that the spatial configuration of the anomalous horizontal circulation and vertical vorticity provides the background for generating the anomalous divergence and convergence of meridional and zonal circulations and further anomalous vertical velocity of the meridional and zonal circulations, ultimately resulting in anomalous rainfall.
1 Introduction
South China (SC) is located in the southernmost region of China, which comprises the southern region of the Yangtze River basin and the eastern region of the Tibetan Plateau; it includes the Guangdong, Guangxi, Hainan, and Fujian Provinces and their surrounding areas. SC has abundant rainfall that is characterized by a large annual mean value, high frequency of rainstorms, and long duration (Zhai and Eskridge, 1997; Yuan et al., 2010; Chu et al., 2018; Miao et al., 2019; Chu et al., 2020). According to the differences in influencing factors and time periods, the flood season of SC can be divided into two periods (Ramage, 1952; Yang and Sun, 2005; Yuan et al., 2019). The first flood season is generally called the “first rainy season” or “early rainy season” of China, which occurs from April to June. The second flood season is generally called the “second rainy season” or “late rainy season” of China, which occurs from July to September. In the first rainy season, the rainfall in SC is mainly influenced by monsoon circulations, including the subtropical jet, western Pacific subtropical high, South Asia high, and low-level southwest jet in the subtropics and the East Asian trough and northeastern cold vortex in the mid–high latitudes (Yuan et al., 2012; Li et al., 2018; Miao et al., 2019; Liu et al., 2022). In the second rainy season, the rainfall in SC is mainly influenced by typhoons or tropical depressions (Lee et al., 2010; Yuan et al., 2019).
During the first rainy season, there is a special time period called the “Dragon Boat Water” rainfall season. The name “Dragon Boat Water” rainfall season originates from 21 May to 20 June, which includes the Chinese Dragon Boat Festival (Lin et al., 2009; Gu and Zhang, 2012; Qian et al., 2020). During the “Dragon Boat Water” rainfall season, the rainfall is concentrated and generally accompanied by thunderstorms over SC. Climatically, the regionally averaged rainfall during the “Dragon Boat Water” season over SC (106°E–120°E, 23°N–28°N) is 322.3 mm (Figures 1B,D). In 2022, an extreme “Dragon Boat Water” rainfall occurred, with the regionally averaged rainfall reaching 517.5 mm, which is 1.6 times the climatological mean value and represents the highest record since 1979 (Figures 1A–D). Since extreme rainfall can lead to great socioeconomic losses, crop destruction, and casualties (Qiao et al., 2021), thus, the primary causes of the extreme rainfall during the “Dragon Boat Water” season should be studied. In addition to the record-breaking “Dragon Boat Water” rainfall, the zonal negative rainfall anomaly belt in the north and south of SC, the zonal positive rainfall anomaly belt in the Southern Hemisphere, and the negative rainfall anomaly in the east of the Malay Archipelago can be observed (Figure 1C). Further correlation analysis (Figure 1E) suggests that the anomalous “Dragon Boat Water” rainfall over SC is generally accompanied by the anomalous rainfall shown in Figure 1C, implying that the same anomalous atmospheric circulation system caused the anomalous rainfall in 2022 shown in Figure 1C.
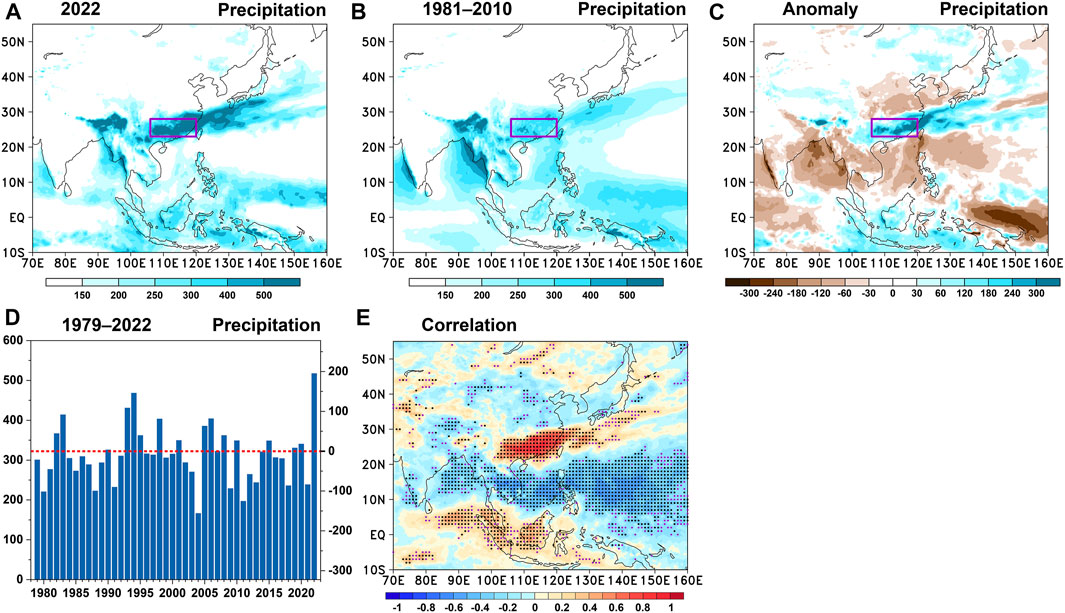
FIGURE 1. (A) Distribution of the accumulated rainfall during the “Dragon Boat Water” season (21 May to 20 June) in 2022; (B) and (C) are the same as (A) but for the climatological rainfall during 1981–2010 and the rainfall anomaly in 2022, respectively. The rainfall anomaly is calculated by subtracting the climatological rainfall during 1981–2010. The purple box in (A–C) represents the region of South China (SC; 106°E–120°E, 23°N–28°N). (D) Time series of the regionally averaged rainfall over SC during 1979–2022. The Y-axis on the left (right) represents the rainfall (rainfall anomaly). The red dashed line represents the climatological rainfall (zero line of rainfall anomaly) for the Y-axis on the left (right). (E) Correlation between the regionally averaged rainfall anomaly over SC and the rainfall anomaly during 1979–2022. Black (purple) dots over the shading represent that those correlation coefficients are significant above the 95% (90%) confidence level based on Student’s t test. Units of the rainfall and rainfall anomaly are mm.
According to previous studies (Seager et al., 2010; Han et al., 2021), the moisture budget equation can be used to investigate the relative contributions of anomalous atmospheric circulation (dynamic term) and anomalous moisture (thermodynamic term) to anomalous rainfall. Additionally, a novel decomposition of atmospheric circulation, which is called the three-pattern decomposition of global atmospheric circulation (3P-DGAC), can be used to explore anomalous atmospheric circulation (Liu et al., 2008; Hu et al., 2017; Hu et al., 2018a; Hu et al., 2018b; Hu et al., 2020). However, the quantitative contribution of the three-pattern circulations (i.e., horizontal, meridional, and zonal circulations) to anomalous rainfall cannot be obtained using the 3P-DGAC method. To solve this issue, Han et al. (2021) and Cheng et al. (2022) developed a novel moisture budget equation of the three-pattern circulations by incorporating the 3P-DGAC method into the moisture budget equation. Namely, the rainfall anomaly can be linked up with three-pattern circulations by using the novel moisture budget equation. By using the novel moisture budget equation, Cheng et al. (2022) studied the extreme rainfall in Henan Province in July 2021 and found that zonal circulation played the dominant role in causing this anomalous rainfall. In this study, the novel moisture budget equation of three-pattern circulations is adopted to investigate the relative contribution of the three-pattern circulations to the record-breaking “Dragon Boat Water” rainfall over SC in 2022.
This study is organized as follows. The study area, datasets, and methods used are described in Section 2. The quantitative contribution of the three-pattern circulations to anomalous rainfall is investigated using the novel moisture budget equation in Section 3. The anomalous three-pattern circulations and underlying mechanism are studied in Section 4. Finally, the summary and conclusion are given in Section 5.
2 Materials and methods
2.1 Study area
According to the spatial pattern of the anomalous rainfall during the “Dragon Boat Water” season in 2022 (Figure 1C), the study area of the SC in the present study is defined as (106°E–120°E, 23°N–28°N), which is shown as a purple box in Figure 1.
2.2 Source of data
The hourly rainfall, specific humidity, surface pressure, zonal wind, meridional wind, and vertical velocity from the European Center for Medium Range Weather Forecasts Reanalysis 5 (ERA5) (Hersbach et al., 2020) are used for the investigation in this study. The original horizontal resolution of these datasets is
2.3 Novel moisture budget equation of three-pattern circulations
Based on the moisture budget equation (Seager et al., 2010; Han et al., 2021) and the 3P-DGAC method (Liu et al., 2008; Hu et al., 2017; Hu et al., 2018a; Hu et al., 2018b; Cheng et al., 2018; Hu et al., 2020), Han et al. (2021) and Cheng et al. (2022) developed a novel moisture budget equation of three-pattern circulations as follows:
where
Since the novel moisture budget equation can be written as
where
where
In the process of calculation, the
3 Quantitative contribution of the three-pattern circulations to anomalous rainfall
Figure 2A displays the spatial distribution of the anomalous rainfall caused by the combined effects of horizontal, meridional, and zonal circulations (i.e.,
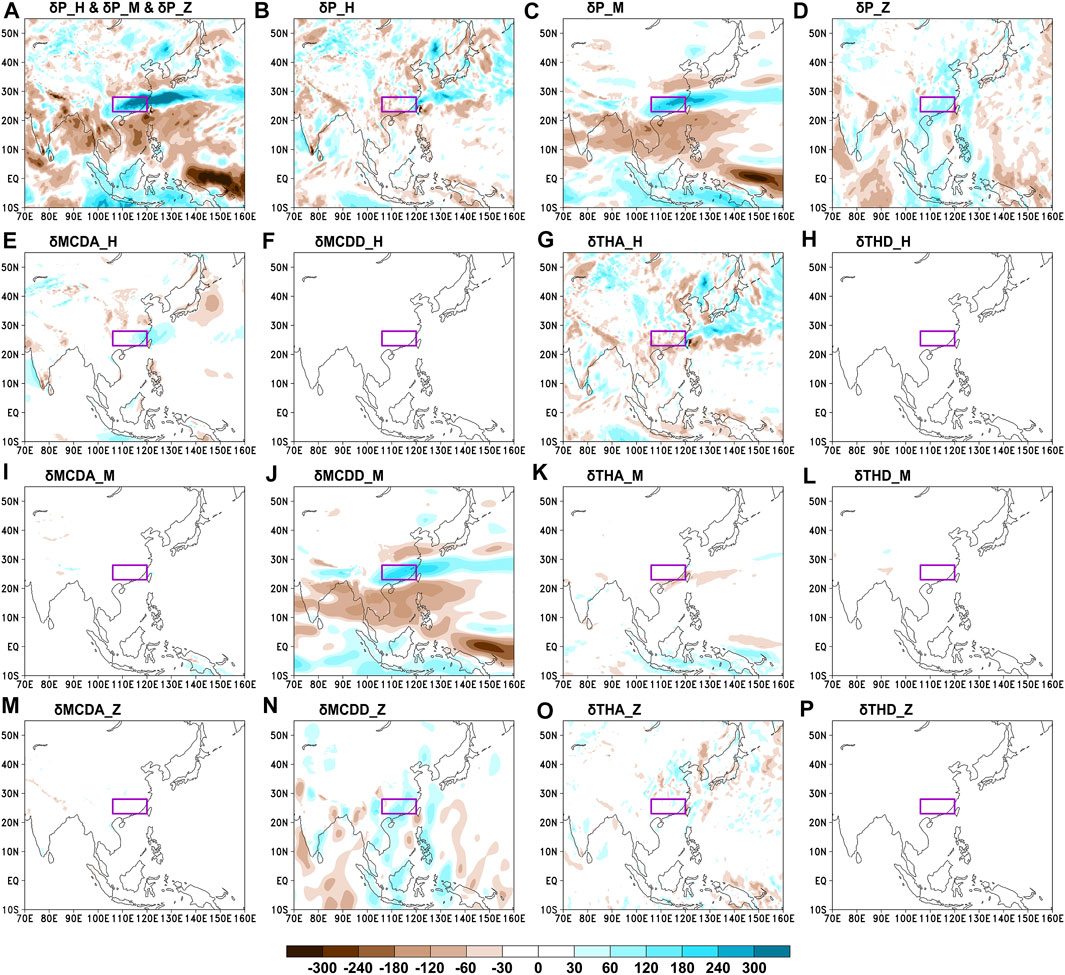
FIGURE 2. (A) Anomalous rainfall caused by the combined effects of horizontal (
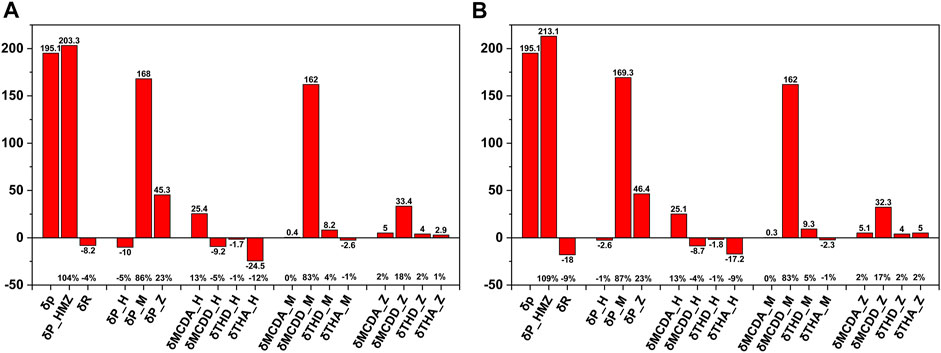
FIGURE 3. (A) Regionally averaged rainfall anomaly (
Figures 2B–D show the anomalous rainfall caused by the horizontal, meridional, and zonal circulations, respectively. By comparing Figures 2A,C, it can be observed that the anomalous rainfall caused by the meridional circulation is similar to that caused by the three-pattern circulations, and the spatial similarity coefficient between Figures 2A,C is 0.82. Additionally, by comparing Figures 2B–D, it can be observed that the meridional circulation contributes most to the anomalous rainfall, followed by zonal circulation, and the contribution of the horizontal circulation is the least, implying that the meridional circulation plays the dominant role in the anomalous rainfall. The quantitative anomalous rainfall over SC caused by the horizontal, meridional, and zonal circulations is −10 mm, 168 mm, and 45.3 mm, which contribute −5%, 86%, and 23% of the actual rainfall anomaly, respectively (Figure 3A).
Figures 2E–H show the anomalous rainfall caused by the change in advection (
Figure 2I–L show the anomalous rainfall caused by
Figures 2M–P show the anomalous rainfall caused by
Since the moisture mainly exists below 500 hPa (Supplementary Figure S1), the results where the upper limit of vertical integration of Eq. 3 changes to 500 hPa are similar to those obtained from Eq. 3 (comparing Figure 2, Figure 4). Additionally, the main conclusions of the quantitative contribution of the three-pattern circulations to the anomalous rainfall do not change (comparing Figures 3A,B).
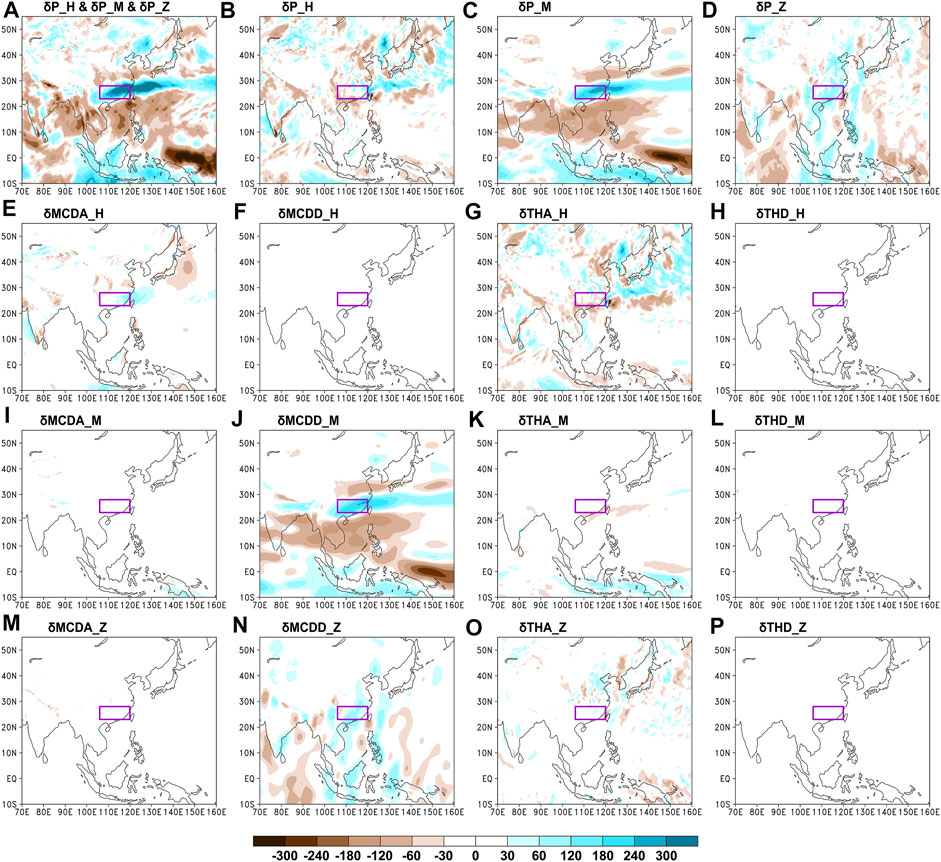
FIGURE 4. Figures 4A–P are the same as Figure 2A–P, except for that the results where the upper limit of vertical integration of Eq. 3 changes to 500 hPa.
Generally,
4 Anomalous three-pattern circulations and underlying mechanism
4.1 Anomalous meridional and zonal circulations
Figures 5A–C display the total vertical velocity anomaly and the vertical velocity anomaly of meridional and zonal circulations, respectively, during the “Dragon Boat Water” season in 2022. Figure 5A shows that there exists a zonal negative velocity anomaly belt over SC, implying that there is anomalous rising motion over SC. Additionally, the zonal positive velocity anomaly belt in the north and south of SC, the zonal negative velocity anomaly belt in the Southern Hemisphere, and the positive velocity anomaly in the east of the Malay Archipelago can be observed. Comparing Figure 1C, Figure 5A, the spatial patterns of the vertical velocity anomaly and rainfall anomaly are similar, and the spatial similarity coefficient is −0.76, implying that the anomalous rainfall is caused by the anomalous vertical velocity of meridional and zonal circulations. This result is also supported by Figure 5D since the correlation between the time series of the regionally averaged vertical velocity anomaly (multiplied by −1) and rainfall anomaly over SC during 1979–2022 reaches 0.95. Therefore, the extremely anomalous vertical velocity over SC leads to record-breaking “Dragon Boat Water” rainfall in 2022 (Figure 5D).
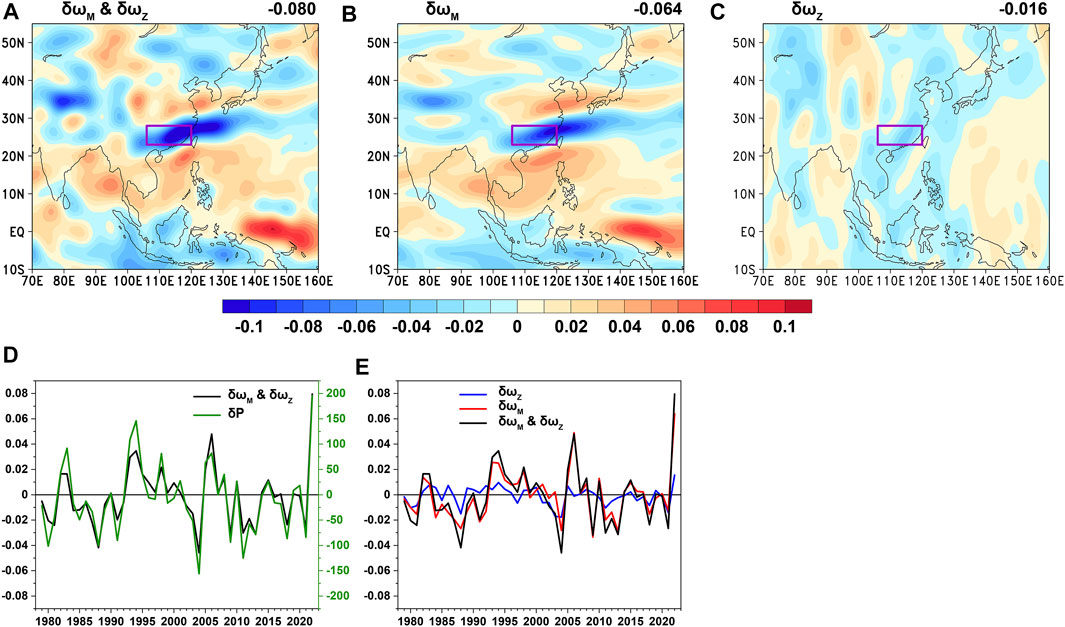
FIGURE 5. (A) Distribution of the vertical velocity anomaly during the “Dragon Boat Water” season in 2022; (B) and (C) are the same as (A) but for the vertical velocity anomaly of (B) meridional and (C) zonal circulations, respectively. Positive (negative) values in (A–C) represent sinking (rising) motion. The values in the upper right corners of (A–C) represent the regionally-averaged vertical velocity anomalies over SC. (D) Time series of the regionally-averaged vertical velocity anomaly (black line) and rainfall anomaly (green line) over SC during 1979–2022. The Y-axis on the left (right) represents the vertical velocity (rainfall) anomaly. (E) Time series of the regionally-averaged vertical velocity anomaly (black line) and vertical velocity anomaly of meridional (red line) and zonal (blue line) circulations over SC during 1979–2022. Vertical velocity anomalies in (D) and (E) are multiplied by −1 for convenience. Units of the vertical velocity anomaly and rainfall anomaly are Pa s−1 and mm, respectively.
Figures 5A,B show that the spatial patterns of the total vertical velocity anomaly and vertical velocity anomaly of meridional circulation are similar. Additionally, the regionally-averaged vertical velocity anomaly of the meridional circulation over SC is –0.064 Pa s−1, which contributes 80% of the total vertical velocity anomaly (−0.08 Pa s−1), while the regionally-averaged vertical velocity anomaly of the zonal circulation is −0.016 Pa s−1, which contributes 20% of the total vertical velocity anomaly (Figure 5E). The results proposed above are similar to those obtained from the novel moisture equations. This is because the vertical velocity anomalies of meridional and zonal circulations are closely related to
Since the specific humidity mainly exists below 500 hPa, Eq. 4 can be rewritten as follows:
The deduction from Eq. 4, to Eq. 5 can be confirmed by Figure 2, Figure 4. Since
The continuity equations can be rewritten as follows:
Therefore, the vertical velocity of the meridional and zonal circulations at 500 hPa can be calculated as follows:
Thus, the vertical velocity anomaly of the meridional and zonal circulations at 500 hPa can be obtained by using the following equations:
Since
4.2 Anomalous horizontal circulation
As proposed in the previous section, anomalous rainfall is caused by the anomalous vertical velocity of meridional and zonal circulations; thus, the cause of the anomalous vertical velocity is investigated in this section. Figure 6 displays the horizontal circulation anomaly and vorticity anomaly at 500 hPa during the “Dragon Boat Water” season in 2022. Figure 6 shows that affected by the continental high, anomalous anticyclonic circulation and negative vorticity exist over the region north of SC, which can result in anomalous divergence (convergence) in the lower (higher) troposphere (Figures 7A,B) and further anomalous sinking motion (Figure 5A). Over SC, affected by the anomalous continental high, anticyclonic circulation in the western Pacific, and the trough north of the western Pacific anticyclone, anomalous cyclonic circulation and positive vorticity exist, which can result in anomalous convergence (divergence) in the lower (higher) troposphere and further anomalous rising motion. In the western Pacific and the area southeast of southern India, anomalous anticyclonic circulation and negative vorticity exist, which can result in anomalous divergence (convergence) in the lower (higher) troposphere and further anomalous sinking motion. Between 5°S and 5°N, except for the region east of the Malay Archipelago, anomalous cyclonic circulation and positive vorticity exist, which can result in anomalous convergence (divergence) in the lower (higher) troposphere and further anomalous rising motion. Generally, the spatial configuration of the anomalous horizontal circulation provides the background for the generation of the anomalous vertical velocity.
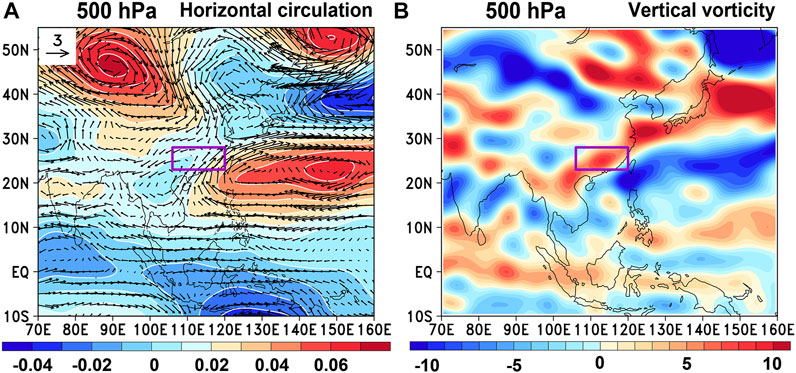
FIGURE 6. (A) Distribution of the horizontal circulation anomaly at 500 hPa during the “Dragon Boat Water” season in 2022. Shading and vector represent the stream function anomaly and wind anomaly of the horizontal circulation; (B) is the same as (A) but for the distribution of the vertical vorticity anomaly of horizontal circulation at 500 hPa. Units of the stream function, wind, and vorticity anomalies are 10−6 s−1, m s−1, and 10−6 s−1, respectively.
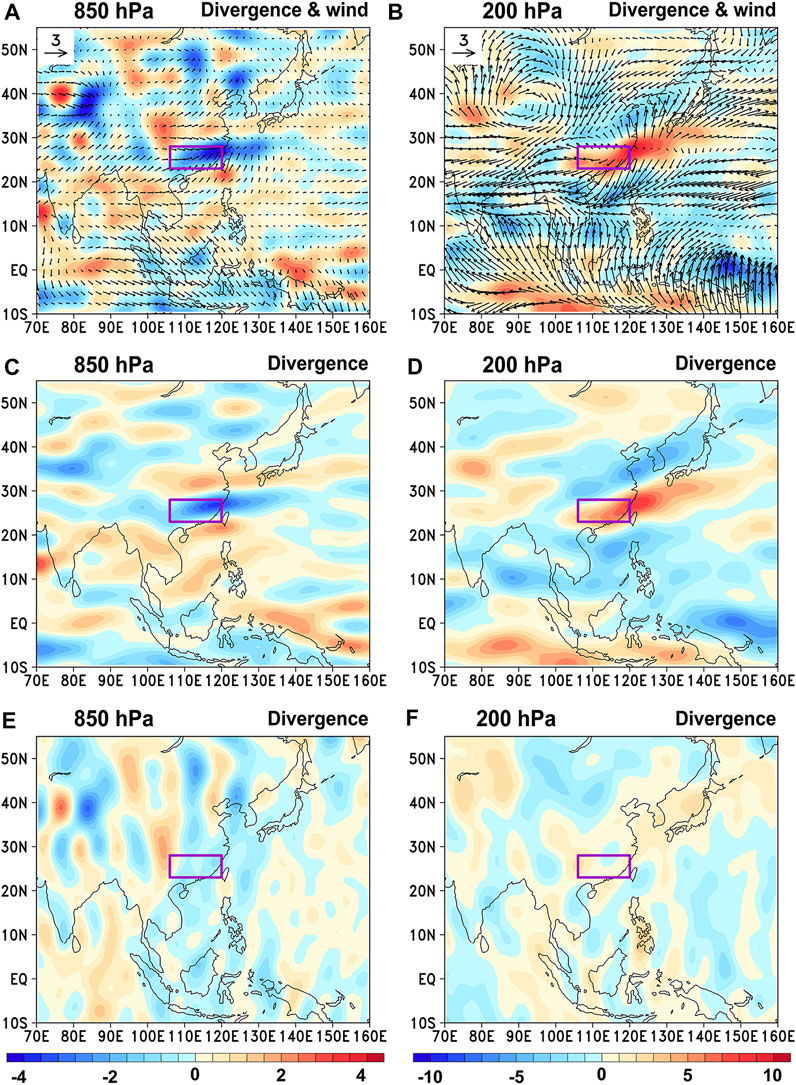
FIGURE 7. (A),(B) Distribution of the divergence anomaly (shading) and wind anomaly (vector) of the vertical circulation (i.e., the meridional and zonal circulations) at (A) 850 hPa and (B) 200 hPa during the “Dragon Boat Water” season in 2022; (C),(D) and (E),(F) are the same as (A),(B) but for the distribution of the divergence anomaly of the meridional and zonal circulations, respectively. Units of the divergence and wind anomalies are 10−6 s−1 and m s−1, respectively.
Additionally, the anomalous divergence of the meridional circulation is similar to that of the vertical circulation (i.e., meridional and zonal circulations) and is larger than that of the zonal circulation (Figures 7A–F), which corresponds to the dominant role of meridional circulation in influencing anomalous rainfall during the “Dragon Boat Water” season in 2022.
4.3 Correlation analysis
To verify the mechanism proposed above, correlation analysis is conducted. Figure 8 displays the correlation maps between the regionally averaged rainfall anomaly over SC and different variables during 1979–2022. By comparing Figure 8A, Figure 6A, the main characteristics of the spatial configuration are found to be similar, i.e., the anomalous continental high and the trough north of the western Pacific anticyclone in the mid–high latitudes, the anomalous anticyclonic circulation over the western Pacific and the area southeast of southern India in the subtropics, and the anomalous cyclonic circulation south of 5°N. The similarity of the spatial configurations of the anomalous horizontal circulation also leads to the similar spatial configuration of the vertical vorticity (Figure 8B, Figure 6B). Furthermore, the spatial configuration of the anomalous horizontal circulation and vertical vorticity leads to the anomalous divergence of meridional and zonal circulations (Figures 8C–F and Figures 7C–F) and further anomalous vertical velocity of the meridional and zonal circulations (Figures 8G,H and Figures 5B,C), which finally results in anomalous rainfall (Figure 1E). Additionally, the similarity between Figure 1E, Figure 8G corresponds to the findings that the meridional circulation dominates the anomalous rainfall during the “Dragon Boat Water” season in 2022.
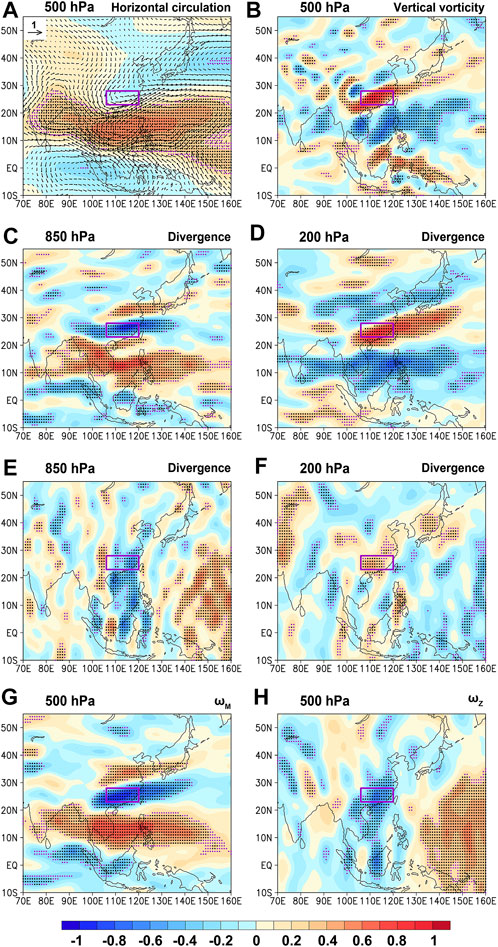
FIGURE 8. Correlation between the regionally averaged rainfall anomaly over SC and different variables during 1979–2022. (A) Horizontal circulation anomaly at 500 hPa. Shading and vector are for the stream function anomaly and wind anomaly of the horizontal circulation. (B) Vertical vorticity anomaly of horizontal circulation at 500 hPa. (C),(D) Divergence anomaly of meridional circulation at (C) 850 hPa and (D) 200 hPa. (E),(F) are the same as (C),(D) but for the zonal circulation. (G),(H) Vertical velocity anomaly of the (G) meridional and (H) zonal circulations at 500 hPa. Black (purple) dots over the shading represent that those correlation coefficients are significant above the 95% (90%) confidence level based on Student’s t test.
5 Summary and conclusion
During the “Dragon Boat Water” season in 2022, record-breaking anomalous rainfall existed over SC and was accompanied by the zonal negative rainfall anomaly belt in the north and south of SC, the zonal positive rainfall anomaly belt in the Southern Hemisphere, and the negative rainfall anomaly in the east of the Malay Archipelago. In this study, the causes of anomalous rainfall are investigated by using the novel moisture budget equation of three-pattern circulations, and the following conclusions are obtained.
(1) The anomalous rainfall over the SC caused by the horizontal (
(2) The dynamic terms caused by the anomalous divergence of meridional (
(3) Since
(4) The spatial configuration of the anomalous horizontal circulation and vertical vorticity provides the background for the generation of the anomalous divergence of meridional and zonal circulations and further the anomalous vertical velocity of the meridional and zonal circulations, ultimately resulting in anomalous rainfall.
It should be noted that the external forcings that cause anomalous horizontal, meridional, and zonal circulations are not investigated in this study and should be explored in the future.
Data availability statement
The original contributions presented in the study are included in the article/Supplementary Material, further inquiries can be directed to the corresponding author.
Author contributions
YZ and JC: methodology. YZ, JC, RZ, and GF: writing original draft preparation. YZ and JC: visualization. All authors contributed to the article and approved the submitted version.
Funding
This work was funded by National Natural Science Foundation of China (42130610, 42005012, 41975088), Natural Science Foundation of Jiangsu Province (BK20201058), and School-level research projects of Yancheng Institute of Technology (xjr2020022).
Conflict of interest
The authors declare that the research was conducted in the absence of any commercial or financial relationships that could be construed as a potential conflict of interest.
Publisher’s note
All claims expressed in this article are solely those of the authors and do not necessarily represent those of their affiliated organizations, or those of the publisher, the editors and the reviewers. Any product that may be evaluated in this article, or claim that may be made by its manufacturer, is not guaranteed or endorsed by the publisher.
Supplementary material
The Supplementary Material for this article can be found online at: https://www.frontiersin.org/articles/10.3389/feart.2022.1032313/full#supplementary-material
References
Cheng, J., Gao, C., Hu, S., and Feng, G. (2018). High-stability algorithm for the three-pattern decomposition of global atmospheric circulation. Theor. Appl. Climatol. 133, 851–866. doi:10.1007/s00704-017-2226-2
Cheng, J., Zhao, Y., Zhi, R., and Feng, G. (2022). Analysis of the July 2021 extreme precipitation in Henan using the novel moisture budget equation. Theor. Appl. Climatol. 149, 15–24. doi:10.1007/s00704-022-04022-7
Chu, Q., Wang, Q., and Feng, G. (2020). The roles of moisture transports in intraseasonal precipitation during the preflood season over South China. Int. J. Climatol. 40, 2239–2252. doi:10.1002/joc.6329
Chu, Q., Wang, Q., Qiao, S., and Feng, G. (2018). Feature analysis and primary causes of pre-flood season "Cumulative Effect" of torrential rain over South China. Theor. Appl. Climatol. 131, 91–100. doi:10.1007/s00704-016-1947-y
Gu, D., and Zhang, W. (2012). The strong dragon-boat race precipitation of Guangdong in 2008 and qusi-10-day oscillation. J. Trop. Meteorology 3, 349. (in Chinese)
Han, Z., Zhang, Q., Li, Q., Feng, R., Haywood, A. M., Tindall, J. C., et al. (2021). Evaluating the large-scale hydrological cycle response within the pliocene model intercomparison project phase 2 (PlioMIP2) ensemble. Clim. Past. 17, 2537–2558. doi:10.5194/cp-17-2537-2021
Hersbach, H., Bell, B., Berrisford, P., Hirahara, S., Horányi, A., MuñozSabater, J., et al. (2020). The ERA5 global reanalysis. Q. J. R. Meteorol. Soc. 146, 1999–2049. doi:10.1002/qj.3803
Hu, S., Cheng, J., and Chou, J. (2017). Novel three-pattern decomposition of global atmospheric circulation: Generalization of traditional two dimensional decomposition. Clim. Dyn. 49, 3573–3586. doi:10.1007/s00382-017-3530-3
Hu, S., Cheng, J., Xu, M., and Chou, J. (2018). Three-pattern decomposition of global atmospheric circulation: Part II—dynamical equations of horizontal, meridional and zonal circulations. Clim. Dyn. 50, 2673–2686. doi:10.1007/s00382-017-3763-1
Hu, S., Chou, J., and Cheng, J. (2018). Three-pattern decomposition of global atmospheric circulation: Part I—decomposition model and theorems. Clim. Dyn. 50, 2355–2368. doi:10.1007/s00382-015-2818-4
Hu, S., Zhou, B., Gao, C., Xu, Z., Wang, Q., and Chou, J. (2020). Theory of three-pattern decomposition of global atmospheric circulation. Sci. China Earth Sci. 63, 1248–1267. doi:10.1007/s11430-019-9614-y
Lee, M. H., Ho, C. H., and Kim, J. H. (2010). Influence of tropical cyclone landfalls on spatiotemporal variations in typhoon season rainfall over South China. Adv. Atmos. Sci. 27, 443–454. doi:10.1007/s00376-009-9106-3
Li, G., Chen, J., Wang, X., Luo, X., Yang, D., Zhou, W., et al. (2018). Remote impact of North Atlantic sea surface temperature on rainfall in southwestern China during boreal spring. Clim. Dyn. 50, 541–553. doi:10.1007/s00382-017-3625-x
Lin, L., Wu, N., Huang, Z., and Cai, A. (2009). Causality analysis of the infrequent dragon-boat precipitation in Guangdong province in 2008. Meteorol. Mon. 35, 43. (in Chinese)
Liu, F., Wang, B., Ouyang, Y., Wang, H., Qiao, S., Chen, G., et al. (2022). Intraseasonal variability of global land monsoon precipitation and its recent trend. npj Clim. Atmos. Sci. 5, 30. doi:10.1038/s41612-022-00253-7
Liu, H., Hu, S., Xu, M., and Chou, J. (2008). Three-dimensional decomposition method of global atmospheric circulation. Sci. China Ser. D-Earth. Sci. 51, 386–402. doi:10.1007/s11430-008-0020-9
Miao, R., Wen, M., Zhang, R., and Li, L. (2019). The influence of wave trains in mid-high latitudes on persistent heavy rain during the first rainy season over South China. Clim. Dyn. 53, 2949–2968. doi:10.1007/s00382-019-04670-y
Qian, W., Ai, Y., Chen, L., and Li, H. (2020). Anomalous synoptic pattern of typical dragon boat precipitation process in Guangdong province. J. Trop. Meteorology 36, 433. (in Chinese)
Qiao, S., Chen, D., Wang, W., Cheung, H. N., Liu, F., Cheng, J., et al. (2021). The longest 2020 Meiyu season over the past 60 years: Subseasonal perspective and its predictions. Geophys. Res. Lett. 48, e2021GL093596. doi:10.1029/2021GL093596
Ramage, C. S. (1952). Variation of rainfall over South China through the wet season. Bull. Am. Meteorol. Soc. 33, 308–311. doi:10.1175/1520-0477-33.7.308
Seager, R., Naik, N., and Vecchi, G. A. (2010). Thermodynamic and dynamic mechanisms for large-scale changes in the hydrological cycle in response to global warming. J. Clim. 23, 4651–4668. doi:10.1175/2010JCLI3655.1
Yang, H., and Sun, S. (2005). The characteristics of longitudinal movement of the subtropical high in the Western Pacific in the pre-rainy season in South China. Adv. Atmos. Sci. 22, 392–400. doi:10.1007/BF02918752
Yuan, C., Liu, J., Luo, J. J., and Guan, Z. (2019). Influences of tropical Indian and Pacific oceans on the interannual variations of precipitation in the early and late rainy seasons in South China. J. Clim. 32, 3681–3694. doi:10.1175/JCLI-D-18-0588.1
Yuan, F., Wei, K., Chen, W., Fong, S., and Leong, K. (2010). Temporal variations of the frontal and monsoon storm rainfall during the first rainy season in South China. Atmos. Ocean. Sci. Lett. 3, 243–247. doi:10.1080/16742834.2010.11446876
Yuan, Y., Ren, F., Wang, Y., Sun, L., and Guo, Y. (2012). Analysis of the precipitation feature and general circulation anomaly during the pre-flood season in South China in 2012. Meteorol. Mon. 38, 1247. (in Chinese)
Keywords: record-breaking rainfall, “dragon boat water” season, south China, novel moisture budget equation, meridional circulation
Citation: Cheng J, Zhao Y, Zhi R and Feng G (2023) Meridional circulation dominates the record-breaking “Dragon Boat Water” rainfall over south China in 2022. Front. Earth Sci. 10:1032313. doi: 10.3389/feart.2022.1032313
Received: 30 August 2022; Accepted: 21 September 2022;
Published: 09 January 2023.
Edited by:
Bo Sun, Nanjing University of Information Science and Technology, ChinaReviewed by:
Zixuan Han, Hohai University, ChinaShaobo Qiao, Sun Yat-sen University, China
Qin Wen, Nanjing Normal University, China
Copyright © 2023 Cheng, Zhao, Zhi and Feng. This is an open-access article distributed under the terms of the Creative Commons Attribution License (CC BY). The use, distribution or reproduction in other forums is permitted, provided the original author(s) and the copyright owner(s) are credited and that the original publication in this journal is cited, in accordance with accepted academic practice. No use, distribution or reproduction is permitted which does not comply with these terms.
*Correspondence: Guolin Feng, ZmVuZ2dsQGNtYS5nb3YuY24=
 Jianbo Cheng
 Yuheng Zhao2
 Rong Zhi
 Guolin Feng