
94% of researchers rate our articles as excellent or good
Learn more about the work of our research integrity team to safeguard the quality of each article we publish.
Find out more
ORIGINAL RESEARCH article
Front. Earth Sci., 16 January 2023
Sec. Geohazards and Georisks
Volume 10 - 2022 | https://doi.org/10.3389/feart.2022.1031665
This article is part of the Research TopicGeological Disasters in Deep Engineering Mechanism, Warning and Risk mitigationView all 39 articles
 Linxia Xu1
 Wenyuan Wu1,2*Junfeng Qian3,4Shujia Huang1Bin Xie1,2
 Tangao Hu1,2Xiayi Lang1Bowen He1Chenghao Hu1
Geothermal resources are one of the most valuable renewable energy sources because of their stability, reliability, cleanliness, safety and abundant reserves. Efficient and economical remote sensing and GIS (Geographic Information System) technology has high practical value in geothermal resources exploration. However, different study areas have different geothermal formation mechanisms. In the process of establishing the model, which factors are used for modeling and how to quantify the factors reasonably are still problems to be analyzed and studied. Taking Hangjiahu Plain of Zhejiang Province as an example, based on geothermal exploration and remote sensing interpretation data, the correlation between the existing geothermal hot spots and geothermal related factors was evaluated in this paper, such as lithology, fault zone distance, surface water system and its distance, seismic point distance, magmatic rock and volcanic rock distance, surface water, farmland, woodland temperature and so on. The relationship between geothermal potential and distribution characteristics of surface thermal environment, fault activity, surface water system and other factors was explored. AHP (Analytic Hierarchy Process) and BP (Back Propagation) neural network were used for establishing geothermal potential target evaluation models. The potential geothermal areas of Hangjiahu Plain were divided into five grades using geothermal exploration model, and most geothermal drilling sites were distributed in extremely high potential areas and high potential areas. The results show that it is feasible to analyze geothermal potential targets using remote sensing interpretation data and geographic information system analysis databased on analytic hierarchy process analytic hierarchy process and back propagation neural network, and the distribution characteristics of surface thermal environment, fault activity, surface water system and other related factors are also related to geothermal distribution. The prediction results of the model coincide with the existing geothermal drilling sites, which provides a new idea for geothermal exploration.
Geothermal resource is one of the most valuable renewable energy because of its stable, reliable, clean, safe and abundant reserves (Zhang et al., 2015; Zhou et al., 2015; Zhang et al., 2020). As one of the five non-carbon-based energy sources, geothermal energy has been included in the study of carbon neutral framework roadmap of China to control the total consumption of fossil energy, deepen the reform of the power system, and the geothermal energy industry will usher in new opportunities for development. The overall planning of mineral resources in Zhejiang Province (2021–2025) clearly points out that the development and utilization intensity of clean energy, such as geothermal and shallow low-temperature energy should be increased to form a mineral resources development pattern dominated by geothermal and other minerals. Traditional geothermal exploration is characterized by great difficulty, high economic cost and low success rate. Geothermal geological mapping and geophysical exploration are restricted by many factors, such as river system, residential buildings and multiple solutions of geophysical exploration (Zhang et al., 2016).
Remote sensing and GIS technology with high efficiency and economy have high practical value in geothermal resources exploration. On the one hand, the tone of thermal infrared remote sensing image can reflect the thermal radiation energy of ground objects, and geothermal anomaly information can be directly obtained from thermal infrared remote sensing images in areas with shallow geothermal or hot springs (Liu et al., 2004; Chen et al., 2006; Zhang and Zhang, 2006). On the other hand, based on the principles of geology and geophysics, scholars at home and abroad have established various mathematical models for geothermal resource exploration, and have obtained good results on the distribution characteristics and potential of geothermal water (Noorollahi et al., 2008; Yousefi et al., 2010; Moghaddam et al., 2014; Sadeghi and Khalajmasoumi, 2014; Trumpy et al., 2015; Meng et al., 2021). However, there are still some problems in these works, such as mainly driven by expert prior knowledge, simple model design, low accuracy and universality of the model.
In recent years, many new models have been introduced into the establishment of various geological models. Analytic Hierarchy Process (AHP), Fuzzy Comprehension Evaluation Method (FCEM) and Back Propagation Neural Network (BPNN) have been applied to geological environment exploration and geological prospecting effectively (Yu et al., 2017; Chakrabortty et al., 2018; Pal et al., 2019; Ahmad et al., 2020; Das and Pal, 2020a; Das and Pal, 2020b; Liang et al., 2020; Pang et al., 2020; Shao et al., 2020; Wang and Song, 2021; Pal et al., 2022; Ruidas et al., 2022). AHP and GIS technique have been applied in modeling and mapping of groundwater potentiality zones by factors, such as geology, slope gradient, LULC (land use land cover), soil texture, rainfall, lineament density, drainage density, groundwater fluctuation and so on (Chakrabortty et al., 2018), and also applied in modeling and mapping of potential landslide vulnerability zonation by factors, such as rock type, geomorphology, slope, aspect, drainage density, soil type and land use and land cover (Pal et al., 2019). MCDA, AHP, fuzzy logic and ensemble method in a GIS environment have been used in assessing the vulnerability of groundwater by factors, such as groundwater recharge, geology, ground, elevation, the groundwater level in the pre-monsoon season, soil texture, and LULC (Das and Pal, 2020a; Das and Pal, 2020b). The weight of each factor is calculated by the AHP model, and the geothermal potential target area model is established by BP neural network, which can reduce the dependence of the model on expert prior knowledge and make the delimitation of geothermal target area more intelligent and scientific.
However, different study areas have different geothermal formation mechanisms. In the process of establishing the model, which factors are used for modelling and how to quantify the factors reasonably are still problems to be further analyzed and studied. Many studies have shown that the distribution of geothermal activity is closely related to seismic activity, fault activity, fault fold distribution, igneous rocks and other factors, and the correlation between geothermal potential and various factors has also been evaluated (Johnson, 2014; Mcguire et al., 2015; Li and Zhang, 2017). In recent years, many studies have also shown that geothermal distribution is related to remote sensing surface thermal environment, and surface thermal environment is also related to topography and fault activity to a certain extent (Li and Zhang, 2017; Wu et al., 2019; Peng et al., 2020; Wu et al., 2012a; Wu et al., 2012b), so it can be seen that the distribution characteristics of surface thermal environment, fault activity and topographic characteristics should also be added to the factor quantification. At the same time, it is also found in the survey practice that the surface water system is related to the regional geothermal distribution, which requires the actual factor quantitative analysis and evaluation.
Therefore, in order to use the actual factor quantitative analysis and evaluation to study the correlation between geothermal distribution and remote sensing of surface thermal environment, topography, fault activity and surface water system, and to avoid the problems in previous work, the geothermal exploration area of Hangjiahu Plain in the north of Zhejiang Province was taken as an example in this paper based on remote sensing images and GIS analysis, the spatial distribution correlation characteristics between known geothermal hot spots and related geothermal factors, such as lithology, fault zone distance, surface water system and its distance, seismic point distance, magmatic rock and volcanic rock distance, surface water, farmland and woodland temperature were studied. In this paper, the AHP and BP neural network was used for establishing the evaluation model of geothermal potential target areas, and the potential areas of geothermal resources in Hangjiahu Plain were divided, providingdecision-making basis and direction for the establishment of geothermal exploration model in Hangjiahu Plain, and providing data and method supports for the construction of ecological and low-carbon Zhejiang.
The Study Area is located in the Hangzhou-Jiaxing-Huzhou Plain in the northern part of Zhejiang Province, as shown in Figure 1, which roughly includes the vast area south of Taihu Lake, north of Qiantang River and Hangzhou Bay, east of Tianmu Mountain and west of the East China Sea. Its geographical range is 120° 00′ −121° 15′ E, 30° 20′ −31° 00′ N, and its administrative divisions include Hangzhou, Jiaxing and Huzhou. The area has a subtropical monsoon climate with a dense water network.
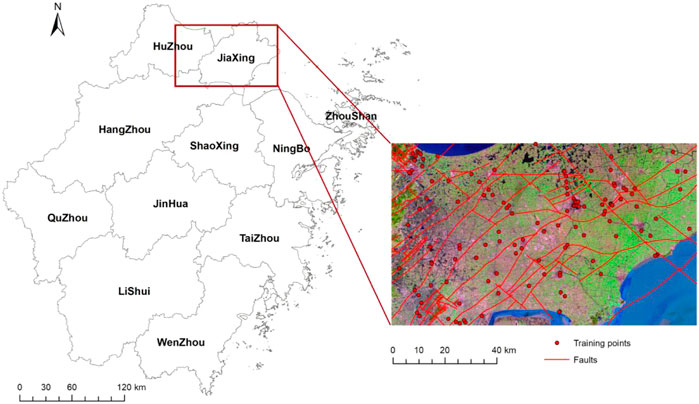
FIGURE 1. Location of study area.
Geothermal heat in the Study Area is in the framework of regional faults in NE and EW directions, with Huzhou-Jiashan active fault in the north, Huzhou-Linan active fault in the west and Xiaoshan-Qiuchuan active faults in the east. In addition, the Changxing-Fenghua fault zone and Majin-Wuzhen fault zone cross the region. The intersection of multiple fault zones and the active neotectonic movement have increased the water-bearing space of rocks. In addition, the heat source in the region is mainly deep conduction heat flow balance, and the fault zone is also a good conduction channel, which makes the Hangjiahu plain one of the areas with abundant geothermal resources in Zhejiang Province (Hu et al., 2011).
There are 134 geothermal drilling points in the Study Area, including four geothermal gradient >5°C/100 m anomalies and 19 geothermal gradient >4°C/100 m anomalies. Among them, the water temperature of Huimin Point, Wangdian Point and Jiaxing Cement Plant is 26°C–28°C, which is obviously higher than the normal water temperature calculated according to the average geothermal gradient of Hangjiahu Plain, and belongs to low temperature hot water. Tongxiang No.3 well and Jiashan No.6 well are sudden geothermal hot spots, and the water temperature is kept at 40.95°C and 58 C respectively. These geothermal anomalies indicate that there are more abundant underground hot water resources in the depth of the Study Area due to the shallow depth of exploration boreholes. Geothermal drilling sites, such as geothermal exploration data, can be used for analyzing the spatial correlation between geothermal drilling sites and geothermal factors and verifying the scientificity and rationality of the prediction model results.
Two Landsat 5 TM multi-spectral and thermal infrared images on February 20 and 21, 2002 were used in this study. The data set was provided by Geospatial Data Cloud, Computer Network Information Center, Chinese Academy of Sciences (http://www.gscloud.cn). Six multi-spectral bands (with a resolution of 30 m) were used for extracting land cover types, and one thermal infrared band (with a resolution of 120 m) was used for retrieving land surface temperature. Selecting historical images can weaken the influence of urban land surface, and selecting winter images can reduce the influence of solar radiation on land surface temperature to some extent. The preprocessing mainly includes radiometric calibration and atmospheric correction to eliminate the radiation errors caused by atmospheric scattering and absorption.
Based on the geological map and geothermal exploration data provided by Zhejiang Coal Geology Bureau of China Coal Geology General Administration, the ArcGIS software was used for vectorization to obtain the geothermal factor data of the Study Area, including stratigraphic lithology, magmatic rock distribution, seismic point distribution, fault zone distribution and so on The vector data of surface water system was obtained by OpenStreetMap (https://www.openstreetmap.org/). These auxiliary data can be used for quantitative analysis of geothermal factors.
In order to better establish the geothermal potential target area evaluation model, quantitative research on the related geothermal factor data was conducted in this paper, such as stratigraphic lithology, fault zone distribution, surface water system, seismic point distribution, magmatic rock and volcanic rock distribution, surface water temperature, surface farmland temperature and surface forest temperature. The research method is shown in Figure 2.
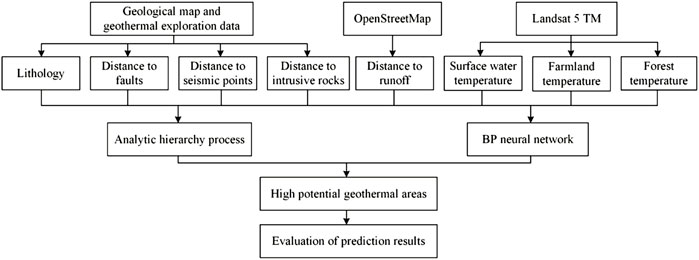
FIGURE 2. Flowchart of the analysis.
Rock porosity, faults and fractures in different lithological distribution areas have different development characteristics, which are important factors affecting geothermal (Sang et al., 2017). Geothermal resources may exist in various geological environments composed of limestone, volcanic rock and granite (Moghaddam et al., 2014). Thermal reservoir is the key to store geothermal fluid and form enough geothermal fluid productivity, which provides a good space for the occurrence of hot water (Guan and Fang, 2021). Therefore, the thermal reservoir is the key to the quantification of formation lithology factors.
The regional exploration research shows that the Hangjiahu Plain is mainly divided into three sets of thermal reservoirs and caprocks. The first caprock is about 144 m thick Carboniferous Gaolishan Formation C1g, and the corresponding underlying thermal reservoirs are about 200 m thick Devonian Wutong Formation D3w and about 1,500 m thick Silurian Maoshan Formation S3m; the second set is shallower, with the Permian Longtan Formation P2l with a thickness of about 350 m and the Yanqiao Formation P1y (Gufeng Formation P1g) with a thickness of about 200 m as the caprock, and the underlying thermal reservoirs are the Permian Qixia Formation P1q with a depth of about 159m, the Carboniferous Chuanshan Formation C2c with a depth of about 42.8 m and the Huanglong Formation C2h with a width of about 90m; the third set of the uppermost caprock is the Cretaceous Qifangcun Formation K1q, which is more than 800 m thick, and the Jurassic Jiande Group J3, which is about 900 m thick; the underlying thermal reservoir is the Triassic Qinglong Group T1-2 Q, which is about 583 m thick, and the Permian Changxing Formation P2c, about 169 m thick. Magmatic activities in the area mainly occurred in the late Yanshanian-Cretaceous, with magmatic intrusions in the Yanshanian and volcanic eruptions in the Jurassic and Cretaceous. Magmatic rocks are widely distributed in the area, mainly K-feldspar granite, granite porphyry, and quartz diorite, etc., while volcanic rocks are mainly volcanic lava and pyroclastic rocks. The water permeability and water abundance of the strata are poor, and they are relatively aquicludes and geothermal insulation layers.
The vector stratigraphic lithology data obtained by digitizing the bedrock geological map are shown in Table 1. The thermal reservoir with a certain buried depth and a tight cap at the top is regarded as a high-quality reservoir. The greater the thickness of the thermal reservoir in the underlying strata of the bedrock, the greater the geothermal resource potential at that point. Taking the Tertiary, Cretaceous and Jurassic strata as an example, the thickness of the underlying Triassic Qinglong Group T1-2q, Permian Changxing Formation P2c and Qixia Formation P1q, Carboniferous Chuanshan Formation C3c and Huanglong Formation C2h, Devonian Wutong Formation D3w and Silurian Maoshan Formation S3m was added up to 2,743.8 as the value of the corresponding formation in the vector formation lithology data. Similarly, the Permian strata were assigned the thickness of the underlying thermal reservoir and 1,991.8 m. See Table 1 for the values of Carboniferous, Devonian, Silurian and other strata. Due to the strong correlation between magmatic rocks and volcanic rocks and geothermal hot spots, the magmatic rocks and volcanic rocks are also set at 2,743.8 m, which is consistent with the Tertiary, Cretaceous and Jurassic.
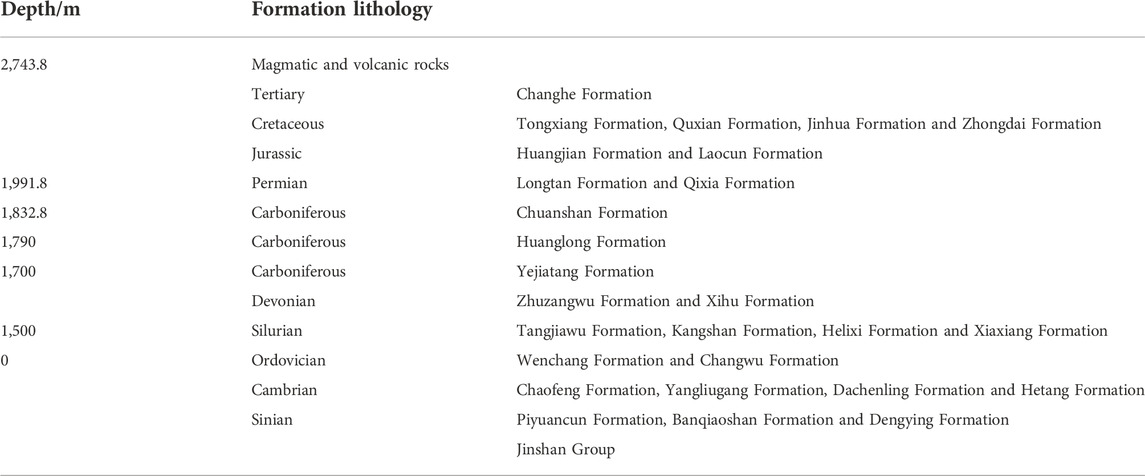
TABLE 1. Numerical table of stratigraphic lithology.
Through statistical analysis, among the 134 geothermal drilling points in the area, 53 (39.6% of the total) are located in Huangjian Formation and Laocun Formation of Jurassic System, 43 (32.1% of the total) are located in Zhongdai Formation, Jinhua Formation and Tongxiang Formation of Cretaceous System, and 15 (11.2%) are in Changhe Formation of Tertiary System. That is to say, 111 geothermal drilling points (accounting for 82.8% of the total) are distributed in the Tertiary, Cretaceous and Jurassic strata with thick underlying thermal reservoirs, indicating that there is a certain correlation between the thickness of underlying thermal reservoirs and geothermal resources.
In addition to hot dry rock-type geothermal systems, natural circulation of meteoric water in faults and fractures plays a dominant role in geothermal systems (Wu et al., 2012b). Faults and fractures, as water circulation channels, are one of the main controlling elements of geothermal systems, in which hot water flows or directly becomes geothermal reservoirs (Guan and Fang, 2021).
Large scale NE, EW and NW fault zones are developed in the basement of Hangjiahu area, which are mainly controlled by NE and EW fault zones, and on this basis, secondary fault structures are developed, which have obvious influence on geothermal anomalies and geothermal gradient anomalies (Feng, 2005).
In Figure 3A, most of the geothermal drilling points are distributed along the fault zone, and there is a certain negative correlation between the geothermal resources and the distance of the fault zone, that is, disconnection. The closer the rift zone is, the hotter spots there are. In order to quantify the impact factors of the fault zone on geothermal resources, the Euclidean distance tool of ArcGIS was used for processing the vector fault zone data into a fault zone distance map to analyze its spatial relationship with geothermal drilling sites. The value of each pixel in Figure 3B represents the vertical distance from the pixel to the nearest fracture zone. After statistical analysis, 126 geothermal drilling sites (94% of the total) are located within 4 km from the nearest fault zone, as shown in Table 2.
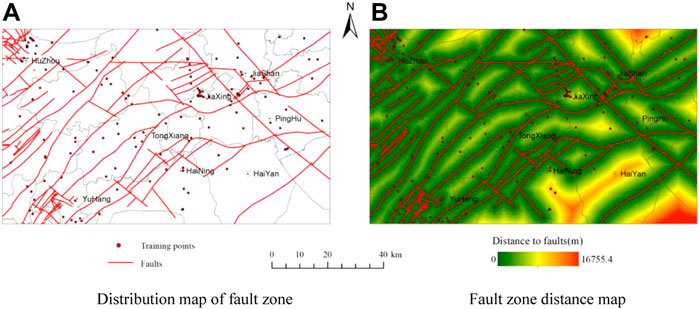
FIGURE 3. Distribution and distance map of faults in Study Area. (A) Distribution map of fault zone (B) Fault zone distance map.
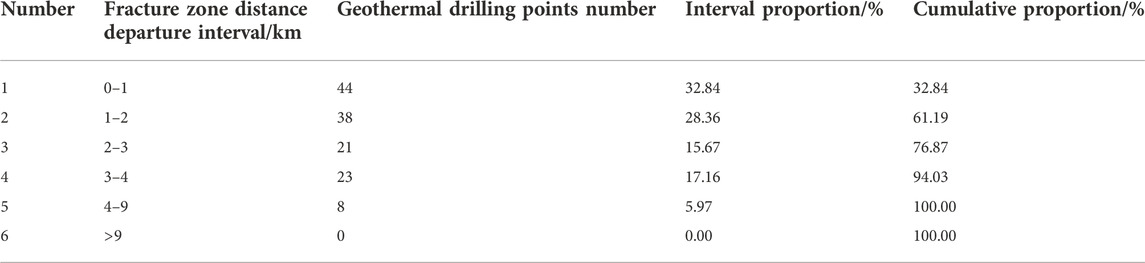
TABLE 2. Distance to the faults intervals and statistical results.
Water is an ideal medium for heat exchange, and the existence of water is a necessary condition for the development of geothermal fields and hot springs (Sang et al., 2017). The field survey shows that the surface water system can provide sufficient water for hydrothermal activities, which should be regarded as an important factor in geothermal resources exploration.
Most of the geothermal drilling points in the Study Area are distributed near the surface water system, as shown in Figure 4A. The distance between geothermal resources and surface water system shows a certain negative correlation, that is, the closer to the surface water system, the more geothermal hot spots. In order to evaluate the impact of surface water system on geothermal resources, the Euclidean distance tool of ArcGIS was used to process the vector surface water system data into a surface water distance map to analyze its spatial relationship with geothermal drilling sites, and the vertical distance from each pixel to the nearest surface water system was obtained, as shown in Figure 4B. Statistical analysis shows that 128 geothermal drilling sites (95.5% of the total) are located within 4 km of the nearest surface water system, as shown in Table 3.
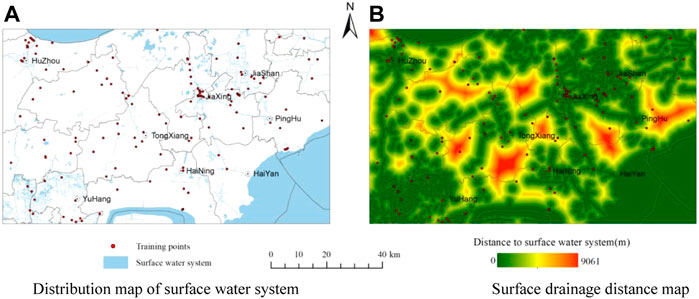
FIGURE 4. Distribution and distance map of surface water system in Study Area. (A) Distribution map of surface water system (B) Surface drainage distance map.
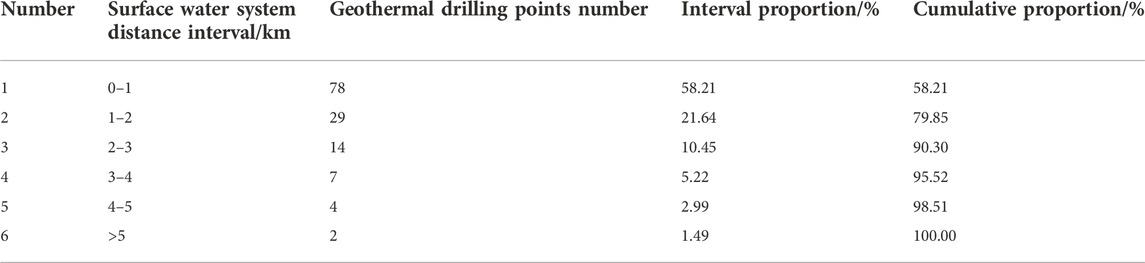
TABLE 3. Distance to the surface water system intervals and statistical results.
Fault activity is usually related to seismicity (Yao, 2008). Because the hot water in the active fault zone has high permeability and convection, geothermal resources are commonly found in the fault zone where earthquakes occur (Tufekci et al., 2010).
Earthquake records from 1971 to 2019 in the Area was used in the study, and the epicenter location was used as the geographic location of seismicity. There is a certain correlation between the distribution of geothermal drilling points and seismic points in Figure 5A, and there are many geothermal drilling points near the seismic points. In order to evaluate the correlation between seismic points and geothermal points, the Euclidean distance tool of ArcGIS was used for obtaining the distance map from each pixel of the full map to the nearest seismic point, as shown in Figure 5B. Statistical analysis shows that 126 geothermal drilling sites (94% of the total) are located within 15 km from the nearest seismic site, as shown in Table 4.
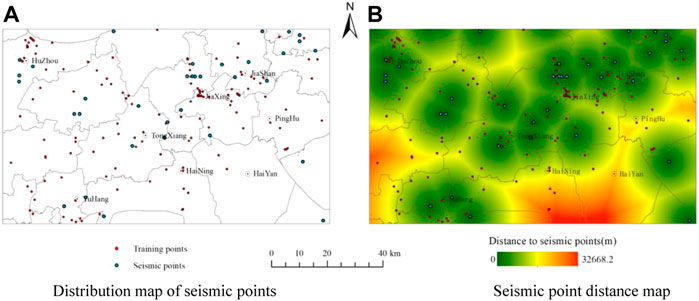
FIGURE 5. Distribution and distance map of seismic points in Study Area. (A) Distribution map of seismic points (B) Seismic point distance map.
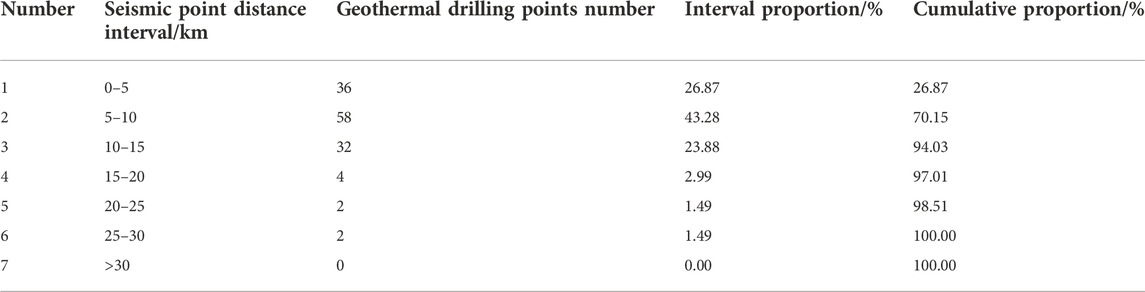
TABLE 4. Distance to the seismic points intervals and statistical results.
Magmatic rocks and volcanic rocks have the function of water insulation and heat preservation with a certain correlation with the fault zone. At the same time, the higher geothermal gradient is related to the subduction friction of magmatic rocks, magma replacement, eruption and the influence of the bottom of magma. In many areas, young intrusive bodies are the source of heat for geothermal systems. The potential for geothermal resources is higher when young intrusions are located at shallow depths and close to areas where intrusions have been identified (Yousefi et al., 2010). Mesozoic basalts in Hangjiahu Plain are relatively good bedrock aquifers and favorable heat storage layers due to their deep burial depth, developed joints, fissures and pores, and impermeable roof and floor.
Magmatic and volcanic rocks cover a total area of 207.48 km2 in the Study Area, accounting for about 2.52% of the total area. In Figure 6A, and there are certain geothermal drilling points near the magmatic rocks and volcanic rocks, indicating that the closer to the magmatic rocks and volcanic rocks, the more abundant the geothermal resources are. Using the Euclidean distance tool of ArcGIS, the vector magmatic and volcanic rock data were processed into a vertical distance map of each pixel of the full map to the nearest magmatic and volcanic rock, as shown in Figure 6B, for analyzing its spatial relationship with geothermal drilling sites. Statistical analysis shows that 111 geothermal drilling sites (82.8% of the total) are located within 15 km of the nearest magmatic and volcanic rocks, as shown in Table 5.
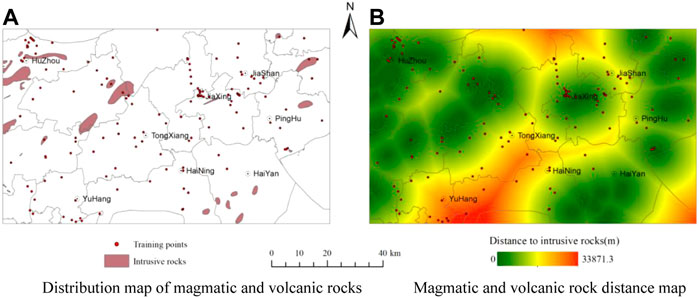
FIGURE 6. Distribution and distance map of intrusive rocks in Study Area. (A) Distribution map of magmatic and volcanic rocks (B) Magmatic and volcanic rock distance map.
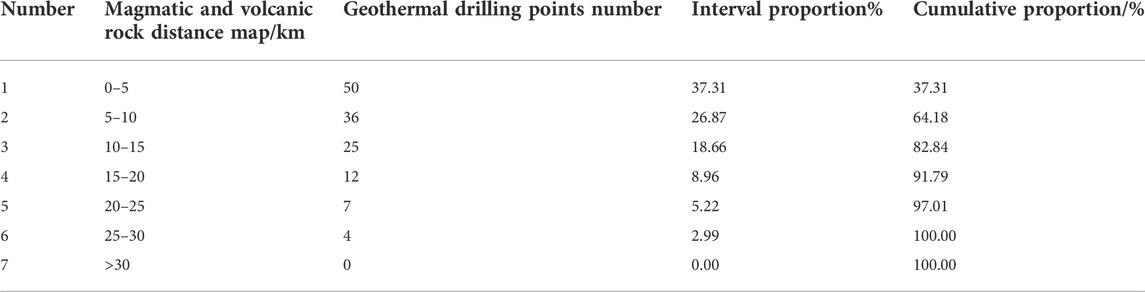
TABLE 5. Distance to the intrusive rock intervals and statistical results.
The surface thermal environment is related to geothermal to some extent, and the surface temperature can reflect a certain surface thermal environment (Li and Zhang, 2017). In the work, based on the thermal infrared band of Landsat 5 TM, the radiative transfer equation method was used for finding the abnormal area of surface thermal environment and analyzing the correlation between the geothermal hot spot and the abnormal area of surface thermal environment (Tu, 2006; Yang, 2015).
The land surface temperature was discussed in a separate surface feature type after removing the influence of various surface features. Therefore, the land surface temperature data of the Study Area was obtained through the inversion of the above steps on combination of the land use types obtained by supervised classification, the land surface temperatures of water bodies, farmlands and woodlands were masked and extracted. The surface temperature point data of water, farmland and woodland were obtained by using the raster turning point tool of ArcGIS. The Kriging interpolation method was used for drawing the surface temperature trend map corresponding to the water body, farmland and woodland in the Study Area, as shown in Figure 7, and the relationship between the surface thermal environment of different land types, such as water body, farmland and woodland and geothermal spots was counted. After statistical analysis, it is found that most of the hot spots are concentrated in the areas with higher temperature, and the trend map of water surface temperature is more obvious, followed by farmland and woodland.
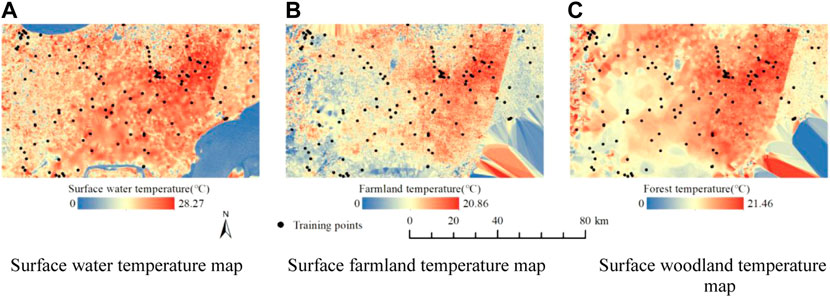
FIGURE 7. Temperature map of surface water, farmland and forest in Study Area. (A) Surface water temperature map (B) Surface farmland temperature map (C) Surface woodland temperature map.
Analytic Hierarchy Process (AHP) is a combination of qualitative and quantitative decision analysis method, which is often used for solving multi-objective, multi-criteria, multi-factor, multi-level and unstructured complex decision-making problems, focusing on clarifying the factors involved in the problem and analyzing their internal relations. AHP is widely used in the fields of groundwater, shallow geothermal energy and geothermy (Chakrabortty et al., 2018; Xu et al., 2018; Lv et al., 2019; Pal et al., 2019; Das and Pal, 2020a; Das and Pal, 2020b; Shao et al., 2020; Pal et al., 2022; Ruidas et al., 2022).
Based on prior knowledge and expert analysis and evaluation, eight geothermal potential factors, including stratigraphic lithology, fault zone distance, surface water system and its distance, seismic point distance, magmatic rock and volcanic rock distance, and surface water, farmland and woodland temperature, are compared in pairs according to their importance in geothermal exploration and their correlation with geothermal resources. Eigenvalues and eigenvectors are calculated and passed the consistency check. The higher the weight value of the geothermal factor is, the more important the geothermal factor is and the more relevant it is to the potential geothermal target area.
In order to obtain the potential target area zoning map of the AHP method, firstly the weight difference between the geothermal factors was evaluated, and the geothermal factor assignment table was obtained, as shown in Table 6. Due to the important influence of formation lithology on geothermal resources, it is assumed that the formation lithology is absolutely more important, and its weight is determined to be 8. Similarly, as the channel of heat transfer mechanism, the distribution of fault zones is more important than the surface water system, and the weights are determined to be 7 and 6, respectively. The distribution of seismic points can indirectly reflect the activity of the fault zone, and its weight is determined to be 5. The outcropping magmatic rocks and volcanic rocks are less distributed in the Study Area and have less spatial association with the known geothermal drilling sites, and their weights are determined to be 4. In the study, the temperatures of surface water, farmland and woodland obtained by Kriging interpolation method were innovatively used as geothermal potential factors, and their impacts on geothermal resources reduced successively, with weights of 3, 2 and 1 in turn.
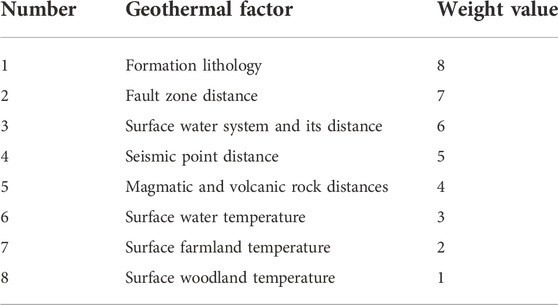
TABLE 6. Weight assignment criteria for the thematic map.
In combination with the correlation between each geothermal factor and geothermal hot spot, the hierarchical analysis method is used for obtaining the classification and standardization weights of eight geothermal factors, as shown in Table 7. Taking the formation lithology as an example, the lithology is divided into six categories. The greater the thickness of the underlying thermal reservoir, the more geothermal resources it may contain. The greater the value set, the higher the weight given. The fault zone and the surface water system are used as the channel and medium for heat exchange, respectively, and are divided into six categories according to the distance to the nearest fault zone and surface water system; the distance to the nearest seismic point, magmatic rock and volcanic rock, which have less correlation, are also divided into seven categories according to the distances to the nearest seismic point, magmatic rock and volcanic rock; the closer the distance is, the higher the weight is set. The temperatures trend charts of water body, farmland and woodland obtained by Kriging interpolation were divided into five categories by natural breakpoint method, and the higher the temperature was, the higher the weight was.
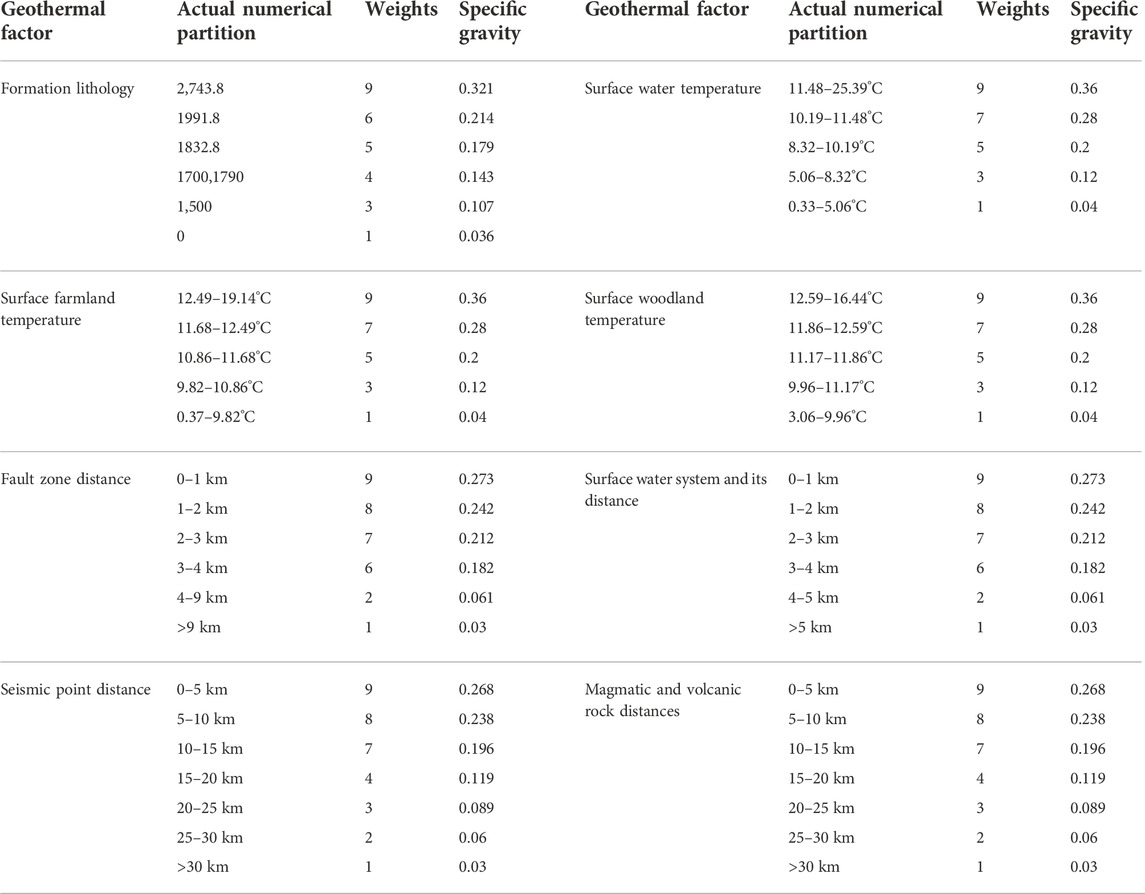
TABLE 7. Assigned and normalized weights of the factors for eight thematic maps.
According to the classification threshold in Table 7, the eight geothermal factors are re-classified, and the weight map of regional geothermal factors based on AHP is shown in Figure 8. The coincidence degree of geothermal hot spots and high-value parts is high, reflecting the accuracy of the weighting of geothermal factors in AHP to a certain extent. The geothermal factors were used for calculating the AHP geothermal potential target zoning map. In the AHP geothermal potential target zoning map, geothermal potential target zone was categorized as five levels by using the equal interval classification method: extremely high potential region, high potential region, medium potential region, low potential region and potential region.
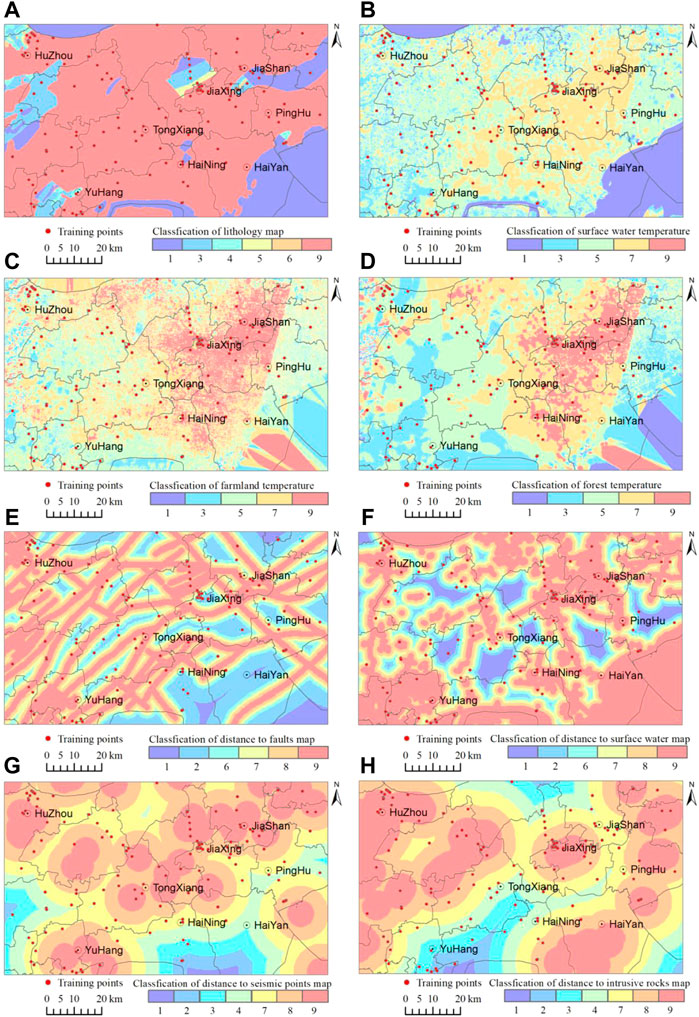
FIGURE 8. Geothermal factor weight map based on AHP. (A) Classification of lithology map; (B) Classification of surface water temperature; (C) Classification of farmland temperature; (D) Classification of forest temperature; (E) Classification of distance to faults map; (F) Classification of distance to surface water map; (G) Classification of distance to seismic points map; (H) Classification of distance to intrusive rocks map.
BP neural network is a kind of multilayer feedforward neural network which is trained according to the error back propagation algorithm. It is composed of input layer, hidden layer and output layer. It has the advantages of rigorous derivation, high algorithm accuracy and good versatility, and can obtain suitable connection weights by learning a large number of samples, and can reflect the nonlinear relationship of multi-factor interaction. The results obtained by BP neural network are accurate and simple in hydrologic analysis, water quality evaluation and prediction (Liu et al., 2008).
The eight geothermal factor zones in the Study Area are shown in Figure 8. The Study Area was divided into a regular 30 m × 30 m grid, and each pixel in the sampled raster data was a sample group containing eight geothermal factors. Taking the overall data set as an example, the training intensity accounts for 70% of the data volume in the entire data set, the verification intensity accounts for 20% of the data volume in the entire data set, and the final test intensity accounts for 10% of the total data volume. In order to avoid the gradient explosion phenomenon in the subsequent model calculation process and the fitting failure caused by the fact that some factor values are far greater than other values, the input data are normalized. Set the sum of the layers of the input layer and the hidden layer to 15, the number of nodes to 1,024, and the number of nodes of the output layer to 5.
The activation function aims at helping the network learn the complex patterns in the data. In this study, the ReLU function is used as the action function of the hidden layer and the output layer, and its expression is
The advantage of ReLU function is that it saves the amount of calculation, has a faster actual convergence speed, avoids the gradient disappearance, reduces the interdependence of parameters, alleviates the occurrence of over-fitting problems, and is more in line with the biological neural activation mechanism.
The training uses the SparseCategoricalCrossEntropy sparse cross-entropy loss function and the Adam optimization algorithm, and the optimal learning rate is considered to be 0.001.
And in the BP Neural Network Target Zoning Map, geothermal potential target zone is divided into five levels: extremely high potential area, high potential area, medium potential area, low potential area and potential area.
Based on the Regional Geothermal Factor Weight Map, the AHP Geothermal Potential Target Zoning Map is obtained by calculation. In order to highlight the spatial distribution of geothermal resource potential in Hangjiahu Plain, the Groundwater Potential Map calculated by AHP is divided into five levels by using the equal interval classification method: extremely high potential region, high potential region, medium potential region, low potential region and potential region as shown in Figure 9.
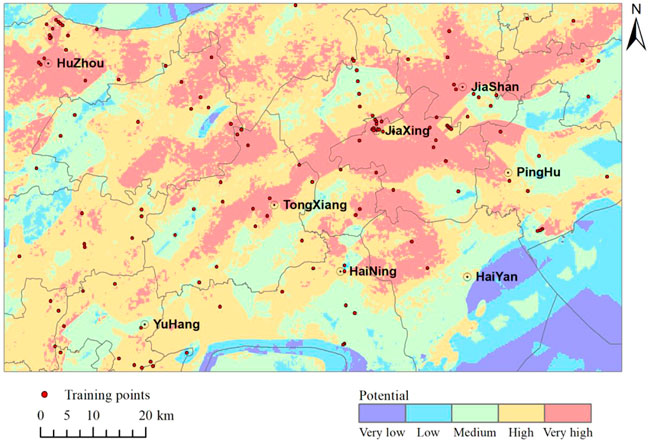
FIGURE 9. Possibility class maps for the AHP model.
The extremely high potential areas are mainly located near Huzhou City in the northwest, Jiashan County and Jiaxing City in the northeast, and Tongxiang City in the central part of the Study Area, covering an area of about 1,766.39 km2 (21.46%). The high potential area is mainly in the form of northeast-trending strips, accounting for 42.25% (3,477.50 km2) of the total area. The area of medium potential area is about 1,864.90 km2 (22.66%), which is mainly distributed in the land part of the whole Study Area.
In order to verify the accuracy of the AHP model, the results of the model were compared with the existing 134 geothermal drilling locations. Sixty geothermal drilling sites (44.78% of the total) are located in very high potential areas, and 54 geothermal drilling sites (40.30% of the total) are located in high potential areas. That is to say, 114 geothermal drilling points (accounting for 85.07% of the total) are distributed in extremely high potential areas and high potential areas, which shows that the comprehensive analysis model of geothermal water exploration established by AHP is more accurate and effective.
In order to analyze the spatial distribution of geothermal resource potential in Hangjiahu Plain, the BP neural network model is used for calculating and obtaining the BP Neural Network Geothermal Potential Target Zoning Map. As shown in Figure 10, the geothermal potential target area is divided into five levels: extremely high potential area, high potential area, medium potential area, low potential area and potential area.
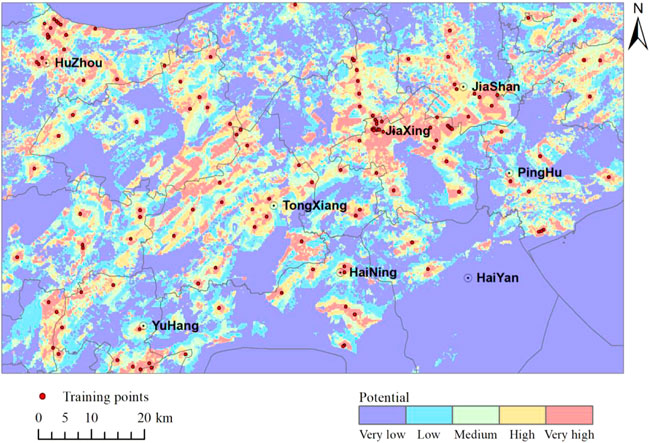
FIGURE 10. Possibility class maps for the Back Propagation Neural Network model.
The extremely high potential areas are relatively scattered, mainly concentrated near Huzhou City in the northwest, Jiashan County and Jiaxing City in the northeast of the Study Area, covering an area of about 814.75 km2 (9.90%). The high potential area mainly surrounds the very high potential area and accounts for 10.24% (843.22 km2) of the total area. The area of medium potential area is about 1,006.86 km2 (12.23%), which is mainly accompanied by extremely high and high potential areas.
In order to verify the accuracy of the BP neural network model, the results of the model are compared with the existing 134 geothermal drilling sites. 123 geothermal drilling points (accounting for 91.79% of the total) are located in the extremely high potential areas, which shows that the comprehensive analysis model of geothermal water exploration established by BP neural network is more accurate and has high coincidence. At the same time, the precision of BP neural network model is evaluated, and the Kappa coefficient of the model is 0.785, which shows that the precision is high.
The possibility class maps obtained by AHP model and BP neural network model in the study are similar to the existing geothermal targets in this region (Feng, 2005; Hu et al., 2011). However, the result this time is more accurate than the previous target location, and the classification is more suitable for future exploration.
Taking Hangjiahu Plain as an example, based on the inversion of land surface temperature from Landsat TM data, the geothermal factors are spatially analyzed and quantified, and the geothermal exploration model is established by using AHP and BP neural network to analyze the potential geothermal target areas.
(1) Based on geological maps, geothermal exploration data and remote sensing images, factor data affecting the distribution of geothermal resources are obtained. In the selection of geothermal factors, the influence of surface thermal environment and surface water system is innovatively considered. Quantitative analysises are carried out one by one, which are classified according to their spatial association with known hot spots.
(2) The weight of each geothermal factor is calculated by AHP, and the geothermal potential target area model is established by BP neural network, which can reduce the dependence of the model on expert prior knowledge and make the delimitation of geothermal resource potential area more intelligent and scientific.
(3) The results show that, the known hot spots and high potential areas have a good coincidence degree, and the model accuracy meets the requirements.
(4) The results also show that using remote sensing interpretation data and GIS analysis data, it is feasible to analyze geothermal potential targets based on AHP analytic hierarchy process and BP neural network, and the distribution characteristics of surface thermal environment, fault activity, surface water system and other related factors are also related to geothermal distribution. The prediction results of the model coincide with the existing geothermal drilling sites, which provides a new idea for geothermal exploration.
The original contributions presented in the study are included in the article/Supplementary Material, further inquiries can be directed to the corresponding author.
XL and WW: Conceptualization, Data Curation, and Writing—original draft; WW and QJ: Writing—review and editing; HS and XB: Resources and Data processing; HT: Research Conceptualization; LX, HB, and HC: Validation, Investigation. All authors have read and agreed to the published version of the manuscript.
This paper was supported by Zhejiang Provincial Natural Science Foundation of China (NO: GF19D020002); Science and technology project of China National Administration of Coal Geology (NO: ZMKJ-2020-J11-2); National Natural Science Foundation of China (NO: 41402304); Zhejiang Provincial Natural Science Foundation of China (NO: LQ13D020002).
The authors declare that the research was conducted in the absence of any commercial or financial relationships that could be construed as a potential conflict of interest.
All claims expressed in this article are solely those of the authors and do not necessarily represent those of their affiliated organizations, or those of the publisher, the editors and the reviewers. Any product that may be evaluated in this article, or claim that may be made by its manufacturer, is not guaranteed or endorsed by the publisher.
Ahmad, I., Dar, M. A., Tekaa, H., Teshome, M., Andualem, T. G., Teshome, A., et al. (2020). GIS and fuzzy logic techniques-based demarcation of groundwater potential zones: A case study from jemma river basin, Ethiopia. J. Afr. Earth Sci. 169, 103860. doi:10.1016/j.jafrearsci.2020.103860
Chakrabortty, R., Pal, S. C., Malik, S., and Das, B. (2018). Modeling and mapping of groundwater potentiality zones using AHP and GIS technique: a case study of Raniganj block, Paschim bardhaman, West Bengal. Model. Earth Syst. Environ. 4, 1085–1110. doi:10.1007/s40808-018-0471-8
Chen, S. Y., Liu, P. X., Liu, L. Q., Ma, J., and Chen, G. Q. (2006). Wavelet analysis of thermal infrared radiation of land surface and its implication in the study of current tectonic activities. Chin. J. Geophys. 49 (3), 717–723. in Chinese. doi:10.1002/cjg2.886
Das, B., and Pal, S. C. (2020). Assessment of groundwater vulnerability to over-exploitation using MCDA, AHP, fuzzy logic and novel ensemble models: a case study of Goghat-I and II blocks of West Bengal, India. Environ. Earth Sci. 79, 104. doi:10.1007/s12665-020-8843-6
Das, B., and Pal, S. C. (2020). Irrigation practices causing vulnerability of groundwater resources in water scarce Goghat-I and II Blocks of Hugli District using MCDA, AHP, Fuzzy logic and novel ensemble models. Adv. Space Res. 65 (12), 2733–2748. doi:10.1016/j.asr.2020.03.027
Feng, Y. W. (2005). Geological analysis of geothermal water in Hangjiahu area. Zhejiang Land Resour. 6, 40–43. (in Chinese). doi:10.3969/j.issn.1672-6960.2005.06.017
Guan, J., and Fang, S. (2021). Concept and heat transfer mechanism of geothermal system: A review. Geol. Resour. 30 (2), 207–213+206. (in Chinese). doi:10.13686/j.cnki.dzyzy.2021.02.013
Hu, N., Zhang, L. H., Gao, H. F., and Han, F. (2011). Target delineation and drilling verification of geothermal resources exploration in Hangjiahu plain of Zhejiang Province. Geol. China 38 (1), 138–144. (in Chinese). doi:10.3969/j.issn.1000-3657.2011.01.015
Johnson, L. R. (2014). Source mechanisms of induced earthquakes at the geysers geothermal reservoir. Pure Appl. Geophys. 171 (8), 1641–1668. doi:10.1007/s00024-014-0795-x
Li, J. M., and Zhang, Y. J. (2017). GIS-supported certainty factor (CF) models for assessment of geothermal potential: A case study of tengchong county, southwest China. Energy 140, 552–565. doi:10.1016/j.energy.2017.09.012
Liang, Q. Z., Wang, L. Q., Liu, D., and Li, G. X. (2020). PSO-ELM prediction model of regional groundwater depth based on EEMD. Water Resour. Hydropower Eng. 51 (9), 45–51. (in Chinese). doi:10.13928/j.cnki.wrahe.2020.09.005
Liu, P. X., Liu, L. Q., and Chen, S. Y. (2004). Heat Penetrability Index (HPI) method for distilling subsurface thermal information from satellite infrared images. Seismol. Geol. 26 (3), 519–527. in Chinese. doi:10.3969/j.issn.0253-4967.2004.03.016
Liu, R. T., Fu, Q., Feng, Y., Gai, Z. M., Li, G. L., and Li, W. Y. (2008). Grey BP neural networks model based on RAGA and its application in groundwater dynamic prediction of the Sanjiang plain. Syst. Eng.-Theory Pract. 28 (5), 171–176. (in Chinese). doi:10.3321/j.issn:1000-6788.2008.05.023
Lv, Z. M., Ding, J. P., Chu, X. W., Zhang, X. M., and Linghu, X. Y. (2019). Application of grey relational analysis based on fuzzy analytic hierarchy process in groundwater quality evaluation. J. Guizhou Univ. Sci. Ed. 36 (1), 118–124. (in Chinese). doi:10.15958/j.cnki.gdxbzrb.2019.01.22
Mcguire, J. J., Lohman, R. B., Catchings, R. D., Rymer, M. J., and Goldman, M. R. (2015). Relationships among seismic velocity, metamorphism, and seismic and aseismic fault slip in the Salton Sea Geothermal Field region. J. Geophys. Res. Solid Earth 120 (4), 2600–2615. doi:10.1002/2014JB011579
Meng, F. A., Liang, X. J., Xiao, C. L., and Wang, G. (2021). Geothermal resource potential assessment utilizing GIS - based multi criteria decision analysis method. Geothermics 89 (8), 101969. doi:10.1016/j.geothermics.2020.101969
Moghaddam, M. K., Samadzadegan, F., Noorollah, i. Y., Sharifi, M. A., and Itoi, R. (2014). Spatial analysis and multi-criteria decision making for regional-scale geothermal favorability map. Geothermics 50 (2), 189–201. doi:10.1016/j.geothermics.2013.09.004
Noorollahi, Y., Itor, R., Fujii, H., and Tanaka, T. (2008). GIS integration model for geothermal exploration and well siting. Geothermics 37 (2), 107–131. doi:10.1016/j.geothermics.2007.12.001
Pal, S. C., Das, B., and Malik, S. (2019). Potential landslide vulnerability zonation using integrated analytic hierarchy process and GIS technique of upper Rangit catchment area, west Sikkim, India. J. Indian Soc. Remote Sens. 47, 1643–1655. doi:10.1007/s12524-019-01009-2
Pal, S. C., Ruidas, D., Saha, A., Islam, A. R. M. T., and Chowdhuri, I. (2022). Application of novel data-mining technique based nitrate concentration susceptibility prediction approach for coastal aquifers in India. J. Clean. Prod. 346, 131205. doi:10.1016/j.jclepro.2022.131205
Pang, Z. H., Luo, J., Cheng, Y. Z., Duan, Z. F., Tian, J., Kong, Y. L., et al. (2020). Evaluation of geological conditions for the development of deep geothermal energy in China. Earth Sci. Front. 27 (1), 134–151. (in Chinese). doi:10.13745/j.esf.2020.1.15
Peng, X. X., Wu, W. Y., Zheng, Y. Y., Sun, J., Hu, T., and Wang, P. (2020). Correlation analysis of land surface temperature and topographic elements in Hangzhou, China. Sci. Rep. 10 (1), 10451. doi:10.1038/s41598-020-67423-6
Ruidas, D., Pal, S. C., Saha, A., Chowdhuri, I., and Shit, M. (2022). Hydrogeochemical characterization based water resources vulnerability assessment in India's first Ramsar site of Chilka lake. Mar. Pollut. Bull. 184, 114107. doi:10.1016/j.marpolbul.2022.114107
Sadeghi, B., and Khalajmasoumi, M. (2014). A futuristic review for evaluation of geothermal potentials using fuzzy logic and binary index overlay in GIS environment. Renew. Sustain. Energy Rev. 43, 818–831. doi:10.1016/j.rser.2014.11.079
Sang, X. J., Xue, L. F., Liu, J. W., and Zhan, L. (2017). A novel workflow for geothermal prospectively mapping weights-of-evidence in liaoning province, northeast China. Energies 10 (7), 1069. doi:10.3390/en10071069
Shao, Z. F., Huq, M. E., Cai, B. W., Altan, O., and Li, Y. (2020). Integrated remote sensing and GIS approach using Fuzzy-AHP to delineate and identify groundwater potential zones in semi-arid Shanxi Province, China. Environ. Model. Softw. 134, 104868. doi:10.1016/j.envsoft.2020.104868
Trumpy, E., Donato, A., Gianellli, G., Gola, G., Minissale, A., Montanari, D., et al. (2015). Data integration and favourability maps for exploring geothermal systems in Sicily, southern Italy. Geothermics 56, 1–16. doi:10.1016/j.geothermics.2015.03.004
Tu, L. P. (2006). Land surface temperature (LST) retrieval and land surface emissivity (LSE) estimation from Landsat TM data. Hangzhou: Zhejiang University, 33–35. (in Chinese).
Tufekci, N., Suzen, M. L., and Gulec, N. (2010). GIS based geothermal potential assessment: A case study from western anatolia, Turkey. Energy 35 (1), 246–261. doi:10.1016/j.energy.2009.09.016
Wang, S. S., and Song, B. L. (2021). Application of fuzzy analytic hierarchy process in sandstone aquifer water yield property evaluation. Environ. Technol. Innovation 22, 101488. doi:10.1016/j.eti.2021.101488
Wu, W. Y., Zou, L. J., Shen, X. H., Lu, S., Su, N., Kong, F., et al. (2012). Thermal infrared remote-sensing detection of thermal information associated with faults: A case study in western sichuan basin, China. J. Asian Earth Sci. 43 (1), 110–117. doi:10.1016/j.jseaes.2011.08.015
Wu, W. Y., Zou, L. J., Shen, X. H., Lu, S., Su, N., and Kong, F. (2012). Thermal anomalies associated with faults: a case study of the jinhua-quzhou basin of Zhejiang province, China. Int. J. Remote Sens. 33 (6), 1850–1867. doi:10.1080/01431161.2011.602992
Wu, W. Y., Jin, C., Pang, Y. W., Zhao, L. J., Song, Y., Hu, T. G., et al. (2019). Distribution characteristics of surface thermal environment in Zhejiang province based on thermal infrared remote sensing. J. Remote Sens. 23 (4), 796–808. (in Chinese). doi:10.11834/jrs.20197339
Xu, X. W., Ma, K. H., and Zou, S. (2018). Application research of AHP fuzzy comprehensive evaluation model in groundwater vulnerability assessment. Ground Water 40 (5), 1–4. (in Chinese). doi:10.3969/j.issn.1004-1184.2018.05.001
Yang, X. S. (2015). Research on the single-channel algorithm for land surface temperature retrieval from Landsat8 data. Beijing: China University of Geosciences, 26–29. (in Chinese).
Yao, Q. (2008). Neotectonics of NW-SE trending faults in Hangzhou Bay, China. Hangzhou: Zhejiang University, 10–13. (in Chinese).
Yousefi, H., Noorollahi, Y., Ehara, S., Itoi, R., Yousefi, A., Fujimitsu, Y., et al. (2010). Developing the geothermal resources map of Iran. Geothermics 39 (2), 140–151. doi:10.1016/j.geothermics.2009.11.001
Yu, L. M., Yan, W. G., Gong, D. Z., Li, Y., Feng, Y., and Jiang, D. (2017). Temporal and spatial distribution prediction of shallow groundwater level based on ELM model. Trans. Chin. Soc. Agric. Mach. 48 (2), 215–223. (in Chinese). doi:10.6041/j.issn.1000-1298.2017.02.029
Zhang, P. M., and Zhang, J. L. (2006). Identification of remote sensing information in geothermal abnormal area. Remote Sens. Inf. (2), 42–45+81. in Chinese. doi:10.3969/j.issn.1000-3177.2006.02.013
Zhang, Y. J., Guo, L. L., Li, Z. W., Yu, Z. W., Xu, T. F., and Lan, C. Y. (2015). Electricity generation and heating potential from enhanced geothermal system in Songliao Basin, China: Different reservoir stimulation strategies for tight rock and naturally fractured formations. Energy 93 (2), 1860–1885. doi:10.1016/j.energy.2015.10.059
Zhang, Y. J., Xie, Y. Y., Zhang, T., Liu, T., and Zhang, C. (2016). 2m survey method and its improved device application in Dongshan geothermal field in Xiamen in China. Environ. Earth Sci. 75 (18), 1290. doi:10.1007/s12665-016-6048-9
Zhang, Y., Zhang, Y. J., Yu, H., Li, J., Xie, Y., and Lei, Z. (2020). Geothermal resource potential assessment of Fujian Province, China, based on geographic information system (GIS) -supported models. Renew. Energy 153, 564–579. doi:10.1016/j.renene.2020.02.044
Keywords: geothermal resource, land surface temperature, analytic hierarchy process, back propagation neural network, geographic information system technology
Citation: Xu L, Wu W, Qian J, Huang S, Xie B, Hu T, Lang X, He B and Hu C (2023) Analysis of geothermal potential in Hangjiahu area based on remote sensing and geographic information system. Front. Earth Sci. 10:1031665. doi: 10.3389/feart.2022.1031665
Received: 30 August 2022; Accepted: 09 November 2022;
Published: 16 January 2023.
Edited by:
Guang-Liang Feng, Institute of Rock and Soil Mechanics (CAS), ChinaCopyright © 2023 Xu, Wu, Qian, Huang, Xie, Hu, Lang, He and Hu. This is an open-access article distributed under the terms of the Creative Commons Attribution License (CC BY). The use, distribution or reproduction in other forums is permitted, provided the original author(s) and the copyright owner(s) are credited and that the original publication in this journal is cited, in accordance with accepted academic practice. No use, distribution or reproduction is permitted which does not comply with these terms.
*Correspondence: Wenyuan Wu, d3V3eUBoem51LmVkdS5jbg==
Disclaimer: All claims expressed in this article are solely those of the authors and do not necessarily represent those of their affiliated organizations, or those of the publisher, the editors and the reviewers. Any product that may be evaluated in this article or claim that may be made by its manufacturer is not guaranteed or endorsed by the publisher.
Research integrity at Frontiers
Learn more about the work of our research integrity team to safeguard the quality of each article we publish.