- 1Northwest Branch of CNPC Research Institute of Petroleum Exploration and Development, Lanzhou, China
- 2Cryosphere Research Station on the Qinghai-Tibet Plateau, State Key Laboratory of Cryospheric Sciences, Northwest Institute of Eco-Environment and Resources, Chinese Academy of Sciences, Lanzhou, China
- 3University of Chinese Academy of Sciences, Beijing, China
Thin sandstone reservoirs of the fan delta front sub-facies occur in the early Neogene (Miocene) series of the Aketao (Akto) structural belt within the Kunlun piedmont zone of the Tarim Basin. Oil and gas reservoirs in this area correspond to stratigraphic traps. However, owing to the low density of the 2D seismic survey grid deployed in the Aketao belt, inferior seismic data quality, and lack of well logging data, reservoir prediction in this area suffers from a multiplicity of problems and it is difficult to effectively identify sand bodies. Here, a new research approach is proposed involving the use of 3D seismic, well logging, and drilling data from a neighboring highly-explored 3D seismic survey area as a reference for the 2D seismic interpretation of the non-drilled Aketao survey area. Moreover, this approach is integrated with forward modeling and the inversion of post-stack seismic data to identify sand bodies. A comparison of the seismic reflection characteristics clarifies that these 3D and 2D seismic survey areas share similar sedimentary environments. Forward modeling confirms their similar reservoir characteristics, while the reservoir distribution in the 2D seismic survey area is effectively mapped via the inversion. The results show that for a 2D seismic survey area characterized by a low degree of hydrocarbon exploration and appraisal, and a lack of well logging data, the proposed approach can confirm the sedimentary characteristics that correspond to the seismic reflection characteristics, and can quantitatively map the reservoir thickness.
Introduction
The Aketao structural belt is a localized structure located at the front of the Qimugen uplift, adjacent to the western part of the Yingjisha structural belt in Xinjiang Uygur Autonomous Prefecture of China (Liu et al., 2018; Li W et al., 2019). It lies to the southwest of the nose-like Qimugen uplift in the piedmont zone of the Kunlun Mountains within the Southwest Depression of the Tarim Basin. The Aketao structural belt is rather small and the main targets for exploration are rocks of early Neogene (Miocene) age (Chen et al., 2018; Yang et al., 2021). Since the discovery of the Kekeya condensate gas field in the Kunlun piedmont zone in the 1970s, exploration targeting Miocene rocks of the southwestern Tarim Basin (Southwest Tarim) has failed on multiple occasions, and no breakthrough in hydrocarbon exploration has yet been made in this area since the enrichment degree of oil and gas in the study area is affected by the reservoir development and the reservoir physical properties (Du et al., 2011; Mo et al., 2013). Fan delta deposition are present on the periphery of the Qimugen uplift in Southwest Tarim, these are analogous to those in the Kekeya condensate gas field, which is considered the main reservoir. Owing to the rapid variation in lithofacies and deep burial, great difficulties have been encountered in sand body identification and reservoir prediction in this region. The Miocene rocks of the Aketao structural belt have great potential for the discovery of reservoirs according to their known structural background. However, Miocene strata here are composed of thin interbedded sandstone and mudstone layers. Such strata are characterized by considerable vertical and horizontal variability, and no clear understanding of the characteristics of these sedimentary facies belts or the distribution of favorable sand bodies has yet been achieved; this has resulted in considerable difficulty in identifying the stratigraphic‒lithologic trap and determining the exploration target (Cheng et al., 2012; Mo et al., 2013; Chen et al., 2018; Yang et al., 2021).
Numerous studies have been carried out previously, focusing on the hydrocarbon accumulation, sedimentary facies distribution, and geologic structure of the Kunlun piedmont zone (Jin et al., 2003; Suotang et al., 2015; Wang et al., 2016; You et al., 2018). A comprehensive analysis of that work indicates that the reservoir rock is one of the main factors controlling hydrocarbon accumulation in these Miocene strata. This has been confirmed by the findings of GT1 and YS1 Wells, which were drilled in 2019 (Zhang et al., 2014; Chen et al., 2018; Yang et al., 2021). The main target of Well GT1 was the Miocene Anjuan Formation, in which the reservoir average porosity and permeability of the Xi-VI and -VII Members were 8.9% and 1.01 mD, respectively. Although this well was found to have good evidence of oil and gas, the reservoirs failed to form owing to the tight reservoir rock. The Well YS1 target of the Miocene Keziluoyi Formation showed fine-grained sediments from a lithological perspective. Accordingly, it is important to find high-quality sandstone reservoirs equivalent to those found in the Kekeya area to improved exploration outcomes in Miocene strata of this area (Xie et al., 2019).
The study area in the Aketao structural belt is covered by 19 two-dimensional (2D) seismic lines, comprising 11 south-north lines and eight east-west lines. The density of the 2D seismic survey grid is 2 × 2 km and the dominant frequency band is 15–30 Hz. Although the data quality from these seismic lines can be somewhat improved after multiple rounds of post-stack time-migration processing, the following issues remain problematical: 1) The geomorphology of the study area is that of a typical mountainous area, with associated low-velocity zones and rapid lateral variations in thickness and wave velocity leading to severe static correction issues; 2) The surface conditions of the study area (like deserts and thick loess layers) are not conducive to the excitation and reception of seismic waves, and the seismic data generally have a low signal-to-noise ratio (SNR), owing to the high energy of various sources of noise, such as surface waves, linear noise, and multiple refractions; 3) The seismic lines deployed in different years have different frequencies and amplitudes (energy), which leads to an expanded closure error between seismic lines. In addition, no well has yet been drilled in the study area; thus, it is difficult to investigate the petrophysics of these rocks.
To overcome the above issues exist in sparsely explored areas, two approaches are commonly used to identify sand bodies: 1) Perform wave impedance inversion for each 2D seismic line in the survey area and then obtain the data volume of the full-area wave impedance using spatial interpolation; 2) Perform three-dimensional (3D) fitting of 2D seismic data and then carry out the full-area wave impedance inversion based on the pseudo-3D data volume (Tao et al., 2007; Sun et al., 2010; Zhang D. H et al., 2012; Liu and Zhang, 2014). Although these two approaches can relatively effectively identify thin sand bodies in a 2D seismic survey area, they can only qualitatively delineate the seismic facies features of a profile and are seldom used for quantitative vertical (across profiles) and planar prediction, owing to a lack of drilling data and the resolution limits of seismic data. This limited prediction precision leads to a failure to quantitatively determine the thickness of sand bodies. Thus, prediction results suffer a multiplicity of solutions. Moreover, the sedimentary characteristics and sand body distribution of the study area remain insufficiently investigated (Li J et al., 2019; Chen, 2021; Li et al., 2021).
Given the above-mentioned issues, this study aims to perform seismic facies analysis based on knowledge of previous studies on the sedimentology and reservoir characteristics of the Kekeya area, combined with forward modeling based on the elastic wave equation, to clarify the seismic reflection features of fluvial channel sands in this area. Moreover, a petrophysical approach and wave impedance inversion are then introduced to ultimately demarcate the reservoir distribution across the 2D seismic survey area.
Overview of the study area
The Qimugen uplift forms a large arc between Yingjisha and Yecheng in the piedmont zone of the Kunlun Mountains, within the Southwest Depression of the Tarim Basin. It is a concealed blind strike-slip fault structural belt, jointly controlled by strike-slip and thrusting (Tian et al., 2020). Two high-quality source rocks comprising Carboniferous and Permian mudstone, respectively, occur within the Qimugen uplift; these have a constant planar distribution across the study area and can be traced seismically. The source rocks are thick (>100 m) with high contents of organic matter (total organic carbon (TOC) > 1.0%), and are now at the mature stage, with hydrocarbon generation dominated by light oil. Three sets of reservoir-cap combinations are developed here. The first set comprises Upper Cretaceous mudstone and Paleogene gypsum rock, with sandstone of the Lower Cretaceous Kezilesu Group. The second set comprises mudstone of the Paleogene Bashilake Formation, and Wulagen Formation, with carbonate rock of the Later Formation. The last set comprises Miocene sandstone and siltstone interbedded by mudstone and gypsum rock. Miocene strata house the reservoir sand body that is composed of fan delta depositional system, which has rapid lateral variations in lithology (Yuan et al., 2002; Tang et al., 2012).
The Aketao structural belt, located on the northwest margin of the Qimugen uplift, is a localized structure with an area of approximately 500 km2 (Figure 1). The belt was gradually uplifted after deposition of the Neogene Atushi Formation and, owing to its weak tectonic deformation, it presents as an anticline in a stable state that has not been structurally altered during the Cenozoic Era. Moreover, it shares a structural setting and sedimentary environment similar to that of the adjacent Kekeya, Yingjisha and Qibei structural belts (Mo et al., 2013).
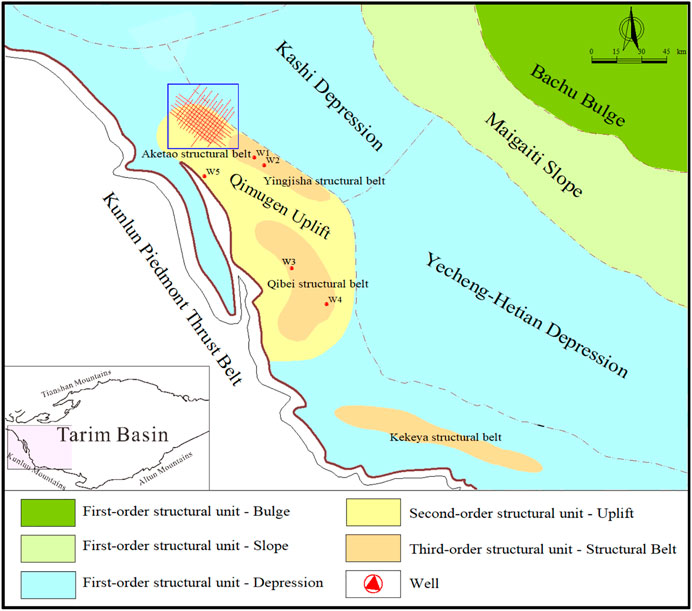
FIGURE 1. Location and seismic line distribution of the Aketao structural belt in the piedmont zone of Southwest Tarim.
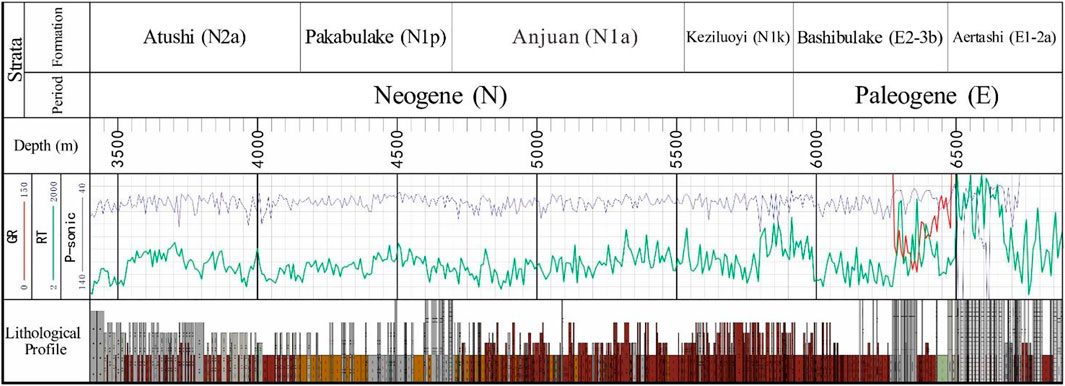
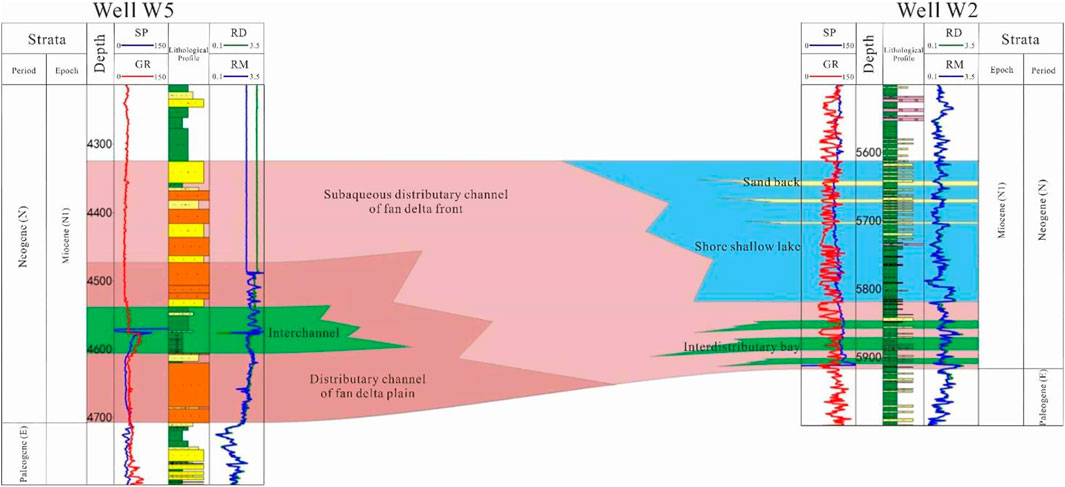
The Neogene Miocene in Yingjisha structural belt respectively is Keziluoyi, Anjuan and Pakabulake formations from bottom to top (Figure 2). According to the well drilled data such as WI and W2, as well as the outcrop data, it is clear that the fan delta depositional system is developed in the area of the Neogene Miocene strata, but the sedimentary microfacies and sand body distribution law are not clear (Figure 3).
Currently, no wells have been drilled in the Aketao study area, but four wells have been drilled in the adjacent Yingjisha and Qibei structural belts. Well W1 showed good gas-bearing capability from the Miocene Keziluoyi Formation, but the seismic data quality of the piedmont zone was too low to clarify the geologic structure. Well W1 also revealed good gas-bearing capability in the Keziluoyi Formation, but failed to produce an industrial oil and gas stream, owing to the relatively tight reservoir. Well W3 showed active gas-bearing capability in the Paleogene Kalataer Formation. Finally, Well W4 showed good gas-bearing capability in the Neogene Atushi and Anjuan formations. However, owing to insufficient trap occlusion conditions and the Miocene Keziluoyi Formation showed many fine-grained sediments from a lithological perspective, this Well failed to emerge as an exploration breakthrough. In general, drilling in the Cenozoic of the Aketao structural belt has shown the active hydrocarbon-bearing capability, indicating the potential to explore stratigraphic‒lithologic oil and gas reservoirs in a desirable structural setting.
Seismic response characteristics
A seismic facies is a representation of a specific sedimentary facies or the seismic response characteristics of a geo-body (Roksandić, 1978; Coléou et al., 2003; Su et al., 2019). Seismic waves have different propagation characteristics in different types of sedimentary systems; the lithology, physical properties, and fluid properties of different geologic bodies often result in changes in seismic waves, with respect to their amplitude, frequency, and phase, and ultimately changes in their spatial reflection characteristics (Duan et al., 2011; Gao and Yuan, 2016). For a 2D seismic survey area lacking data from either hydrocarbon exploration or drilling, this contribution aims to investigate seismic facies parameters, such as the reflection amplitude and frequency of the seismic facies unit, together with the configuration, continuity, and geometry of reflections, and perform clustering analysis of seismic waveform features to obtain seismic facies data that have relatively deterministic geologic implications of the Aketao study area.
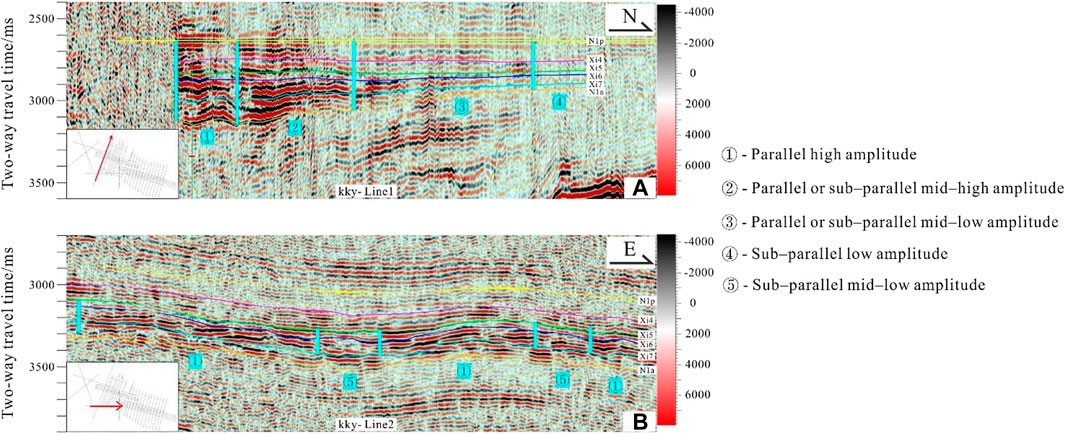
Previous studies have probed deep into the sedimentary reservoir rocks of the Kekeya structural belt and its periphery, and have clarified the characteristics of its 3D seismic facies. It has been shown that the seismic facies of the Miocene is characterized by facies change features, such as a strong‒weak variation, intermittent connectivity, distortion, and dislocation of events (Cheng et al., 2012; Zhang et al., 2014). It can be seen from the seismic profile of Kekeya 3D seismic survey area that the seismic amplitude in Xihefu Formation (from Xi-IV to Xi-VIII Members) changes from strong to weak and the stratum changes from thick to thin along the provenance direction, and there also obvious layering characteristics in the forwards direction (Figures 4A). The amplitude variation of the seismic event is alternately strong and weak in the direction perpendicular to the provenance (Figures 4B).
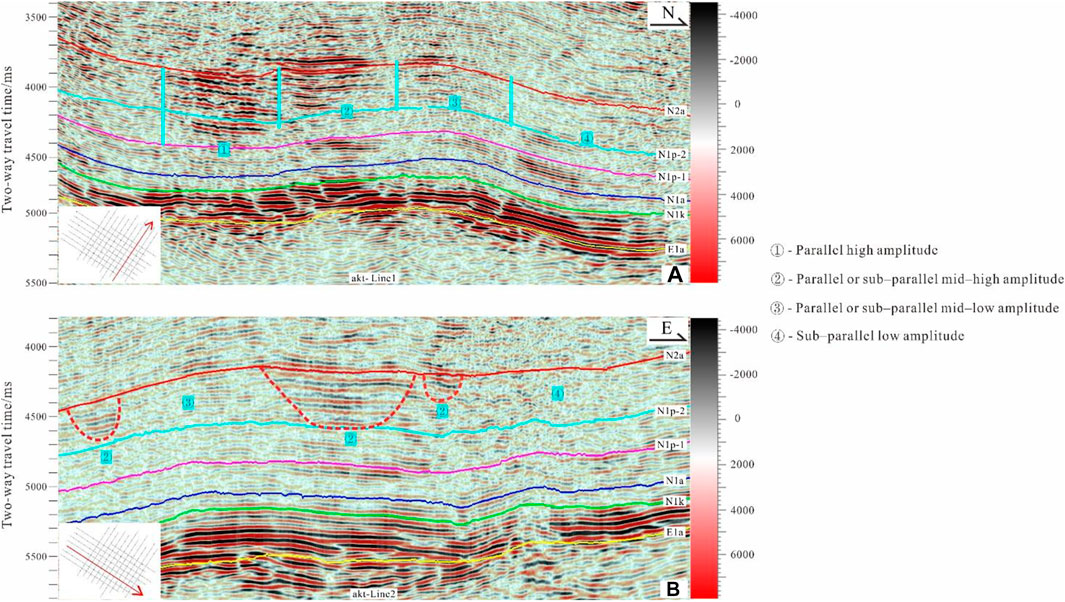
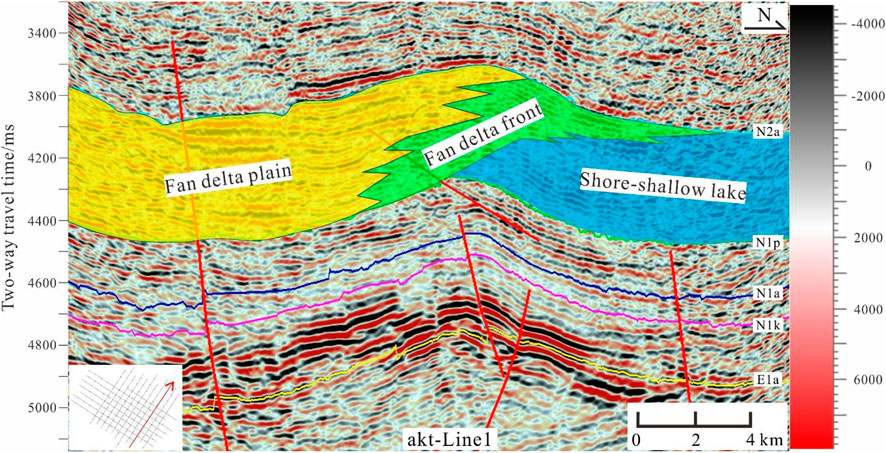
From SW to NE, the Pakabulake Formation in the profile of the NE‒SW 2D seismic line in the Aketao structural belt presents a seismic facies variation feature similar to the “high amplitude‒medium high amplitude‒low amplitude” feature of the Xihefu Formation in the Kekeya structural belt, this phenomenon may be due to the change of seismic reflection characteristics caused by sedimentary phase transition (Figures 5A). And from SE to NW, the Pakabulake Formation in the 2D seismic profile presents a reflection characteristic of riverbed undercutting, which may be the reflection characteristic of channel deposition (The area circled by the red dotted line in Figures 5B). Based on the understanding of sedimentary facies and sand body changes in the whole area and Well drilled data, it is speculated that the Aktao area may also develop fan delta plain, front and then shallow lacustrine deposits. In order to verify whether this understanding is correct, further forward modeling is carried out.
Forward modeling
Geophysical forward modeling is an effective approach to validate the seismic response characteristics of channel sand bodies (Butler and Sinha, 2012; Hansen et al., 2014; Butler and Zhang, 2016; Sun et al., 2018). Herein, the distribution pattern of the sand body boundary of the plain and front of fan delta facies was analyzed and the reservoir geologic model of the target layer was constructed, in accordance with the sedimentary characteristics and evolution pattern of fan delta deposition; this was done using seismic survey data from the area of interest and drilling and well logging data from the adjacent area. Based on seismic wave kinetics and kinematics, the elastic wave equation was solved using the finite difference method, and forward modeling of the wave equation was carried out to determine the main seismic facies pattern of sand bodies and improve the reliability of identifying thin sand bodies from seismic data.
Building the reservoir geologic model
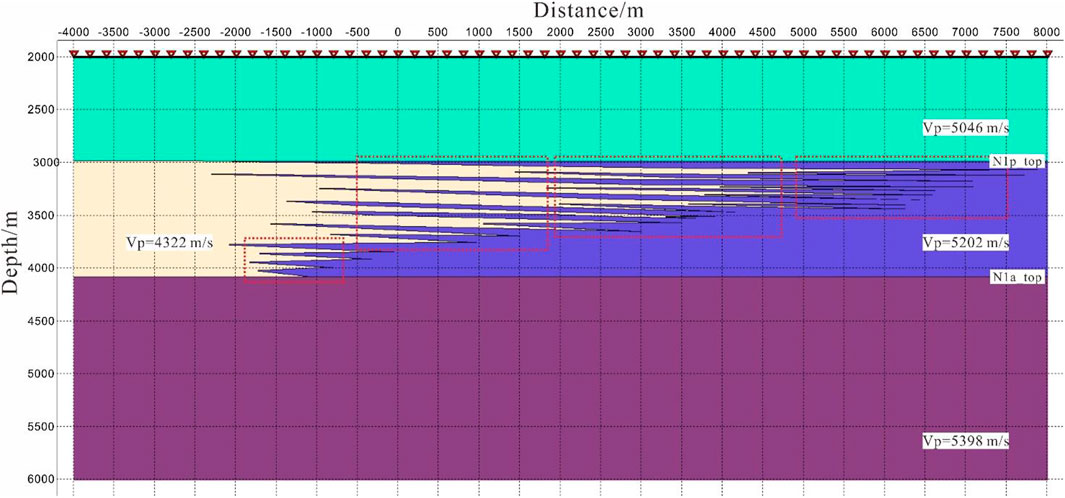
Previous studies on the seismic reflection characteristics of sand bodies related to fan delta deposition have generally been limited to qualitative analysis (Liu et al., 2008). No quantitative work has been reported in terms of the seismic reflection characteristics of sand bodies with different thicknesses, where there is interbedding between thin sandstone and mudstone and diverse sand/formation thickness ratios (Li et al., 2014; Wang and Li., 2015). Under the premise that forward modeling can truly capture the seismic response characteristics and sand body distribution patterns of sand bodies in the study area, this research incorporated interbedding between thin sandstone and mudstone layers and different sand/formation thickness ratios, together with the regional sedimentary pattern and actual 2D seismic profile of the study area (the direction of the constructed model was consistent with that of the actual seismic profile. The model for forward modeling was developed by drawing polygons in an interactive manual way. The assignment of model parameters strictly followed the actual seismic data obtained from the study area, the drilling and well logging data obtained from the adjacent area. In so doing, a reservoir geologic model of the sand body of the fan delta deposition was constructed by the software Tesseral v6.0. (Figure 6).
The interval transit time and density logs of well logging data can effectively and directly reflect reservoir physical properties and, in most cases, they can be used as critical references for determining the physical properties of each layer in forward modeling (Meyer and Nederlof, 1984). The interval transit time and density logs of four wells (Wells W1‒W4) in the area adjacent to the study area that encounters the Miocene Keziluoyi Formation were summarized to determine the average P-wave velocity and density of the sandstone‒mudstone strata (Table 1). The formation P-wave velocity at each depth section through the calculation method (1/P-sonic)*106.
According to seismic data from the study area, the lateral width of the reservoir geologic model was set as −4,000 to 8,000 m, and the vertical depth as 2000–6,000 m. In addition, the following parameters were determined in accordance with the seismic parameters of the target layer in the study area; the dominant frequency of the seismic waves was set as 25 Hz, with a zero-phase Ricker wavelet and time sampling rate of 2 m; single-source excitation was adopted and data acquisition was performed via an approach in which receivers were placed on either side of the middle shot. Based on the field data acquisition approach in the study area, the shot spacing was 50 m, geophone spacing was 25 m, and the maximum offset was 12,000 m. These satisfied the stretching distortion limit of normal movement correction (NMO) during seismic data processing and the precision requirement of the velocity analysis.
Forward modeling computation
Numerical simulation based on the elastic wave equation in essence simulates the propagation pattern of seismic waves through the given subsurface media, calculates measurements at each surface observation point, and ultimately mimics the seismic response of the geologic model of interest. It does this by solving a hyperbolic partial differential equation (wave equation), on the basis of Newtonian mechanics, elasticity or viscoelasticity theory, and the structures of the subsurface media and relevant physical parameters that are assumed to be known (Zhang W et al., 2012; Favorskaya et al., 2018; Sun et al., 2018; Ma et al., 2019). Because this approach considers both the kinetics and kinematics of the propagation of seismic waves, the simulated seismic wave field contains abundant seismic wave propagation information, which provides increased evidence to enable the investigation of the seismic wave propagation mechanism and interpretation of complex geology. This is an important method in the numerical simulation of seismic wave fields.
The study area has complex geology. For the reservoir geologic model, the quality factor (Q) was estimated using the empirical correlation between it and the wave velocity. To truly mimic the structural shape of the subsurface strata and their internal seismic response characteristics, and produce forward modeling results that correspond as closely as possible to the acquired seismic data, the original shot gather records were obtained via forward modeling based on the viscoelastic wave equation. Since the forward modeling results are very close to those of the seismic data, this study used a process flow similar to the actual Kirchhoff prestack time migration method to process the data: the shot gathered of the forward modeling was extracted and set as the common mid-point (CMP) gather, then the direct wave was eliminated and inverse Q filtering based on Q was performed to compensate for the energy that was absorbed. After the above processing, velocity analysis was carried out, and the trace gather data and velocity spectrum data were interpreted in an integrated manner. The stacked velocity was put through NMO and horizontal stacking to obtain the stacked profile. Finally, post-stack Kirchhoff migration was conducted to produce the final migration profile for subsequent analysis.
Analysis of forward modeling results
The geologic model was assigned variable sand/formation thickness ratios. The fan root was close to the provenance area, so the sandstone thickness was typically higher than the mudstone thickness. In contrast, the distal fan was far away from the provenance area, and thus the sandstone/thickness ratio was often small. The pre-stack Kirchhoff time-migration record (having a direction consistent with that of the actual seismic profile. As shown in Figure 7, the seismic response of the mudstone band is characterized by a high-amplitude crest reflection, while the sandstone band features a high-amplitude valley reflection. Moreover, the characteristics of wave impedance are independent of reservoir type. Following the provenance direction, the sand body gradually thinned and the sand/formation ratio dropped. A thicker sand body was not necessarily associated with intense seismic reflection; the energy of seismic reflection reached a peak in the case of interbedding between sandstone and mudstone together with an optimal sand/formation thickness ratio.
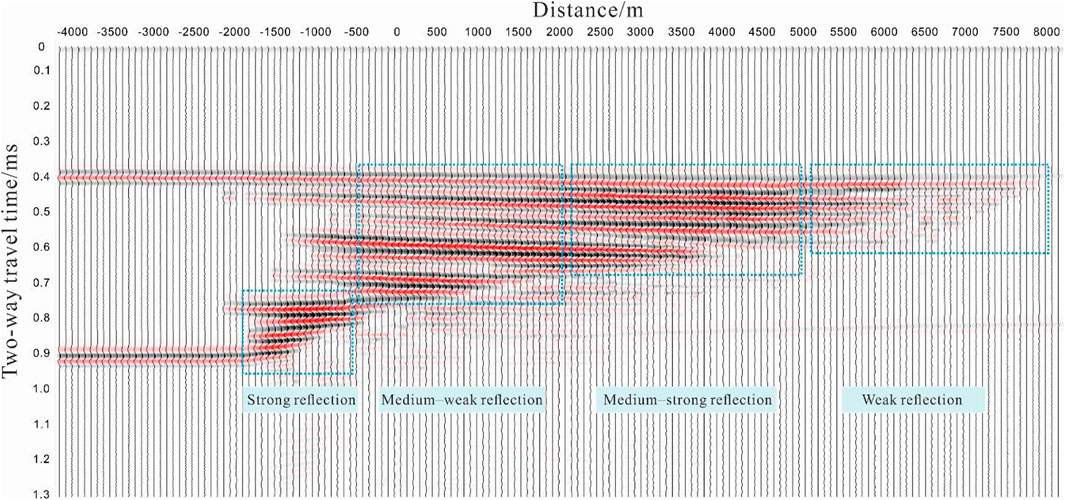
FIGURE 7. Pre-stack Kirchhoff time-migration profile of the geologic model of the Miocene reservoir in the Aketao structural belt.
Petrophysical analysis and wave impedance inversion
Petrophysics bridges seismic data and reservoir characteristics and parameters (Tiab and Donaldson, 2015; Shi, 2016). We can perform P- and S-wave velocity analysis and conversion of elastic parameters based on well logs in a petrophysical approach to effectively characterize variations in the lithology, porosity, and fluid content of strata. Petrophysics is also a critical method used to evaluate whether or not the inversion results of elastic parameters of a given area can effectively identify reservoirs and fluids (Vedanti et al., 2018; Garia et al., 2019; Zhang et al., 2020; Ma et al., 2021). Wave impedance inversion was carried out following the petrophysical analysis of well logs in this study because the study area was lacking in drilling, well logging, and seismic data. Multiple inversion methods were tested, among which the Inver Trace Plus module of Jason was finally adopted. This is a constrained sparse spike inversion method based on post-stack seismic data, in which post-stack seismic data are converted into high-quality data of P-wave impedance by reducing wavelet side lobes and their tuning effects; hence, the true reservoir thickness can be restored for the quantitative prediction of reservoirs.
Petrophysical analysis
Based on the well logging data and sandstone reservoir characteristics from an adjacent area of the Aketao structural belt, petrophysical analysis was performed via single-parameter statistics and cross-plotting of sensitive parameters to provide references for the subsequent task, namely reservoir inversion. After sensitive curve qualitative analysis of Wells W1–W4 in the adjacent area, template charts for petrophysical parameters were developed. Moreover, the triple-parameter cross plot analysis of wave impedance, natural gamma, and porosity indicated that the wave impedance curve can successfully distinguish sandstone and mudstone; the wave impedance of sandstone (mostly 9,000–12,000 g/cm3 m/s) was smaller than that of mudstone, and the threshold wave impedance of effective reservoirs was 11,715 g/cm3 m/s. The well logging response of the reservoir was characterized by low wave impedance and low natural gamma (Figure 8).

FIGURE 8. Analysis of well logs of sensitive parameters for four wells in an area adjacent to the study area. (A) Triple-parameter cross plot of wave impedance, natural gamma, and porosity. (B) Triple-parameter cross plot of interval transit time, natural gamma, and porosity.
Reservoir inversion and sand body prediction
Constrained sparse spike wave impedance inversion is a recurrence inversion method based on spiking deconvolution; its basic principles are as follows. Strong reflection coefficients of strata are assumed to be sparse and discrete (Yunita and Haris, 2018; Duan et al., 2020; Wang et al., 2020). Then, the accurate reflection coefficient of the near-well seismic trace is extracted, in accordance with the sparse principle, and is used to produce a synthetic seismogram via wavelet convolution. Moreover, the number of reflection coefficients participating in the convolution is changed, according to the residual error between the synthetic seismogram and the original seismic trace, which produces a modified synthetic seismogram. The above process is repeated to finally obtain a reflection coefficient series that represents the optimal approximation of the original seismic trace, under the constraint of both the well logging data and framework model (Wang and Guo, 2008; Wang and Lu, 2011). For areas that have low degrees of exploration, low resolutions of seismic data, and sparsely deployed exploration wells, constrained sparse spike wave impedance inversion can generate broadband reflection coefficients and thus solve the solution multiplicity issue of the seismic inversion to obtain inversion results that more closely represent geologic reality. In addition, this method can compensate for the frequency band limitation of seismic data by introducing high-frequency information contained in well logs, and can therefore quantitatively delineate the thickness and physical properties of a reservoir (Sa et al., 2015; Qiao and Du, 2016).
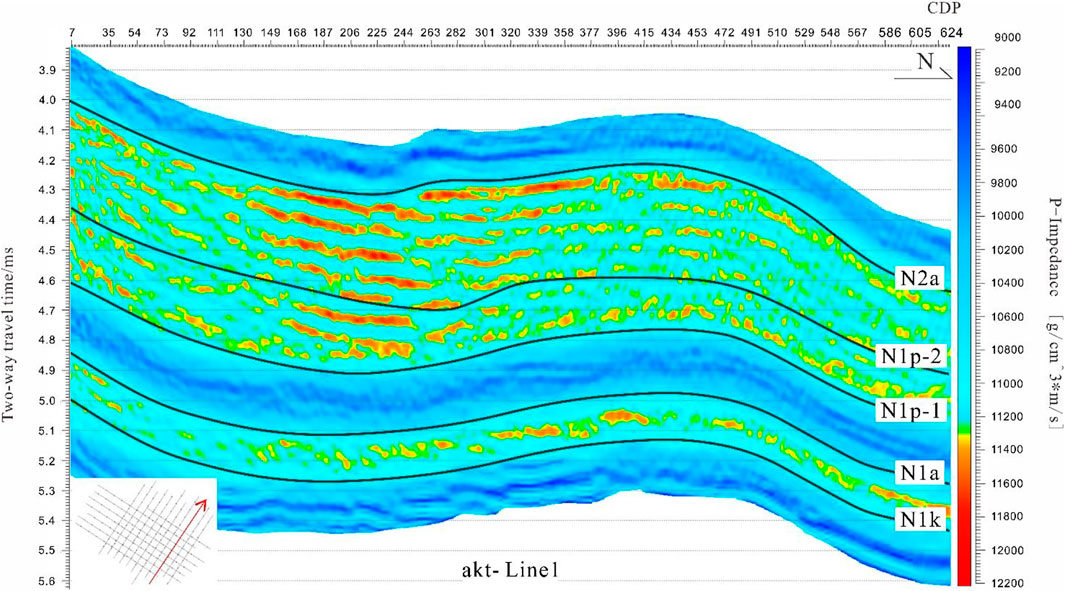
The seismic wave impedance inversion profile of Miocene strata in the Aketao area (Figure 9) shows that sand bodies characterized by low impedance are present in both the Pakabulake and Keziluoyi formations. The upper member of the Pakabulake Formation shows the highest number of sand bodies, which occur in a discontinuous layered form; the high positions of the slope and two flanks of the anticline have extremely well-developed sand bodies. In the Keziluoyi Formation, sand bodies are relatively well-developed, and also have a layered discontinuous distribution. The scale of sand bodies in the Anjuan Formation is considerably smaller than that in either the Keziluoyi or Pakabulake formations. The inversion profile clearly presents a shape that corresponds well to the forward modeling results of the reservoir geologic model; furthermore, their waveform characteristics and amplitude energies can be successfully correlated. In addition, the sand body thickness identified by the seismic inversion is comparable to the designed thickness of the model, which indicates good performance in quantitatively determining the thickness of thin sand bodies.
The development and evolution of Miocene sand bodies are characterized in the wave impedance inversion map of Miocene strata in the Aketao area (Figure 10). During deposition of the Keziluoyi Formation, the hydrodynamic energy of the aqueous environment was high (Figure 10A). Then, during deposition of the Anjuan Formation, the water depth increased and the hydrodynamic energy decreased (Figure 10B). Finally, as is made evident in Figure 10C, deposition of the Pakabulake Formation was associated with a regressive aqueous sedimentary environment. As the hydrodynamic energy of water gradually increased, its capacity to transport clastic particles from the provenance area also increased. Moreover, indicating extended transportation, before ultimately being deposited in the fan delta and shore-shallow lake settings in areas far away from the source region.

FIGURE 10. Wave impedance inversion maps of Miocene strata in the Aketao area. (A) Wave impedance inversion map of the Keziluoyi Formation. (B) Wave impedance inversion map of the Anjuan Formation. (C) Wave impedance inversion map of the Pakabulake Formation.
Analysis of application performance
The Miocene Keziluoyi and Atushi formations of the Aketao structural belt represent fan delta deposition in a piedmont zone, and the reservoir is mainly composed of fine-grained sandstone and siltstone of the braided river channel sub-facies. In this study, the sedimentary facies distribution in the study area was investigated based on seismic attributes and facies. The Aketao and Kekeya structural belts share similar seismic reflection characteristics; hence, theoretically, their sedimentary facies characteristics should also be similar. Owing to the fact that the Aketao area lacks drilling and well logging data, Well kky in the Kekeya area was projected onto the 2D seismic profile of the Aketao survey area and the lithology within the well was correlated with the sedimentary micro-facies in the Aketao area. The seismic facies characteristics corresponding to the sedimentary facies characteristics are shown below. The main source of sediment in the Aketao structural belt was from the southeast. During deposition of the Keziluoyi Formation, the water carrying sediment was relatively highly hydrodynamic. Under such circumstances, the area near to the source experienced fan delta plain and front deposition, while the area far from the source experienced shore-shallow lake deposition (Figure 11A). An overall transgression occurred during the Juanju period, with increased water depth accompanied by a drop in hydrodynamic energy. Correspondingly, the southeastern part of the study area near the sediment source was associated with the development of fan delta front deposition, while shore-shallow lake deposition occurred far away from the source (Figure 11B). Subsequently, deposition of the Pakabulake Formation was accompanied by a regression and intensified hydrodynamics within the sedimentary environment. Both the upper and lower members of the Pakabulake Formation in the study area mainly consist of fan delta plain deposits, while shore-shallow lake deposition occurred some distance away from the source area (Figure 11C).

FIGURE 11. Sedimentary facies distribution maps of the Miocene target layers in the Aketao structural belt. (A) Sedimentary facies distribution map of the Keziluoyi Formation. (B) Sedimentary facies distribution map of the Juanju Formation. (C) Sedimentary facies distribution map of the Pakabulake Formation.
On the basis of the analysis presented above, a clarified sedimentary model of the Miocene Pakabulake Formation in the Aketao structural belt was constructed (Figure 12). Furthermore, under the joint constraints of the seismic response characteristics, forward modeling, and reservoir seismic inversion, seismic reflection and facies belt characteristics were quantitatively investigated, for cases where thin sandstone and mudstone layers are interbedded and there are diverse sand/formation thickness ratios (Table 2).

TABLE 2. Sand/formation thickness ratios, seismic response characteristics, and facies belt characteristics in the Aketao area.
Conclusion
(1) To investigate the sand body distribution regularity in less-explored areas with sparse 2D seismic survey grids, inferior seismic data quality, and a lack of drilled wells, this study proposed an approach involving the use of 3D seismic data from an adjacent area to guide 2D seismic data processing and interpretation in the area of interest, while offsetting the lack of wells in the study area by referring to well data from an adjacent area—in other words, to exploit the research findings and drilling and well logging data of an adjacent highly-explored 3D seismic survey area. Furthermore, I integrated forward modeling based on the elastic wave equation and constrained sparse spike inversion of post-stack seismic data to identify sand bodies.
(2) Seismic reflection characteristics (e.g., wave group correlations and event characteristics) were compared, and the clustering characteristics of seismic waveform features were analyzed. The results demonstrate that the northeastern profile of the 2D survey line of the Pakabulake Formation in the Aketao area is associated with an SW‒NE-oriented seismic facies variation of “high amplitude‒mid-high amplitude‒ low amplitude”. This illustrates that a set of sand bodies, prograding and gradually thinning towards the basin interior, have developed following the provenance direction; these occur as an internal wedge-shaped sedimentary unit of the progradational reflection configuration on the seismic profile.
(3) Based on forward modeling using the elastic wave equation, the seismic reflection characteristics of sand bodies with different thicknesses were quantitatively investigated, for cases where thin sandstone and mudstone layers are interbedded and have variable sand/formation thickness ratios. When the sand/formation thickness ratio was .5–.6, the reflection response feature of the mudstone band took the form of a high-amplitude crest reflection, while that of the sandstone band took the form of a high-amplitude valley reflection. Moreover, the wave group characteristics were independent of reservoir type. Following the provenance direction, the sand bodies gradually thinned and the sand/formation thickness ratio decreased. A thicker sand body was necessarily associated with a stronger seismic reflection. The seismic reflection energy showed a peak when there was interbedding of sandstone and mudstone with a moderate sand/formation thickness ratio.
(4) For a study area that lacked drilling and 3D seismic data, constrained sparse spike inversion of post-stack seismic data was performed to reduce wavelet side lobes and the tuning effects of wavelets, and truly restore sand body thickness. In so doing, the stratigraphic‒lithologic trap of the Miocene Pakabulake Formation was identified. Moreover, the sand body thickness identified by the seismic inversion was comparable to the designed thickness of the model; hence, the sand body thickness was quantitatively estimated.
Data availability statement
The original contributions presented in the study are included in the article/Supplementary Material, further inquiries can be directed to the corresponding author.
Author contributions
All authors contributed to the study’s conception and design. SX: conceptualization, methodology, software, investigation, analysis, validation, visualization, interpretation, writing the original draft. QY: conceptualization, methodology, validation, visualization, interpretation. ZJ: software, investigation, analysis, validation, visualization, interpretation, writing the original draft. LW: software, investigation, visualization, writing the original draft. GJ: conceptualization, visualization, interpretation. XJ: visualization, interpretation.
Funding
This research was supported by the 13th Five-Year National Science and Technology Major Project “Research on Key Technologies of Geophysical Exploration in Lower Paleozoic-Precambrian” (No. 2016ZX05004-003).
Conflict of interest
The authors declare that the research was conducted in the absence of any commercial or financial relationships that could be construed as a potential conflict of interest.
Publisher’s note
All claims expressed in this article are solely those of the authors and do not necessarily represent those of their affiliated organizations, or those of the publisher, the editors and the reviewers. Any product that may be evaluated in this article, or claim that may be made by its manufacturer, is not guaranteed or endorsed by the publisher.
References
Butler, S. L., and Sinha, G. (2012). Forward modeling of applied geophysics methods using Comsol and comparison with analytical and laboratory analog models. Comput. Geosciences 42, 168–176. doi:10.1016/j.cageo.2011.08.022
Butler, S. L., and Zhang, Z. (2016). Forward modeling of geophysical electromagnetic methods using Comsol. Comput. Geosciences 87, 1–10. doi:10.1016/j.cageo.2015.11.004
Chen, H., Li, K., Li, Y., Wu, H., Cheng, X., Zeng, C., et al. (2018). The segmentation deformation of the thrust belt in front of Western Kunlun, Western China, and its controlling factors[J]. Acta Petrol. Sin. 34 (7), 1933–1942. In Chinese.
Chen, Z. 2021. “Application of prestack seismic inversion in the quantitative prediction of sand bodies in Pinghu Formation, Xihu Sag, East China Sea Basin[C],“ in AGU Fall Meeting Abstracts, New Orleans, LA, December 13-17, 2021, 2021: EP55D-1132.
Cheng, X., Huang, Z., Chen, H., Du, Z., Li, K., and Shi, J. (2012). Fault characteristics and division of tectonic units of the thrust belt in the front of the West Kunlun Mountains[J]. Acta Petrol. Sin. 28 (8), 2591–2601. (In Chinese).
Coléou, T., Poupon, M., and Azbel, K. (2003). Unsupervised seismic facies classification: A review and comparison of techniques and implementation. Lead. Edge 22 (10), 942–953. doi:10.1190/1.1623635
Du, J. H., Wang, Z. M., Lei, G. L., and Hu, J. F. (2011). A Discovery in well kedong-1 and its exploration significance. China Pet. Explor. 16 (2), 1–5,11,85. doi:10.3969/j.issn.1672-7703.2011.02.001
Duan, L. D., Zhao, Z. L., and Hui, Y. (2011). 2D Seismic Facies Analysis Constrained by Multi-source Information[J]. J. Oil Gas Technol. 33 (4), 66–71. (In Chinese).
Duan, X., Zhang, Z., Xu, D., et al. (2020). “Application of Facies-Control Geostatistical Inversion Method Based on Seismic Data Optimization[C],” in 82nd EAGE Annual Conference & Exhibition, Amsterdam, The netherlands, 18 - 21 OCTOBER 2021 (European Association of Geoscientists & Engineers), 1–5.2020.
Favorskaya, A. V., Zhdanov, M. S., Khokhlov, N. I., and Petrov, I. B. (2018). Modelling the wave phenomena in acoustic and elastic media with sharp variations of physical properties using the grid-characteristic method. Geophys. Prospect. 66 (8), 1485–1502. doi:10.1111/1365-2478.12639
Gao, S. C., and Yuan, Z. W. (2016). Seismic attributes in facies prediction—sequential stochastic pattern recognition methods[J]. Prog. Geophys. 31 (3), 1066–1072. In Chinese. doi:10.6038/pg20160319
Garia, S., Pal, A. K., Ravi, K., and Nair, A. M. (2019). A comprehensive analysis on the relationships between elastic wave velocities and petrophysical properties of sedimentary rocks based on laboratory measurements. J. Petroleum Explor. Prod. Technol. 9 (3), 1869–1881. doi:10.1007/s13202-019-0675-0
Hansen, T. M., Cordua, K. S., Jacobsen, B. H., and Mosegaard, K. (2014). Accounting for imperfect forward modeling in geophysical inverse problems — Exemplified for crosshole tomography. Geophysics 79 (3), H1–H21. doi:10.1190/geo2013-0215.1
Li, J., Liu, G., Qiao, X., Xiong, X., Wang, X., Liu, D., et al. (2019). “Rupture characteristics of the 25 November 2016 Aketao earthquake (M w 6.6) in eastern Pamir revealed by GPS and teleseismic data[M],” in Earthquakes and multi-hazards around the Pacific rim (Switzerland: Birkhäuser), II, 49–61.
Li, W., Yue, D., Colombera, L., Du, Y., Zhang, S., Liu, R., et al. (2021). Quantitative prediction of fluvial sandbodies by combining seismic attributes of neighboring zones. J. Petroleum Sci. Eng. 196, 107749. doi:10.1016/j.petrol.2020.107749
Li, W., Yue, D., Wang, W., Wu, S., Li, J., et al. (2019). Fusing multiple frequency-decomposed seismic attributes with machine learning for thickness prediction and sedimentary facies interpretation in fluvial reservoirs. J. Petroleum Sci. Eng. 177, 1087–1102. doi:10.1016/j.petrol.2019.03.017
Li, X. Y., Li, D. Q., Wang, B. Y., Shen, J. X., and Bai, S. Y. (2014). The forward modeling method of thin interbeding based on wave equation[J]. Prog. Geophys. 29 (6), 2697–2701. In Chinese. doi:10.6038/pg20140634
Liu, J. Z., Zhang, S. F., Guan, J., and Zhao, W. J. (2008). Sedimentary characteristics of Jurassic fan delta in Chepaizi area, northwest margin of Junggar Basin[J]. Special Oil Gas Reservoirs 15, 27–30. (In chinese).
Liu, Y. H., Gong, W. Y., Zhang, G. H., Zhang, G. F., and Shan, X. J. (2018). Study of the D-InSAR deformation field and seismotectonics of the Aketao M W 6.6 earthquake on November 25, 2016 constrained by Sentinel-1A and ALOS2[J]. Chin. J. Geophys. 61 (10), 4037–4054. doi:10.6038/cjg2018L0442
Liu, Y. Z., and Zhang, Z. F. (2014). Application of pseudo-well inversion technique of 2D combind with 3D[J]. J. Oil Gas Technol. 36 (12), 90–93. In Chinese.
Ma, C., Gao, Y., and Lu, C. (2019). Numerical modeling of elastic wave in frequency-domain by using staggered grid fourth-order finite-difference scheme. Adv. Geo-Energy Res. 3 (4), 410–423. doi:10.26804/ager.2019.04.08
Ma, R., Ba, J., Carcione, J., Lebedev, M., and Wang, C. (2021). Experimental Study on Petrophysical Properties as a Tool to Identify Pore Fluids in Tight-Rock Reservoirs. Front. Earth Sci. 9, 652344. doi:10.3389/feart.2021.652344
Meyer, B. L., and Nederlof, M. H. (1984). Identification of source rocks on wireline logs by density/resistivity and sonic transit time/resistivity crossplots[J]. AAPG Bull. 68 (2), 121–129. doi:10.1306/AD4609E0-16F7-11D7-8645000102C1865D
Mo, W. L., Lin, T., Zhang, Y., Yi, S. W., Wang, D. L., and Zhang, L. (2013). Hydrocarbon origin and accumulation model of Kedong-Kekeya tectonic belt in piedmont of West Kunlun Mountain[J]. Petroleum Geol. Exp. 35 (4), 364–371. (In Chinese). doi:10.11781/sysydz201304364
Qiao, Z., and Du, L. J. (2016). Research on impedance forward and inversion parameters of constrained sparse spike method[J]. Mar. Geol. Front. 32 (8), 52–58. In Chinese. doi:10.16028/j.1009-2722.2016.08007
Roksandić, M. M. (1978). Seismic facies analysis concepts[J]. Geophys. Prospect. 26 (2), 383–398. doi:10.1111/j.1365-2478.1978.tb01600.x
Sa, L. M., Yang, W. Y., Yao, F. C., Yin, X. Y., and Yong, X. S. (2015). Past, present, and future of geophysical inversion[J]. Oil Geophys. Prospect. 50 (1), 184–202. (In Chinese). doi:10.13810/j.cnki.issn.1000-7210.2015.01.028
Shi, X. Q. (2016). Study on natural gamma-ray model reconstruction method[J]. Lithol. Reserv. 28 (4), 95–100. (In Chinese). doi:10.3969/j.issn.1673-8926.2016.04.013
Su, Z., Liu, Y. F., Han, J. F., Yang, S. W., Liu, B., Lai, P., et al. (2019). Application of ultra-deep sandstone reservoirs prediction technology under seismic facies controlled in Yudong Block of Tabei Uplift, Tarim Basin[J]. Nat. Gas. Geosci. 31 (2), 295–306. (In Chinese). doi:10.11764/j.issn.1672-1926.2019.10.012
Sun, D., Shi, X. Q., Wang, Z. Q., Chen, L. X., Wang, J., Sun, J. Q., et al. (2018). The influence of Permian igneous rock on the seismic imaging[J]. Nat. Gas. Geosci. 28 (12), 1781–1787. (In Chinese). doi:10.11764/j.issn.1672-1926.2018.10.019
Sun, L. P., Zheng, X. D., Shou, H., Li, J. S., and Li, Y. D. (2010). Quantitative prediction of channel sand bodies based on seismic peak attributes in the frequency domain and its application. Appl. Geophys. 7 (1), 10–17. doi:10.1007/s11770-010-0009-y
Suotang, F. U., Dade, M. A., Zhaojie, G. U. O., and Cheng, F. (2015). Strike-slip superimposed Qaidam Basin and its control on oil and gas accumulation, NW China. Petroleum Explor. Dev. 42 (6), 778–789. doi:10.1016/s1876-3804(15)30074-4
Tang, L. J., Huang, T. Z., Qiu, H. J., Qi, L., Yang, Y., Xie, D., et al. (2012). Salt-related structure and deformation mechanism of the Middle-Lower Cambrian in the middle-west parts of the Central Uplift and adjacent areas of the Tarim Basin. Sci. China Earth Sci. 55 (7), 1123–1133. doi:10.1007/s11430-012-4414-3
Tao, Y. G., Yuan, G., Chen, X. A., Niu, H. Y., Kong, X., and Zhao, W. D. (2007). Application of relative amplitude method to merging processing of 2-D seismic data and reservoir prediction technique in southwestern Tarim[J]. Lithol. Reserv. 19 (1), 96–100. (In Chinese).
Tiab, D., and Donaldson, E. C. (2015). Petrophysics: Theory and practice of measuring reservoir rock and fluid transport properties[M]. Netherlands: Gulf professional publishing-Elsevier.
Tian, L., Zhang, H. Q., Liu, J., Zhang, N., and Shi, X. (2020). Distribution of Nanhua-Sinian rifts and proto-type basin evolution in southwestern Tarim Basin, NW China[J]. Petroleum Explor. Dev. 47 (6), 1206–1272. (In Chinese). doi:10.1016/S1876-3804(20)60130-1
Vedanti, N., Malkoti, A., Pandey, O. P., and Shrivastava, J. P. (2018). Ultrasonic P- and S-Wave Attenuation and Petrophysical Properties of Deccan Flood Basalts, India, as Revealed by Borehole Studies. Pure Appl. Geophys. 175 (8), 2905–2930. doi:10.1007/s00024-018-1817-x
Wang, C., Cheng, X. G., Chen, H. L., Li, K., and Fan, X. G. (2016). From folding to transpressional faulting: the Cenozoic Fusha structural belt in front of the Western Kunlun Orogen, northwestern Tibetan Plateau. Int. J. Earth Sci. 105 (5), 1621–1636. doi:10.1007/s00531-016-1305-4
Wang, H., and Li, H. M. (2015). Seismic attributes analysis based on model in fluvial sand and shale interbedded layers[J]. Reserv. Eval. Dev. 5 (3), 15–21. (In Chinese). doi:10.13809/j.cnki.cn32-1825/te.2015.03.004
Wang, Q. F., and Guo, K. (2008). Constrained Sparse Spike Inversion Applied in the Reservoir Prediction[J]. Well Logging Technol. 32 (1), 35–37. (In Chinese). doi:10.1007/s11442-008-0201-7
Wang, Q., Lu, Z. G., Guo, W., and Zhu, Y. Z. (2011). Hydrogen sulfide attenuates cardiac dysfunction in a rat model of heart failure: a mechanism through cardiac mitochondrial protection. Glob. Geol. 14 (2), 87–98. doi:10.1042/BSR20100003
Wang, X., Liu, B., Jin, J., Lu, J., Zhou, J., Qian, J., et al. (2020). Increasing the accuracy of estimated porosity and saturation for gas hydrate reservoir by integrating geostatistical inversion and lithofacies constraints. Mar. Petroleum Geol. 115, 104298. doi:10.1016/j.marpetgeo.2020.104298
Xie, Q. M., Wang, Z. L., Yin, C. M., Li, Q. Y., Liao, X., Zhao, Z. L., et al. (2019). Tectonic evolution characteristics of Yingjisha and Pishan areas and the influence on petroleum accumulation in the southwest depression, Tarim Basin[J]. Petroleum Geol. Exp. 41 (2), 165–175. (In Chinese). doi:10.11781/sysydz201902165
Yang, G., Chen, Z. X., and Wang, X. B. (2021). Multistage deformation of Yingjisha Anticline in the front of Southwestern Tarim Thrust Belt, Northwestern China[J]. Xinjiang Pet. Geol. 42 (6), 656. (In Chinese).
You, X., Wu, S., and Xu, F. (2018). The Characteristics and main control factors of hydrocarbon accumulation of ultra-deep marine carbonates in the Tarim basin, NW China--A Review[J]. Carpathian J. Earth Environ. Sci. 13 (1), 135–146. doi:10.26471/cjees/2018/013/013
Yuan, W. X., Li, T. M., Chen, H., and Liu, Z. R. (2002). Characteristics of Hydrocarbon Source Rocks in Qimugen-Sangzhuhe Area[J]. Xinjiang Geol. 20, 96–102. (In Chinese).
Yunita, Y., and Haris, A. (2018).The assessment of carbonate heterogeneity, using seismic inversion of two-dimension seismic multi vintage: A case study of North West Java Basin[C], AIP Conference Proceedings, 2023. AIP Publishing LLC, 020264.
Zhang, D. H., Jiang, C., Zhang, J., Jiang, D. H., Wang, D. P., Tang, J., et al. (2012). The application of two-dimensional impedance inversion to the Southern East China Sea[J]. Offshore oil. 32 (3), 9–12. (In Chinese).
Zhang, L., Zeng, C. M., Zhu, L. C., Feng, X. Y., and Chen, C. (2014). The discussion about the accumulation of gas in Miocene in Guman tectonic belt of Ye Cheng Sag[J]. Xinjiang Oil Gas 10 (2), 1–5. (In Chinese).
Zhang, W., Zhang, Z., and Chen, X. (2012). Three-dimensional elastic wave numerical modelling in the presence of surface topography by a collocated-grid finite-difference method on curvilinear grids. Geophys. J. Int. 190 (1), 358–378. doi:10.1111/j.1365-246x.2012.05472.x
Keywords: Tarim basin, sand body, reservoir inversion, forward modeling, quantitative prediction
Citation: Xiaoqian S, Yongqiang Q, Junfeng Z, Wenhao L, Juanjuan G and Junfa X (2023) Quantitative prediction of sand bodies in a sparsely explored zone of the Tarim basin: A case study of the aketao area. Front. Earth Sci. 10:1030782. doi: 10.3389/feart.2022.1030782
Received: 29 August 2022; Accepted: 12 December 2022;
Published: 13 January 2023.
Edited by:
David Gomez-Ortiz, Rey Juan Carlos University, SpainReviewed by:
Hualing Zhang, Research Institute of Petroleum Exploration and Development (RIPED), ChinaGuangyou Zhu, Research Institute of Petroleum Exploration and Development (RIPED), China
Copyright © 2023 Xiaoqian, Yongqiang, Junfeng, Wenhao, Juanjuan and Junfa. This is an open-access article distributed under the terms of the Creative Commons Attribution License (CC BY). The use, distribution or reproduction in other forums is permitted, provided the original author(s) and the copyright owner(s) are credited and that the original publication in this journal is cited, in accordance with accepted academic practice. No use, distribution or reproduction is permitted which does not comply with these terms.
*Correspondence: Zhou Junfeng, emhvdV9qZkBwZXRyb2NoaW5hLmNvbS5jbg==
 Shi Xiaoqian
 Qu Yongqiang1
 Xie Junfa