
94% of researchers rate our articles as excellent or good
Learn more about the work of our research integrity team to safeguard the quality of each article we publish.
Find out more
ORIGINAL RESEARCH article
Front. Earth Sci., 06 January 2023
Sec. Geohazards and Georisks
Volume 10 - 2022 | https://doi.org/10.3389/feart.2022.1029929
This article is part of the Research TopicAdvanced Application of Deep Learning, Statistical Modelling, and Numerical Simulation on Geo-Environmental HazardsView all 59 articles
 Pinpin Li1
 Wenge Qiu1
 Feng Lu1,2*
 Qingwen Yang3*
 Zhenyu Chen2
 Linlong Li2
 Yi Wang2
 Meiben Gao2Zhiheng Deng1
The Sichuan-Tibet Railway is faced with risks of active faults, unfavorable geological conditions, high in-situ stress levels, and a high potential for Traditional tunnel seismic measures that can no longer guarantee the safety of tunnel structures in high-intensity earthquake areas. The new shock absorption capacity layer with resistance-limiting is proposed in this paper and the resistance-limiting shock absorption principle. To study the safety of the new anti-shock lining structure, a large-scale quasi-static model test was carried out based on the improved static-dynamic coupling shear force. The test analyzes the response rules of strain, structural internal force, and lining failure form of tunnel lining, taking into consideration three influencing factors including layer layout position, layout density, and tunnel buried depth. The results showed that: 1) Under the action of low-cycle reciprocating shear strain, the failure mode of the shallow buried tunnel is mainly the tensile failure of the arch waist and the failure of the arch waist and the side wall, and the failure mode of the deeply buried tunnel is mainly the compression failure of the arch waist; 2) Compared with the case of no shock absorption layer, the lining tensile stress on the inner side of the arch waist position is significantly reduced. Under the high shear strain (0.20%), the increased tensile stress trend was slowed down on the inner side walls; 3) The main working area of the resistance-limiting layer can effectively improve the lining stress distribution underground vibration and protects the tensile damage on the arch waist to the side wall. The width and depth of the crack are weakened and the seismic bearing capacity of the width and depth of the crack is weakened and the seismic bearing capacity of the lining structure is greatly strengthened; 4) The lining cracks without the resistance limiting layer develop violently, and the crack at the arch waist runs The lining structure failure mode of the resistance limiting layer arranged at the arch waist is similar to The lining structure failure mode of the resistance limiting layer.
The Sichuan-Tibet Railway passes through the Qinghai-Tibet Plateau, where the topography and geological structure are extremely complex. There are 69 tunnels in the section from Ya’an to Lingzhi of the Sichuan-Tibet Railway, with a total length of 842 km, and the tunnel ratio is about 83% (Tian et al., 2021). The Ya’an-Lingzhi railway directly passes through close to 10 large regional active fault zones, such as the Longmenshan fault zone and Xianshuihe fault zone, with a high potential risk of strong earthquakes (Xue et al., 2020; Guo et al., 2021). Strong earthquakes have occurred many times in history and caused heavy casualties. For example, the MS8.6 earthquake in Motochazu in 1950, the MS7.6 earthquake in Kangding in 1786, and the MS8.0 earthquake in Wenchuan in 2008 (Shen et al., 2014; Zhou et al., 2021; Cui et al., 2022). In general, the seismic performance of underground structures is better than that of above-ground structures, but special locations of underground structures in high-intensity zones can be severely damaged by earthquakes, especially when the strength of surrounding rocks is low and the lining is damaged and degraded (Lu et al., 2022). A total of 24 tunnel structures were damaged in the Wenchuan earthquake, which seriously affected the rescue and post-disaster reconstruction in the disaster area (Cui et al., 2013; Cui et al., 2021). Similar tunnel damage occurred in several earthquakes in Taiwan Province and Japan (Wang et al., 2001; Kazuhide et al., 2007). It is necessary to study the theory of seismic mitigation techniques for tunnel structures in high-intensity seismic zones.
There are two ways to dampen earthquakes in tunnel construction, installing damping layers and grouting to reinforce the surrounding rock by reducing its stress and serving to protect the tunnel lining (Gao et al., 2005; Ling and Gao, 2008). The damping layer can weaken the surrounding rock restraining effect on the lining during earthquakes and absorbing dynamic strain or relative dynamic displacement between the lining and the surrounding rock (Zhao et al., 2013). At the same time, the light damping material can deform with the surrounding rock as flexible support, which can release the deformation load of the surrounding rock. The resistance-limiting damping layer reduces the deformation pressure of the second lining, improves the structural stress state, make its force more uniform, reduce the risk of cracking of the tunnel secondary lining, suitable for high ground stress and high seismic intensity lining anti-seismic design requirements in Sichuan-Tibet region.
Conventional methods for tunnel seismic testing are the ordinary shaker test (Geng et al., 2013; Li B. T. et al., 2021), the centrifuge shaker test, and the quasi-static test (Kazuhide et al., 2007; Qiu et al., 2020). The quasi-static test refers to the static testing of a structure employing a reciprocating cyclic loading to simulate the force and deformation characteristics of a structure under seismic action (Prasad et al., 2004). The quasi-static method transforms the dynamic motion problem into a static problem, circumvents the use of dynamic testing instruments, and can be completed by using general static testing instruments. By controlling the model size and test similarity ratio reasonably, combined with the recursive neural network, deep belief network, and error decomposition correction algorithm to improve the accuracy of test results (He and Kusiak, 2017; Li et al., 2021a; Li et al., 2021b), it can truly reflect the seismic response of rock and soil mass and tunnel lining structure (Qiu et al., 2017).
This paper proposes a quasi-static test method for the seismic response of tunnel structures with constant resistance limits based on shear deformation control using a new static-dynamic coupled shear model box developed independently. The seismic response of limit resistance layer composite lining structure was researched to provide the reference for tunnel damping design in the high-intensity earthquake zone.
The object in tunneling is always in semi-infinite soil, and model tests are often carried out on a reduced scale due to site and method constraints. Properly setting the boundary conditions of the test chamber is the key to ensuring the correctness of the test results, especially for seismic response tests.
At present, the two main types of model boxes commonly used in tunnel seismic response shaker tests are rigid boxes and laminated shear boxes. Rigid model boxes are usually made of welded steel frames, which are set up with flexible materials on the inner walls of the box to absorb the energy reaching the boundary and weaken or eliminate the interference of reflected waves on the test results. However, due to the presence of the flexible material, the boundary soil may bend and deform under static conditions, and this phenomenon becomes more obvious as the test depth increases, resulting in a certain degree of distortion of the test results. The model box consists of multiple layers of rigid frames stacked and assembled, with balls or bearings between each layer and a limiting device on the outside of the box. The laminated shear model box can achieve the shear motion of the soil layer and satisfy the dynamic boundary conditions, while the rigid boundary can also satisfy the static boundary conditions. However, the laminated frame can lead to discontinuous forces and deformation of the soil inside the model box, which affects the accuracy of the test results.
The static-dynamic coupled shear model box developed by Wenge Qiu’s team at Southwest Jiaotong University is capable of achieving shear motion of the soil layer under the action of shear waves and satisfying both static and dynamic boundary conditions, and the effectiveness of the model box is verified by shaking table tests. In addition, a comparative study of the dynamic and quasi-static tests was carried out to verify the feasibility of using this model box for the quasi-static tests (Qiu et al., 2016). The new model box is shown in Figure 1 below and the design points are as follows:
1) The dynamic-static coupled shear model box is a closed box working as a constraining role, used to simulate the boundary of the surrounding rock, to be able to meet the static boundary conditions.
2) The transverse boundary of the model box is a rigid whole, and the longitudinal boundary is assembled by five pieces of reinforcing steel plates respectively and is hinged to the transverse boundary by 0.02 m thick steel bars.
3) A set of counter-tension springs is set up between the lateral opposite boundaries to provide damping for shear deformation in the lateral direction of the model box by adjusting the parameters of the spring set.
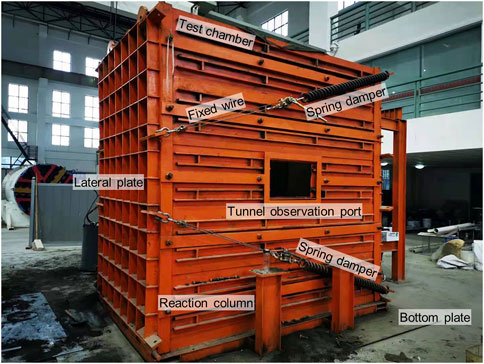
FIGURE 1. Dynamic-static coupling model box.
The controlling factor for the seismic response of underground structures is not the seismic inertia force of the structure, but the deformation response of the soil around the structure under seismic action (Han et al., 2021). The soil deformation response can be characterized in the form of soil deformation amplitude and displacement distribution, as shown in Figure 2. The main purpose of the quasi-static test of the soil-subsurface structural system is to examine the seismic performance of the structure, and the soil deformation amplitude u is a process quantity during the test; therefore, the main factor affecting the test results is the form of the soil displacement distribution. In summary, this paper normalizes the soil displacement distribution in the free-field model as the equivalent seismic load distribution to which the structure is subjected.
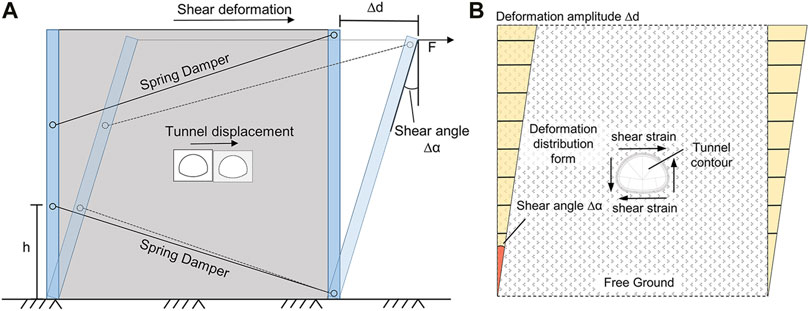
FIGURE 2. Quasi-static shear force model. (A) Shear deformation of the model box. (B) Equivalent seismic load on the tunnel.
The shear deformation of the tunnel structure is positively correlated with the peak seismic acceleration and the theoretical value of the seismic shear strain γ can be calculated using Eqs. 1, 2.
where
where
The peak seismic velocity can be corresponded to the seismic intensity according to the China Seismic Intensity Scale (GB/T17742-2008). The maximum shear strain value of the soil is obtained by recording the horizontal displacement of the model box utilizing a laser displacement meter. The laser displacement meter is set at a height of 1.5 m outside of the model box and a vibrating string displacement meter is at the center of the box side.
Tunnel damage is not only caused by inertial forces but most by an increase in additional structure stresses due to a mismatch between the stiffness of the tunnel and the surrounding rock. The primary support is usually composed of a grid steel frame and shotcrete, and the secondary lining is usually composed of molded concrete and a reinforced skeleton (Qiu et al., 2019). During earthquakes, the tunnel cannot fully deform with the surrounding rock due to the structural stiffness being too large and the tunnel structure will inhibit the deformation of the surrounding rock, thus causing an increase in additional structure stresses and resulting in tunnel damage.
The resistance-limiting shock absorption layer is a large travel combination buffer layer that utilizes the post-peak properties of the material to provide support and deformation in the circular and radial directions of the tunnel, effectively releasing the stresses in the tunnel and making the tunnel structure more stable and reliable (Anagnostou and Cantieni, 2007). The layer is placed between the liner and the surrounding rock, changing the original rigid system (liner-rock) into a rigid-flexible-rigid system (liner- Resistance-limiting layer-rock). The purpose is to separate the liner from the surrounding rock by the damping layer, reducing the inertia forces on the lining structure (Qiu et al., 2018). Seismic loads are high-frequency reciprocating vibratory loads, not uniaxial compression or shear loads. The layer absorbs vibratory loads and reduces the maximum peak vibratory load and maximum peak displacement of the lining. The design concept of the constant resistance limiter is shown in Figure 3 [using the standard Sichuan-Tibet Line tunnel (standard three-center circle tunnel) as an example].
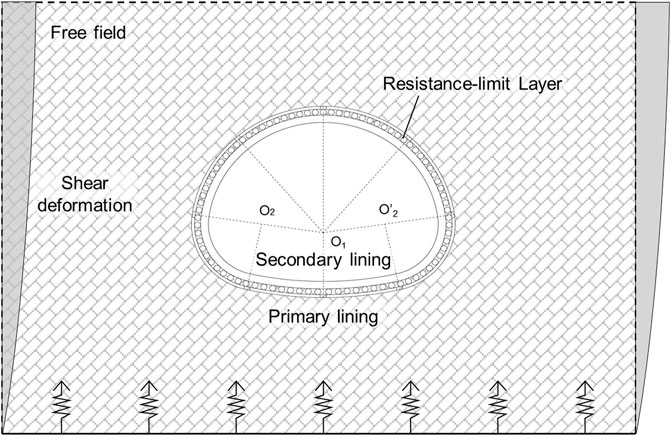
FIGURE 3. Model of the Resistance-limiting shock absorption layer.
The quasi-static test was completed at the Key Test Laboratory of the Ministry of Education for Traffic Tunnel Engineering, Southwest Jiaotong University, at the test site shown in Figure 4. The test system consists of a model test chamber, a rigid reaction frame, a traction structure, a monitoring system, etc. The baffles are rectangular acrylic panels with a horseshoe-shaped tunnel observation window to observe the tunnel interior. The dimensions of the model test box are shown in Figure 5 below. The box size is 3.0 m*3.0 m*1.8 m, the thickness of the overburden on the tunnel is 1.65 m, the thickness of the soil layer below the tunnel is 0.9 m, the distance from the tunnel to both sides of the boundary is 1.32 m, the surface of the overburden is covered with a mat plate, the mat plate through the two maximum thrust of 100T jack to apply a uniform force step by step, simulating the pressure of the ground. The main body of the model box is connected to the base plate by I-beam reinforcement, the side plates of the model box are connected to the counter force frame by displacement tractors, and the top of the model box acts on the counter force frame through jacks. The static-dynamic coupled shear model box can deform freely in the lateral direction, and drive the geotechnical model inside the box to undergo the same shear deformation so that the simulation of seismic shear wave action can be achieved in a static-like manner.
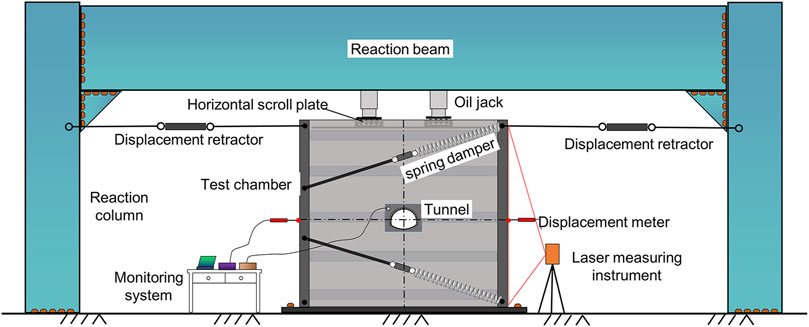
FIGURE 4. Quasi-static test site.
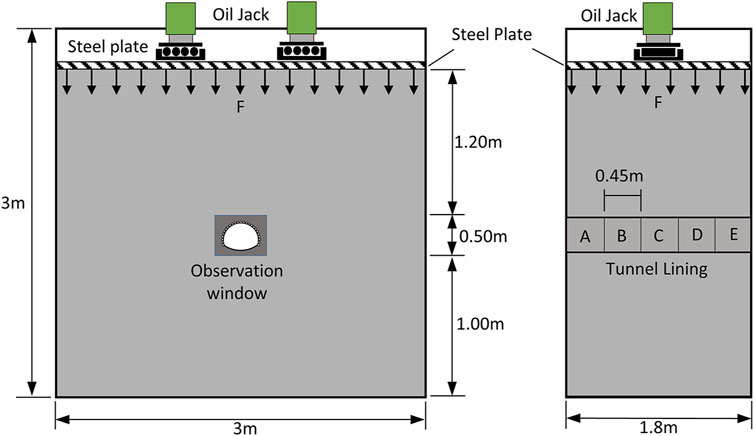
FIGURE 5. Model dimensions.
As the tunnel invert was not the main study area for this test, There is no Resistance-limiting layer in the tunnel invert. The test mainly considers two influencing factors to the damping effect: the location of the Resistance-limiting layer and the layer density. The strain response of the tunnel lining, the structural internal force response, and the lining damage form were analyzed.
A lining is not equipped with the Resistance-limiting layer; B lining is equipped with the layer in the arch waist and side wall; C lining is equipped with the layer in the vault; D lining standard arrangement of the layer; E lining is sparsely equipped with layer. The design of the layer arrangement is shown in Figure 6 shown. The test arrangement of the Resistance-limiting layer is shown in Figure 7 below and the test working conditions are shown in Table 1 below.
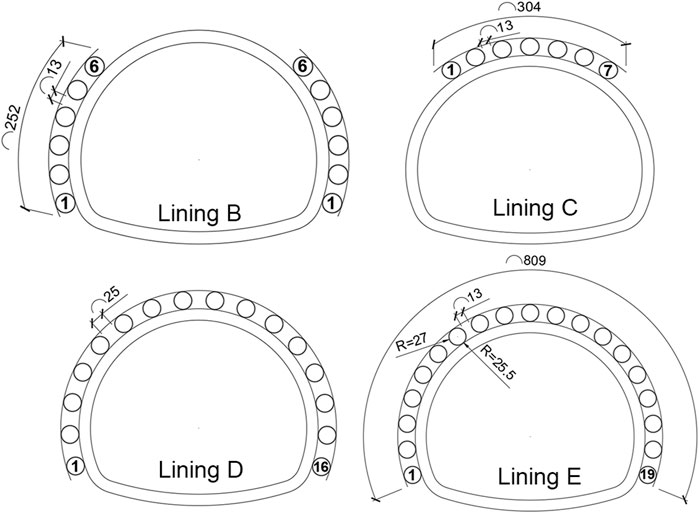
FIGURE 6. Schematic diagram of the limiting resistor arrangement.
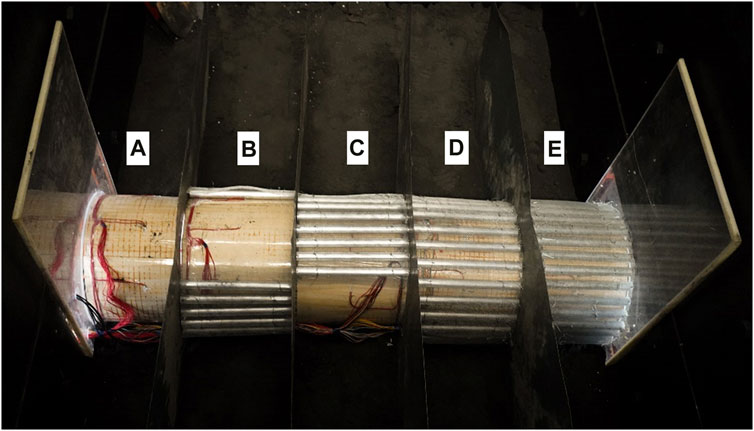
FIGURE 7. Arrangement of constant resistance limiter (A) no arrangement, (B) arragement in the arch waist and side wall, (C) arragement in the vault, (D) standard arrangement, (E) sparsely arrangement.
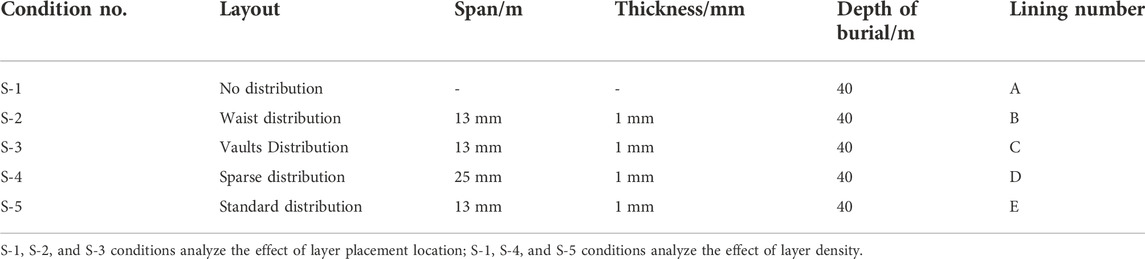
TABLE 1. Test lining models for each working condition.
The tests are based on a displacement-controlled proposed hydrostatic test study, using an artificial mass model with geometry and density selected as the basic measure. The similarity ratios for this test are respectively

TABLE 2. Similarity relations.
Considering that the primary support is composed of concrete and steel mesh (Qiu et al., 2019), the primary support in the experiment adopts a composite structure (steel wire mesh and non-woven fabric). The inner side of the wire mesh adhered to the secondary support and the outside was covered with four layers of non-woven fabric to prevent pulling apart during the test. The primary support simulates the reinforcement shotcrete and is closely fitted to the surrounding rock and can be deformed in harmony with the surrounding rock. The wire mesh (Figure 8A), non-woven fabric (Figure 8B), and lining plaster (Figure 8C) are shown below.
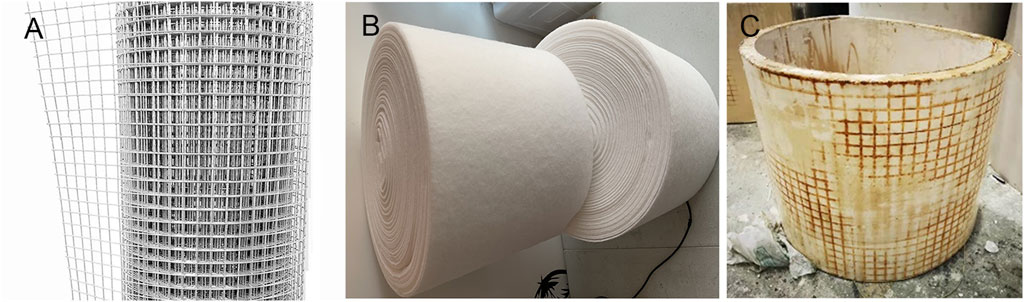
FIGURE 8. Model materials (A) Steel wire mesh, (B) Non-woven fabri, (C) Gypsum lining.
The similar materials of surrounding rock are barite powder, river sand, and motor oil, which are formulated according to the IV surrounding rock parameters (TB 10003-2016). By adjusting the ratio of similar materials, the reasonable constitutive parameters of surrounding rock can be simulated to well express the elastic-brittle, elastic-plastic, strain-softening, and other behaviors of surrounding rock (Gao et al., 2022). The concrete design grade was C30 and the thickness was 40 cm Gypsum was selected as a similar material for C30 concrete, and the ratio of gypsum/water is 1.2. The mechanical parameters of gypsum samples were obtained by axial compression test. In the process of sample loading, the axial strain stiffness curve showed a sudden change, marking the beginning of the crack of the test sample, and then the sample entered the plastic stage (Gao et al., 2018). The maximum span of the lining model was 33cm, the height 27 cm, and the thickness 1.5 cm according to the geometrically similar relationship. The surrounding rock and the lining structures’ mechanical parameters are shown in Tables 3, 4.
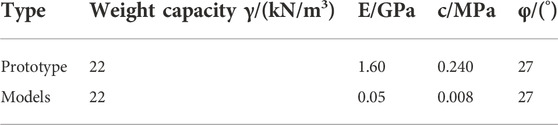
TABLE 3. Prototype and model material parameters for the surrounding rock.
TABLE 4. Prototype and model material parameters for tunnel lining structures.
The displacement tractor is connected to each side of the model box as a displacement loading device. The horizontal shear value of the model box is controlled by the displacement tractor, which causes displacement of the upper boundary of the model box, which in turn causes shear deformation of the model box and the geotechnical model. The displacement loading amplitude needs to be adjusted in real time by feedback from the monitoring system. The design flow of the quasi-static test is shown in Figure 9 below.
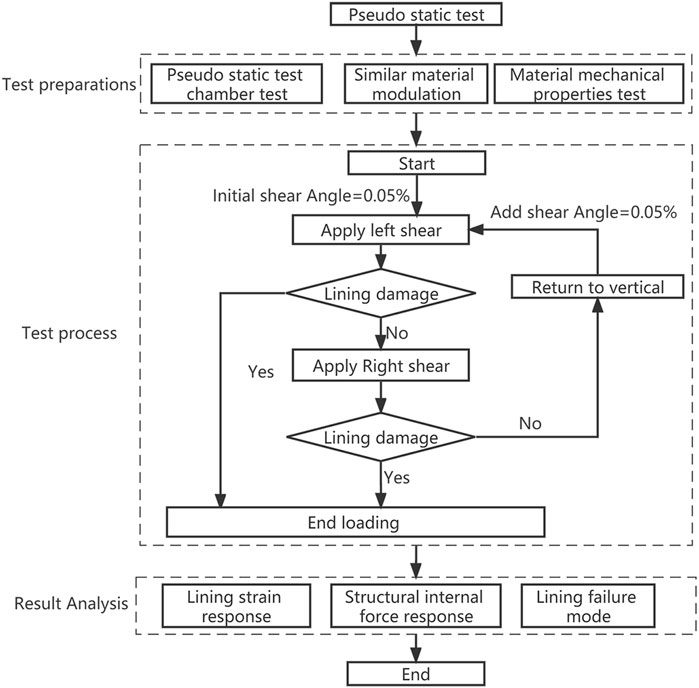
FIGURE 9. Flow chart of quasi-static test loading.
The shear deformation is applied to the test model box several times using a step-by-step reciprocal loading method. The shear deformation was controlled by real-time feedback from a displacement meter. The increment for each cycle of the shear deformation value is 0.05%. The test consisted of six reciprocal loading cycles, each of which was divided into three steps: the first step was to load the left horizontal shear strain, the second to load the right horizontal shear strain and the third to return the model box to a vertical position. After each loading, the shear variable amplitude and the response of the lining structure were recorded after the model box was stabilized. The detailed design loading method is shown in Table 5.

TABLE 5. Loading methods.
The test loading procedure is as follows:
1) Installation of the model test box, adjustment of the chamber spring dampers, and installation of the quasi-static loading system.
2) Adjustment of the vertical initial state of the model box using a vertical laser and arrangement of the test monitoring system.
3) A transverse reciprocal load is applied to the model box according to the test design requirements; a displacement load is applied to the model box in the horizontal direction through a displacement tractor, with shear deformation in the transverse direction and an initial shear angle of 0.05%.
4) The shear deformation is performed first to the left, then to the right, and finally returns to the model box vertical for one loading cycle. The shear angle loading step for each cycle is 0.05%.
5) Record the test data after each loading, observe the lining cracking or damage, consider the lining completely damaged after a penetration crack occurs in the lining and stop loading.
The sensors used in the model tests mainly consisted of strain gauges (BX120-3AA), pressure boxes, displacement transducers (TST-20), and laser levels. Strain data was collected using the dynamic-static strain test system (TST3826F) and displacement data were collected in real-time using the static displacement test system (DY3825E).
To obtain the lining internal forces, 16 strain gauges were arranged on the inner and outer surfaces of the lining. The measurement points are shown in Figure 10. Due to the limited resistance layer structure having a dense arrangement, attention needs to protect the strain gauges in contact with the layers to prevent them from being crushed. Two plaster models are placed outside of the model box as compensation gauges to exclude the influence of the extraneous environment. The displacement meters are placed at the vertical midpoint (1.5 m) on the lateral boundary of the model box in parallel to the ground. The laser level is placed on the ground in front of the model box for initial leveling and to ensure that the model box remains vertical to the ground after each cycle.
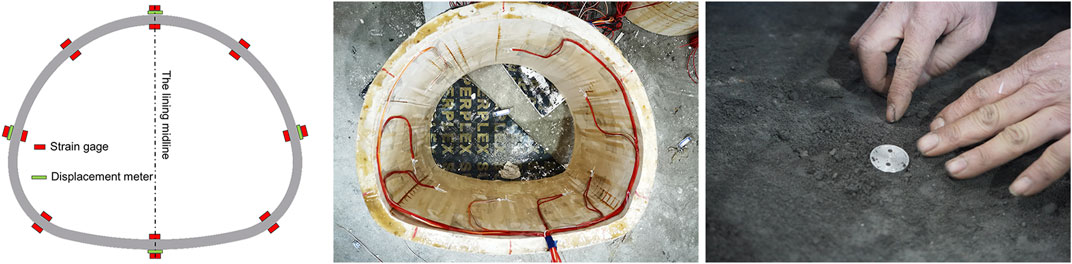
FIGURE 10. Measurement points layout.
To investigate the stress evolution process under cyclic shear deformation and the operation mode of the resistance-limiting layer, this paper investigates the structural stress characteristics of the lining at key locations, where the tensile stress is positive and the compressive stress is negative. The lining structure has a tensile strength of 50 KPa and compressive strength of 480 KPa.
The Load-Stress curves at the vault and waist of the lining are shown in Figure 11, which shows that the lining stresses at the vault and waist of the arch show a regular undulation with the reciprocal load, and increase significantly with the increase in shear angle. The stresses remain after each lining’s recovery to the middle position. The amplitude of stress vibration at the waist is significantly greater than that at the vault, which is following the law of tunnel lining stresses under seismic loading, with vault damage mainly controlled by tensile stresses and waist damage mainly controlled by compressive stresses.
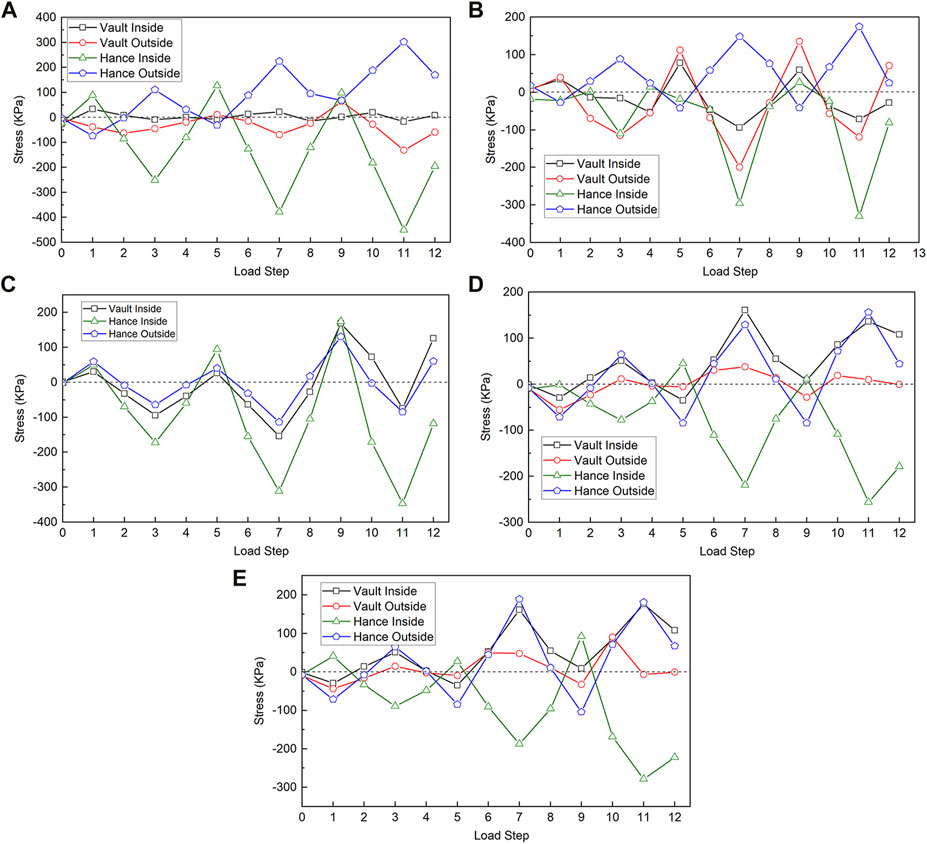
FIGURE 11. Load-Stress curves at key points in the lining (A) no arrangement, (B) arragement in the arch waist and side wall, (C) arragement in the vault, (D) standard arrangement, (E) sparsely arrangement.
Comparing Figures 11A,D, it can be seen that the maximum stress peak of lining A is −450 KPa, and at a shear angle of 1.0% the stress at the foot of the arch reaches −400 KPa, and the lining is damaged under pressure, the maximum stress peak at the arch waist of lining D is 266 KPa, which does not reach the compressive strength of the lining. The maximum stress peak and vibration amplitude of the lining can be effectively reduced by arranging a layer.
Comparing Figures 11A–C, it can be seen that after the arrangement of the Resistance-limiting layer in the waist, the peak stresses on the inside and outside of the lining structure at the waist are significantly reduced and there is little change in the stress vibration amplitude at the vault position. There is a tendency for the inside waist to change from compressive to tensile. The maximum stress peak of liner B is smaller than that of liner C, indicating that the waist arrangement of the Resistance-limiting layer is more effective in reducing the stress response to seismic shear deformation.
Comparing Figures 11D,E, it can be found that the lining stress forms are the same for both. The stress peaks at key parts of the lining are different. At shear strains of 1.0%, 1.5%, and 2.0%, the stress peaks of lining E are all greater than those of lining D, and there is some improvement in the pressure on the inside of the liner waist. The main reason is that the structural stiffness of the sparsely arranged layer is smaller, which helps to absorb the ground deformation pressure, making the shear load transferred to the liner smaller. The reasonable stiffness of the Resistance-limiting layer in practical engineering is determined by specific conditions. Considerations include the surrounding rock pressure, geological conditions, and lining type.
Figure 12 respectively represents the internal force distribution diagram of lining A∼E under different working conditions. Figure 12A1 represents the internal force response of shear deformation on the inside, and Figure 12A2 represents the stress response of shear deformation on the outside of lining A. The same rules apply to other linings (B∼E).
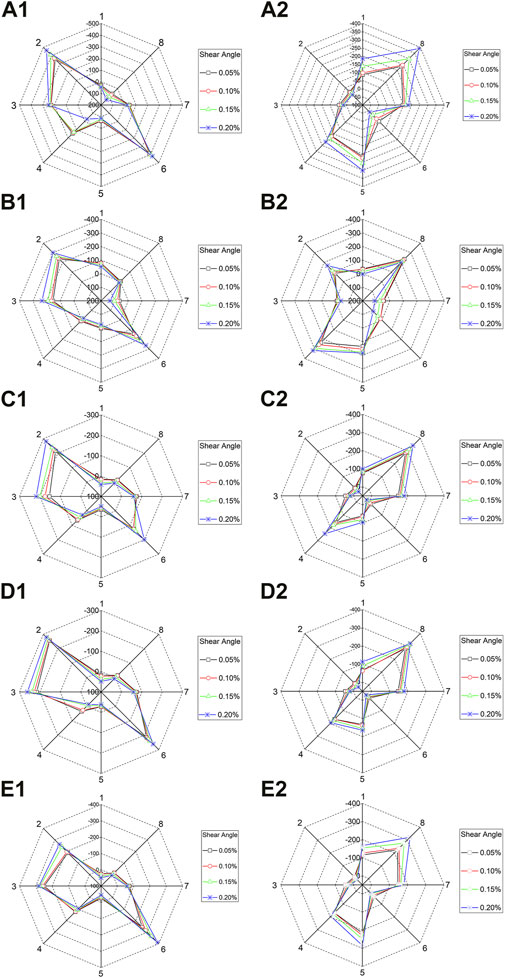
FIGURE 12. Lining internal force response (kPa).
From Figure 12A1 and Figure 12A2, it can be seen that the left side waist of the lining mainly has compressive stress on the inside and tensile stress on the outside, and the right side waist mainly has tensile stress on the inside and the inner side mainly has the tensile stress, the left side stress is generally greater than the right side stress, the outer side of the arch is under tension and the inner side of the arch is under pressure. With the increase of the shear angle, the stress value of the waist and wall corners changes greatly. The main failure form of lining A is the arch waist compression failure.
From Figure 12A and Figure 12E, it can be seen that the lining structure without the arrangement of the Resistance-limiting layer is damaged in tension on the inside of the right waist under the shear strain of 2.0%, and the tensile stress increases significantly with the increase of the shear strain amplitude. After the shear deformation value reaches 1.5%, the damage occurs on the inside of the left wall corner and the tensile stress produces a sudden change. Lining structure stress with the Resistance-limiting layer development slowly, no obvious stress concentration situation.
From Figure 12B1, Figure 12C1, and Figure 12D1, it can be seen that under the shear strain in the ground, the inner tensile and outer compressive stresses in the right side of the waist of the vault arrangement of the Resistance-limiting layer lining structure change significantly, and there is a tendency for the inside of the left wall corner to change from compressive to tensile. The liner structure with the waist arrangement and the sparse arrangement of the Resistance-limiting layer are uniformly stressed, and the internal force response is similar to that of the lining structure with the standard arrangement of the Resistance-limiting layer.
It can be seen that the main working area of the Resistance-limiting layer is from the waist to the side wall. Because of the layer’s good deformation ability, it can effectively improve the stress distribution of the lining structure in the waist under the ground vibration, and promote the stress redistribution of the lining structure. The arrangement of the Resistance-limiting layer at the vault has little effect on the seismic performance of the lining structure. On the contrary, the arrangement of the Resistance-limiting layer at the waist and side wall is more cost-effective.
The damage pattern of the lining structure under low circumferential reciprocal shear strain is shown in Figure 13. The left-hand side of the figure shows the representative cracked area and the right-hand side shows the unfolding diagram of the lining structure, where the black curve shows cracks derived from the outside lining, the red curve shows cracks derived from the inside lining and the blue curve shows cracks through the lining. Figure 13 respectively represents the lining failure of the lining (A∼E) under the working condition of the Resistance-limiting layer.
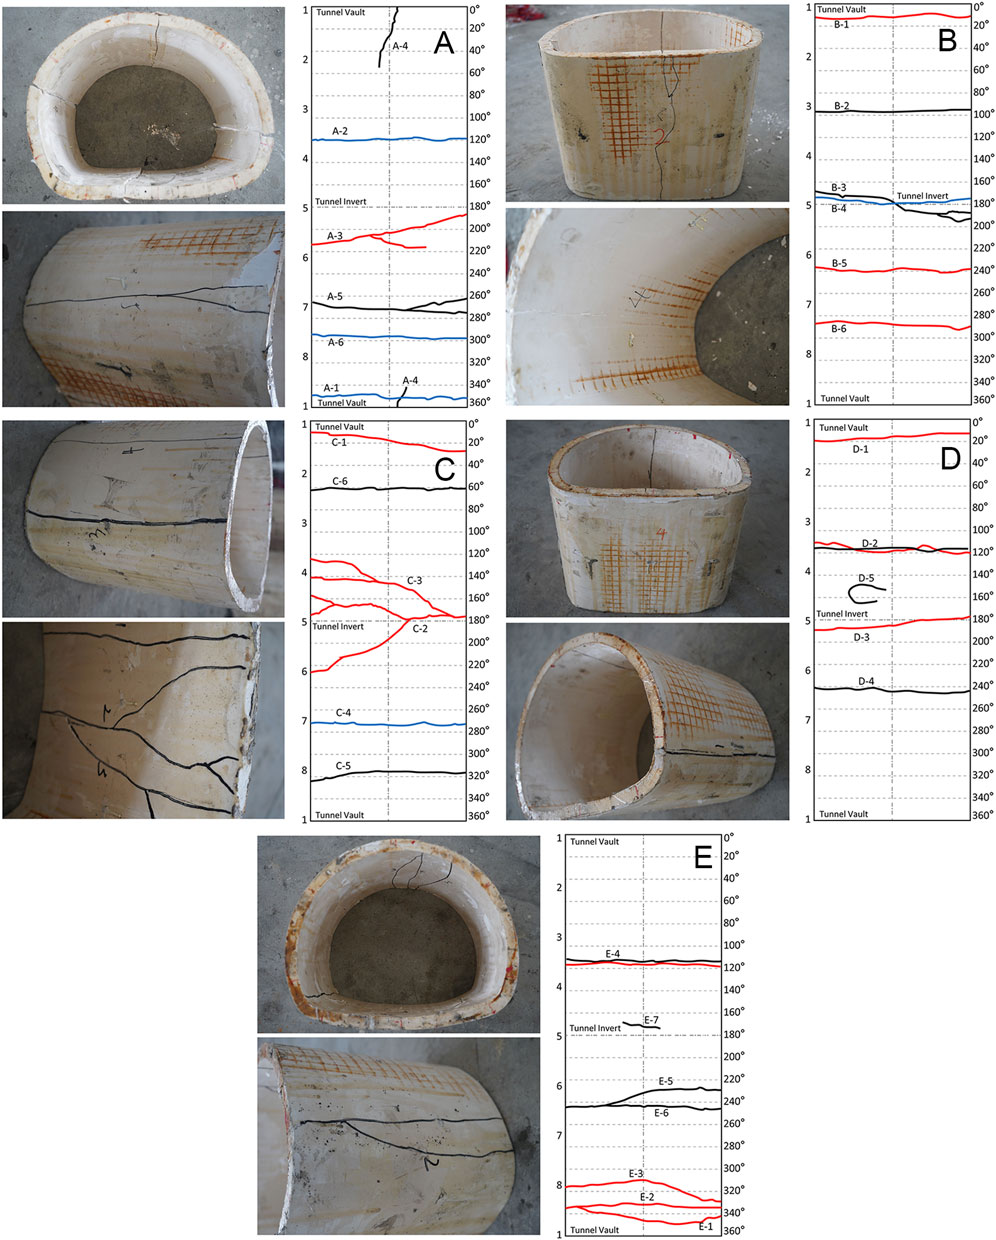
FIGURE 13. Diagram of the damage pattern of the lining structure.
As can be seen from the figure, with the step-by-step increase in shear strain, the damage location of the lining structure shows an obvious symmetrical distribution, mainly concentrated in the arch waist and wall corner locations, with the increase in shear deformation amplitude, the cracks develop significantly along the longitudinal direction. The way of filling with the surrounding rock material during the test preparation stage caused the lining structure to receive a high vertical pressure during the process, resulting in micro-damage to the lining structure at the lining invert. The micro-damage accelerated under the action of the upper load and shear load, eventually leading to the cracking of the lining back arch.
Comparing the damage patterns of lining models A, D, and E, it can be found that the damage to the lining structure under the action of low circumferential reciprocal shear deformation is mainly controlled by tensile stress, and the damage locations are mainly concentrated in the arch waist and side wall locations. Under the action of shear deformation, the crack development of the lining structure without constant resistance limiter (lining A) is dramatic, with some areas showing crack penetration and more serious damage. The number of cracks in the lining structure with the Resistance-limiting layer (lining D and E) is the same as that in the lining structure without the Resistance-limiting layer, but the crack extension width and penetration depth are significantly improved, and the cracks are fine and have a tendency to develop to the periphery.
Comparing the damage patterns of the lining models B, C, and D, it can be seen that the damage to the arch top lining structure (lining C) is more severe under the effect of ground shear deformation, and the constant resistance limiter hardly protects the lining structure. The damage pattern and extent of the arch-waist lining structure (lining B) are similar to that of the full ring lining structure (lining D). The Resistance-limiting layer allows the support structure to work better in the seismic response of the tunnel structure. The layer can effectively reduce the damage to the tunnel lining structure’s underground vibration load, improve the force characteristics of the lining structure, and protect the stability and safety of the tunnel structure. From a practical engineering point of view, the arrangement of the Resistance-limiting layer and the selection of materials need to be considered in conjunction with the surrounding rock conditions, tunnel section size, and other factors, and the specific selection method should be studied in the subsequent work.
In this paper, a dynamic-static coupled shear model box is used to design and complete a low circumferential reciprocating shear strain model test with the Resistance-limiting layer based on a shear deformation controlled seismic response quasi-static test method, which led to the following conclusions:
1) The damage mode of the tunnel structure under the action of seismic shear waves is mainly controlled by tensile stress, and its damage location is symmetrically distributed, mainly concentrated in the arch waist and wall corners, with the increase of shear strain, the lining structure arch waist and wall corner location gradually appear to be crushed.
2) The arrangement of a constant resistance layer at the top of the arch has almost no improvement on the seismic performance of the tunnel structure, on the contrary, the arrangement of a constant resistance layer on both sides of the arch waist reduces the construction cost and at the same time, the seismic effect is not significantly weakened compared to the full ring arrangement, therefore, the arrangement of constant resistance layer at the arch waist is the most cost-effective and provides a reference for the actual project.
3) The arrangement of the Resistance-limiting layer effectively slows down the development rate of stress in the secondary lining structure under the action of seismic shear waves, the development of cracks is mainly for the arch foot fracture, and the arrangement of constant resistance limiter tunnel secondary lining structure internal force distribution is more uniform, which greatly protects the damage to the tunnel structure from seismic shear waves.
In summary, the Resistance-limiting layer works mainly at the waist and side wall, so that the tunnel lining structure under the action of seismic shear waves develops evenly, the crack develops slowly and the width and depth of the development are significantly improved, its performance as a tunnel seismic design structure works well, effectively protecting the safety and overall stability of the tunnel structure.
The original contributions presented in the study are included in the article/Supplementary Material, further inquiries can be directed to the corresponding authors.
PL: contributed to Conceptualization, Methodology, Analysis, and Writing; WQ and FL: contributed to Validation, Resources, and Funding acquisition; QY, ZD, and MG: contributed to experiment design, and data collection; ZC, LL, and YW: contributed to Investigation, Supervision and Review editing. All authors have read and agreed to the published version of the manuscript.
This work is supported by the Natural Science Foundation of Sichuan (2022NSFSC1025), the National Natural Science Foundation of China (51991395), and the National Key R&D Program of China (2017YFC0806000).
The authors declare that the research was conducted in the absence of any commercial or financial relationships that could be construed as a potential conflict of interest.
All claims expressed in this article are solely those of the authors and do not necessarily represent those of their affiliated organizations, or those of the publisher, the editors and the reviewers. Any product that may be evaluated in this article, or claim that may be made by its manufacturer, is not guaranteed or endorsed by the publisher.
Anagnostou, G., and Cantieni, L. 2007. “Design and analysis of yielding support in squeezing ground,” in Proceedings of the 11th ISRM congress. Lisbon, Portugal, 9-13 July 2007
Cui, G., Wang, M., Yu, L., and Lin, G. (2013). Study on the characteristics and mechanism of seismic damage for tunnel structures on fault rupture zone in Wenchuan seismic disastrous area. China Civ. Eng. J. 46 (11), 6. doi:10.15951/j.tmgcxb.2013.11.014
Cui, S. H., Pei, X. J., Jiang, Y., Wang, G., Fan, X., Yang, Q., et al. (2021). Liquefaction within a bedding fault: Understanding the initiation and movement of the Daguangbao landslide triggered by the 2008 Wenchuan Earthquake (Ms= 8.0). Eng. Geol. 295, 106455. doi:10.1016/j.enggeo.2021.106455
Cui, S. H., Wu, H., Pei, X. J., Yang, Q. W., Huang, R., and Guo, B. (2022). Characterizing the spatial distribution, frequency, geomorphological and geological controls on landslides triggered by the 1933 Mw 7.3 Diexi Earthquake, Sichuan, China. Geomorphology 403, 108177. doi:10.1016/j.geomorph.2022.108177
Gao, F., Shi, Y., Yan, S., and Guan, B. (2005). Study of two shock absorption measures in tunnel. Chin. J. Rock Mech. Eng. 24 (2), 8. doi:10.3321/j.issn:1000-6915.2005.02.007
Gao, M. B., Li, T. B., Meng, L., Ma, C., and Xing, H. (2018). Identifying crack initiation stress threshold in brittle rocks using axial strain stiffness characteristics. J. Mt. Sci. 15 (6), 1371–1382. doi:10.1007/s11629-018-4847-z
Gao, M. B., Cui, S. H., Li, T. B., Ma, C., Wu, Z., Zhang, Y., et al. (2022). Investigation on the expression ability of a developed constitutive model for rocks based on statistical damage theory. Lithosphere 2021, 9874408. doi:10.2113/2022/9874408
Geng, P., Tang, J., Quan, Q., He, C., and Yan, Q. (2013). Shaking table test for tunnel with shock absorption layer though fault zone. J. Central South Univ. Sci. Technol. 44 (6), 7.
Guo, C., Wu, R., Jiang, L., and Zhong, N. (2021). Typical Geohazards and engineering geological problems along the ya'an-linzhi section of the sichuan-tibet railway. J. geoscience 35 (1), 17. doi:10.19657/j.geoscience.1000-8527.2021.023
Han, R., Xu, C., Du, X., and Xu, Z. (2021). Optimization of model box type in quasi-static pushover test of soil-underground structure system. Rock Soil Mech.. doi:10.16285/j.rsm.2020.0837
He, Y. S., and Kusiak, A. (2017). Performance assessment of wind turbines: Data-derived quantitative metrics. IEEE Trans. Sustain. Energy 9 (1), 65–73. doi:10.1109/TSTE.2017.2715061
Kazuhide, Y., Yoshiyuki, K., and Mitsuru, S. (2007). Historical earthquake damage to tunnels in Japan and case studies of railway tunnels in the 2004 niigataken-chuetsu earthquake. QR. RTRI 48 (3), 136–141. doi:10.2219/rtriqr.48.136
Li, B. T., Qiu, W. G., Qi, X., Deng, Z., and Hu, H. (2021). Shaking table tests on seismic response of tunnel with longitudinal cracking lining. J. Southwest Jiaotong University China 56 (1), 20–55. doi:10.3969/j.issn.0258-2724.20190657
Li, H. J., Deng, J. H., Feng, P., Pu, C. H., Arachchige, D., and Cheng, Q. (2021a). Short-term nacelle orientation forecasting using bilinear transformation and ICEEMDAN framework. Front. Energy Res. 9, 780928. doi:10.3389/fenrg.2021.780928
Li, H. J., Deng, J. H., Yuan, S., Feng, P., and Arachchige, D. (2021b). Monitoring and identifying wind turbine generator bearing faults using deep belief network and EWMA control charts. Front. Energy Res. 9, 799039. doi:10.3389/fenrg.2021.799039
Ling, Y. T., and Gao, B. (2008). Study on shock absorption measures for double-lane highway tunnels in high earthquake intensity regions. Tunn. Constr. 28 (4), 4.
Lu, F., Wang, H. Y., Wang, L. C., Zhao, K., and Zhang, J. R. (2022). Degradation law and service life prediction model of tunnel lining concrete suffered combined effects of sulfate attack and drying–wetting cycles. Materials 15 (13), 4435. doi:10.3390/ma15134435
Prasad, S., Towhata, I., Chandradhara, G., and Nanjundaswamy, P. (2004). Shaking table tests in earthquake geotechnical engineering. Curr. Sci., 1398–1404. doi:10.1126/science.1100576
Qiu, W. G., Duan, D. Y., Li, B. T., Hu, H., and Dai, Y. (2016). Design and verification of a model test box for tunnel seismic response. Mod. Tunn. Technol. 53 (6), 8. doi:10.13807/j.cnki.mtt.2016.06.018
Qiu, W. G., Duan, D. Y., Li, B. T., and Hu, H. (2017). Design and test verification of coupling dynamic and static shear model box. China Civ. Eng. J., 7. doi:10.13807/j.cnki.mtt.2016.06.018
Qiu, W. G., Wang, G., Gong, L., Shen, Z., Li, C., and Dang, J. (2018). Research and application of resistance-limiting and energy-dissipating support in large deformation tunnel. Chin. J. Rock Mech. Eng. 37 (8), 11. doi:10.13722/j.cnki.jrme.2018.0184
Qiu, W. G., Lu, F., Wang, G., Huang, G., Zhang, H., Zhang, Z., et al. (2019). Evaluation of mechanical performance and optimization design for lattice girders. Tunn. Undergr. Space Technol. 87, 100–111. doi:10.1016/j.tust.2019.02.008
Qiu, W., Li, B., Gong, L., Qi, X., Hu, H., Huang, G., et al. (2020). Seismic capacity assessment of cracked lining tunnel based on the pseudo-static method. Tunn. Undergr. Space Technol. 97, 103281. doi:10.1016/j.tust.2020.103281
Shen, Y., Bo, G., Yang, X., and Tao, S. (2014). Seismic damage mechanism and dynamic deformation characteristic analysis of mountain tunnel after Wenchuan earthquake. Eng. Geol. 180, 85–98. doi:10.1016/j.enggeo.2014.07.017
Tian, S., Wang, W., Tang, G., and Li, X. (2021). Study on countermeasures for major unfavorable geological issues of tunnels on SichuanTibet railway. Tunn. Constr. 41 (5), 32. doi:10.3973/j.issn.2096-4498.2021.05.002
Wang, W. L., Wang, T. T., Su, J. J., Lin, C. H., and Huang, T. H. (2001). Assessment of damage in mountain tunnels due to the Taiwan Chi-Chi Earthquake. Tunn. Undergr. Space Technol. 16 (3), 133–150. doi:10.1016/S0886-7798(01)00047-5
Xue, Y., Kong, F. M., Yang, W., Qiu, D. H., and Su, M. (2020). Main unfavorable geological conditions and engineering geological problems along sichuan—tibet railway. Chin. J. Rock Mech. Eng. 39 (3), 24. doi:10.13722/j.cnki.jrme.2019.0737
Zhao, W., Chen, W. Z., Tan, X. J., and Huang, S. (2013). High-performance foam concrete for seismic-isolation materials of tunnels. Chin. J. Geotechnical Eng. 35 (8), 9.
Keywords: quasi-static test, resistance-limiting layer, high-intensity seismic, stress response, lining damage patterns
Citation: Li P, Qiu W, Lu F, Yang Q, Chen Z, Li L, Wang Y, Gao M and Deng Z (2023) Quasi-static test study of tunnel with resistance-limiting shock absorption layer in high-intensity seismic. Front. Earth Sci. 10:1029929. doi: 10.3389/feart.2022.1029929
Received: 28 August 2022; Accepted: 27 September 2022;
Published: 06 January 2023.
Edited by:
Yusen He, Grinnell College, United StatesReviewed by:
Jianbo Fei, Shenzhen University, ChinaCopyright © 2023 Li, Qiu, Lu, Yang, Chen, Li, Wang, Gao and Deng. This is an open-access article distributed under the terms of the Creative Commons Attribution License (CC BY). The use, distribution or reproduction in other forums is permitted, provided the original author(s) and the copyright owner(s) are credited and that the original publication in this journal is cited, in accordance with accepted academic practice. No use, distribution or reproduction is permitted which does not comply with these terms.
*Correspondence: Feng Lu, ZmVuZ2x1MDkwMUBmb3htYWlsLmNvbQ==; Qingwen Yang, eWFuZ3Fpbmd3ZW4xOTkxQG91dGxvb2suY29t
Disclaimer: All claims expressed in this article are solely those of the authors and do not necessarily represent those of their affiliated organizations, or those of the publisher, the editors and the reviewers. Any product that may be evaluated in this article or claim that may be made by its manufacturer is not guaranteed or endorsed by the publisher.
Research integrity at Frontiers
Learn more about the work of our research integrity team to safeguard the quality of each article we publish.