
95% of researchers rate our articles as excellent or good
Learn more about the work of our research integrity team to safeguard the quality of each article we publish.
Find out more
REVIEW article
Front. Earth Sci. , 10 November 2022
Sec. Cryospheric Sciences
Volume 10 - 2022 | https://doi.org/10.3389/feart.2022.1029216
This article is part of the Research Topic Advances of Remote Sensing in Understanding Cryospheric Changes and Processes View all 6 articles
 K.C. Jezek1*
 J.T. Johnson1
 L. Tsang2
 M. Brogioni3
 G. Macelloni3
 M. Aksoy4
 L. Kaleschke5
 S. Wang6
 M. Leduc-Leballeur3
 C. Yardim1
 M. Andrews1
 H. Xu2
 O. Demir7
 S. Tan8
 J. Miller9
Over the past decade, a series of airborne experiments in the Arctic and Antarctica explored microwave emission from sea ice and ice sheets at frequencies from 0.5 to 2 GHz. The experiments were motivated by the fact that lower frequencies penetrate deeper into a frozen surface, thus offering the possibility to measure physical temperatures at great depths in ice sheets and, subsequently, other unique geophysical observables including sea ice salinity. These experiments were made feasible by recent engineering advances in electronics, antenna design, and noise removal algorithms when operating outside of protected bands in the electromagnetic spectrum. These technical advances permit a new type of radiometer that not only operates at low frequency, but also obtains continuous spectral information over the band from 0.5 to 2 GHz. Spectral measurements facilitate an understanding of the physical processes controlling emission and also support the interpretation of results from single frequency instruments. This paper reviews the development of low-frequency, wide band radiometry and its application to cryosphere science over the past 10 years. The paper summarizes the engineering design of an airborne instrument and the associated algorithms to mitigate radio frequency interference. Theoretical models of emission built around the morphologic and electrical properties of cryospheric components are also described that identify the dominant physical processes contributing to emission spectra. New inversion techniques for geophysical parameter retrieval are summarized for both Arctic and Antarctic scenarios. Examples that illustrate how the measurements are used to inform on glaciological problems are presented. The paper concludes with a description of new instrument concepts that are foreseen to extend the technology into operation from space.
Earth’s cold regions are integral to the global energy, water and bio-geochemical cycles. The continuing rapid retreat of Arctic sea ice, ice sheet mass loss and warming of permafrost in these regions contribute to changes in the atmosphere and ocean that in turn are affecting human activities at all latitudes. These global teleconnections between Earth’s icy regions and lower latitudes remain incompletely understood limiting the predictability of climate variability and change.
The modern constellation of spaceborne remote sensing instruments monitor several of the cryospheric variables necessary to understand changes in polar sea ice extent and ice sheet dynamics, and to predict future changes. Radars for measuring the thickness of the ice sheets and the thickness of the snow cover on sea ice are routinely deployed on aircraft (Gogineni et al., 2004; Gogineni et al., 2007). Synthetic aperture radars operated as imagers and as interferometers reveal details about ice sheet morphology and surface velocity required for estimating changes in ice sheet mass balance (Rignot & Kanagaratnam, 2006). Spaceborne altimeters and gravimeters are yielding long time series of changes in ice sheet volume and mass (Zwally et al., 2021). Airborne and spaceborne microwave radiometers have further proved essential for developing long term records of cryospheric variables and for probing into the volume of the icy cover.
The radiometric emission from snow and ice in particular is a thermodynamically controlled process that is directly related to the snow and ice physical temperature and is modulated by the electrical properties of the ice. The strong differences in electrical properties between relatively saline sea ice and open ocean, for example, have long been exploited to study the extent, concentration and age of sea ice (Parkinson, 2019). Similarly, the microwave emission from the dry snow covering polar ice sheets or terrestrial land cover changes dramatically when small amounts of liquid water are dispersed amongst the ice grains (Hallikainen and Winebrenner, 1992). Free water changes the relative importance of scattering and increases absorption resulting in the observed brightness temperature of the slightly wet snow behaving almost as a black body. This sudden change in brightness temperature is a useful and important indicator of melt extent, duration and intensity on the polar ice sheets, and allows monitoring the onset of melt across the terrestrial seasonal snow cover.
Earth orbiting satellite observations of microwave emission began in the late 1960’s with the Soviet launch of the radiometer equipped Cosmos 243 satellite. Routine observations continued with the deployment of the NASA Electrically Scanning Microwave Radiometer (ESMR) on the Nimbus V satellite. The 19 GHz, horizontally polarized ESMR data were used to estimate sea ice concentration but were limited in the range of sea ice properties that could be addressed due to the use of a single frequency. Successor instruments including the multichannel Scanning Multifrequency Microwave Radiometer (SMMR) and the Special Sensor Microwave Imaging Radiometer (SSMI) have successfully provided operational products by overcoming many of these challenges (Parkinson, 2019). SMMR, SSMI and later the Advanced Multichannel Scanning Radiometer (AMSR) (Maeda et al., 2016) instruments along with the forthcoming Copernicus Imaging Microwave Radiometer (CIMR) incorporate several frequency and polarization channels but with frequencies spaced at intervals that significantly exceed the bandwidth of any individual channel. The multiple frequency channels used enable development of more sophisticated algorithms to infer better information about melt intensity on ice sheets, concentration of thin sea ice and sea ice age. Although the spatial resolution achieved in spaceborne microwave radiometer measurements is relatively coarse (10s of km), the wide swath (over 1,000 km), frequent repeat coverage, and relatively simple to use brightness temperatures result in products that are highly useful for hemispheric-scale studies of the Earth’s cold regions. Table 1 lists the suite of spaceborne radiometers and their capabilities.
Most earlier radiometers operated at frequencies in the range 6.9 GHz–89 GHz. Scientific interest in mapping and monitoring sea surface salinity motivated the development of lower frequency 1.4 GHz (L-band) radiometers that are particularly sensitive to salinity-controlled emission from the ocean. NASA’s Aquarius satellite (launched 2011) provided global observations of sea surface salinity necessary to understand the role of the ocean in the Earth’s water cycle and oceanic circulation (Bindlish et al., 2014). The Soil Moisture Active Passive satellite (Entekhabi et al., 2010; launch 2015) and the Soil Moisture Ocean Salinity mission (Kerr et al., 2010, launch 2009) also deployed L-band radiometers that proved useful not only for terrestrial and open ocean studies but also for studies of the cryosphere. L-band brightness temperature data from SMOS are now used routinely to estimate thin sea ice thickness in the Arctic (Kaleschke et al., 2012). More recently, unique time-series signatures have been observed in SMAP data that are associated with the presence of subsurface aquifers in the permeable firn cover of the polar ice sheets (Miller et al., 2022). Table 1 lists the suite of spaceborne radiometers and their capabilities.
Encouraged by the successful application of L-band radiometers to cryospheric research, a series of airborne experiments over the past decade explored emission from the cryosphere at still lower frequencies from 0.5 to 2 GHz (Johnson et al., 2021). These experiments were motivated by the fact that lower frequencies penetrate deeper into a frozen surface, thus offering the possibility to measure physical temperatures at great depths in the ice sheets and, subsequently, other unique geophysical observables including sea ice salinity and distributions of free water beneath the ice sheets. These experiments were made feasible by recent engineering advances in electronics, antenna design, and noise removal algorithms when operating outside of protected bands in the electromagnetic spectrum (see Section 2). Those technical advances permit a new type of radiometer that not only operates at low frequency, but also obtains continuous spectral information from 0.5 to 2 GHz. Spectral measurements such as these facilitate an understanding of the physical processes controlling emission and also support the interpretation of results from single frequency instruments.
This paper discusses the development of low-frequency, wide band radiometry over the past 10 years. The paper reviews the engineering design of an airborne instrument and algorithms to mitigate radio frequency interference in Section 2. Theoretical models of emission built around the morphologic and electrical properties of cryospheric components are then described that identify the dominant physical processes contributing to the emission spectra (Section 3). New techniques for geophysical parameter retrieval for both Arctic and Antarctic scenarios are summarized in Section 4 and applications of the measurements to glaciological problems are addressed in Section 5. The paper concludes with a discussion in Section 6 of new instrument concepts that are foreseen to extend the technology to space.
The initial impetus for low-frequency wide band measurements came about from concepts that rely on the deep penetration of low-frequency microwaves into glacial ice necessary to infer intraglacial temperature (Jezek et al., 2015). Intra-glacial temperature remains one of the most elusive of the various parameters required to understand and predict the behavior of the polar ice sheets. Temperature is an important factor that moderates ice rheology and hence the rate at which ice flows over the bed. Knowledge of the temperature thus influences mass continuity calculations of ice flux through a volume and the prediction of ice flow rates under changing climate conditions. By observing brightness temperatures (TB) over a wide band of microwave frequencies, the variations in penetration depth over the band enable inversion of the measured TB spectra into the physical temperature depth profile. Penetration depths derived using the Matzler (2006) model of ice permittivity for a typical range of temperatures are presented in Figure 1. The figure illustrates that emission arises from depths of kilometers or more in the ice sheet at low frequencies. The use of several frequencies that probe varying depths then enables estimates of temperature higher in the ice column.
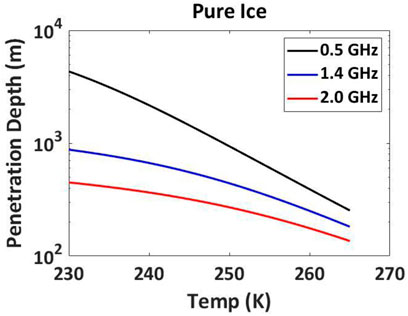
FIGURE 1. Penetration depths in ice along the optical path as a function of ice temperature for 0.5 (black), 1.4 (blue) and 2 (red) GHz. The Matzler model of dielectric permittivity is used to calculate the penetration depths (Matzler, 2006).
Based on proof-of-concept calculations of low frequency radiative transfer through polar ice (Jezek et al., 2015), The Ohio State University developed the Ultra-Wide Band Software-Defined Microwave RADiometer (UWBRAD) (Johnson et al., 2021). This section discusses the design and the engineering challenges associated with 0.5–2 GHz measurements.
UWBRAD was designed to provide nadiral brightness temperature observations from 0.5 to 2 GHz using multiple frequency channels (Johnson et al., 2021). Because this frequency range is not a protected portion of the spectrum, UWBRAD must allow for brightness temperature measurements in the presence of other, man-made, radio frequency interference (RFI). The goal is achieved by sampling 0.5–2 GHz frequency range into 12 channels each of ∼88-MHz bandwidth so that advanced RFI detection and mitigation methods can be applied in real time. The 88-MHz channel is contained within a measured 125-MHz bandwidth that is resolved into 512 subchannels, with ∼360 of these subchannels comprising the 88-MHz channel. Brightness temperatures within each 88-MHz bandwidth channel are further resolved at a frequency resolution of 0.24 MHz, allowing both the detection and filtering of interference and use as a “hyperspectral” radiometer for specific applications. This process enables UWBRAD to identify open portions of the spectrum that can be used for radiometric observations even in the presence of other transmitting sources. UWBRAD instrument specifications are listed in Table 2 and can be contrasted with the frequency, bandwidth and polarization parameters of the spaceborne sensors listed in Table 1. The unique feature of UWBRAD compared to other sensor designs is the capability to obtain spectral data over the wide frequency range.
The UWBRAD antenna subsystem adopts a 2-arm conical log spiral design which provided a single circular-polarization port output for 0.5–2 GHz observations. The antenna was designed to provide a gain pattern that was approximately frequency independent, ensuring that all radiometer channels view the same scene and thereby reducing the impact of any spatial inhomogeneity on the brightness temperature versus frequency.
Details on the RFI detection and removal algorithms are described in Andrews et al., 2018 and Andrews et al., 2021a. Post-campaign algorithms include pulse, spectral kurtosis, and cross-frequency methods to discard time/frequency sub-channels believed to contain RFI from the measured spectrogram of each sub-channel. The data undergo a final manual RFI analysis to identify any remaining frequency sub-channels showing anomalous behaviors over longer time scales. These frequencies are also flagged and discarded from the final integration over frequency to report a single brightness temperature value for each of the 12 x 88 MHz UWBRAD channels.
Example UWBRAD spectrograms acquired over the Greenland Ice Sheet near Thule Airbase before and after RFI processing are shown in Figure 2. RFI is severe at lower frequencies reducing the amount of usable data in the lower two bands. Fortunately, the 360 subchannels in each band allows viable thermal noise data to be recovered in each of the 12 UWBRAD frequency channels.
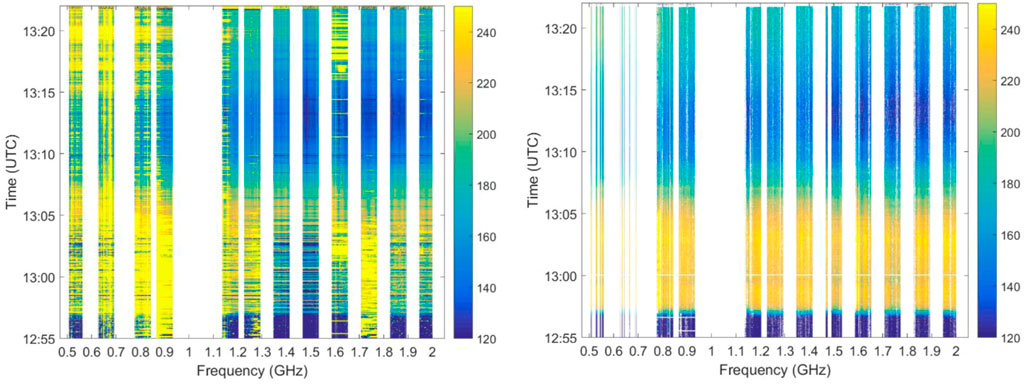
FIGURE 2. Pre (left) and post (right) RFI processing for data collected over Greenland. Brightness temperatures (in Kelvin) for each frequency band are color coded (scale on the right of each figure) and plotted against time along the flight path. The difference between the two images shows that usable information can be obtained in post processing even in the low frequency channels that experience the most RFI contamination. The data gap at about 1 GHz coincides with the aircraft collision avoidance radar that would have saturated the radiometer (From Johnson et al., 2021).
The results over both Greenland and Antarctica indicate that complete data loss in a single band is virtually nonexistent. The channel bandwidth loss due to the algorithms varied with frequency but remained within acceptable limits for all channels (Andrews, 2021).
Forward models of brightness temperature incorporate the important morphologic and electrical properties for each component of the cryosphere. Ice sheets can be described as a layered medium that includes near surface firn layer that is 10s–100s of m thick. The stratigraphic layers from brief wind, episodic melt events and annual snow deposits are identifiable as changes in firn density that in turn diminish the transmission of energy upwelling from deeper in the ice sheet (Figure 3). Surface melt water can percolate down through the upper firn and refreeze in the form of ice lenses, ice pipes and rough layers that scatter the upwelling energy. Temperature gradients through the ice sheet are modulated by surface temperature, accumulation rates, ice sheet motion and basal heat fluxes, and the base of the ice sheet may overlie water or a frozen rocky bed.
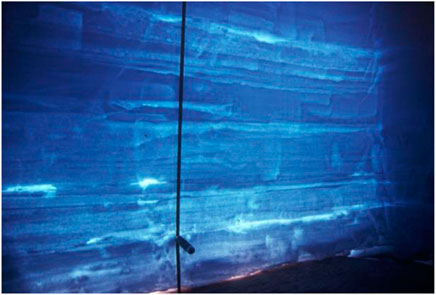
FIGURE 3. Stratigraphy revealed in a back lit 2 m deep snow pit wall located excavated in west central Greenland. The layering is primarily a result of annual snow deposition and densification. Bright objects are ice lens formed by the downward trickle of summer melt until interrupted by less permeable layers (Photo courtesy of M. Anderson).
In contrast to ice sheets, seasonal changes in sea ice are dramatic and cause physical differences between sea ice types that impact the microwave signature (Tucker et al., 1992). Young sea ice is highly saline with entrapped brine pockets distributed along the boundaries of elongated ice crystals that extend downward along the direction of ice growth (Figure 4). Snow cover deposited on the surface during winter wicks brine upwards resulting in a saline surface layer. Summer melt drains through multiyear, reduced salinity ice and leaves behind air filled channels and air pockets that also can cause microwave scattering.
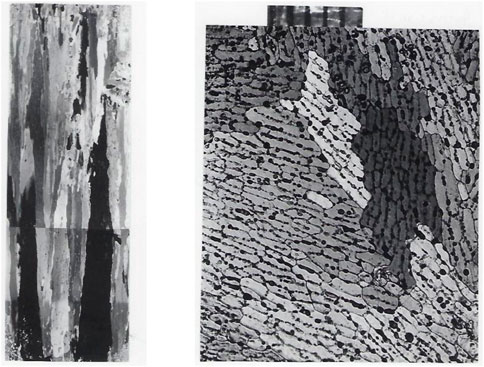
FIGURE 4. Thin section of sea ice along the vertical direction (17.5 cm long) and horizontal direction (16 cm on a side). Markers at top of the horizontal section are 1 mm. Individual vertical crystals are made visible by observation under polarized light. Small brine pockets appear along grain boundaries in the horizontal section (Photo courtesy of A. Gow and K. Jezek).
On the one hand, the complexities of the snow and ice present challenges to the interpretation of the wide band radiometry. On the other hand, added information present in wide band data offers the possibility overcome those obstacles and to capture information on several glaciological properties.
The electrical properties of glacier and sea ice are reported in numerous publications (e.g. Hobbs, 2010). The complex permittivity of glacier ice at microwave frequencies is the consequence of several dispersion processes that become temperature dependent as frequencies approach the microwave portion of the spectrum. This temperature dependence makes remote sensing studies of the thermal properties of glacier ice possible.
Mätzler (2006) models the lossy part of the permittivity as the sum of two temperature-dependent terms, one inversely proportional to frequency and a second term proportional to frequency. Tiuri et al. (1984) offers a different model that also includes two temperature terms with one varying inversely with frequency and the second varying with square root of frequency. However studies by Macelloni et al. (2016) suggest that the Matzler model yields better comparison with measurements at L-band for ice on the East Antarctic Plateau. The Matzler model is used to interpret data from ice sheet experiments though out this paper.
Initial theoretical work determined the feasibility of using low frequency wide band radiometry to estimate physical temperature at depth in the polar ice sheets. Given the largely homogeneous structure of the interior ice sheets and the small size of snow grains to the operational wavelengths, a simple model that integrates the upwelling energy through the ice column was used:
Here, TBcloud(z=H) is the brightness temperature at the ice sheet surface just prior to transmission through the firn “cap” and TB(z=0) is the upwelling emission from the sub ice rock or water after transmission into the ice. The absorption and scattering coefficients are given by κa and κs respectively. The physical temperature with depth is T(z). The propagation angle off vertical in the ice (θi) was taken as normal to the surface (i.e. θi.=0o). The model is derivable from the radiative transfer equation when higher order scattering effects are ignored. The model proved useful in demonstrating that a wide band radiometer could provide important glaciological information but was lacking when field data collected over different glaciological regimes showed that the model generally overestimates the TB (Jezek et al., 2015; Jezek et al., 2018).
Several models are available that describe emission through a layered medium and have been applied to investigations of wide band emission from polar ice (Tan et al., 2015). The Dense Media Radiative Transfer Model–Multiple Layers (DMRT-ML) (Picard et al., 2013) and Microwave Emission Model of Layered Snowpack (MEMLS) (Wiesmann and Matzler, 1999) are based on radiative transfer theory and account for intermediate reflection between adjacent layers and volume scattering effects. The propagation is modeled as incoherent so that any interference processes are ignored. MEMLS treats thin layers as coherent but this feature was not included in UWBRAD analyses (Tan et al., 2015). When volume scattering is ignored, emission through a stratified medium can also be described by an exact solution to the coherent problem (Tsang and Kong, 2000). The coherent model treats all the wave propagation and reflections in a fully coherent manner and is subject to strong wave interference.
For the case where the bulk of the upwelling energy comes from the lower, more homogeneous region of the ice sheet, Tan (see Jezek et al., 2018) proposed a hybrid model to investigate situations where layering and scattering in the upper firn are important. The model was formalized by Xu et al. (2020). In this description, the emission and the firn layer transmission and scattering processes are decoupled so that they can each be evaluated separately. The model is formulated as
where TB is the predicted brightness temperature, T b cloud is the incoherent cloud model predicted brightness temperatures for the lower portions of the ice sheet (which ignores density fluctuations as in Eq. 1), and Γ is the bulk transmissivity through the upper firn layer and is computed by the partially coherent model. The attenuation factor τs is also included to account for any additional loss caused by scatterers in the upper firn layers. The model as written above was used to obtain scattering properties of ice lens scatters in the percolation zone of the Greenland Ice Sheet. Comparisons between the coherent model including scattering, the incoherent model including scattering and UWBRAD data are shown in Figure 5 for the dry snow zone where scattering is negligible and for the percolation zone where scattering from ice lenses is dominant. Undulations in the measured and coherently modeled TB are indicative of interference effects within and between firm layers. The firn is modeled with stochastically varying densities and layer thicknesses (Brogioni et al., 2015).
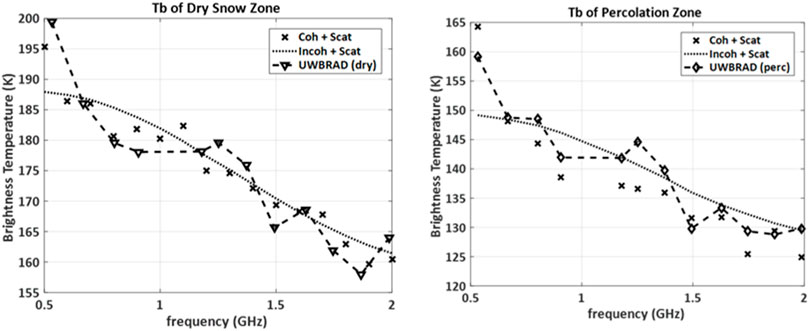
FIGURE 5. Coherent and incoherent TB models for the Greenland dry snow zone along with wide band data (left). The same models for the percolation zone and UWBRAD data on the right. The coherent model better captures some of the fluctuations in the wide band data and also the increase in TB at the lowest frequencies (From Jezek et al., 2018).
A variety of meteorological and glaciological processes determine firn stratigraphy at various scales (Figure 3). Overburden pressure thins layers as they are successively buried by seasonal accumulation. Thin, hard crusts form during wind and melt events. Low density layers are formed by temperature gradients through the firn that drive vapor transport. An important conclusion of the emission models is that many, closely spaced layers (cm scale) are required to match the measured TB. This seems counterintuitive because transmission through individual thin layers is high when the thickness is much less than a wavelength (as is the case for UWBRAD frequencies). However, many small reductions in transmission can be sufficient to mute the upwelling radiation.
The fully coherent model based on solving Maxwell’s equations for thousands of layers throughout the entire ice sheet is computationally intensive. The “partially coherent” implementation of the coherent model was developed explicitly for the ice sheet case to capture the impact of variations in ice density on predicted brightness temperatures while improving computational efficiency (Tan et al., 2021). The partially coherent model divides the ice sheet into blocks. Within each block, the coherent model is applied to take into account coherence among the contributions of closely spaced layers. The model is based on the physical reasoning that coherent interactions occur primarily within spatial scales of a few wavelengths.
A Monte Carlo procedure is used to calculate the average block reflection and transmission parameters. Between adjacent blocks, interactions are assumed to be incoherent, and the radiative transfer theory is used to incoherently cascade block parameters. Results of the partially coherent model are in good agreement with the fully coherent model.
A potential solution to the problem of characterizing the firn is to use a radar operating at the same frequencies as the radiometers (Xu et al., 2020). The integrated backscattered signal over some depth can be used to infer the firn cap reflectivity and hence the transmissivity to be applied to the TB spectra. A coherent reflectivity model was developed for both ice sheet thermal emission and backscattering. Maxwell equations were used to calculate the coherent reflections from the cap layers, and the Wentzel-Kramers-Brillouin (WKB) approximation was used to calculate the transmission for the slowly varying profile below the cap layers. Numerical simulations using typical values for Antarctic temperatures and firn densities demonstrate the use of radar measurements to compensate reflection effects on brightness temperatures. The reflections corrected brightness temperature is then directly related to the physical temperature and absorption profile making possible the retrieval of subsurface temperature profile with multi-frequency measurements.
The electrical properties of sea ice are dynamic and vary as the brine and air distributions in the ice changes over the seasons (Figure 4). Sea ice permittivity studies are summarized by Hallikainen and Winebrenner (1992). The work by Vant et al. (1978) remains the benchmark study relevant to the frequencies utilized here.
Standard, forward models of emission from sea ice were adopted from the literature. Based on environmental conditions during the experiments described later, a 3-layer model consisting of ocean, ice and air was suitable for sea ice at the start of the fall season (Jezek et al., 2019). The radiative transfer model assumes incoherent contributions of up and down-welling radiation (Ulaby and Fung, 1981, p. 243). The model implementation assumes that scattering is small compared to absorption, ice physical properties are constant with depth, emission is normal to the surface, there is no antenna pattern correction, and there is only a single ice type in the scene which is completely covered in that ice type. The relationship between brightness temperature and model parameters is then given as:
where
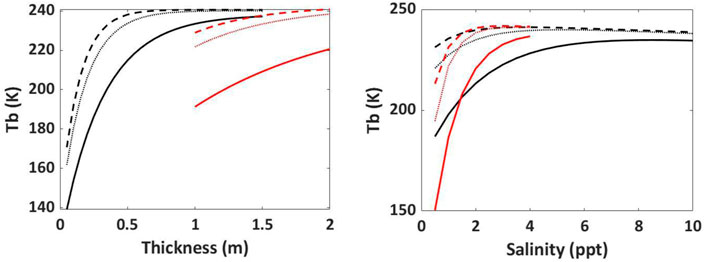
FIGURE 6. Sea ice models of TB for constant salinity (6 psu) as a function of ice thickness (left) and for constant thickness (1 m) as a function of salinity (right). Black curves represent first year ice and red curves represent multiyear ice. Solid, dotted and dashed lines correspond to 0.5, 1.4 and 2.0 GHz frequencies respectively. The ice temperature is -10 C. The Vant et al. (1978) model of sea ice permittivity is used to calculate the curves.
Later experiments recursively added additional layers including snow and sea ice of different properties (Demir et al., 2022a). The volume of snow plays a minor role in the emission but serves to more efficiently couple the upwelling radiation into the air. Adding layers to the model to capture temperature and salinity gradients in the ice reveals more complex behavior. As discussed later in Section 5.4, the accretion of new sea ice growth on the base of thick ice that has survived one or more seasons warms the emission because of the slightly increased transmission across the ocean ice boundary and the increased emission from the electrically lossy new ice growth.
The forward models discussed in Section 3 predict TB as a function of frequency for different glacial and sea ice conditions. For sea ice, the forward model described by Eq. 3 was fit to the measured TB in a least squares sense to deduce the geophysical parameters of interest (Jezek et al., 2018; Demir et al., 2022a) (Eq. 4). The modeled brightness temperatures (Tb model) given by Eq. 3 are parameterized over a range of sea ice thicknesses and salinities. The ice temperature is taken from ancillary data. The root mean square difference between the twelve measured and modeled brightness temperatures is minimized from which the salinity and thickness are inferred. The retrieved parameters are discussed in Section 5.
In this section, we review a Bayesian inversion approach to calculate glacial ice physical temperatures inferred from spectral, brightness temperature data. The inversion also relies on forward radiative transfer models along with models of ice sheet thermodynamics.
Bayesian inversion estimates the probabilities of realizing a particular geophysical parameter given data. The first step is to assign prior estimates of the parameter distributions such as ice thickness, surface temperature and snow accumulation rate. Second a model is chosen that relates TB to the glaciological parameters. Finally, the glaciological parameters are used to solve an analytic expression for ice sheet temperature at depth (Duan et al., 2022; Yardim et al., 2022).
The hybrid microwave emission model discussed above is adopted as the forward radiative transfer model. TB measured by the UWBRAD is modeled using vertical ice sheet temperature and density profiles. A 3-parameter Robin (1977) and a two-scale firn density variation (Brogioni et al., 2015) models are used to characterize temperature and density profiles, respectively. Because both temperature parameters and density variation parameters affect TB, they need to be solved simultaneously. A sequential Bayesian framework is developed for retrieving the ice sheet internal temperature from UWBRAD brightness temperature measurements in the presence of the nuisance density parameters (Yardim et al., 2022).
The Bayesian inversion retrieves glaciological parameters used in the Robin model to calculate the temperature at depth. These are the mean annual surface temperature, average accumulation rate and geothermal heat flux. The retrieved parameters agree favorably with other model and measured estimates of mean annual surface accumulation and surface temperature (Yardim et al., 2022). Geothermal heat flux at the base is retrieved and represents one of the first remote sensing estimates of this variable which is an important control on basal sliding.
The glaciological parameters are inserted into the Robin model to calculate the physical temperature at depth. Temperatures are computed along the Greenland Ice divide (Figure 7 left) where the Robin model is valid. Temperature profiles along the line are shown in Figure 7 (right). Temperature uncertainties are less than 1 K near the surface and increase to about 3 K at the bed (Yardim et al., 2022). The temperature profile is the first continuous measurement of ice temperature through the ice column. Previous measurements relied on the few and widely spaced boreholes through the ice.
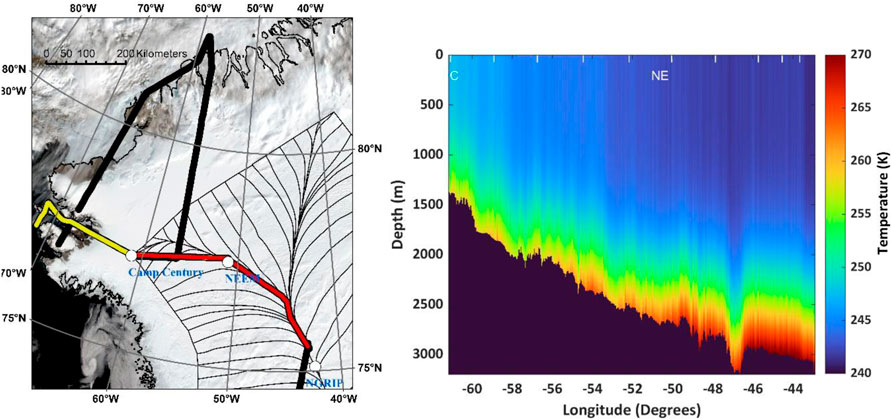
FIGURE 7. UWBRAD transects across Greenland (left). The 2016 Greenland flight is shown in yellow. The 2017 Greenland Flight is shown in black. The portion of the 2017 line along which intraglacial temperatures (right) were estimated is shown in red. Slope-derived ice-flow lines extending from the ice divides are shown by thin black lines. Derived temperature profiles along the survey line from Camp Century (C), to NEEM (NE) to NGRIP (near end-of-line) Greenland (right) (From Yardim et al., 2022).
Airborne experiments were carried out across the Greenland Ice Sheet, the Lincoln Sea, Terra Nova Bay Antarctica and from the coast of Northern Victoria Land to Concordia Station located on the East Antarctica Plateau. In addition to acquisitions over these primary objectives, data-of-opportunity were acquired over Arctic lakes, the boreal forest, permafrost and the Davis Strait during transits to and from the primary sites (Andrews, 2021). In this section we review the unique spectral signatures identified for ice sheets and sea ice. We go on to discuss the scientific information gleaned from the application of the concept.
Benson (1962) showed that the upper surface of the ice sheet is partitionable into four melt zones. The annual snow and some upwelling ice melts from the surface in the ablation zone. Melt streams dissect the icy surface that can be cluttered with patches of rocky debris. Surface lakes dominate the wet snow zone and the firn stratigraphy can be interrupted by thick layers of superimposed ice. Seasonal melt drains through ice pipes and forms ice layers and ice lenses in the percolation zone. Melt is generally absent in the dry snow zone but recent climate change compromises a strict definition of dry snow across the ice sheet.
An airborne experiment in 2016 traversed the melt zones along a line starting from the margin of the northwestern ice sheet at about 800 m and reaching eastward to about Camp Century at a surface elevation of about 1900 m (yellow line in Figure 7 and Figure 8 top) (Jezek et al., 2017). The UWBRAD-measured TB spectra vary with intensity and spectral gradient as each melt zone is encountered (Figure 8 middle). TB brightens by about 10 K on the approach from the rocky margin to the ablation zone. Thereafter the Tb drops precipitously in the wet snow zone before reaching a minimum intensity and a broadening of the spectral gradient in the percolation zone. Spectra warm by almost 30 K during the transition from the percolation zone to the dry zone. The spectral gradient increases as the radiometer becomes less affected by scattering and more influenced by ice thermal properties at depth. Spectra for individual snow facies are shown in Figure 14 (bottom). The different melt facies are distinguishable based on the intensity and the slope of the spectra.
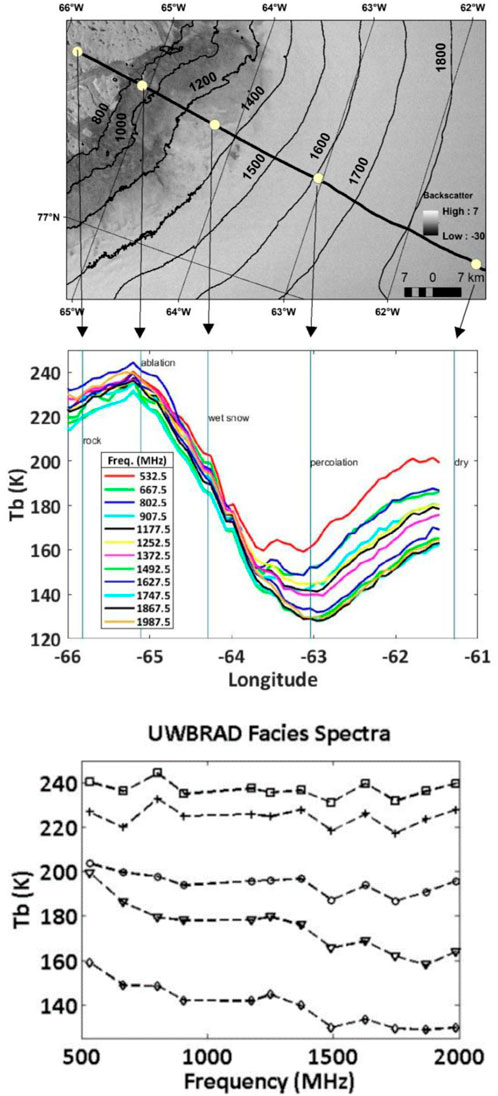
FIGURE 8. (Top) Segment of the 2016 UWBRAD flight line (thick black line) and surface elevation contours in meters (irregular black lines) overlaid on an 27 August 2016 ALOS-2 PALSAR-2 L-band radar image. White circles indicate the approximate center of snow facies along the path. (Left to right) Terrain types are snow-covered rock and lake terrain, ablation, wet snow, percolation, and dry snow (Middle) UWBRAD 12-channel data indicating the location of snow facies. The legend identifies the center frequency in megahertz of each channel. (Lower) Individual facies spectra: deglaciated terrain consisting of bare rock and small lakes (plus), ablation (square), wet snow (circle), percolation (diamond), and dry snow transition (triangle). The locations of the data are identified by white circles in the upper map figure (From Jezek et al., 2017).
The Ice Sheet and Sea Ice Ultrawideband Microwave Airborne experiment (ISSIUMAX) project was conducted between October 30th and December 8th, 2018 (Brogioni et al., 2022a). The airborne campaign was hosted at the Italian Antarctic base (Mario Zucchelli Station) on the Ross Sea and extended from Terra Nova Bay to Concordia Station in East Antarctica. The project goals were (i) to demonstrate the use of 500–2000 MHz brightness temperature spectra for deriving vertical ice sheet temperature profiles of the inland Antarctic ice sheet, and (ii) to explore the capability to infer glaciological information in coastal regions of Antarctica, including sea ice. An additional goal as to demonstrate that microwave radiometry is feasible in the heavily used 500–2000 MHz spectral range in remote regions such as Antarctica.
UWBRAD TB spectra along the transect from Mario Zucchelli Station to Concordia Station on the East Antarctic plateau are shown in Figure 9 (Brogioni et al., 2022a). TB decreases linearly from the coast to Dome C dimming between 7 and 16 K depending on the frequency. The lowest frequency channel decreases by only about 5 K. SMOS observations decrease by 13.7K (Figure 9), comparable to the 1370-MHz UWBRAD decrease of 14.1 K. Brightness temperatures over the UWBRAD frequency band vary by more than 30 K, which is similar to the spectra observed over the interior dry snow zone of the Greenland ice sheet (Figure 8).

FIGURE 9. (left) UWBRAD transects over Terra Nova Bay and Northern Victoria Land Antarctica in 2018. The two coastal and Terra Nova Bay Antarctic flights are shown in white and red. The flights to and from Concordia Station are shown in blue and yellow along with an enlargement around Concordia Station (right) Twelve-channel UWBRAD brightness temperature (K) along the flight from the coast to Dome C; SMOS observations are the red dotted line; (bottom of figure) the ice thickness (black, left axis) and surface temperature (grey, right axis) (From Brogioni et al., 2022a).
Arctic multiyear and thin sea ice covering the Lincoln Sea (northern apex of the 2017 campaign in Figure 7 left) was sampled in the early fall (September 2017) after melt had ended. Surface temperatures remained below about -10 C for the period of observations. Spectral signatures for consolidated multiyear ice are about 30 K warmer than the thin sea ice growing in recently opened leads (Figure 10) (Jezek et al., 2018). The spectra warm with frequency as the contribution from nearer the surface dominates the gradually reducing contribution from the radiometrically cold ocean. Models fit to the data using Eq. 3 show good agreement with the data.
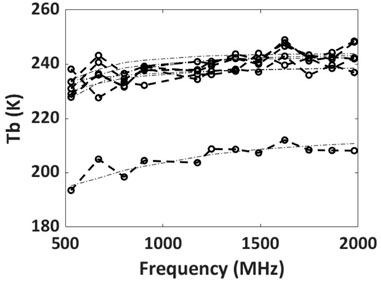
FIGURE 10. Sea ice spectra acquired over the Lincoln Sea in September 2017. Brightness temperatures warmer than 220 K are from multiyear sea ice floes. Colder temperatures are from thin ice covering a recently refrozen lead. Models fit to the data using Eq. 3 are shown by thin, dashed, black line (From Jezek et al., 2018).
A 4-channel (540, 900, 1,380, and 1740 MHz) version of the UWBRAD instrument was deployed during the international MOSAIC campaign for operation on the sea ice surface (Demir et al., 2022b). The German research vessel Polarstern served as the base of operations and was moored to a multiyear floe in October 2019. The instrument began data collection in December near 86o N latitude and 120o E longitude in the Arctic Ocean.
The study site was situated on a more than 2 m thick sea ice floe that included undeformed desalinated second-year ice (potentially with refrozen melt ponds). Observed brightness temperatures from this site were compared with the sea ice emission model using in situ data of ice salinity and temperature (Figure 11). In situ observations showed that new ice growth of about 8 cm was inferred from temperature profiles recorded from December 4 to December 13. Growth trends correlated with a gradual increase in the brightness temperatures by about 10 K (Demir, 2021; Demir et al., 2022a). Because the exact thickness of the basal layer was limited by the measurement interval, bottom layer thickness values between 0–15 cm were tested to compare the simulated and observed TB over the time period of December 8–13 (at fixed 35° pointing angle). The best fit values were determined as 8.7 cm on December 9 and 13.5 cm on December 13, both of which are in the range of basal layer thicknesses detected in ice core samples taken from representative sites. Figure 11 compares measured and modeled brightness temperature time series during this time interval. New ice growth under the older ice raises TB as emission from the radiometrically warm new ice contributes to the net upwelling energy. Of particular importance is the observation that a relatively thin layer of new ice growth at the base of the multiyear flow changes the emission by almost 10 K. The implication is that passive microwave emission algorithms for estimating the thickness of multiyear ice must consider basal accretion (Demir et al., 2022a).
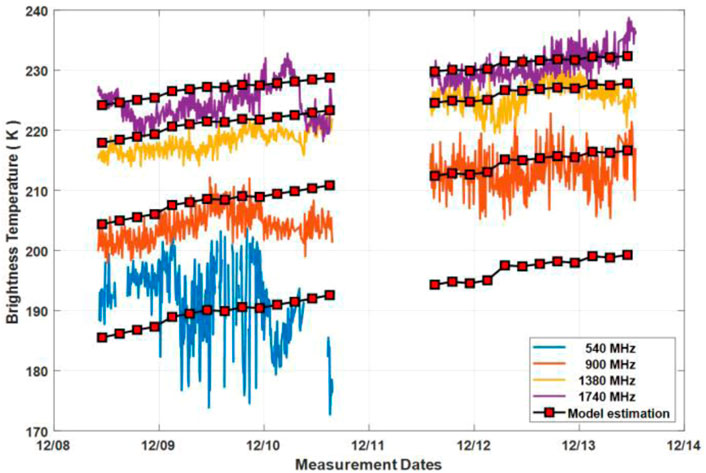
FIGURE 11. TB for the four-channel, modified UWBRAD instrument operated on a thick multiyear ice floe in December 2019. Model estimate shows that the slow accretion of new sea ice at the base gradually increases the brightness temperature at all frequencies (From Demir et al., 2022a).
The sea ice covering Terra Nova Bay is complex (Ackley et al., 2020; Rack et al., 2021). Substantial amounts of frazil ice can form into thick rafts. Platelet ice can form beneath the sea ice. The sea ice routinely breaks out in summer and is rarely less than 2-years old. New ice forms in open leads and older, thicker fast ice is found along the coast. Unlike the arctic, pancake ice is common as is flooding at the interface between snow and sea ice.
Wide band microwave data were collected over the Terra Nova Bay sea ice cover in December 2018 (Brogioni et al., 2022b). An example from Gerlache Inlet to Silverfish Bay highlights the spectral behavior of different Antarctic sea ice types (Figure 12). Brogioni and others (2022b) determined that the nearly 2 m thick near-coastal sea ice (or “fast ice”) at sites 1, 2, and 3 formed in March-April 2018. Katabatic winds near site 1 cause ablation/sublimation of the fast ice and result in almost no snow coverage, while the fast ice at sites 2 and 3 was covered by snow of less than 45 cm thickness The roughly 1.5 m thick sea ice at site 2 in contrast was the product of multiple breakup processes. The site 4 freshwater ice of the Campbell Glacier Tongue (Site 4) has a much greater thickness (∼ 400 m landward)
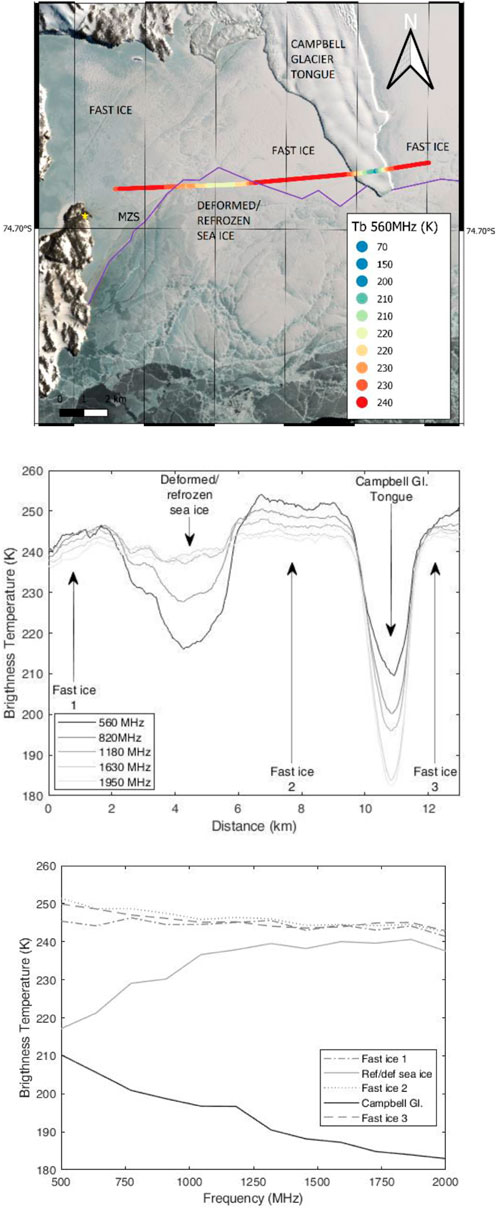
FIGURE 12. (Upper) Flight line over Gerlache Strait towards Silverfish Bay. Brightness temperature at 560 MHz is shown superimposed on the line. (Middle) Brightness temperature for 5 frequencies along the flight line that crosses fast ice, refrozen sea ice, and the Campbell Glacier Tongue (Lower) Spectra over each ice type were obtained by averaging acquisitions in the regions that correspond to approximately uniform regions in space (From Brogioni et al., 2022b).
UWBRAD brightness temperature spectra at the five labeled sites are shown in the lower plot of Figure 12. As expected from theory (Johnson et al., 2021; Demir et al., 2022b), the thicker sea ice at sites 1, 2, and 3 shows a “flatter” spectrum having brightness temperatures in the 240–250 K range. This is due to the sensitivity of brightness temperature to ice thickness: for a salinity of 6 ppt (as measured in situ) the electromagnetic signal saturates for thicknesses higher than 1.5–2 m even at 500 MHz. The flattest spectrum occurs for the bare ice at site 1, while the spectra of sites 2 and 3 show a slight decreasing trend with frequency possibly due to surface roughening of the snow to sea ice interface. Over the more dynamic, deformed and thinner ice between sites 1 and 2, brightness temperatures are cooler by almost 40 K compared to the thick ice at sites 1, 2 and 3. Moreover there is a positive gradient with frequency as was also observed in Lincoln Sea campaign where the ice was typically thinner than 2 m (Figure 10). Brightness temperatures over the Campbell Glacier tongue decrease uniformly with frequency from 210 K (560 MHz) to 182 K (1950 MHz). This behavior is typical of continental ice as illustrated in Figures 8, 9.
Ice shelves are a unique feature of the modern Antarctic Ice Sheet. Ice shelves form as glacier ice from the interior spreads and thins onto the ocean. To date only a limited amount of wide band data have been collected on floating ice. Though not an ice shelf, Enigma Lake is a small, supraglacial body of water located near Mario Zucchelli Station. The overlying ice varies from a few centimeters to 15 m thickness. The brightness temperature spectra decreases over the lake relative to the surrounding rocky surfaces because of the cold brightness temperature contributed by the underlying water into the ice (Figure 13). Also shown are individual spectra for Enigma lake and rocky terrain. The Enigma Lake spectrum warms with frequency as the water contribution is attenuated and in a fashion more similar to sea ice rather than ice on the polar plateau (Brogioni et al., 2022b).
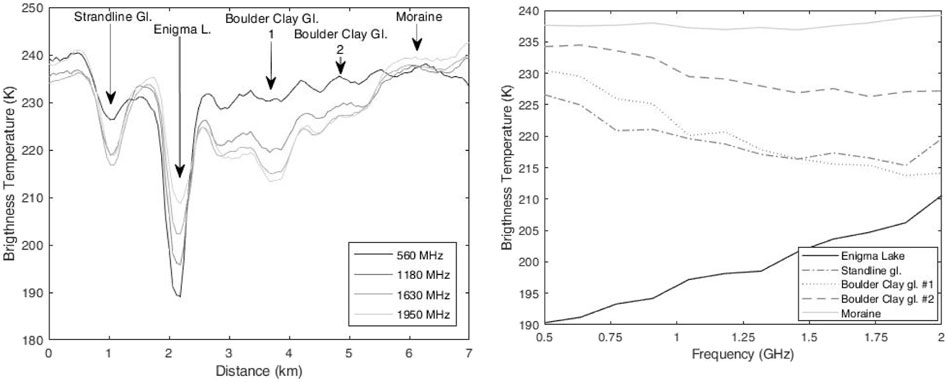
FIGURE 13. (Left) Timeseries of brightness temperature acquired over the Northern Foothills crossing deglaciated terrain and Enigma Lake near Mario Zuchelli Station. (Right) Spectra of the different targets imaged (From Brogioni et al., 2022b).
The Nansen Ice Shelf was also sampled but the ice shelf structure is particularly complex because of converging glacier flows feeding the ice shelf, debris on the surface, and substantial melt. Nevertheless, initial results suggest that the wide band TB spectral gradients increase as do brightness temperature magnitudes as the ice crosses the grounding line (Brogioni et al., 2022b).
In this section we review applications of low-frequency wide band emission data to sea ice and ice sheet science. Wide-band nearly continuous spectra enable new ways to explore the ice sheet and sea ice geophysical properties.
Firn in the Greenland Ice Sheet percolation zone is punctuated by ice lenses formed by refrozen melt (Figure 3). Melt descends through the permeable upper layers of varying density until an impermeable layer is reached at which point either an ice lens is formed or an ice layer if there is sufficient melt over an area. The hybrid brightness temperature model (Eq. 2) was used to estimate scattering from ice lenses and layers in the percolation zone. Frequency dependencies inherent in wide band data are used to derive the number densities of the embedded icy disks and to estimate the variability of firn density. Modeling applied to the spectra in Figure 8 shows that the density fluctuations raise or lower the brightness temperatures nearly uniformly over the entire spectrum (excepting coherent layer effects), while the scattering losses from the embedded ice lenses affect more the brightness temperatures at higher frequencies, creating an added frequency dependence (Jezek et al., 2017). The interplay between density fluctuations and ice lens density as the data move from west to east produces the unique spectral responses. Consistent with expectations, Figure 14 shows that the calculated density of ice lenses decreases from west to east with increasing ice sheet elevation and decreasing surface temperature. The variability of firn density also increases as the gradual reduction of melt enables fine scale firn stratigraphy to develop. The result is significant given the need to understand situations in which melt water drains off of the ice sheet resulting in mass loss and where melt percolates vertically and refreezes.
Densification of polar firn across the ice sheets is of interest for use in correcting satellite altimeter measurements of ice sheet mass balance. The partially coherent model discussed above is implemented to explain the UWBRAD microwave brightness temperatures by modeling Greenland firn as a 3-D continuous random medium with finite vertical and horizontal correlation lengths (Xu et al., 2022). Refrozen layers are described as deterministic sheets with planar interfaces. The number of refrozen layer interfaces is determined from coincident Operation IceBridge radar observations. The forward model matches measured 0.5–2 GHz brightness temperatures with firn density and correlation length parameters that in turn are consistent with similar parameters in firn densification models. Firn parameters so estimated are also in good agreement with multi-angle 1.4 GHz vertically and horizontally polarized brightness temperature measured by the SMOS satellite at DOME C, Antarctica (Xu et al., 2022).
Ice internal temperature was obtained from 2017 brightness-temperature spectra (Figure 7). Temperatures vary slowly through the upper ice sheet and more rapidly near the base increasing from about 259 K near Camp Century to values near the melting point near NGRIP. As the temperature increases the ice softens, which can be described by a deformation rate factor that relates stress to strain rate. The basal-ice rate-factor increases from about 1x10⁻⁸ kPa−3a−1 to 8x10⁻⁸ kPa−3 a−1 along the line, which when adjusted for enhancements from crystalline fabrics and grain size results in increased lateral motion of the ice and shearing across the bed (Jezek et al., 2022).
Geothermal heat flux imposes a boundary condition on glacier thermodynamics and is one of the parameters obtained by the inversion (Section 4.1). Geothermal heat flux values retrieved from the brightness temperature spectra increase from about 55 mW m−2–84 mW m−2 from Camp Century to NGRIP. A strain heating correction using an enhancement on the rate factor improves agreement with other geophysical data sets (Martos et al., 2018) near Camp Century and NEEM but differ by about 15 mW m−2 in the central portion of the profile (Figure 15) (Jezek et al., 2022).
The Lincoln Sea sea-ice emission spectra (Figure 10) enables estimation of both the ice thickness and ice salinity by fitting the forward model (Eq. 3) to the microwave spectral data (Figure 16). Estimated thicknesses range between about 0.2 and 2 m for most of the profile which is not unexpected for the ice pack north of Greenland. Estimated salinities vary from about 5 ppt to over 20 ppt. Generally, thin ice is associated with high salinities whereas thick ice is associated with low salinities. It is noted that salinities are too high for both multiyear and new ice. The discrepancy may be the result of neglecting important effects including physical property gradients through the sea ice, the interface roughness, and/or the presence of snow along with uncertainties in the electrical properties of the sea ice (Jezek et al., 2018).
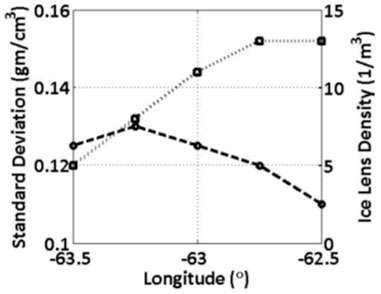
FIGURE 14. Firn properties on the Greenland ice sheet derived from ultrawide band data (Figure 8). Ice lens density decreases eastward as elevation and hence surface temperature decreases. The variability of firn layer increases eastward as the short term and annual density variations become dominant(From Jezek et al., 2017).
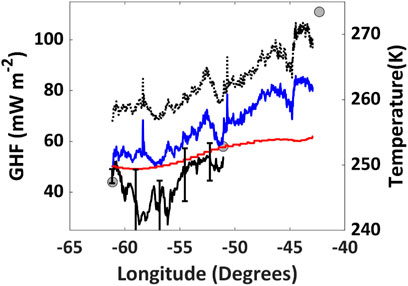
FIGURE 15. Retrieved basal temperature (dotted black line). Retrieved geothermal heat flux (GHF) (blue line). Red line is GHF from Martos et al. (2018). Black circles are average GHF values at the Camp Century, NEEM and NorthGRIP borehole sites taken from Martos et al. (2018). Heavy black line is the strain heating corrected GHF (Jezek et al., 2022).
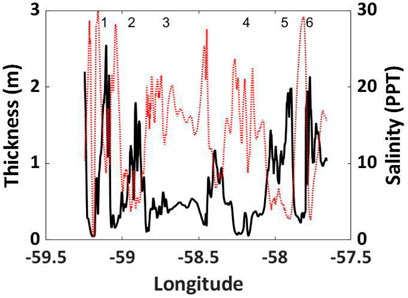
FIGURE 16. Thickness and salinity retrieved using the RT model lookup table(thick dashed line). Thickness and salinity curves were smoothed using a16-point moving average. Thin solid line in each figure is the 0.5 GHz brightness temperature and the dashed thin line is the 2-GHz brightness temperature (Jezek et al., 2018).
To explore arctic basin-wide sensitivity of wide band data for retrieving sea ice thickness and salinity, Demir (Demir, 2021; Demir et al., 2022b) simulated brightness temperature for Arctic sea ice for the period October 2020–March 2021 using sea-ice thicknesses from the SMOS-CryoSat-2 algorithm. The simulations assumed first year and second year ice along with allowing for snow cover. Compared to existing sea-ice thickness retrievals obtained from 1.4-GHz microwave radiometers, the results demonstrate that 0.5–2-GHz radiometry can achieve higher sensitivity to a sea-ice thickness within the range 0.5–1.5 m for first year sea ice and enable the retrieval of multiple sea-ice parameters (thickness and salinity) simultaneously (Demir et al., 2022b).
The successful engineering and scientific demonstrations of airborne low-frequency wide band radiometry lead naturally to concepts for the implementation of spaceborne systems. Thus far, two similar concepts have been proposed. CryoRad under consideration by ESA consists of a single satellite hosting a single payload: a wideband, low-frequency microwave radiometer that observes from 0.4 GHz to 2 GHz with continuous frequency sampling specifically designed to address scientific challenges in polar regions. The instrument observes at nadir and in circular polarization to avoid Faraday rotation effects. The CryoRad swath is 120 km, with a spatial resolution on the ground that varies from 45 km at 0.4 GHz to 8 km at 2 GHz. The average revisit time is 3 days at latitudes higher than 60° and about 10 days at the equator. (Macelloni et al., 2018). The PolarRad mission concept being developed in the United States is similar in that a wideband microwave radiometer is planned to measure Earth brightness temperatures from 500 to 2000 MHz (Andrews et al., 2021b).
Over the past 10 years, ultra wide band, low-frequency radiometry has evolved from a concept and into a new tool for exploring the cryosphere. Advances in electronics, instrument design, and procedures for isolating radio frequency interference permitted the development of a new class of radiometer capable of acquiring high quality brightness temperatures in the 0.5–2 GHz range that includes many regions outside the protected bands of the electromagnetic spectrum. Surface and airborne experiments in the Arctic and Antarctica, on ice sheets and on sea ice, and over rocky terrain reveal unique spectral signatures associated with each scene–a unique feature of the wide band radiometer. More information is contained in the wide bandwidth enabling more geophysical parameters to be gleaned from the data including temperatures deep within the ice sheets and both the thickness and salinity of sea ice. To date, airborne experiments have been restricted by the usual limitations of season and range. In the near future, there is the possibility that those limitations will be overcome by the deployment of similar instruments in space.
All authors listed have made a substantial, direct, and intellectual contribution to the work and approved it for publication.
Funding from NASA.
This work was supported by grants from NASA’s Cryospheric Sciences Program.
Author OD was employed by the company Skyworks Solutions Inc.
The remaining authors declare that the research was conducted in the absence of any commercial or financial relationships that could be construed as a potential conflict of interest.
All claims expressed in this article are solely those of the authors and do not necessarily represent those of their affiliated organizations, or those of the publisher, the editors and the reviewers. Any product that may be evaluated in this article, or claim that may be made by its manufacturer, is not guaranteed or endorsed by the publisher.
Ackley, S. F., Stammerjohn, S., Maksym, T., Smith, M., Cassano, J., Guest, P., et al. (2020). Sea-ice production and air/ice/ocean biogeochemistry interactions in the Ross Sea during the PIPERS 2017 autumn field campaign. Ann. Glaciol. doi:10.1017/aog.2020.31
Andrews, M., Johnson, J., Jezek, K., Li, H., Bringer, A., Chen, C., et al. (2018). The Ultrawideband software defined microwave radiometer: Instrument description and initial campaign results. IEEE Trans. Geosci. Remote Sens. 56 (10), 5923–5935. doi:10.1109/tgrs.2018.2828604
Andrews, M. J. (2021). Design considerations for 500-2000 MHz ultra-wideband radiometric measurements. Doctoral dissertation (Columbus, Ohio: Ohio State University). OhioLINK Electronic Theses and Dissertations Center. Available at: http://rave.ohiolink.edu/etdc/view?acc_num=osu1618312655065238.
Andrews, M., Johnson, J., McLinden, M., and Misra, S. (2021a). A study of front end architectures for the PolarRad 0.5-2 GHZ microwave radiometer. IEEE Int. Geoscience Remote Sens. Symposium IGARSS 2021, 7982–7983. doi:10.1109/IGARSS47720.2021.9554508
Andrews, M., Johnson, J. T., Brogioni, M., Macelloni, G., and Jezek, K. C. (2021b). Properties of the 500–2000-MHz RFI environment observed in high-latitude airborne radiometer measurements. IEEE Trans. Geosci. Remote Sens. 60, 5301311. doi:10.1109/TGRS.2021.3090945
Benson, C. S. (1962). “Stratigraphic studies in the snow and firn of the Greenland ice sheet,” in SIPRE res. Rep. 70 (Wilmette, Ill: U.S. Army Snow and Ice Permafrost Res. Establ.).
Bindlish, R., Jackson, T., Cosh, M., Zhao, T., and O'Neill, P. (2015). Global Soil moisture from the Aquarius/SAC-D satellite: Description and initial assessment. IEEE Geosci. Remote Sens. Lett. 12 (5), 923–927. doi:10.1109/LGRS.2014.2364151
Brogioni, M., Andrews, M. J., Urbini, S., Jezek, K. C., Johnson, J. T., Leduc-Leballeur, M., et al. (2022b). Ice sheet and sea ice Ultrawideband microwave radiometric airborne experiment (ISSIUMAX) in Antarctica: First results from Terra Nova Bay. Cryosphere Discuss. doi:10.5194/tc-2022-59
Brogioni, M., Leduc-Leballeur, M., Andrews, M. J., Macelloni, G., Johnson, J. T., Jezek, K. C., et al. (2022a). 500–2000-MHz airborne brightness temperature measurements over the East Antarctic plateau. IEEE Geosci. Remote Sens. Lett. 19, 7001005. doi:10.1109/LGRS.2021.3056740
Brogioni, M., Macelloni, G., Montomoli, F., and Jezek, K. (2015). Simulating multi-frequency ground based radiometric measurements at Dome C- Antarctica. IEEE J. Sel. Top. Appl. Earth Obs. Remote Sens. 8, 4405–4417. doi:10.1109/jstars.2015.2427512
Demir, O., Johnson, J., Jezek, K., Brogioni, M., Macelloni, G., Kaleschke, L., et al. (2022b). Studies of sea-ice thickness and salinity retrieval using 0.5–2 GHz microwave radiometry. IEEE Trans. Geosci. Remote Sens. 60, 4304412. doi:10.1109/TGRS.2022.3168646
Demir, O., Johnson, J., Jezek, K., Andrews, M., Ayotte, K., Spreen, G., et al. (2022a). Measurements of 540–1740 MHz brightness temperatures of sea ice during the winter of the MOSAiC campaign. IEEE Trans. Geosci. Remote Sens. 60, 5302011. doi:10.1109/TGRS.2021.3105360
Demir, O. (2021). Remote sensing of sea ice with wideband microwave radiometry. Doctoral dissertation (Columbus, Ohio: Ohio State University). OhioLINK Electronic Theses and Dissertations Center. Available at: http://rave.ohiolink.edu/etdc/view?acc_num=osu1638016458228432.
Duan, Y., Yardim, C., Durand, M., Jezek, K., Johnson, J., Bringer, A., et al. (2022). Feasibility of estimating ice sheet internal temperatures using ultra-wideband radiometry. IEEE Trans. Geosci. Remote Sens. 2022, 3208754. doi:10.1109/TGRS.2022.3208754
Gogineni, S., Braaten, D., Allen, C., Paden, J., Akins, T., Kanagaratnam, P., et al. (2007). Polar radar for ice sheet measurements (PRISM). Remote Sens. Environ. 111, 204–211. doi:10.1016/j.rse.2007.01.022
Gogineni, S., Kanagaratnam, P., Braaten, D., Akins, T., and Parthasarathy, B. (2004). “High-resolution mapping of near-surface internal snow layers with a wideband radar,” in Tenth International Conference on Ground Penetrating Radar, Delft, The Netherlands, June 21-24, 2004.
Hallikainen, M., and Winebrenner, D. P. (1992). “The physical basis for sea ice remote sensing.” in Microwave remote sensing of sea ice, Editor F. D. Carsey. doi:10.1029/GM068p0029
Jezek, K., Johnson, J. T., Kaleschke, L., Belgiovane, D. J., Chen, C. C., Bringer, A., et al. (2019). Remote sensing of sea ice thickness and salinity with 0.5-2 GHz Microwave Radiometry. IEEE Trans. Geosci. Remote Sens. 57 (11), 8672–8684. doi:10.1109/tgrs.2019.2922163
Jezek, K., Johnson, J. T., Tan, S., Tsang, L., Andrews, M. J., Brogioni, M., et al. (2018). 500-2000-MHz brightness temperature spectra of the northwestern Greenland ice sheet. IEEE Trans. Geosci. Remote Sens. 56 (3), 1485–1496. doi:10.1109/tgrs.2017.2764381
Jezek, K., Johnson, J., Drinkwater, M., Macelloni, G., Tsang, L., Aksoy, M., et al. (2015). Radiometric approach for estimating relative changes in intraglacier average temperature. IEEE Trans. Geosci. Remote Sens. 53 (1), 134–143. doi:10.1109/TGRS.2014.2319265
Jezek, K., Yardim, C., Johnson, J., Macelloni, G., and Brogioni, M. (2022). Analysis of ice-sheet temperature profiles from low-frequency airborne remote sensing. J. Glaciol. 2022, 1–11. doi:10.1017/jog.2022.19
Johnson, J., Jezek, K. C., Macelloni, G., Brogioni, M., and Tsan, L. (2021). Microwave radiometry at frequencies from 500 to 1400 MHz: An emerging technology for Earth observations. IEEE J. Sel. Top. Appl. Earth Obs. Remote Sens. 14, 4894–4914. doi:10.1109/jstars.2021.3073286
Kaleschke, L., Tian-Kunze, X., Maaß, N., Mäkynen, M., and Drusch, M. (2012). Sea ice thickness retrieval from SMOS brightness temperatures during the Arctic freeze-up period. Geophys. Res. Lett. 39 (5), L05501. doi:10.1029/2012gl050916
Kerr, Y., Waldteufel, P., Wigneron, J. P., Delwart, S., Cabot, F., Boutin, J., et al. (2010). 16 othersThe SMOS mission: New tool for monitoring key elements of the global water cycle. Proc. IEEE 98, 666–687. doi:10.1109/JPROC.2010.2043032
Macelloni, G., Leduc-Leballeur, M., Montomoli, F., Brogioni, M., Ritz, C., and Picard, G. (2019). On the retrieval of internal temperature of Antarctica Ice Sheet by using SMOS observations. Remote Sens. Environ. 233, 111405. doi:10.1016/j.rse.2019.111405
Macelloni, G., Brogioni, M., Leduc-Leballeur, M., Montomoli, F., Bartsch, A., Mialon, A., et al. (2018). “Cryorad: A low frequency wideband radiometer mission for the study of the cryosphere,” in IGARSS 2018 - 2018 IEEE International Geoscience and Remote Sensing Symposium, 1998–2000. doi:10.1109/IGARSS.2018.8519172
Maeda, T., Taniguchi, Y., and Imaoka, K. (2016). GCOM-W1 AMSR2 level 1R product: Dataset of brightness temperature modified using the antenna pattern matching technique. IEEE Trans. Geosci. Remote Sens. 54 (2), 770–782. doi:10.1109/TGRS.2015.2465170
Martos, Y. M., Jordan, T. A., Catalán, M., Jordan, T. M., Bamber, J. L., and Vaughan, D. G. (2018). Geothermal heat flux reveals the Iceland hotspot track underneath Greenland. Geophys. Res. Lett. 45, 8214–8222. doi:10.1029/2018GL078289
Matzler, C. (2006). “Microwave dielectric properties of ice,” in Thermal microwave radiation: Applications for remote sensing. IET electromagnetic waves series, vol. 52 Institute of engineering and technology. Editors C. Matzler, P. W. Rosenkranz, A. Battaglia, and J. P. Wigneron (Stevenage, UK: Institute of Engineering and Technology). Chapter 5. SBN: 0-86341-573-3 & 978-0-86341-573-9.
Miller, J. Z., Long, D. G., Shuman, C. A., Culberg, R., Hardman, M. A., and Brodzik, M. J. (2022). Mapping firn saturation over Greenland using NASA’s Soil moisture active passive satellite. IEEE J. Sel. Top. Appl. Earth Obs. Remote Sens. 15, 3714–3729. doi:10.1109/JSTARS.2022.3154968
Parkinson, C. (2019). A 40-y record reveals gradual Antarctic sea ice increases followed by decreases at rates far exceeding the rates seen in the Arctic. Proc. Natl. Acad. Sci. U. S. A. 116 (29), 14414–14423. doi:10.1073/pnas.1906556116
Picard, G., Brucker, L., Roy, A., Dupont, F., Fily, M., Royer, A., et al. (2013). Simulation of the microwave emission of multi-layered snowpacks using the dense Media radiative transfer theory: The DMRT-ML model. Geosci. Model. Dev. 5, 1061–1078. doi:10.5194/gmd-6-1061-2013
Rack, W., Price, D., Haas, C., Langhorne, P. J., and Leonard, G. H. (2021). sea Ice thickness in the western Ross Sea. Geophys. Res. Lett. 48, e2020GL090866. doi:10.1029/2020GL090866
Rignot, E., and Kanagaratnam, P. (2006). Changes in the velocity structure of the Greenland ice sheet. Science 311 (5763), 986–990. doi:10.1126/science.1121381
Robin, R. D. Q. (1977). Ice cores and climatic change. Philosophical Trans. R. Soc. Lond. B, Biol. Sci. 280 (972), 143–168.
Tan, S., Aksoy, M., Brogioni, M., Macelloni, G., Durand, M., Jezek, K., et al. (2015). Physical models of layered polar firn brightness temperatures from 0.5 to 2 GHz. IEEE J. Sel. Top. Appl. Earth Obs. Remote Sens. 8 (7), 3681–3691. doi:10.1109/JSTARS.2015.2403286
Tan, S., Tsang, L., Xu, H., Johnson, J., Jezek, K., Yardim, C., et al. (2021). A partially coherent approach for modeling polar ice sheet 0.5–2-GHz thermal emission. IEEE Trans. Geosci. Remote Sens. 59 (10), 8062–8072. doi:10.1109/TGRS.2020.3039057
Tiuri, M. E., Sihvola, A. H., Nyfors, E., and Hallikainen, M. (1984). The complex dielectric constant of snow at microwave frequencies. IEEE J. Ocean. Eng. 9 (5), 377–382. doi:10.1109/JOE.1984.1145645
Tsang, L., and Kong, J. A. (2000). Scattering of electromagnetic waves: Theories and applications, vol. 1. Hoboken, NJ, USA: Wiley, 203–217. ch. 5.
Tucker, W. B., Perovich, D. K., Gow, A. J., Weeks, W. F., and Drinkwater, M. R. (1992). “Physical properties of sea ice relevant to remote sensing.” in Microwave remote sensing of sea ice, Editor F. D. Carsey. doi:10.1029/GM068p0009F
Ulaby, R. M., and Fung, A. (1981). Microwave remote sensing: Active and passive. Norwood, MA: Artech House, 243.
Vant, M., Ramseier, R., and Makios, V. (1978). The complex dielectric constant of sea ice at frequencies in the range 0.1 – 40 GHz. J. Appl. Phys. 49, 1264–1280. doi:10.1063/1.325018
Wiesmann, A., and Mätzler, C. (1999). Microwave emission model of layered snowpacks. Remote Sens. Environ. 70, 307–316. doi:10.1016/s0034-4257(99)00046-2
Xu, H., Tsang, L., Johnson, J., Jezek, K. C., Yan, J., and Gogineni, P. (2020). A combined active and passive method for the remote sensing of ice sheet temperature profiles. Prog. Electromagn. Res. 167, 111–126. doi:10.2528/pier20030601
Xu, H., Medley, B., Tsang, L., Johnson, J., Jezek, K., Brogioni, M., et al. (2022). Polar firn properties in Greenland and Antarctica and related effects on microwave brightness temperatures. EGUsphere. preprint. doi:10.5194/egusphere-2022-698
Yardim, C., Johnson, J. L., Jezek, K. C., Andrews, M. J., Durand, M., Duan, Y., et al. (2022). Greenland ice sheet subsurface temperature estimation using Ultrawideband microwave radiometry. IEEE Trans. Geosci. Remote Sens. 60, 1–12. doi:10.1109/TGRS.2020.3043954
Keywords: ice sheets, sea ice, remote sensing, radiometry, microwave
Citation: Jezek KC, Johnson JT, Tsang L, Brogioni M, Macelloni G, Aksoy M, Kaleschke L, Wang S, Leduc-Leballeur M, Yardim C, Andrews M, Xu H, Demir O, Tan S and Miller J (2022) A review of recent developments in low-frequency ultra-wideband microwave radiometry for studies of the cryosphere. Front. Earth Sci. 10:1029216. doi: 10.3389/feart.2022.1029216
Received: 26 August 2022; Accepted: 28 October 2022;
Published: 10 November 2022.
Edited by:
Tianjie Zhao, Aerospace Information Research Institute, (CAS), ChinaReviewed by:
Georg Heygster, Institute for Environmental Physics, University of Bremen, GermanyCopyright © 2022 Jezek, Johnson, Tsang, Brogioni, Macelloni, Aksoy, Kaleschke, Wang, Leduc-Leballeur, Yardim, Andrews, Xu, Demir, Tan and Miller. This is an open-access article distributed under the terms of the Creative Commons Attribution License (CC BY). The use, distribution or reproduction in other forums is permitted, provided the original author(s) and the copyright owner(s) are credited and that the original publication in this journal is cited, in accordance with accepted academic practice. No use, distribution or reproduction is permitted which does not comply with these terms.
*Correspondence: K.C. Jezek, amV6ZWsuMUBvc3UuZWR1
Disclaimer: All claims expressed in this article are solely those of the authors and do not necessarily represent those of their affiliated organizations, or those of the publisher, the editors and the reviewers. Any product that may be evaluated in this article or claim that may be made by its manufacturer is not guaranteed or endorsed by the publisher.
Research integrity at Frontiers

Learn more about the work of our research integrity team to safeguard the quality of each article we publish.