 Chongxun Mo1,2
 Yue Shen1,2
 Xingbi Lei1,2*Huazhen Ban3Yuli Ruan1,2Shufeng Lai1,2
 Weiyan Cen1,2
 Zhenxiang Xing4
- 1Key Laboratory of Disaster Prevention and Structural Safety of Ministry of Education, College of Architecture and Civil Engineering, Guangxi University, Nanning, China
- 2Guangxi Key Laboratory of Disaster Prevention and Engineering Safety, College of Civil Engineering and Architecture, Guangxi University, Nanning, China
- 3Guangxi Hydraulic Research Institute, Nanning, China
- 4School of Water Conservancy and Civil Engineering, Northeast Agricultural University, Harbin, China
Dam-break is a serious disaster resulting in severe damage to downstream communities. Therefore, analyzing the affected range and the evolution process of dam-break floods in advance is valuable. However, the difficulties and challenges lie in the complexity of the breaking process of earth-rock dams, the uncertainty in the evolution of dam-break floods, and the geographical variability. Given this, the objective of this study is to analyze the characteristics of the dam-break flood evolution. The study chooses Chengbi River Reservoir as the research object, HEC-RAS as the simulation software, unsteady flow differential equations and one-dimensional Saint-Venant equations as the control equations, and it uses four-point implicit finite difference method for discrete solution. In this paper, the dam-break flood evolution is simulated under three boundary conditions (full breach, 1/2 breach, 1/3 breach), and the main results are as follows. From the dam site section to the Tianzhou hy-drological station section, the peak discharge decay rates of the three schemes are 78%, 77%, and 67%, respectively. The water level decay rates of the three schemes are 47%, 36%, and 30%, respectively. A 1 m increase in the bursting water level elevation increases the peak flow by ap-proximately 7%, and the highest water level in front of the dam by 1 m, and delays the peak time by 1.5 h on average. In addition, the preliminary inundation extent for the Baise City is obtained. The analysis results can provide a fundamental basis for flood control as well as a reference for flood disaster management.
1 Introduction
Dam-break floods are serious disaster, and the damage they cause is much greater than that caused by a general floods (Marangoz and Anilan, 2021). Flood dam is a dam to store floodwaters temporarily or to supply a surge of water. Once the dam break, it will bring unpredictable losses to people’s lives and properties downstream (Luo et al., 2020). To reduce the losses caused by dam-break floods, many researchers have carried out simulations to predict the extent of their impact and the damage they cause. Bharath et al. (2021) used HEC-RAS to generate an inundation map and to identify the areas affected. The method they used is a modern computer-based flood numerical simulation method that is more accurate and faster than traditional methods. Currently, the study on numerical simulated of flood evolution is a hot topic, and a variety of research methods are applied to it. For instance, the MIKE 11 model was used to determine the inundation range of floods (Nirwansyah and Braun, 2019; Jacob et al., 2020). The SWAT model was used to calculate flood runoff coefficients and combined with the GCM to create predictive assessments of flood hazards (Toosi et al., 2020). Liu and Liu (2011) used the finite volume method to create a one- and two-dimensional dam-break numerical model for simulating the dam-break water movement process under ideal conditions. HEC-RAS, LISFLOOD, and TELEMAC_2D were used to simulate the flood inundation of a 60-km channel in the Severn River, United Kingdom, and the results showed that HEC-RAS and TELEMAC_2D can better predict the inundation area (Horritt and Bates, 2002).
At present, the commonly used flood simulation software include MIKE, SWAT, HEC-RAS, and Xinanjiang model. (Yu et al., 2018; Yao et al., 2019; Tansar et al., 2020). Compared with other hydraulic software, HEC-RAS has a user-friendly interface, good software compatibility, and it facilitates the calculation of various hydraulic structures. Among which the most representative one, the HEC-GeoRAS plug-in, can be combined with ArcGIS to extract topographic data in areas without measured data and provide river geometry data for hydrodynamic simulation (Mokhtar et al., 2018; Raslan et al., 2020; Namara et al., 2021); therefore, the HEC-RAS model is selected for this study. One-dimensional or two-dimensional hydraulic models can be created in HEC-RAS (Lea et al., 2019). Many studies have used the one-dimensional HEC-RAS simulation method. For example, Jung and Kim (2017) compared the results of one-dimensional HEC-RAS simulation with the data obtained by unmanned aerial vehicles and inferred the submerged area and depth distribution of floods. Butt et al. (2013) used a one-dimensional HEC-RAS model to estimate the potential disasters caused by dam failure under different peak conditions. Bellos et al. (2020) studied the uncertainty of dam failure parameters by using a one-dimensional HEC-RAS dam failure model. Similarly, in this study, a one-dimensional model is chosen because, compared to a two-dimensional model, it gives good results in cases of flood propagation along the main river (Huanu et al., 2020), and takes less time to compute, which is more suitable for quickly responding to unexpected extreme events and achieving real-time assessments of risk (Kaya et al., 2017; Lea et al., 2019).
In conclusion, although many studies have obtained results by using HEC-RAS models to simulate dam-break floods, there are still some problems to be solved, and the major difficulties are as follows: ① The process of earth-rock dam collapse is extremely complex, and different forms of dam failure have different effects on flooding; therefore, a certain degree of simplification for the dam breach morphology is needed (Fu et al., 2018; Su et al., 2020). ② The dam-break flood is characterized by high peaks and waves, fast flow velocities, etc. When a dam-break flood evolves downstream, different failure modes will have different effects, which, combined with accuracy and errors challenges, make the evolution process of a dam-break flood highly uncertain (Zhou et al., 2014; Abdedou et al., 2020; Kalinina et al., 2020; Ge et al., 2021). ③ Geographical variability is also a major element affecting flood simulation (Sholtes et al., 2018).
To investigate the hydraulic characteristics of the dam failure flood under different dam-break conditions, the following framework is construed. ① The HEC-RAS (5.0.7) dam failure model is used to simulate the earth and rock dam failure process under various schemes and then analyze the effect of the failure model on the resulting flow process and water level process. ② A one-dimensional HEC-RAS (5.0.7) model is used to simulate the evolution of the dam failure flood with the boundary conditions of the breach flow process line for the three schemes; that is, full breach, 1/2 breach, and 1/3 breach, and then analyze its hydraulic characteristics and inundation extent of the evolution process.
The main contributions of this study are to analyze the effects of the duration time of dam break and the elevation of the bursting water level on the water level and discharge at the dam site, and to analyze the change in its hydraulic characteristics with the increase of the dam-break flood mileage. In addition, a preliminary inundation extent map for Baise City is obtained. The research results can have a guiding effect on the prevention of dam-break floods.
2 Materials and methods
2.1 Study site
Historically, rainfall in Baise is most concentrated in the summer. The city has two large reservoirs, the Chengbi River Reservoir and the Baise Reservoir, both of which have multiyear regulation functions. Heavy rainfall is prone to flash floods, destroying fields, houses, and water conservancy facilities. On 24 June 1967, the precipitation was 244 mm, resulting in 26,200 flooded acres, 24 flooded villages, and 4 deaths. In 1968, the waterlogged area was 0.78 million acres, leading to the loss of 362,500 kg of grain, six houses collapsed, five lives, and 17 water conservancy projects (Liao et al., 2005). On 21 September 2015, the dike in Wangdian Township, Baise City collapsed due to heavy rain, flooding 300 acres of fertile land and affecting nearly 200 affected farmers.
Chengbi River Reservoir is located on Chengbi River, a tributary of the Youjiang River in northern Baise City, Guangxi. The reservoir is the most representative earth-rock dam in Guangxi and is only 10 km away from the urban area of Baise City and therefore would cause much damage to it if breached (Mo et al., 2021). This large water conservancy hub project integrates irrigation, water supply, flood control and tourism. The main dam is an earth and stone dam with a concrete core wall and clay core wall, a crest elevation of 190.40 m, a maximum dam height of 70.4 m, a crest length of 425.0 m and a crest width of 10.0 m. The dam is equipped with a wave wall with a crest elevation of 191.80 m. The average multiyear flow rate of the dam site section is 37.8 m3/s and the average multi-year runoff is 1.192 billion m3. The design flood standard is 1,000 years flood design, 10,000 years flood check, and 1,121 million m3 total storage capacity. In this study, Chengbi River Reservoir is the object of study, and Youjiang District and Tianyang County of Baise City are selected as its scope; the area has many karst landforms, sinkholes, skylights, and peak clusters. The approximate location of the study area is shown in Figure 1.
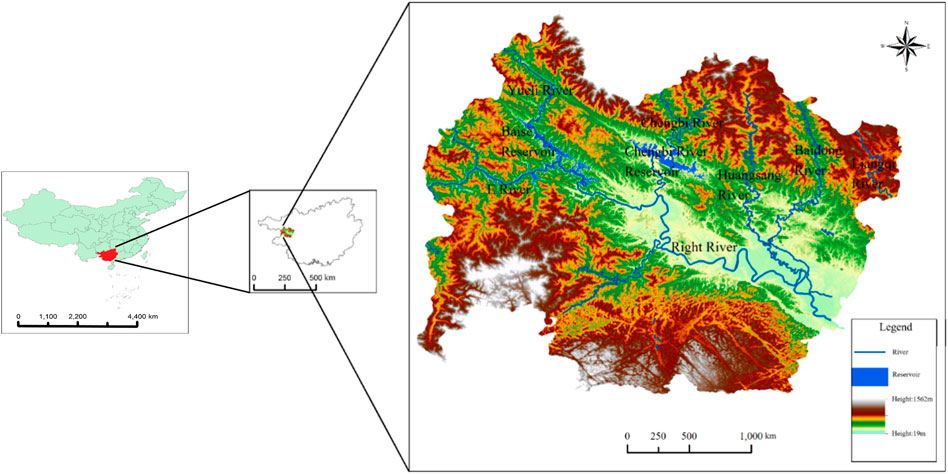
FIGURE 1. Geographical location of the study area.
In summary, the Chengbi River Basin was selected as the target watershed for this study because of its importance, typicality, and data feasibility. First, the city of Baise, located in the lower reaches of the Chengbi River basin, has high population density and economic development potential (Ma and Luo, 2018). Second, few studies have examined the evolution characteristics of dam-break floods in the Chengbi River Basin. Finally, the Chengbi River Basin has a sufficient size and detailed hydrometeorological observations to meet the needs of this study (Du et al., 2018).
The data used in this study mainly include topographic data and hydrological data. Topographic data are downloaded from the Geospatial Data Cloud [http://www.gscloud.cn/. (accessed on 7 January 2020)], provided by CNIC (Computer Network Information Center), and mainly include the DEM (Digital Elevation Model) for the study area. The data were collected from 2016 at a resolution of 30 m. The hydrological data come from the observation data of Chengbi River Reservoir BaShou station and mainly include the water level ∼ reservoir capacity relationship and the 10,000-year check flood hydrograph.
2.2 Methodology
2.2.1 Sensitivity analysis
The dam-break duration time is an important parameter for determining the characteristics of dam breaks. For parametric dam-break models, the duration time of dam-break needs to be determined from dam data and sensitivity analyses need to be performed. The Chengbi River dam was considered a total or partial breach, in order to analyze the sensitivity of dam-break peak discharge at the dam site and its downstream evolution process to the dam-break duration, nine schemes are set for the dam-break duration of overtopping: 2 h, 4 h, 6 h, 7 h, 8 h, 9 h, 10 h, 12 h and 24 h.
The dam-break duration time and the bursting water level elevation are the primary factors affecting the flow process and the flood peak of the breach, so sensitivity analysis was carried out on these two parameters by setting up different schemes to explore the extent of their influence on the flow process and the flood peak of the breach.
2.2.2 Constructing a dam-break model
The HEC-RAS dam-break model can simulate two modes of dam failure with overtopping and piping, and the breach flow is adopted from the broad top weir formula. Since most dam failures are due to overtopping (Middlebrooks, 1953; Xie and Sun, 2009), this study assumes the dam failure to be an overtopping dam break. Based on the shape of the breached dams, the paper sets the shape of the dam break as an trapezoid. To discuss the influence of different dam-break sizes on the discharge process and flood peak, three different dam-break sizes are set: full breach, 1/2 breach, and 1/3 breach. The characteristic parameters of the dam (crest elevation, dam-break height, reservoir capacity, etc.) are input into the HEC-RAS model, and the regression equation provided by HEC-RAS is applied to predict the final shape of the dam break.
In this study, nine different dam-break duration schemes and three kinds of water level elevations of dam breaks are proposed, and their influences on the discharge process and peak discharge of the dam site are analyzed. Specific data of each scheme are shown in Table 1. The upstream boundary of all programs uses the Chengbi River Reservoir 10,000-year check flood hydrograph, and the downstream boundary uses the normal water depth (river slope drop) of 2.38‰ (the average slope drop of Chengbi River); the initial condition dam front water level is 189.29 m of the check flood level. The research results of breaches can also provide upper boundary conditions for flood routing model.
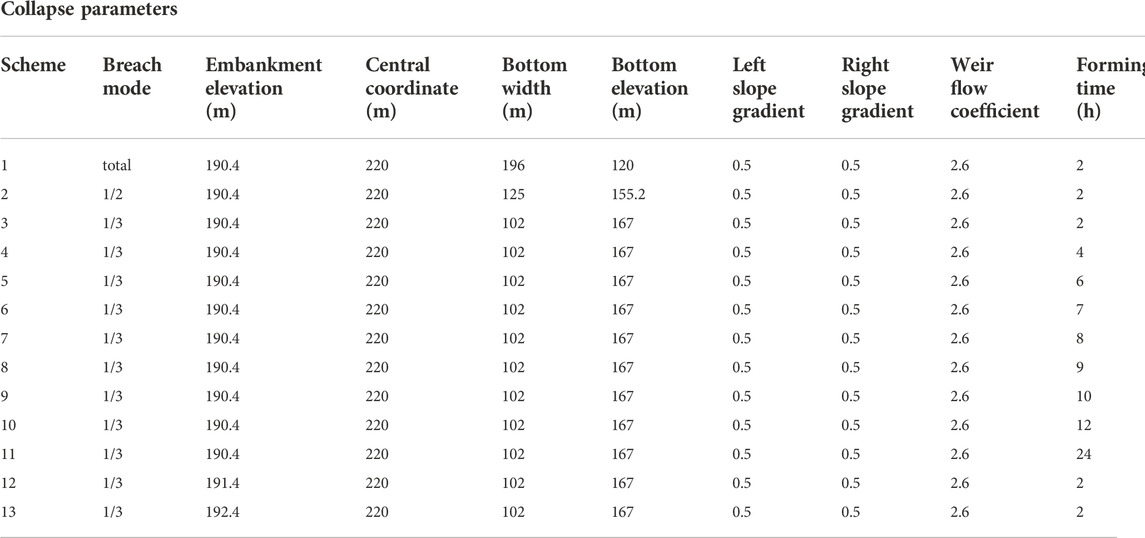
TABLE 1. Chengbi River Reservoir dam-break scheme design.
2.2.3 Constructing a one-dimensional flood model
Principle of the one-dimensional HEC-RAS model
The one-dimensional HEC-RAS model uses unsteady flow differential equations and control equations as a set of one-dimensional Saint-Venant equations, namely, the continuity equation and the momentum equation (Brunner, 2010).
Data gathering
Since the study area has only 7 km of measured topographic data, the measured information is insufficient. Therefore, the study is mainly based on the downloaded DEM data ASTER GDEM V2 version and uses the projection coordinates of WGS 1984. The HEC-GeoRAS plug-in combined with GIS was used to extract the geometric data required for the simulation and to modify and improve it with the measured terrain data. The specific steps of HEC-GeoRAS to extract the river geometric data are as follows:
First, Google Earth was used to determine the location of the geometric data, including the river shoreline, floodplain boundary line, reservoirs, and bridges, and then cross-sections were created at 1 km intervals with additional sections at 200 m for river bends, for a total of 145 sections. Last, the results of the preprocessed geometric data were imported into the HEC-RAS model, and by interpolation, sections were created at 200 m intervals for a total of 500 sections.
Constructing model
The hydrological data mainly contain water level, flow data, flow characteristics information, and boundary conditions. The flow data provide information on the boundary conditions and peak flow composition of the study area when constructing the model. The HEC-RAS model can simulate three flow regimes: slow flow, rapid flow, and mixed flow. The boundary condition is one of the necessary conditions for constructing the numerical model, and it varies with the simulated flow states. For unsteady flow simulation, the hydrological and hydraulic information includes initial conditions and boundary conditions information.
This study focuses on the characteristics of the Chengbi River Reservoir breach flood and its impact on downstream areas. According to the flood characteristics and basic information of the study area, when setting the boundary conditions, the upstream boundary condition of the model adopts the time-flow hydrograph, and the downstream boundary condition of the model adopts the normal water depth. In addition, the 10-year discharge of the Baise hydropower junction should be superimposed for analysis and research. According to previous studies (Xu et al., 2012), the final breach bottom width has a relatively small effect on the peak flow at the dam site, so this paper intends to set three kinds of breach final bottom elevations to analyze their effects on the flow process and peak flow at the dam site. Specific data of each scheme are shown in Table 2.
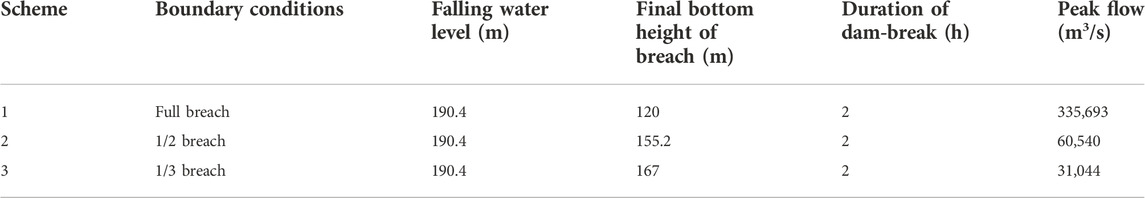
TABLE 2. Basic information sheet of each program.
Setting of parameters
(1) Selection of river roughness
Roughness is a parameter used to characterise the extent to which the roughness of the lower bedding wall affects the flow of water and is the most important parameter affecting the results of numerical flood simulations and hydrological analysis. Based on the downloaded 30 m resolution land cover information, HEC-GeoRAS was used to extract the section roughness as the initial value. To ensure that the section roughness value matches the actual one as far as possible, this paper used the flood results of the Baise hydropower junction, Chengbi River reservoir and the section below the Chengbi River estuary corresponding to the 1% frequency design peak flow of Baise Hydrological Station as the boundary conditions. Subsequently, HEC-RAS one-dimensional constant flow was used to determine the roughness rate of the river in combination with the water level, the discharge rate and the river characteristics at the hydrological station. The integrated roughness of the river channel is determined to be 0.045–0.06.
(2) Initial conditions
The multiyear average flow rate of the Chengbi River Reservoir is 37.8 m3/s, and the multiyear average flow rate of the middle reaches of the Youjiang River is 277 m3/s. The multiyear average flow rate of the two rivers is selected as the initial conditions of the model.
(3) Time step
The time step is an important condition affecting the model operation. Based on the convergence of the simulation results and the computational efficiency of the computer, the calculation time step is 1 min, and the output step of the hydrological process line is 10 min.
3 Results
3.1 Dam-break model
The analysis of breach flow characteristics is the primary focus of dam-break floods. Additionally, analysing the maximum flow evolution process of dam-break floods is important for flood control planning and engineering design and construction in urban areas downstream of reservoirs. Breach flow is one characteristic that reflects the immense destructiveness of dam-break floods. The breach duration and initiation elevation are the main factors affecting the breach flow process and flood peaks. Therefore, sensitivity analysis of parameters is carried out by setting different schemes to explore the influence of these parameters on the process of dam-break flow and flood peak. The HEC-RAS dam-break model was used to simulate nine dam-break schemes to obtain the breach flow hydrograph, water level hydrograph and flood peak flow information.
3.1.1 Impacts of duration time on dam break
As shown in Figure 2A, the shape of the breach flow hydrograph is similar to that of the check flood hydrograph in all nine schemes, and two peaks appear. The main peak flow differs greatly for different dam-break duration but the second peak is basically the same. The crash starts to occur after 300 min (5 h) of simulation. As the incoming water from upstream continues to increase, the breach flow increases rapidly to the peak flow, then subsides rapidly to a certain flow, and then subsides again after slowly increasing to the second peak, eventually converging to baseflow. As the dam breach period increases, the breach flow hydrograph becomes flatter. From Figure 2B, within 8 h, the longer the dam-break time is, the smaller the peak flow at the dam site, the later the peak is, the flatter the breach flow hydrograph is, and the greater the impact of the dam-break time on the breach flow process. From Figure 2C, it is known that after the dam breach period exceeds 8 h, the change in the hydrograph of the breach flow is not significant with the increase in the breach period, and there is no longer a significant relationship between the peak present time and the breach period; it basically appears after the water level reaches the dam crest elevation for 5 h. Overall, the longer the formation time of the breach, the later the peak appearance time, but when the breach formation time exceeded a certain time (8 h), the peak appearance time is advanced.
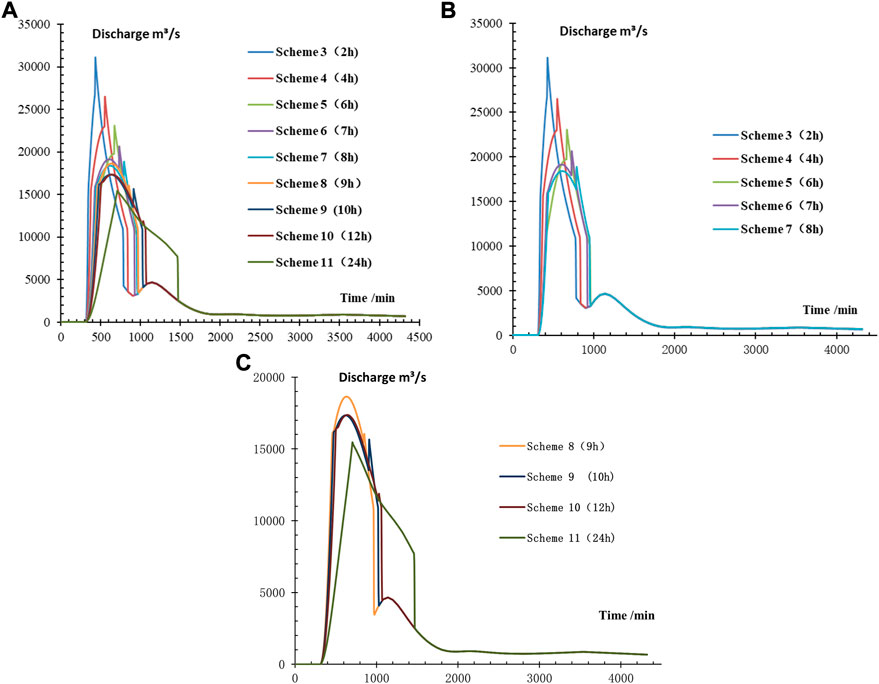
FIGURE 2. Discharge hydrograph of the dam break.
Figure 3 shows that the pre-dam level increases slowly and then decreases rapidly for all nine schemes, eventually levelling off with small fluctuations at approximately 167 m. The shorter the dam-break duration time is, the faster the pre-dam level decreases, but the change is not particularly significant, unlike the breach flow process, where there is a distinct time node (8 h) in the dam-break duration time that leads to a significant change in the pre-dam level process. This indicates that the dam-break duration has a small effect on the pre-dam level process.
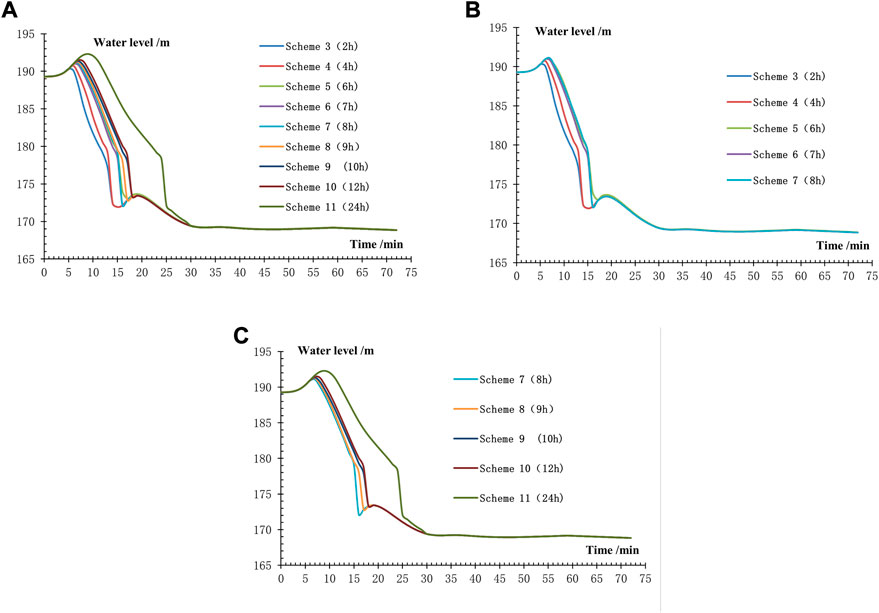
FIGURE 3. Hydrograph of the water level in front of the dam.
As seen in Table 3, the peak flow rate of all nine schemes is greater than the peak flow rate of the check flood, which is 8,160 m3/s. The peak flow rate of the dam breach for Scheme 3 is 31,044 m3/s, which is 3.8 times the check peak flow; the peak flow rate of Scheme 4 is 23,033 m3/s, which is 2.82 times the peak flow rate of the check flood, and the peak flow rate of scheme 5 is 17,353 m3/s, which is 2.12 times the peak flow rate of the check flood. With the increase in the dam breach duration, the peak flow at the breach decreases, and the peak discharge of Scheme 3 is twice as high as that of scheme 11. Within 8 h, the peak flow decreases by 26% when the duration of the breach is increased by a factor of 3 (based on 2 h); over 8 h, the peak flow decreases by 17% when the duration of the breach is increased by a factor of 3 (based on 2 h). The decline rate of peak discharge decreased by approximately 8%, which indicates that the weakening effect on the peak flow decreases when the duration of the breach increases beyond a certain range. Up to 8 h, the peak present time increases with the increase in the dam-break period and occurs at the final formation of the breach; after 8 h, the peak present time no longer increases with the increase in the dam-break period and always occurs approximately 10 h after the start of the simulation. This indicates that the peak present time no longer varies with the duration of the breach when it is beyond a certain range.
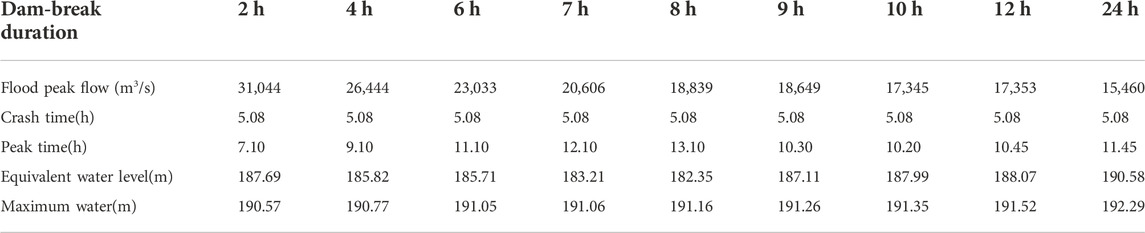
TABLE 3. Information on the peak discharge of the dam-break.
3.1.2 Impacts of elevation on bursting water level
Figure 4A shows that the shape of the route flow hydrograph is similar for the three schemes and similar to the check flood hydrograph; all of them have two peaks, and the main peak will increase due to the increase in the initiation elevation, while the second peak is not affected. The lower the bursting water level elevation is, the earlier the breach flow is generated and the earlier the flow drops after peaking, and the breach flow eventually tends to baseflow. This indicates that the bursting water level elevation has little influence on the flow process of the breach. As seen in Figure 4B, the shape of the pre-dam water level hydrograph is similar for all three schemes; it rises slowly to the crest elevation, continues to rise to the highest water level, falls off quickly to a certain level, then rises slightly to the next peak level, and finally stays near the final bottom elevation of the breach at 167 m with small fluctuations. The greater the elevation of the bursting water level is, the greater the highest water level in front of the dam; however, the difference is small. This indicates that the influence of the bursting elevation on the water level process in front of the dam is relatively small.
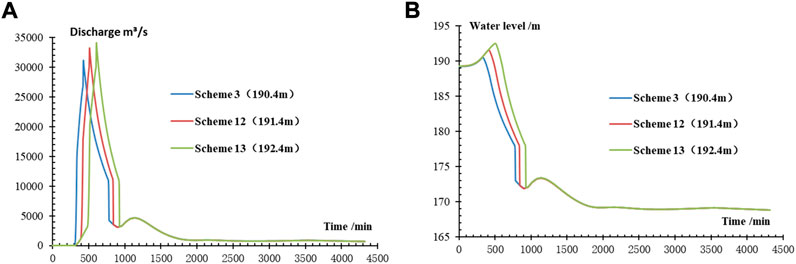
FIGURE 4. (A) Discharge hydrograph of dam break (B) Process line of the water level in front of the dam.
As shown in Table 4, the peak flow at the breach increases with increasing breach elevation, and the corresponding water level and the maximum water level in front of the dam increases as well. When the bursting elevation is 190.4 m, the peak flow at the breach is 31,044 m3/s; when the bursting elevation exceeds 191.4 m, the peak flow at the breach is 33,147 m3/s; and when the bursting water level elevation exceeds 192.4 m, the peak flow at the breach is 33,995 m3/s. A 1 m increase in bursting elevation increases the peak flow by 7%–2,103 m3/s and by 10%–2,954 m3/s for a 2 m increase in the bursting elevation. This indicates that the elevation of the bursting water level has a relatively small effect on the peak flow and pre-dam level and a large effect on the peak present time.
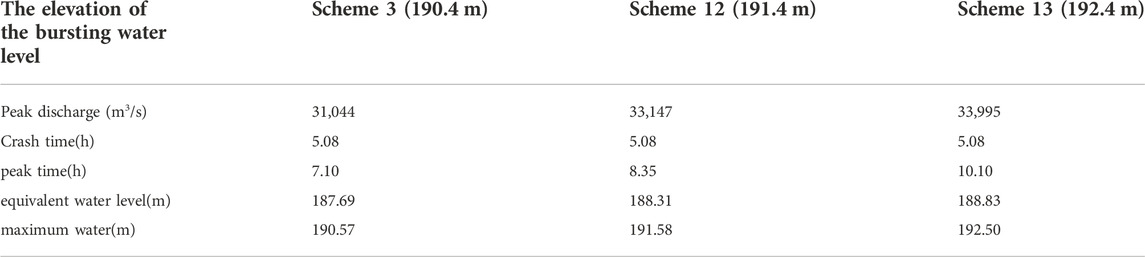
TABLE 4. Information on the peak discharge of the dam break.
3.2 One-dimensional flood model
Dam-break floods are characterized by large peaks and fast flow velocities. When a dam-break flood evolves downstream, different modes of the dam break will have different impacts. The key protection targets in the Chengbi River Reservoir are Baise City (10 km downstream), villages, buildings, roads, and farmland along the river downstream. In this section, nine representative sections downstream of the dam site (including the dam site section) are selected to analyze the dam-break flood characteristics of different schemes.
3.2.1 Flow processes at characteristic cross-sections of different schemes
Based on the HEC-RAS 1D simulation results and the characteristics of the study area, nine characteristic sections were selected for analysis, and the flow hydrographs of the characteristic sections for each scheme were obtained as shown in Figure 5 below. The along-range peak flow table of the dam-break flood is shown in Table 5, and the along-range trend of the peak flow for each scheme shown in Figure 6 was obtained.
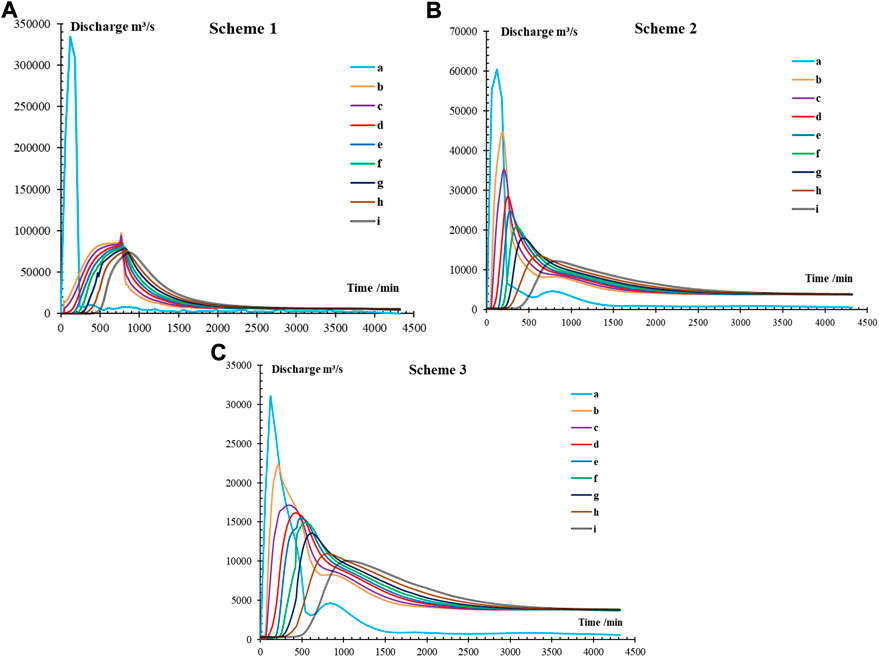
FIGURE 5. Discharge hydrograph of all program characteristic sections.
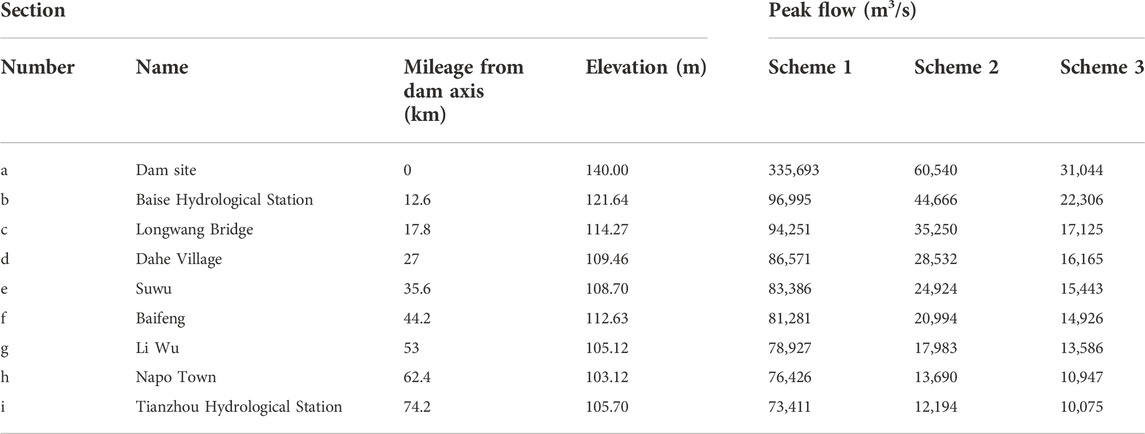
TABLE 5. Maximum flood peak flow along the dam breach.
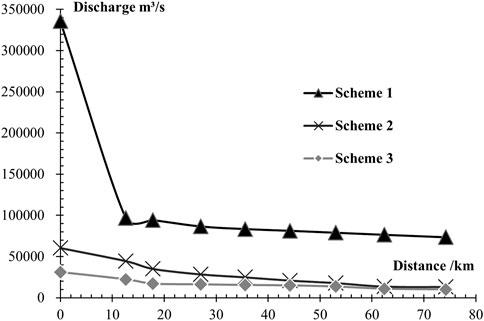
FIGURE 6. Trend of maximum peak flow along the path.
It can be seen from Figures 5A–C and Table 5 that under full breach conditions (Scheme 1), the discharge at the dam site rapidly rises to the peak discharge of 3,35,693 m3/s, oscillates slightly near the peak, and then decreases rapidly. There are eight characteristic sections downstream of the dam site, namely Baise Hydrological Station, Longwang Bridge, Dahe Village, Suwu, Baifeng Village, Liwu and Napo and the peak discharge decreases along the way. When reaching the section of Tianzhou Hydrological Station 73.4 km downstream of the dam site, the peak discharge decayed to 73,411 m3/s, with a decay rate of 78%, but far exceeded the check flood discharge of 8,160 m3/s. Under the condition of 1/2 dam failure (Scheme 2), the flood peak flow at the dam site rises rapidly to 60,540 m3/s, oscillates slightly near the peak value, and then decreases rapidly, reaching the section of Tianzhou Hydrological Station 73.4 km downstream of the dam site, and the flood peak flow attenuates to 12,194 m3/s, with an attenuation rate of 77%, still far exceeding the check flood discharge of 8,160 m3/s. Under the condition of 1/3 dam failure (Scheme 3, the dam failure lasted 2 h), the dam site flow rapidly rises to the peak flow of 31,044 m3/s, oscillates slightly near the peak value, and then decreases rapidly, reaching the section of Tianzhou Hydrological Station 73.4 km downstream of the dam site, and the peak flow attenuates to 10,075 m3/s with an attenuation rate of 67%.
Figure 6 shows that the slope of the peak flow variation curve becomes larger as it approaches the dam site. The slopes of the three schemes are 18,944.52, 1,259.84, and 693.49 in the vicinity of the dam site (12.6 km ahead), while the slopes of the three schemes are 278.81, 346.14, and 129.03 in the downstream area, far from the dam site (27 km–74.2 km away from the dam site). It can be seen that the flood peak flow rate of each scheme decreases along the course, and the closer it gets to the dam site, the more rapidly it decreases. By comparing schemes 1, 2, and 3, it is found that the flood peak flow rate at the dam site decreases as the flood evolves downstream.
In summary, with the increase in flood routing mileage, the peak flow process becomes flatter, and the peak flow decreases along the way. For dam failures of the same duration, as the degree of dam failure increases, the peak discharge of dam failure becomes greater, and the attenuation rate of the corresponding dam failure flood increases. For the same degrees but different durations of dam breaks, the peak discharge decays more slowly downstream, but the difference in peak discharge decreases when the distance is within a certain range.
3.2.2 Water level process in characteristic sections of different schemes
The dam-break flood level is an important indicator of downstream inundation severity. Results of the one-dimensional simulation for the water level process, maximum water level variation trend, and maximum flood level characteristic table of each scheme are sorted as follows.
From Figures 7A–C and Table 6, show that the water level process of all three schemes becomes increasingly flat along the course. Under full breach conditions (Scheme 1), the water level at the dam site rises rapidly to a maximum level of 257.75 m and then decreases rapidly. At a total of eight characteristic cross-sections downstream of the dam site, including the Baise hydrological station, Longwang Bridge, Dahe Village, Suya, Baifeng Village, Liya, Napo Town and the Tianzhou hydrological station, the flood water level decreases sequentially along the course and decays to 137.2 m when it reaches the cross-section of the Tianzhou hydrological station 73.4 km downstream of the dam site, with an attenuation rate of 47%. Under the 1/2 breach condition (Scheme 2), the water level at the dam site rises rapidly to 189.78 m, oscillates slightly near the peak, and then decreases rapidly to 121.76 m3/s at the Tianzhou hydrological station 73.4 km downstream of the dam site and has a decay rate of 36%. Under the 1/3 breach condition (Scheme 3), the flow at the dam site rises rapidly to a water level of 173.61 m, oscillates slightly near the peak, and then decreases rapidly to reach the Tianzhou hydrological station section 73.4 km downstream of the dam site, where the water level decays to 120.79 m and has a decay rate of 30%.
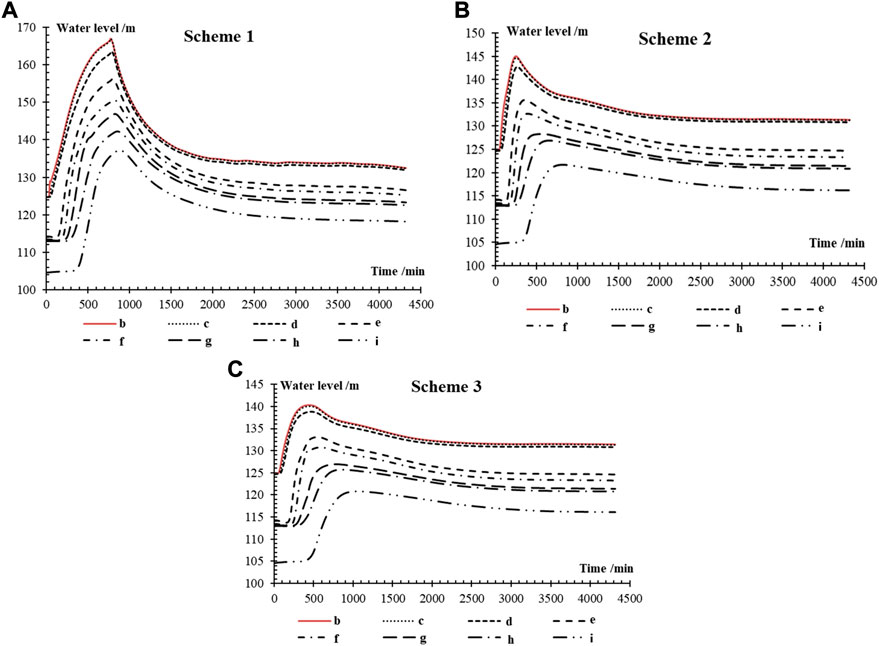
FIGURE 7. The stage hydrograph of all program characteristic sections.
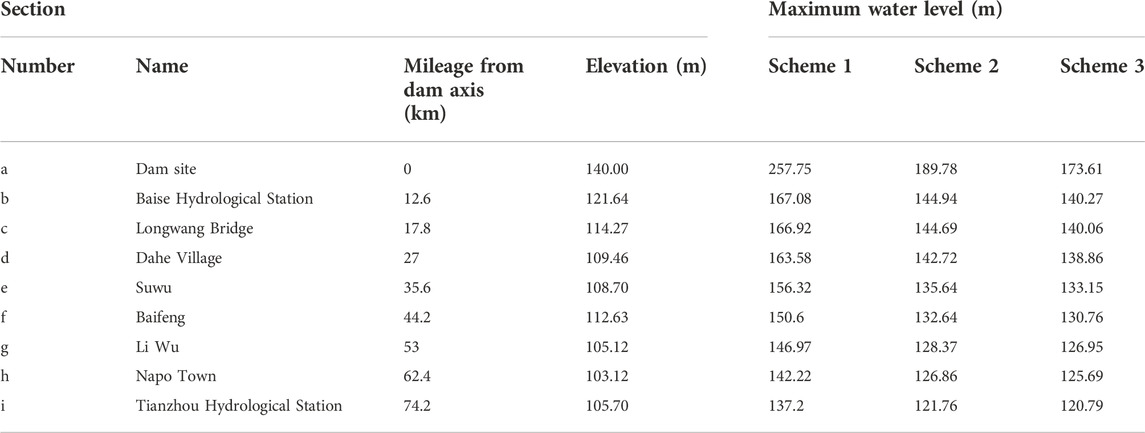
TABLE 6. Maximum water level change along the dam breach.
Figure 8 shows that the slope of the maximum water level change curve increases as it approaches the dam site. The slopes of the three schemes are 7.20, 3.56, and 2.65 in the vicinity of the dam site (12.6 km before), while the slopes of the three schemes are 0.56, 0.44, and 0.38 in the downstream area, far from the dam site (27 km–74.2 km from the dam site). The highest water level of the dam failure flood decreases along the course, and the closer to the dam site, the more rapid the decay becomes. Comparing schemes 1, 2, and 3, it is found that with the same dam failure duration time and different degrees of dam failure, the larger the water level at the dam site is, the higher the decay rate, and as the flood evolves downstream, the difference in water level between different schemes decreases, but there is still a large gap.
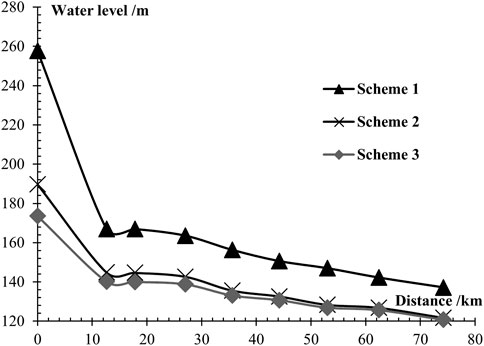
FIGURE 8. Trend of the maximum stage along the path.
In summary, with the increase in flood routing mileage, the flood water level process becomes flatter, and the water level decreases along the way. For the same duration of the dam break, with the increase in the dam break degree, the higher the dam break water level is, the higher the corresponding dam break flood attenuation rate.
3.2.3 Flood inundation range and water depth
Through one-dimensional dam-break flood routing simulations, the flood routing of different schemes is obtained. In reality, following its third reinforcement, the Chengbi River Reservoir dam became an earth-rock dam with mixed concrete and clay core walls; now, the probability of total failure is smaller, while the probability of 1/2 and 1/3 failure is larger. Therefore, using Scheme 2 and Scheme 3 as examples, this study analyzes the characteristics of the inundation range and depth of the dam-break flood. The maximum inundation range and depth distribution of the two schemes are shown in Figure 9.
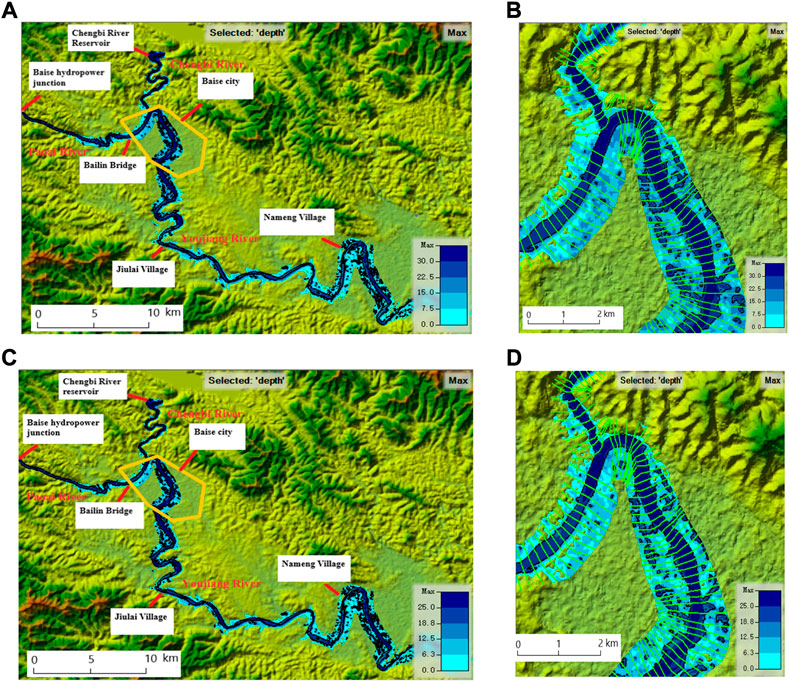
FIGURE 9. (A,B) Dam-break flood submerging range of Scheme 2, (C,D) Dam-break flood submerging range of Scheme 3.
As seen in Figures 9A,C, within the simulation range, the inundation ranges of the two schemes are basically the same from the dam site to 10 km downstream of the city of Baise; however, the inundation depth increases with the increase in dam-break flood inflow, i.e., the inundation depth of Scheme 2 is greater than that of Scheme 3. The inundation situation of the two schemes is similar; that is, the river section from the Chengbi River Reservoir dam site to the Youjiang River estuary is mostly mountainous terrain, and the dam-break flood basically flows within the river channel (elevations on both sides of the river are above 170 m). After reaching the urban area of Baise City, the terrain is open and flat, and a large number of floods flow to the shore for lateral movement (elevations on both sides of the river range between 125 m and 135 m). As the river flows to the vicinity of Jiulai Village on the border of Youjiang District and Tianyang County, the terrain again changes to mountainous landforms, and the flood basically flows in the river channel (elevations on both sides of the river are above 130 m). When it reaches the vicinity of Nameng Village and the terrain once again changes into an open small plain, the flood progresses to the riverbank again (elevations on both sides of the river range between 110 m and 115 m). The flood discharged from the Baise hydropower junction reaches the vicinity of the Bailin Bridge from the dam site, is relatively steep with a slope of 10.6‱, and almost unaffected by the dam-break flood of the Chengbi River, which basically flows in the river channel; on the other hand, due to the relatively flat topography of urban areas in Baise City and the large discharge and rapid flow of dam-break floods in the Chengbi River, the dam-break peak flows backward into the Paoai River, superposing the floodwater from the upstream Baise Reservoir and flowing towards the shore together, thus flooding both banks on a large scale.
4 Discussion
The effect of the dam breach shape on downstream flood processes examined in a previous study (Xu et al., 2012) showed that the influence of the dam site shape on downstream flood processes decreases as the distance of downstream flood evolution increases, and eventually several flow curves almost coincide at 120 km from the breach. However, the results in this study are slightly different. Although Scheme 2 and 3 have similar flow rates at 80 km downstream, Scheme 1 has a flow rate nearly four times larger than the other schemes. Under normal conditions, the bottom elevation of the breached dam, as well as the width of the bottom, will have an effect on the flow of the breached flood; the lower the bottom elevation and the wider the width, the larger the downstream flow will be. One reason for this difference is that the flow is much more affected by the depth than by the width to which it is subjected, and Scheme 1 has the lowest bottom dam elevation; thus, it is most affected. In addition, the selected cross-section is still too close to the breach, at 80 km, which is not enough to counteract the effects of the huge breach in Scheme 1, so the water flow is still affected by the shape of the breach. Moreover, the existence of flood storage and detention areas can have a slight impact on downstream flows (Li et al., 2008). Where large amounts of floodwater enter the downstream area of the Chengbi River Reservoir, the terrain on both sides of the river is open and flat, which greatly improves flood storage capabilities. Only when the dam-break flood reaches a certain scale and exceeds the regional impoundment capacity will the flood have a significant downstream impact.
The one-dimensional HEC-RAS model has good feedback for flood evolution simulation of long river channels in mountainous areas, but there are still shortcomings for flood evolution simulation in flat and open areas. As shown in Figures 9B,D, within the urban area of Baise City, almost all of the breach flood reaches the cross-sectional boundary line in the one-dimensional model for horizontal movement. Therefore, within the urban area of Baise City, the evolution of the dam-break flood cannot be characterized by using only the one-dimensional model simulation. Simulation using a two-dimensional model is required to calculate the inundation of different dam failure floods schemes in the urban area of Baise City. In future studies, the damage to the urban area can be investigated using two-dimensional simulations.
At present, most of the research results on dam-break flood simulation focus on the downstream inundation extent, but less on the hydraulic characteristics of the dam-break flood. In addition, few studies that have examined dam-break flood characteristics have focused only on non-karst areas rather than karst areas (Yang et al., 2018). As one of the most vulnerable landform types in the world, karst landscapes are highly sensitive to environmental changes. With the change of climate and the growing economic development of Baise city, it is of certain research significance to simulate the dam failure of Chengbi River Reservoir. In this study, Chengbi River Reservoir is chosen as the research object and simulated by HEC-RAS to analyze not only the possible inundation range downstream but also the detailed hydraulic characteristics of dam-break floods.
However, some shortcomings remain. 1) Dam-break floods carry large amounts of sediment. Although the impact of these sediments on the simulation may be relatively small and limited, from a scientific point of view, relevant information should be collected and added to the simulation model in the future to match the actual conditions as closely as possible. 2) Due to the complexity of the breaching mechanism, a dam breach simulation study based on only three set scenarios: full breach, 1/2 breach, and 1/3 breach, cannot reflect the full picture of the breach evolution and flooding process at the dam site. The study of earth and rock dam breach evolution and real-time dynamics of the flooding process will be enhanced in the future.
5 Conclusion
Understanding the characteristics of dam-break flood is important for the formulation of flood control plans and the construction of flood mitigation projects in downstream areas. Therefore, the HEC-RAS hydrodynamic model is used to simulate the flood evolution process in this study. The main conclusions are as follows.
(1) The longer the duration of the breach, the flatter the process of breach flow, the smaller the peak flow, and the later the peak present time. 8 h is a demarcation point for the duration of the Chengbi River Reservoir breach.
(2) The effect of the bursting water level elevation on the process of breach flow and the water level in front of the dam is relatively small. A 1 m increase in the bursting water level elevation increases the peak flow by approximately 7% and the highest water level in front of the dam by 1 m; the effect of the bursting water level elevation on the peak present time is larger, and the peak time is delayed by 1.5 h on average for every 1 m increase.
(3) For the same dam failure duration time, as the dam failure degree increases, the peak flow of the dam failure flood becomes higher and the corresponding dam failure flood attenuation rate rises. From the dam site section to the Tianzhou hydrological station, the attenuation rates of Scheme 1, Scheme 2, and Scheme 3 are 78%, 77%, 67%, respectively.
(4) For the same dam-break duration, with the increase in the dam-break degree, the higher the dam-break water level is, the higher the corresponding breach flood attenuation rate. From the dam site section to the Tianzhou hydrological station, the attenuation rates of Scheme 1, Scheme 2, and Scheme 3 are 47%, 36%, 30%, respectively.
These findings are very helpful to the downstream areas. In view of dam-break flood, the river section representing the dam site to Longwang Bridge has the most variable peak flow in all three schemes, indicating that the local government should pay attention to the maintenance and construction of embankments and flood control measures in this section. As seen from the flood inundation map, due to the sudden flat and open terrain, the flood broke away from the river channel and flooded both banks of Baise City and Nameng Village. Therefore, when a dam-break flood occurred, government agencies should evacuate the residents on both sides of the Chengbi River in these two areas. The study of the hydraulic characteristics of the dam failure flood in this paper can enable the government and related workers to activate their rescue and transfer center in the area with the greatest flood variation and reduce the allocation of rescue resources to downstream areas where the peak flow is stabilized, thereby protecting lives in the area downstream of the reservoir to the greatest extent. Data regarding the inundation range of Baise City shown by the one-dimensional model also can facilitate creating flood control and flood risk maps for Baise City to some extent, as well as support the rapid formulation of transfer plans to provide a basis for executing correct and efficient flood control decisions.
These findings can also be used for reference in the study of dam-break flow characteristics in other watersheds. Based on these findings, further research is needed. For example, analyzing the inundation area of the city by using two-dimensional HEC-RAS model. Furthermore, the dam-break flood risk assessment can be carried out in key areas.
Data availability statement
The original contributions presented in the study are included in the article/supplementary material, further inquiries can be directed to the corresponding author.
Author contributions
Conceptualization, CM, YS, XL, and YR; methodology, YS, XL, and HB; software, HB; validation, formal analysis and investigation, CM, YS and YR; resources, CM; data curation, WC; writing—original draft preparation, YS and HB; writing—review and editing, XL, YR and SL; supervision, YR; project administration, CM; funding acquisition, CM, YR and ZX All authors have read and agreed to the published version of the manuscript.
Funding
This research was funded by the National Natural Science Foundation of China (Grant No. 51969004), the Interdisciplinary Scientific Research Foundation of GuangXi University (Grant No. 2022JCC028), and the National Natural Science Foundation of China (51979038).
Conflict of interest
The authors declare that the research was conducted in the absence of any commercial or financial relationships that could be construed as a potential conflict of interest.
Publisher’s note
All claims expressed in this article are solely those of the authors and do not necessarily represent those of their affiliated organizations, or those of the publisher, the editors and the reviewers. Any product that may be evaluated in this article, or claim that may be made by its manufacturer, is not guaranteed or endorsed by the publisher.
References
Abdedou, A., Soulamani, A., and Tchamen, G. W. (2020). Uncertainty propagation of dam break flow using the stochastic non-intrusive B-splines Bézier elements-based method. J. Hydrology 590, 125342. doi:10.1016/j.jhydrol.2020.125342
Bellos, V., Tsakiris, V. K., Kopsiaftis, G., and Tsakiris, G. (2020). Propagating dam breach parametric uncertainty in a river reach using the HEC-RAS software. Hydrology 7, 72. doi:10.3390/hydrology7040072
Bharath, A., Shivapur, A. V., Hiremath, C. G., and Maddamsetty, R. (2021). Dam break analysis using HEC-RAS and HEC-GeoRAS: A case study of hidkal dam, Karnataka state, India. Environ. Challenges 5, 100401. doi:10.1016/j.envc.2021.100401
Brunner, G. W. (2010). “HEC-RAS (river analysis system),” in North American water & environment congress & destructive water. New York: Hydrologic Engineering Center of US Army Corps of Engineers.
Butt, M. J., Umar, M., and Qamar, R. (2013). Landslide dam and subsequent dam-break flood estimation using HEC-RAS model in Northern Pakistan. Nat. Hazards (Dordr). 65, 241–254. doi:10.1007/s11069-012-0361-8
Du, Y., Ma, R., and Zhao, L. (2018). Research on annual runoff prediction of Chengbihe River based on EEMD-BP-ANN model. Guangxi Water Resour. Hydropower Eng. 2018 (2), 11–14. doi:10.16014/j.cnki.1003-1510.2018.02.004
Fu, X., Gu, C. S., Su, H. Z., and Qin, X. N. (2018). Risk analysis of earth-rock dam failures based on fuzzy event tree method. Int. J. Environ. Res. Public Health 15, 886. doi:10.3390/ijerph15050886
Ge, W., Wang, X., Li, Z., Zhang, H., Gelder, P. H. A. J. M. V., Wang, T., et al. (2021). Interval analysis of the loss of life caused by dam failure. J. Water Resour. Plan. Manag. 147, 04020098. doi:10.1061/(asce)wr.1943-5452.0001311
Horritt, M. S., and Bates, P. D. (2002). Evaluation of 1D and 2D numerical models for predicting river flood inundation. J. Hydrology 268, 87–99. doi:10.1016/s0022-1694(02)00121-x
Huanu, E., Mihu-Pintilie, A., Urzica, A., Paveluc, L. E., and Grozavu, A. (2020). Using 1D HEC-RAS modeling and LiDAR data to improve flood hazard maps' accuracy: A case study from jijia floodplain (ne Romania). Water 12, 1624. doi:10.3390/w12061624
Jacob, X. K., Bisht, D. S., Chatterjee, C., and Raghuwanshi, N. S. (2020). Hydrodynamic modeling for flood hazard assessment in a data scarce region: A case study of bharathapuzha River basin. Environ. Model. Assess. (Dordr). 25, 97–114. doi:10.1007/s10666-019-09664-y
Jung, C. G., and Kim, S. J. (2017). Comparison of the damaged area caused by an agricultural dam-break flood wave using HEC-RAS and UAV surveying. Agric. Sci. 08, 1089–1104. doi:10.4236/as.2017.810079
Kalinina, A., Spada, M., Vetsch, D. F., Marelli, S., Sudret, B., Burgherr, P., et al. (2020). Metamodeling for uncertainty quantification of a flood wave model for concrete dam breaks. Energies 13, 3685. doi:10.3390/en13143685
Kaya, C. M., Tayfur, G., and Gungor, O. (2017). Predicting flood plain inundation for natural channels having no upstream gauged stations. J. Water & Clim. Change 10 (2), 360–372. doi:10.2166/wcc.2017.307
Lea, D., Yeonsu, K., and An, H. (2019). Case study of HEC-RAS 1D–2D coupling simulation: 2002 baeksan flood event in korea. Water 11, 2048. doi:10.3390/w11102048
Li, C., Huang, J., He, X., and Ma, X. (2008). Flood caused by dam failure of the Danjiangkou reservoir. J. Changsha Univ. Sci. Technol. Sci. 03, 1–7.
Liao, X. P., Hang, W. J., Shao-Long, L. U., and Quan, Y. S. (2005). Classification and genetic analysis of disaster flood in Baise City. Nanning: Gx Water Resources & Hydropower Engineering.
Liu, M. Q., and Liu, Y. L. (2011). Numerical simulation of 2D dam-break flow in a vertical plane. Appl. Mech. Mater. 130-134, 3620–3623. doi:10.4028/www.scientific.net/amm.130-134.3620
Luo, Y., Chen, X., and Yao, L. (2020). Flood disaster resilience evaluation of Chinese regions: Integrating the hesitant fuzzy linguistic term sets with prospect theory. Nat. Hazards (Dordr). 105, 667–690. doi:10.1007/s11069-020-04330-z
Ma, Y., and Luo, S. (2018). Analysis of the current situation of the tax source structure of the Baise economy and suggestions for optimization. Rev. Econ. Res. 47, 6. doi:10.16110/j.cnki.issn2095-3151.2018.47.009
Marangoz, H. O., and Anilan, T. (2021). Two-dimensional modeling of flood wave propagation in residential areas after a dam break with application of diffusive and dynamic wave approaches. Nat. Hazards (Dordr). 110, 429–449. doi:10.1007/s11069-021-04953-w
Middlebrooks, T. A. (1953). Earth-dam practice in the United States. New York: Transactions of the American Society of Civil Engineers.
Mo, C., Ruan, Y., Xiao, X., Lan, H., and Jin, J. (2021). Impact of climate change and human activities on the baseflow in a typical karst basin, Southwest China. Ecol. Indic. 126, 107628. doi:10.1016/j.ecolind.2021.107628
Mokhtar, E. S., Pradhan, B., Ghazali, A. H., and Shafri, H. (2018). Assessing flood inundation mapping through estimated discharge using GIS and HEC-RAS model. Arab. J. Geosci. 11, 682. doi:10.1007/s12517-018-4040-2
Namara, W. G., Damisse, T. A., and Tufa, F. G. (2021). Application of HEC-RAS and HEC-GeoRAS model for flood inundation mapping, the case of awash bello flood plain, upper awash River basin, oromiya regional state, Ethiopia. Model. Earth Syst. Environ. 8, 1449–1460. doi:10.1007/s40808-021-01166-9
Nirwansyah, A. W., and Braun, B. (2019). Mapping impact of tidal flooding on solar salt farming in northern java using a hydrodynamic model. ISPRS Int. J. Geoinf. 8, 451. doi:10.3390/ijgi8100451
Raslan, A. M., Riad, P. H., and Hagras, M. A. (2020). 1D hydraulic modelling of Bahr El-Baqar new channel for northwest Sinai reclamation project, Egypt. Ain Shams Eng. J. 11, 971–982. doi:10.1016/j.asej.2020.02.005
Sholtes, J. S., Bledsoe, B. P., Yochum, S. E., and Scott, J. A. (2018). Longitudinal variability of geomorphic response to floods. Earth Surf. Process. Landforms 43, 3099–3113. doi:10.1002/esp.4472
Su, H., Wen, Z., and Qian, C. (2020). Cellular automata-based analysis for seepage failure process of earth-rock dam. Struct. Control Health Monit. 27, e2553. doi:10.1002/stc.2553
Tansar, H., Babur, M., and Karnchanapaiboon, S. L. (2020). Flood inundation modeling and hazard assessment in Lower Ping River Basin using MIKE FLOOD. Arab. J. Geosci. 13, 934. doi:10.1007/s12517-020-05891-w
Toosi, A. S., Doulabian, S., Tousi, E. G., Calbimonte, G. H., and Alaghmand, S. (2020). Large-scale flood hazard assessment under climate change: A case study. Ecol. Eng. 147, 105765. doi:10.1016/j.ecoleng.2020.105765
Xie, J. B., and Sun, D. Y. (2009). Statistics of dam failures in China and analysis on failure causations. Water Resour. Hydropower Eng 40 (12), 124–128.
Xu, F., Zhou, H., Zhou, J., and Yang, X. (2012). A mathematical model for forecasting the dam-break flood routing process of a landslide dam. Math. Problems Eng. 2012, 16. doi:10.1155/2012/139642
Yang, S., Yang, W., Qin, S., Li, Q., and Yang, B. (2018). Numerical study on characteristics of dam-break wave. Ocean. Eng. 159, 358–371. doi:10.1016/j.oceaneng.2018.04.011
Yao, C., Ye, J., He, Z., Bastola, S., Zhang, K., and Li, Z. (2019). Evaluation of flood prediction capability of the distributed Grid-Xinanjiang model driven by weather research and forecasting precipitation. J. Flood Risk Manag. 12, 14. doi:10.1111/jfr3.12544
Yu, D., Xie, P., Dong, X., Hu, X., Liu, J., Li, Y., et al. (2018). Improvement of the SWAT model for event-based flood simulation on a sub-daily timescale. Hydrol. Earth Syst. Sci. 22, 5001–5019. doi:10.5194/hess-22-5001-2018
Keywords: dam-break flood, flood modeling, flood routing, HEC-RAS, water security, hydrograph
Citation: Mo C, Shen Y, Lei X, Ban H, Ruan Y, Lai S, Cen W and Xing Z (2023) Simulation of one-dimensional dam-break flood routing based on HEC-RAS. Front. Earth Sci. 10:1027788. doi: 10.3389/feart.2022.1027788
Received: 25 August 2022; Accepted: 30 September 2022;
Published: 10 January 2023.
Edited by:
Lei Wang, Institute of Tibetan Plateau Research, Chinese Academy of Sciences (CAS), ChinaReviewed by:
Wei Qi, Southern University of Science and Technology, ChinaHaiyun SHI, Southern University of Science and Technology, China
Wei Ge, Zhengzhou University, China
Copyright © 2023 Mo, Shen, Lei, Ban, Ruan, Lai, Cen and Xing. This is an open-access article distributed under the terms of the Creative Commons Attribution License (CC BY). The use, distribution or reproduction in other forums is permitted, provided the original author(s) and the copyright owner(s) are credited and that the original publication in this journal is cited, in accordance with accepted academic practice. No use, distribution or reproduction is permitted which does not comply with these terms.
*Correspondence: Xingbi Lei, bGVpeGluZ2JpQHN0Lmd4dS5lZHUuY24=