- 1National Supercomputing Center in Shenzhen, Shenzhen, China
- 2Frontiers Science Center for Deep Ocean Multispheres and Earth System, Key Lab of Submarine Geosciences and Prospecting Techniques MOE, College of Marine Geosciences, Ocean University of China, Qingdao, China
- 3School of Earth and Space Sciences, Peking University, Beijing, China
Microseismic event back-azimuth is an indispensable parameter for source localization in downhole microseismic monitoring, and the accurate orientation of horizontal components of downhole seismic receivers is vital for reliably determining the event back-azimuth. Variation in the monitoring data quality may jeopardize the accuracy of receiver orientation which will further affect the event back-azimuth estimation. To mitigate this issue, we proposed a new probabilistic method based on P-wave polarization analysis for receiver orientation and event back-azimuth estimation. The algorithm constructs the von Mises distribution function using the polarization angle and corresponding rectilinearity of the P-wave, then determines the target angle using the maximum of the probability function. The receiver having the highest rectilinearity from the active-source event is used to quantify a reliable absolute orientation angle, and the relative orientation angles are calculated by the probability distributions based on the measurement angle differences and the associated averages of rectilinearity from all events. After receiver orientation, the P-wave polarization angles with different rectilinearity values are applied to construct the probability distribution functions to estimate the event back-azimuths. By using high-quality events and multi-receiver recordings, our methodology can greatly reduce the unintentional error in receiver orientation and increase event back-azimuth accuracy. We investigate the feasibility and reliability of the proposed method using both synthetic and field data. The synthetic data results demonstrate that, compared to the conventional methods, the proposed method can minimize the variance of the receiver orientation angle and back-azimuth estimation. The weighted standard deviation analysis demonstrates that the proposed method can reduce the orientation error and improve the event back-azimuth accuracy in the field dataset.
Introduction
Microseismic monitoring technique is an efficient tool for evaluating the hydraulic fracture stimulation of unconventional reservoirs through recording and analyzing seismic signals caused by rock ruptures and/or fault reactivation (Maxwell, 2014; Grechka and Heigl, 2017; Li et al., 2019; Atkinson et al., 2020; Schultz et al., 2020). Downhole array is one of the common observatory systems for microseismic monitoring. It can provide higher quality data than surface/subsurface arrays due to its proximity to the fractured zone (Maxwell et al., 2010, 2012; Drew et al., 2012; Meng et al., 2018). For downhole microseismic monitoring, the determination of microseismic event back-azimuth is an important step in the data processing (Maxwell, 2014; Akram, 2020), and the accuracy of event back-azimuth has a significant impact on subsequent source location and fracture interpretation (Cipolla et al., 2011). Due to the influence of azimuth uncertainties, there is always error in the microseismic source location. Thus, it is critical to obtain accurate event back-azimuths to reduce the location errors to the utmost extent.
Three-component (3-C) geophones are normally placed in the vertical or deviated wells to record microseismic signals in mutually orthogonal directions. Because of rotation of the wireline during deployment, the orientation of the horizontal components of the receivers is unknown and usually random, which requires a receiver orientation correction approach to adjust them to the designated direction (for example, along the alignment between the calibration shot and monitoring well). By assuming that the polarization direction of the P-wave of the microseismic event coincides with its propagation direction, receiver orientation can be accomplished by performing polarization analysis using available calibration shots (e.g., perforation shots, string shots, ball-drop events, or vibroseis sources at the surface) to derive P-wave propagation direction, which can then be utilized to rotate the horizontal components to the correct direction (Nakamura et al., 1987; Menanno et al., 2013; Lagos and Velis, 2019; Huo et al., 2021). In addition to P-waves, Rayleigh waves have also been employed for receiver orientation (Niu and Li, 2011; Zha et al., 2013; Wang et al., 2016; Xu et al., 2018; Ensing and van Wijk, 2019; Takagi et al., 2019; Son et al., 2022; Yang et al., 2022). Receiver misorientations are defined as the deviations between the empirical and true back azimuths, and the relative-angle method by measuring the relative azimuth angle between receiver pairs is another strategy (Zeng and McMechan, 2006; Grigoli et al., 2012; Zhu et al., 2018; Ojo et al., 2019; Huo et al., 2021). The microseismic event back-azimuth can be obtained through statistical analysis of the P-wave polarization angles after receiver orientation (Chen et al., 2017; Meng et al., 2018; Tan et al., 2018). When the data quality of the P-wave is poor, the S-wave can also be applied for event azimuth estimation (Eisner et al., 2009; Yuan and Li, 2017).
Affected by the focal mechanism and background noise, the signal-to-noise ratio (S/N) of microseismic signals on different receivers is usually varied, which can also be reflected by the rectilinearity of the P-wave (Drew et al., 2008). Conventional methods of obtaining the receiver orientation angle from a single or several active-source events may contain unintended errors, which can be further transported to the event azimuth estimation. Additionally, after receiver orientation, the event back-azimuth estimation is also muddled because of the differences in the recording data quality among receivers. Apparently, more high-quality data may minimize the uncertainties in the azimuth results and the systematic deviation produced by a single dataset. For example, Huo et al. (2021) incorporate high-S/N microseismic events with unknown back-azimuths into the receiver orientation process to improve the accuracy of the relative orientation angles among all receivers.
In this study, by calculating the relative rotation angles between receivers, we develop a new receiver orientation and event back-azimuth estimation method for reducing the orientation error and enhancing the event back-azimuth accuracy. Firstly, we introduce the relationship between receiver orientation and event azimuth angles. Next, we calculate the probability density function (i.e., von Mises distribution function) using the polarization angle and corresponding rectilinearity of the P-wave to determine the relative orientation angles and then the event back-azimuths. Finally, we demonstrate the efficiency of the proposed method through synthetic and field data tests.
Methods
In this section, we first introduce the relationship among the event back-azimuth, the receiver orientation angle, and the polarization angle of the P-wave, as well as the definition of the relative orientation angle between receivers and potential back-azimuth angles on multi-level receivers. Then, we construct the probability density functions by using the polarization angle and rectilinearity of the P-wave to determine the relative orientation angle and event back-azimuth. Finally, we establish the processing workflow for receiver orientation and event back-azimuth estimation.
Receiver orientation and event back-azimuth
If the monitoring well is vertical (Figure 1A), we can assume that the horizontal components of the receivers are in a plane parallel to the surface. As shown in Figure 1B, we also assume that the ‘North’ component is misorientated by degrees defined clockwise from north. Table 1 summarizes the meaning of the adopted symbols in Figure 1 and following text.
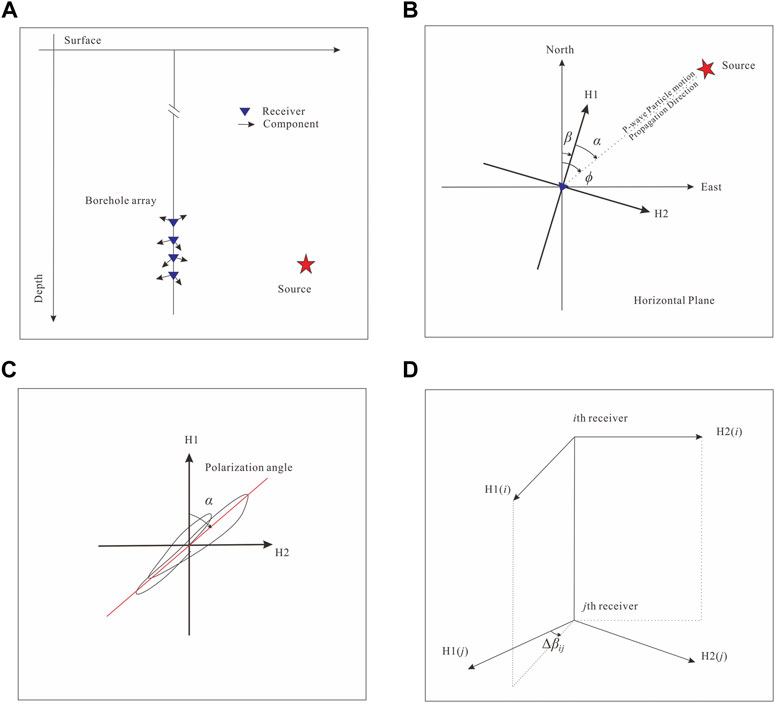
FIGURE 1. (A) Sketch of a vertical borehole with a linear array of receivers. (B) Illustration of the relationship among three angles: the event back-azimuth, the receiver orientation angle, and the polarization angle of the P-wave. (C) Schematic hodogram of particle motion. (D) Illustration of the relative angle between receivers.
For an incoming P-wave of an active-source event with a known location, the event back-azimuth
On the other hand, for a microseismic event whose location is unknown, we can calculate the event back-azimuth
In general, the receiver orientation angles at different receivers are determined individually based on P-wave polarization analysis of active-source events. However, the data S/N may vary on different receivers and events and this will introduce additional errors in the estimation of the receiver orientation angles. This kind of error is difficult to avoid when only a single or a small number of active-source events are available.
In fact, because the back-azimuth angles on different receivers in a vertical well are the same for every event (Figure 1D), the relative orientation angle between any two receivers is defined as
where
If a valid relative orientation angle can be acquired, a reliable absolute orientation angle and the relative angles can be used to drive the receiver angle, which is expressed as
where l denotes the reference receiver with the highest rectilinearity or S/N of P-wave,
Once the receiver orientation angle
where
Measurement of the P-wave polarization parameters
The polarization parameters of P-wave can be determined by calculating the eigenvalues and eigenvectors of a covariance matrix constructed using windowed waveforms around the P-wave arrival. The covariance matrix C for the two horizontal components is written as
We solve the eigenproblem and obtain the eigenvalues
The value of L lies in the range of 0–1, where L=0 indicates circular polarization trajectory and L =1 indicates linear trajectory. L characterize the linearity of the particle motion and can also affect the reliability of
Von Mises distribution
The von Mises distribution is a circular normal distribution and has been widely used to model circular data (Lark et al., 2014). It consists of two parameters which are the mean direction and concentration parameters. When the concentration parameter is zero, the distribution represents a uniform distribution over the unit circle (Lark et al., 2014). The expression of the von Mises distribution is
where
where
Figure 2 displays the examples of the von Mises distribution functions computed using
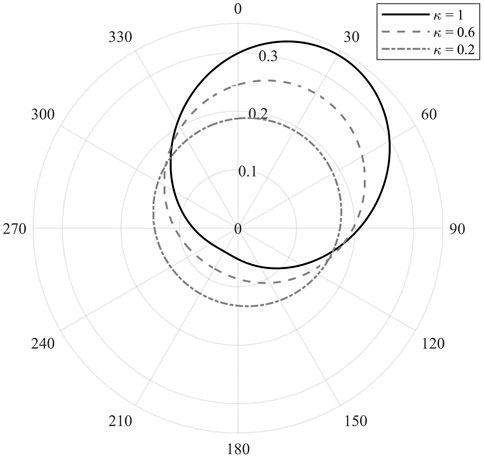
FIGURE 2. Probability density function
In practice, this von Mises distribution function is computed for each event and receiver, and then summed up to formulate one global function.
where, M is the number of angles involved in the calculation. The maximum of this global function is taken as the optimal estimate of the target angle.
The proposed method
According to Eq. 3, we utilize all recorded microseismic events to compute relative orientation angles between receiver pairs. After rotating by these relative angles, all receivers will be orientated in the same direction with respect to an absolute azimuth. This absolute azimuth can be obtained by comparing the polarization angle of a reference receiver with the geometry angle of the active-source event. After removing the influence of receiver misorientation, we can determine all microseismic event back-azimuths using Eq. 5. We construct the von Mises distribution functions to determine the relative orientation angles by using all events and then the event back-azimuths by using multi-level recordings. The proposed method for receiver orientation and event back-azimuth estimation can be described as follow:
1) The polarization angle
2) Preliminary orientation angles
3) The relative orientation angles
4) After receiver orientation (Eq. 5), the potential angles
Numerical examples
In this section, we utilize synthetic data test to demonstrate the reliability of the proposed method. A 30 Hz Ricker wavelet is used as the synthetic source wavelet. Random waveform amplitudes and Gaussian noises are applied to generate the synthetic recordings with varying S/N. We ignore the arrival time differences (i.e., moveouts) at different receivers in the simulation because it has a very limited effect on determining the event back-azimuth. The results of the proposed method are compared with those of two other commonly used approaches, which determine the receiver orientation angle and event back-azimuth using the average value of the calculated angles and the angle corresponding to the maximum rectilinearity, respectively.
The first synthetic data example illustrates the accuracy in calculating the relative receiver orientation angle using the probability distribution function. 50 microseismic events at different locations are used to generate synthetic recordings at two receivers, and a predefined rotation angle (i.e., 30°) is adopted to rotate the synthetic waveforms on the second receiver to simulate the actual situation of different receiver orientation directions in a vertical well. Figure 3A shows the waveforms of two horizontal components of the P wave from the 50 synthetic microseismic events. We calculate the polarization angle and the rectilinearity of the P-wave of each event (i.e., each trace in Figure 3A) using Eqs 7, 8. The polarization angle differences between two receivers and the average rectilinearity values are applied to construct von Mises distribution functions, which are then summed up to formulate one global function (Eq. 11). Figure 3B shows the distribution of the angle differences and the rectilinearity values of these 50 events (the gray dots), and the polar radius coordinate denotes the average rectilinearity of the P-wave. We calculate the von Mises distribution functions of each event and obtained the normalized probability distribution function (the black curve). Note that the range of the probability density is 0–1. In this case, the angle corresponding to the maximum (equal to 1, denoted by the red cross) of the global function is 29.7°, which is only 0.3° away from the true value. Without loss of generality, the above test is repeated 100 times using synthetic data with different S/N (i.e., 0–40 dB) to verify the stability of the proposed method. We maintained the source locations and the predefined rotation angle consistent in the simulations. Figure 3C shows the results of the proposed method (the red crosses), the average relative orientation angles at different receivers (the green crosses), and the angles corresponding to the receivers having the maximum rectilinearity (the blue crosses). The standard deviations of the results of the three approaches are 0.42°, 2.65°, and 0.96°, respectively. This clearly indicates that our method can obtain more accurate relative orientation angles.
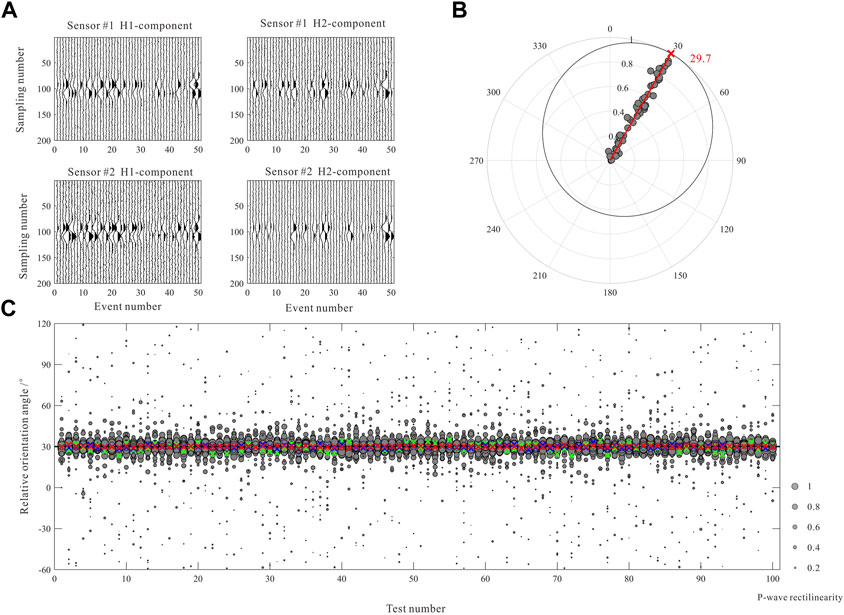
FIGURE 3. Comparisons of the relative orientation angle calculated by the proposed method and the conventional approaches. (A) Waveforms of the P-wave of 50 microseismic events recorded by 2 receivers. (B) The distribution of the polarization angle differences and the corresponding rectilinearity (the gray dots), and the normalized global probability distribution function (the black curve). The red cross indicates the angle corresponding to the maximum probability density. (C) The results of 100 groups of synthetic recordings with different random noises. The red, green, and blue crosses represent the results of the proposed method, the average values of the orientation angles at different receivers, and the angles corresponding to the receiver having the maximum rectilinearity, respectively. The size of the dots denotes the P-wave rectilinearity.
The second synthetic data example illustrates the accuracy in determining the event back-azimuth by the probability distribution function. Note that different from Figure 3A, Figure 4A shows the two horizontal components of the P-wave of one synthetic microseismic event recorded on ten receivers. The true back-azimuth of this event is set to 45°. Figure 4B shows the normalized probability distribution of the event back-azimuth. In this case, the angle corresponding to the maximum (equal to 1, denoted by the red cross) of the global function is 44.5°, which is 0.5° away from the true value. Similar to the first synthetic test, we also repeat this test 100 times and the results are shown in Figure 4C. It is shown that the results of the proposed method (the red crosses) are more accurate than the average values of the azimuths determined for all receivers (the green crosses) and the angles corresponding to the maximum rectilinearity (the blue crosses). The standard deviations of these three sets of results are 0.83°, 1.04°, and 1.59°, respectively, indicating that our method can also obtain more accurate event back-azimuth.
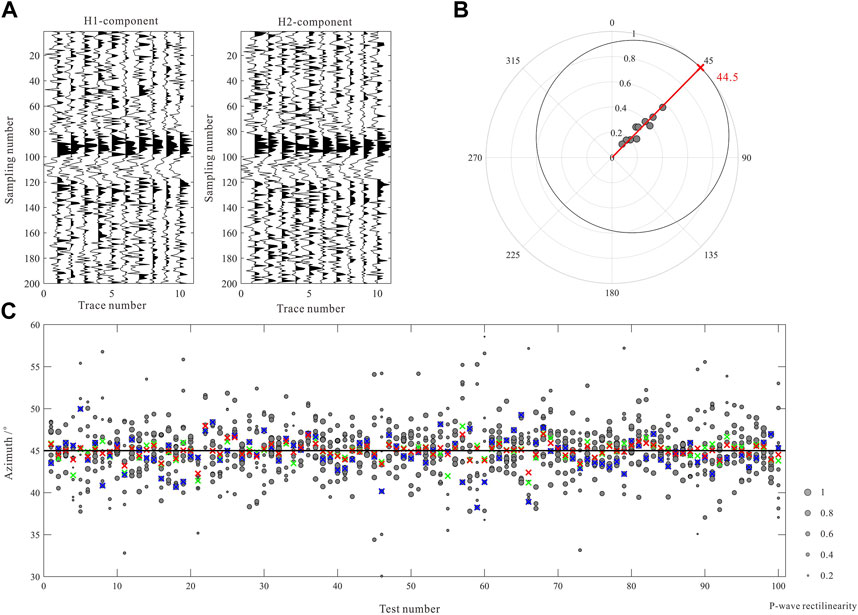
FIGURE 4. Comparisons of the event back-azimuth estimated by the proposed method and the conventional approaches. (A) Waveforms of the P-wave of one microseismic event recorded by 10 receivers. (B) The distribution of the polarization angles and corresponding rectilinearity (the gray dots), and the normalized global probability distribution function (the black curve). The red cross indicates the angle corresponding to the maximum probability density. (C) The result of 100 groups of synthetic event recordings with different random noises. The red, green, and blue crosses represent the results of the proposed method, the average values of the angles, and the angles corresponding to the maximum rectilinearity, respectively. The size of the dots reflects the P-wave rectilinearity.
Field data application
In this section, we demonstrate the performance of the proposed method on real dataset. The real dataset was acquired from a fractured tight reservoir in the Shengli oil field of eastern China. A downhole array composed of 15 levels of 3-C geophones is deployed in a vertical monitoring well at depths from 2443 to 2673 m. The duration of the monitoring data is more than 27 h and the sampling interval is 0.5 ms. A perforation shot is fired in a third well located approximately 920 m northwest of the monitoring well before the hydraulic fracturing stimulation begins. Figure 5 shows the survey geometry of the real case. A total of 521 microseismic events are detected in the monitoring data, including 11 ball-drop events with known locations (Figure 5C). The P-wave arrival times of the microseismic events are determined using the joint STA/LTA-polarization-AIC method (Tan and He, 2016), and then refined by the global optimization method based on iterative cross-correlation (Leng et al., 2022).

FIGURE 5. Survey geometry of the real data case. (A) 3D view; (B) depth view; (C) planar view. The triangles represent the receivers. The stars represent the fracturing stages. The asterisk represents the perforation shot. The blue circles represent the ball-drop locations.
Normally, all active-source events with known locations (e.g., the perforation shot or ball-drop event) should be utilized for receiver orientation. However, as shown in Figure 6, there are clearly discrepancies in the quality of real data. To show how data quality affects receiver orientation results, we perform receiver orientation using two independent events with known locations, which are the perforation shot and the first ball-drop event (Figure 5). Figure 7 shows P-wave waveforms after moveout correction of the perforation shot event and a microseismic event, while Figure 8 shows the hodograms of two horizontal components of these events, as well as the calculated polarization angles and rectilinearity values at all receivers.
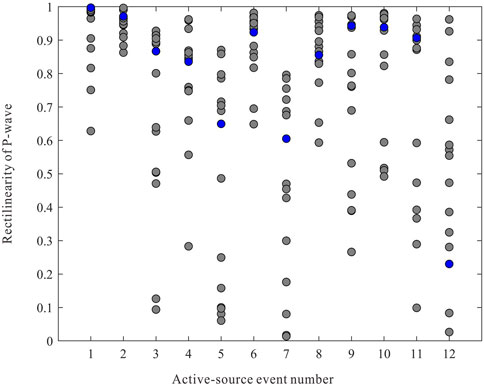
FIGURE 6. P-wave rectilinearity on different receivers from the 12 active-source events. The first event is the perforation shot and the others are ball-drop events. The blue circles represent the 6th receiver.
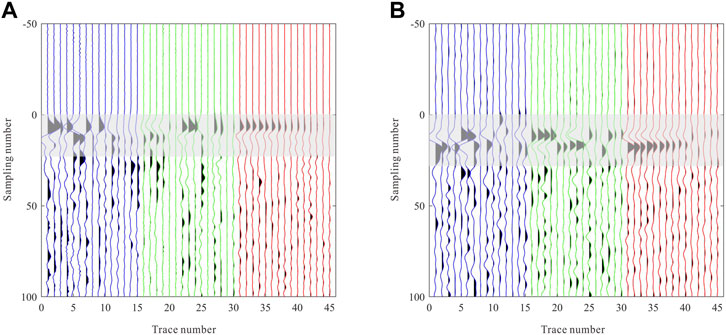
FIGURE 7. P wave after moveout correction. (A) P wave of the perforation shot event. (B) P wave of a microseismic event. Blue, green and red lines represent H1-, H2-, and vertical components respectively.
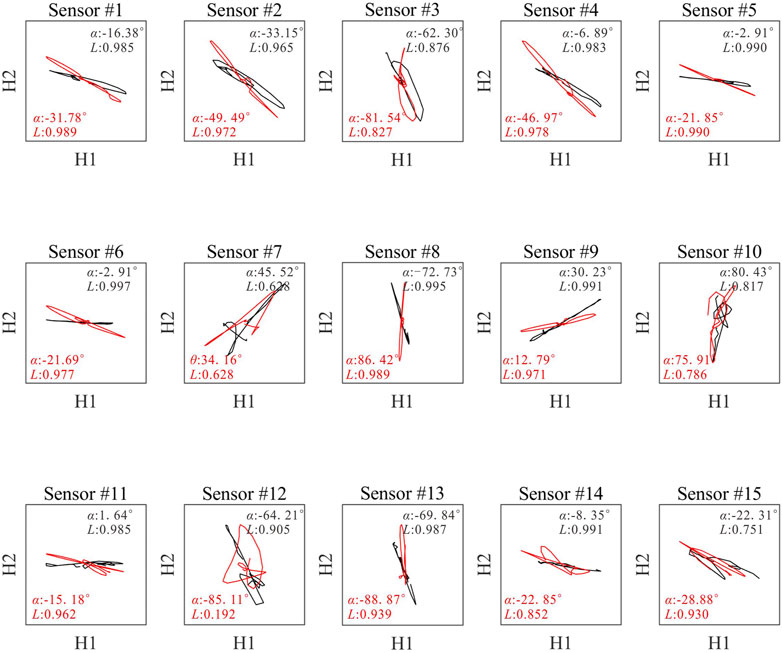
FIGURE 8. Hodograms of two horizontal components from two events shown in Figure 7. Black and red lines represent the perforation shot event and a microseismic event, respectively.
The receiver orientation results obtained from above two events are listed in Table 2. Because the P-wave of perforation shots on the 6th receiver in Figure 6 generally has the maximum rectilinearity, we choose the 6th receiver as the reference to calculate the relative orientation angles of other receivers. The relative angle differences and the average rectilinearity values from all recorded events are then utilized to construct the von Mises distribution functions and formulate the global functions. The relative orientation angles obtained from the perforation shot are used to correct the calculation of the relative orientation angles in all events for resolving the 180° ambiguity. Figure 9 depicts the polar diagrams of the relative angle differences and the average rectilinearity values from all events at those receivers. The relative receiver orientation angles can be obtained by calculating the maximum values of the probability density functions (denoted by the red crosses in Figure 9).
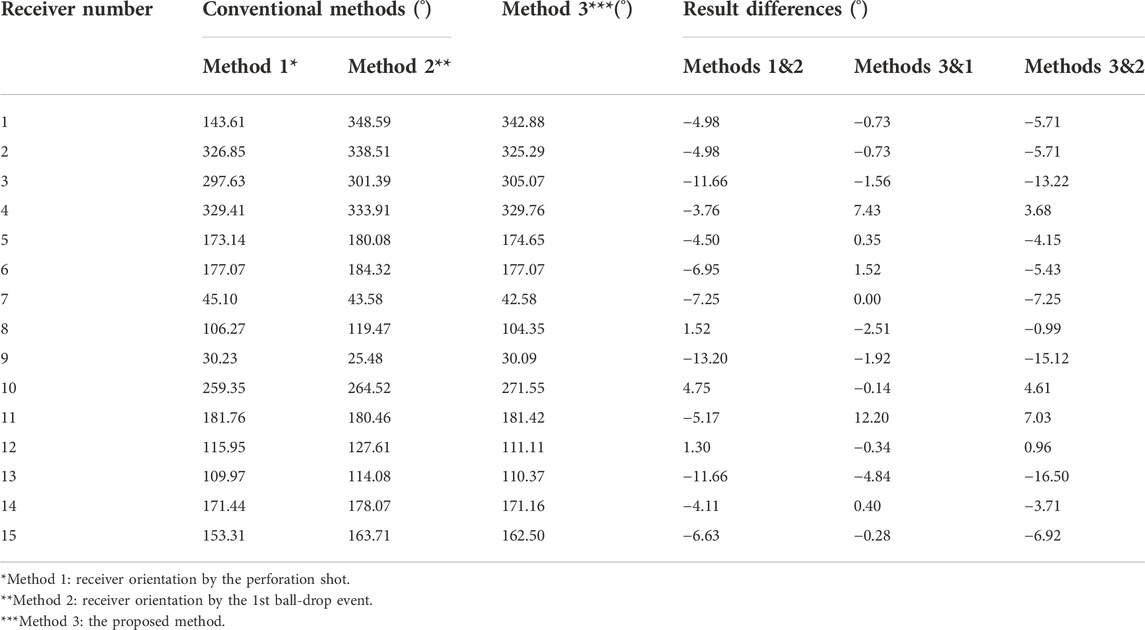
TABLE 2. Comparison between orientation angles obtained with the conventional methods and our proposed method.
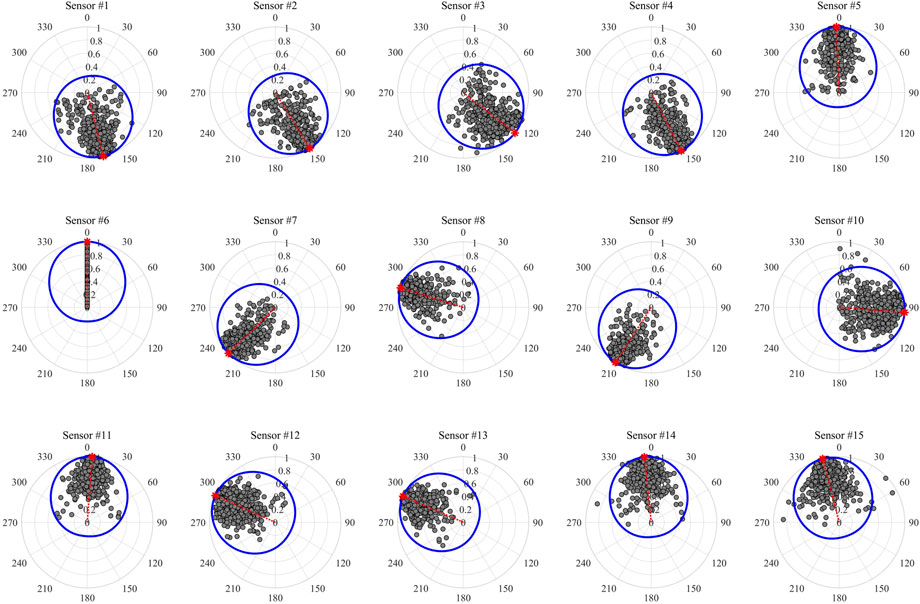
FIGURE 9. Diagram of relative orientation angle calculation. The grey dots represent the distribution of the polarization angle differences and the corresponding rectilinearity average, and the blue curve represents the normalized global probability distribution function. The red cross indicates the angle corresponding to the maximum probability density. The radius coordinate denotes both rectilinearity average of the P-waves and the normalized probability density.
The results of the proposed method are compared with those of the conventional methods which only use one active-source event, as shown in Table 2. Conventional methods applied to two independent active source events provide various results, reflecting that the receiver orientation is greatly affected by the quality of event recordings. From Table 2, it can be seen that the maximum difference between the results obtained by the proposed method and the conventional method using the perforation shot is 12.2°, which can influence the accuracy of the estimated event back-azimuth. Thus, we adopt the event back-azimuths on different receivers after receiver orientation to analyze the accuracy of the receiver orientation results. Figure 10 depicts the angles on all receivers acquired by the three approaches using one ball-drop event and one microseismic event as examples. The figure demonstrates that, when compared with the conventional methods, the angles obtained by the proposed method are more concentrated, suggesting that the proposed method can more reliably determine the receiver orientations and hence the event back-azimuth.
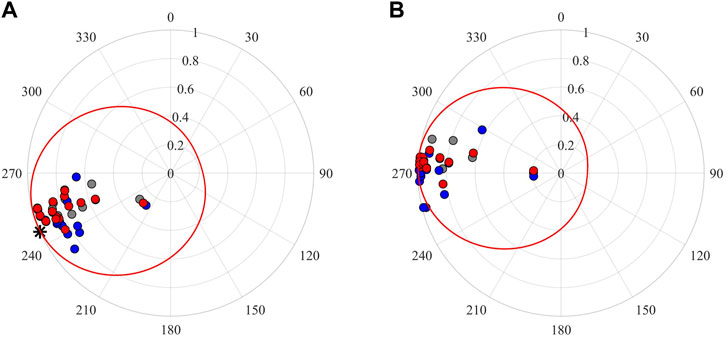
FIGURE 10. Distributions of the event potential back-azimuths on the 15 receivers by three approaches. (A) The back-azimuths of the 3rd ball-drop event. The black asterisk in Figure 10A represents the true ball-drop event azimuth. (B) The back-azimuths of the microseismic event (as shown in Figure 7A). The gray, blue, and red circles represent the results of those three methods in Table 2. The radius coordinate denotes the rectilinearity of the P-wave. The red curve represents the normalized global probability distribution function by using the back-azimuths from the proposed method.
The azimuths of the microseismic events can be calculated by using the von Mises distribution functions based on the angles after receiver orientation and corresponding rectilinearities, as shown in Figure 10. We calculate the back-azimuths of all 521 events using the proposed method, and the results are shown in Figure 11A. We adopt a principle that the event is closer to the perforation to resolve the 180°ambiguity in the event back-azimuth. The variation of the event azimuth reflects the sequencing of hydraulic fracturing stages in the horizontal well, which is overall consistent with the azimuth trend of the ball-drop events. Figure 11B shows the distribution of the highest rectilinearity value of the events. The azimuth distribution of events from stages 3–7 (outlined by the blue box in Figure 11A) diverges, this may be due to the event data quality, the generation of the induced events around the former fracturing stages, or the extension of the fractures to larger distances. Microseismic events are located using the P- and S-wave arrival times and the velocity model between treatment and monitoring wells, and then the hypocentral parameters in the Cartesian coordinate system are calculated using the event back-azimuths. We employ the comparison of source locations by the conventional method and the proposed method to introduce the effect of the back-azimuth error, as shown in Figure 11C. In the conventional method, the perforation shot event is used to correct the receiver orientation, and the average of the P-wave polarization angle after receiver orientation is obtained as the event back-azimuth.
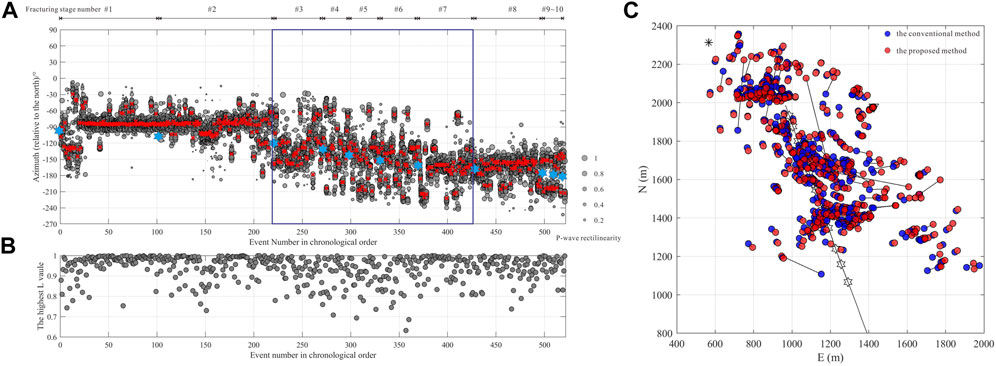
FIGURE 11. (A) Distributions of the 521 microseismic event back-azimuths. The gray dots represent the distribution of the potential back-azimuth angles after receiver orientation. The size of the dots reflects the P-wave rectilinearity. Red crosses represent the event back-azimuths calculated by the proposed method. The blue asterisks represent the ball-drop events. (B) Distributions of the P-wave rectilinearity average values of the 521 microseismic events. (C) Comparison of the source locations of the microseismic events by the conventional method and the proposed method.
We adopt a weighted standard deviation measurement of the azimuth results to illustrate the improvement of the proposed method for receiver orientation and event back-azimuth estimation. The weighted standard deviation is defined by
where M is the receiver number, and
We firstly discuss the improvement of the proposed method in receiver orientation. The orientation angles acquired by the three methods (listed in Table 2) are used to obtain the potential event back-azimuths on different receivers, and the final event azimuths are also determined using the probability density distribution. The weighted standard deviations are then computed using the final event azimuths, and the comparisons are displayed in Figure 12A. It reveals that the quality of active-source events effects the receiver orientation results, with high-quality active-source event producing more accurate results. Furthermore, even when employing high-quality active source events, receiver orientation may still have unexpected and non-negligible errors on individual receivers, as shown in Figure 12B. When the signal-to-noise ratio of active-source event is poor, the average azimuth deviation may approach 4.20°, therefore, this error should not be ignored. The weighted standard deviation distribution and the back-azimuth differences indicate that it can reduce the influence of a single active-source event in microseismic event back-azimuth estimation by using events with variable qualities.
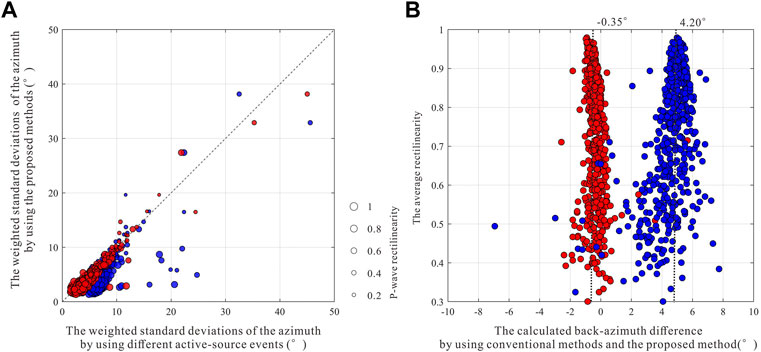
FIGURE 12. Comparisons of the azimuth results after receiver orientation using the conventional methods and the proposed method. (A) The weighted standard deviations. The size of the dots reflects the average value of P-wave rectilinearities in each microseismic event. (B) The back-azimuth difference. The red and blue circles represent receiver orientation angles calculated by the method 1 and 2 in Table 2, respectively.
We also illustrate the improvement of the proposed method in event back-azimuth estimation. We obtain the event back-azimuths using three strategies, including the average angle, the angle corresponding to the maximum rectilinearity, and the angle corresponding to the maximum value of the probability density in the proposed method. The weighted standard deviations are then computed correspondingly and compared in Figure 13A. The weighted standard deviation distribution indicates that it can reduce the influence of low-quality data in event back-azimuth estimation by integrating the angle information from multi-level receivers. By comparing the azimuth differences produced by the conventional method with the method presented in this study (as shown in Figure 13B), it is shown that using high signal-to-noise ratio recordings can increase back-azimuth accuracy.
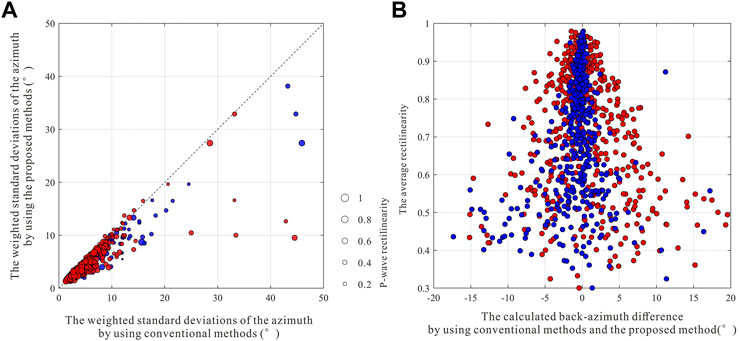
FIGURE 13. Comparisons of the azimuth results using the conventional methods and the proposed method. (A) The weighted standard deviations. The size of the dots reflects the average value of P-wave rectilinearities in each microseismic event. (B) The back-azimuth difference. The red and blue circles represent the results determined by the average angle and the angle corresponding to the maximum of P-wave rectilinearity, respectively.
Conclusion
In this study, we have developed a new probabilistic method for microseismic receiver orientation and event back-azimuth estimation. The von Mises distribution function, which serves as the probability density function in the new method, is constructed using the polarization angle and rectilinearity of the P-wave and applied in the estimation of the receiver orientation angles and event back-azimuths. The numerical examples have demonstrated that the proposed method has the advantage of minimizing the unintentional error in receiver orientation by employing high-quality events and increasing event back-azimuth accuracy by integrating the azimuths from multi-level receivers. We have also applied the proposed method to the field dataset. The results show that, compared with the conventional methods which generally utilize a single active-source event, our proposed method can increase the accuracy of the receiver orientation angles and microseismic event back-azimuths.
Data availability statement
The raw data supporting the conclusions of this article will be made available by the authors, without undue reservation.
Author contributions
ZY developed the method and wrote the original draft. YT revised the manuscript. All authors participated in designing this research work. All authors approved the final version of the manuscript.
Funding
This work is supported by the Key-Area Research and Development Program of Guangdong Province (Grant No. 2021B0101310002) and Science and Technology Program of Shenzhen Science and Technology Innovation Commission (Grant No. JSGG20201102160200001).
Acknowledgments
We would like to thank SINOPEC Geophysical Company, Shengli Branch for providing us the field data.
Conflict of interest
The authors declare that the research was conducted in the absence of any commercial or financial relationships that could be construed as a potential conflict of interest.
The handling editor LL declared a past co-authorship with the author YT.
Publisher’s note
All claims expressed in this article are solely those of the authors and do not necessarily represent those of their affiliated organizations, or those of the publisher, the editors and the reviewers. Any product that may be evaluated in this article, or claim that may be made by its manufacturer, is not guaranteed or endorsed by the publisher.
References
Akram, J. (2020). Understanding downhole microseismic data analysis. Berlin/Heidelberg, Germany: Springer International Publishing. doi:10.1007/978-3-030-34017-9
Atkinson, G. M., Eaton, D. W., and Igonin, N. (2020). Developments in understanding seismicity triggered by hydraulic fracturing. Nat. Rev. Earth Environ. Vol. 1, 264–277. doi:10.1038/s43017-020-0049-7
Chen, Y., Zhang, H., Miao, Y., Zhang, Y., and Liu, Q. (2017). Back azimuth constrained double-difference seismic location and tomography for downhole microseismic monitoring. Phys. Earth Planet. Inter. 264, 35–46. doi:10.1016/j.pepi.2016.10.003
Cipolla, C., Maxwell, S., Mack, M., and Downie, R. (2011). “A practical guide to interpreting microseismic measurements,” in North American Unconventional Gas Conference and Exhibition, The Woodlands, Texas, United States, June 2011 (OnePetro). doi:10.3997/2214-4609-pdb.285.spe144067
Drew, J., White, R., and Wolfe, J. (2008). “Microseismic event azimuth estimation: Establishing a relationship between hodogram linearity and uncertainty in event azimuth,” in SEG technical Program expanded abstracts 2008 (Society of Exploration Geophysicists), 1446–1450. doi:10.1190/1.3059186
Drew, J., Primiero, P., Brook, K., Raymer, D., Probert, T., Kim, A., et al. (2012). “Microseismic monitoring field test using surface, shallow grid, and downhole arrays,” in SEG technical Program expanded abstracts 2012 (Society of Exploration Geophysicists), 1–5. doi:10.1190/segam2012-0910.1
Eisner, L., Fischer, T., and Rutledge, J. T. (2009). Determination of S-wave slowness from a linear array of borehole receivers. Geophys. J. Int. 176 (1), 31–39. doi:10.1111/j.1365-246X.2008.03939.x
Ensing, J. X., and van Wijk, K. (2019). Estimating the orientation of borehole seismometers from ambient seismic noise. Bull. Seismol. Soc. Am. 109 (1), 424–432. doi:10.1785/0120180118
Flinn, E. A. (1965). Signal analysis using rectilinearity and direction of particle motion. Proceed, IEEE 53 (12), 1874–1876. doi:10.1109/PROC.1965.4462
Grechka, V. I., and Heigl, W. M. (2017). Microseismic monitoring. Tulsa, OK: Society of Exploration Geophysicists, 471. doi:10.1190/1.9781560803485
Grigoli, F., Cesca, S., Dahm, T., and Krieger, L. (2012). A complex linear least-squares method to derive relative and absolute orientations of seismic sensors. Geophys. J. Int. 188, 1243–1254. doi:10.1111/j.1365-246X.2011.05316.x
Huo, Y., Zhang, W., Zhang, J., and Yang, H. (2021). Using microseismic events to improve the accuracy of sensor orientation for downhole microseismic monitoring. Geophys. Prospect. 69 (6), 1167–1180. doi:10.1111/1365-2478.13099
Lagos, S., and Velis, D. (2019). A simple energy-based strategy for sensor orientation in borehole microseismic monitoring. J. Geophys. Eng. 16 (1), 85–91. doi:10.1093/jge/gxy007
Lark, R. M., Clifford, D., and Waters, C. N. (2014). Modelling complex geological circular data with the projected normal distribution and mixtures of von Mises distributions. Solid Earth. 5 (2), 631–639. doi:10.5194/se-5-631-2014
Leng, J., Yu, Z., Mao, Z., and He, C. (2022). Optimization and quality assessment of arrival time picking for downhole microseismic events. Sensors (Basel). 22 (11), 4065. doi:10.3390/s22114065
Li, L., Tan, J., Wood, D. A., Zhao, Z., Becker, D., Lyu, Q., et al. (2019). A review of the current status of induced seismicity monitoring for hydraulic fracturing in unconventional tight oil and gas reservoirs. Fuel 242, 195–210. doi:10.1016/j.fuel.2019.01.026
Mardia, K. V., and Jupp, P. E. (2000). Directional statistics. New York: Wiley. doi:10.1002/9780470316979
Maxwell, S. C., Rutledge, J., Jones, R., and Fehler, M. (2010). Petroleum reservoir characterization using downhole microseismic monitoring. Geophysics 75 (5), 75A129–75A137. doi:10.1190/1.3477966
Maxwell, S. C., Raymer, D., Williams, M., and Primiero, P. (2012). Tracking microseismic signals from the reservoir to surface. Lead. Edge 31 (11), 1300–1308. doi:10.1190/tle31111300.1
Maxwell, S. (2014). Microseismic imaging of hydraulic fracturing: Improved engineering of unconventional shale reservoirs. Tulsa, OK, United States: Society of Exploration Geophysicists. doi:10.1190/1.9781560803164
Menanno, G., Vesnaver, A., and Jervis, M. (2013). Borehole receiver orientation using a 3D velocity model. Geophys. Prospect. 61, 215–230. doi:10.1111/j.1365-2478.2012.01106.x
Meng, X., Chen, H., Niu, F., Tang, Y., Yin, C., and Wu, F. (2018). Microseismic monitoring of stimulating shale gas reservoir in SW China: 1. An improved matching and locating technique for downhole monitoring. J. Geophys. Res. Solid Earth 123 (2), 1643–1658. doi:10.1002/2017JB014488
Nakamura, Y., Donoho, P. L., Roper, P. H., and McPherson, P. M. (1987). Large-offset seismic surveying using ocean-bottom seismographs and air guns: Instrumentation and field technique. Geophysics 52 (12), 1601–1611. doi:10.1190/1.1442277
Niu, F., and Li, J. (2011). Component azimuths of the CEArray stations estimated from P-wave particle motion. Earthq. Sci. 24, 3–13. doi:10.1007/s11589-011-0764-8
Ojo, A. O., Zhao, L., and Wang, X. (2019). Estimations of sensor misorientation for broadband seismic stations in and around africa. Seismol. Res. Lett. 90 (6), 2188–2204. doi:10.1785/0220190103
Schultz, R., Skoumal, R. J., Brudzinski, M. R., Eaton, D., Baptie, B., and Ellsworth, W. (2020). Hydraulic fracturing-induced seismicity. Rev. Geophys. 58 (3), e2019RG000695. doi:10.1029/2019RG000695
Son, Y. O., Seo, M. S., and Kim, Y. (2022). Measurement of seismometer misorientation based on P-wave polarization: Application to permanent seismic network in South Korea. Geosci. J. 26 (2), 235–247. doi:10.1007/s12303-021-0031-5
Takagi, R., Uchida, N., Nakayama, T., Azuma, R., Ishigami, A., Okada, T., et al. (2019). Estimation of the orientations of the S-net cabled ocean-bottom sensors. Seismol. Res. Lett. 90 (6), 2175–2187. doi:10.1785/0220190093
Tan, Y., and He, C. (2016). Improved methods for detection and arrival picking of microseismic events with low signal-to-noise ratios. Geophysics 81 (2), KS93–KS111. doi:10.1190/geo2015-0213.1
Tan, Y., He, C., and Mao, Z. (2018). Microseismic velocity model inversion and source location: The use of neighborhood algorithm and master station method. Geophysics 83 (4), KS49–KS63. doi:10.1190/geo2017-0308.1
Wang, X., Chen, Q. F., Li, J., and Wei, S. (2016). Seismic sensor misorientation measurement using P-wave particle motion: An application to the NECsaids array. Seismol. Res. Lett. 87 (4), 901–911. doi:10.1785/0220160005
Xu, H., Luo, Y., Tang, C. C., Zhao, K., Xie, J., and Yang, X. (2018). Systemic comparison of seismometer horizontal orientations based on teleseismic earthquakes and ambient-noise data. Bull. Seismol. Soc. Am. 108 (6), 3576–3589. doi:10.1785/0120180087
Yang, Y., Qi, Q., Zhou, H., and Wang, Z. (2022). A novel method for determining geophone orientations from zero-offset VSP data constrained by scalar field. Front. Earth Sci. 10, 848954. doi:10.3389/feart.2022.848954
Yuan, D., and Li, A. (2017). Determination of microseismic event azimuth from S-wave splitting analysis. J. Appl. Geophys. 137, 145–153. doi:10.1016/j.jappgeo.2016.12.008
Zeng, X., and McMechan, G. A. (2006). Two methods for determining geophone orientations from VSP data. Geophysics 71 (4), V87–V97. doi:10.1190/1.2208935
Zha, Y., Webb, S. C., and Menke, W. (2013). Determining the orientations of ocean bottom seismometers using ambient noise correlation. Geophys. Res. Lett. 40 (14), 3585–3590. doi:10.1002/grl.50698
Keywords: downhole microseismic monitoring, receiver orientation, event back-azimuth estimation, probability distribution, polarization analysis
Citation: Yu Z, Huang D, Tan Y and He C (2023) Receiver orientation and event back-azimuth estimation for downhole microseismic monitoring using a probabilistic method based on P-wave polarization. Front. Earth Sci. 10:1027216. doi: 10.3389/feart.2022.1027216
Received: 24 August 2022; Accepted: 15 September 2022;
Published: 05 January 2023.
Edited by:
Lei Li, Central South University, ChinaReviewed by:
Hongliang Zhang, China National Offshore Oil Corporation, ChinaXiao Tian, East China University of Technology, China
Xiong Zhang, East China University of Technology, China
Copyright © 2023 Yu, Huang, Tan and He. This is an open-access article distributed under the terms of the Creative Commons Attribution License (CC BY). The use, distribution or reproduction in other forums is permitted, provided the original author(s) and the copyright owner(s) are credited and that the original publication in this journal is cited, in accordance with accepted academic practice. No use, distribution or reproduction is permitted which does not comply with these terms.
*Correspondence: Yuyang Tan, dGFueXV5YW5nQG91Yy5lZHUuY24=
 Zhichao Yu
 Dian Huang1
 Yuyang Tan