 Renzhi Li
 He Qing Huang
 Zhonggen Wang1,2*
- 1National Institute of Natural Hazards, Ministry of Emergency Management of the People’s Republic of China, Beijing, China
- 2Key Laboratory of Compound and Chained Natural Hazards Dynamics, Ministry of Emergency Management of China, Beijing, China
- 3Institute of Geographic Sciences and Natural Resources Research, Chinese Academy of Sciences, Beijing, China
- 4University of Chinese Academy of Sciences, Beijing, China
The impacts of climate and human activities exerted on streamflow over the recent decades in the Lancang-Mekong River Basin (LMRB) have been examined in separate forms and this study performed an integrated quantitative evaluation. Using the meteorological and hydrological data measured in LMRB during 1961–2015, we analyzed the varying trend and abrupt change characteristics of streamflow along the river course, and constructed a SWAT hydrological model to quantitatively evaluate the contributions of climate and human activities by taking into account their spatial heterogeneity. At the yearly timescale, the results show that for significant complex changes in streamflow along the Lancang-Mekong River, the ratios of the contributions of the impacts of human activity (
1 Introduction
Over the last several decades, streamflow regimes have experienced significant alterations around the world (Zhao et al., 2015). Due to the combined impacts of climate and human activities on streamflow process in large river basins, streamflow regime shifts often in complex cascading forms (Best 2019; Hughes et al., 2013). Understanding physical mechanisms by which the two drivers of changes take effect and their relative contributions on streamflow regime shift have been a hot topic for research for bolstering the management of river basin systems (Hu et al., 2021; Ali et al., 2022).
Changes in climate and land use types have long been regarded as the major factors influencing the water resources in the Lancang-Mekong River Basin (LMRB) (e.g., Wang et al., 2017). The increasing human activity stress in LMRB has caused streamflow discharge to increase from a pristine level to a much higher one by the early 2010s then to decline following a decrease in the human activity stress (Song et al., 2020). To quantitatively assess the impacts of climatic variation and human activities on streamflow in the LMRB, numerous methods such as empirical statistical analysis, multi-parameter vulnerability assessment, and hydrological modeling have been employed (Wu et al., 2016; Wang et al., 2019). Li et al. (2020) used the Mann-Kendall test and double cumulative curve method to determine the varying trend in the annual streamflow of the Mun River into the Mekong River from 1980 to 2018. Their results showed that the significant reduction in forest area and slight reductions in evaporation and farmland area since 1999 helped increase the streamflow of the Mun River. Gui et al. (2021) used the multi-parameter vulnerability assessment method to quantitatively assess the impacts of natural and anthropogenic interferences on water resources in the Lancang River Basin (LRB) from 1998 to 2014 and identified that the southeast region of LRB especially Dali area was mainly influenced by human activities. Although the method used by Gui et al. (2021) is able to directly quantify the contributions of climatic and human activities factors, the spatial differences of these factors in the very large LMRB may lead to inaccurate results. The hydrological simulation methods, typically the Soil & Water Assessment Tool (SWAT), Variable Infiltration Capacity (VIC), Simple Hydrological Model (SIMHYD), and Geomorphology-Based Hydrological Modelling (GBHM), all provide a more detailed illustration of hydrological cycle for river basins with diverse spatial patterns (Wang et al., 2017; Yun et al., 2020). Using a SWAT model, Li et al. (2021) quantitatively assessed the effects of climate change on streamflow in the Mun River under the RCP 2.6, 4.5, and 8.5 scenarios. Tatsumi et al. (2015) adopted VIC model to study the influence of agricultural irrigation water use on streamflow of the Mekong River. Wang et al. (2017) combined the large scale distributed hydrological GBHM with a simple reservoir regulation model to study the influence of dam construction and climate change on floods in the LMRB. While those modelling studies greatly facilitated quantitative evaluation of the factors affecting streamflow variation in LMRB, the Lancang and Mekong River Basins have not been treated as an integrated one large basin, and the temporal and spatial connections between the parts and the whole LMRB have been ignored in most cases. Furthermore, previous studies mainly focused on a certain aspect of the impact of human activities, such as reservoirs and irrigation, generally covered relatively short periods of variation and used insufficient model calibration data.
Aiming at quantitatively evaluating the impact of climate change and human activities on streamflow over a much long period and in a form well integrating the different parts of the entire LMRB, this study fused multi-source data, including long series of meteorological site and grid, land use types, and soil data and more, and then built a meteorological-soil-hydrological database. Importantly, a SWAT hydrological model was constructed by taking into account of the spatial heterogeneity in climatic and human activities factors across the entire LMRB and consequently the contributions of climatic and human activities factors in the streamflow changes over different parts of LMRB were quantified.
2 Research area and methods
2.1 Research area
As the seventh largest river in the world, the Lancang-Mekong River (LMR) is shared by six nations in Southeast Asia (Figure 1, Liu et al., 2021). It originates from the Tibetan Plateau in China, flows through Myanmar, Lao People’s Democratic Republic, Thailand, and Cambodia, and draining into the South China Sea from the Mekong Delta in Vietnam (Gupta, 2022). The LMRB is generally divided into the upper (Lancang River Basin in China, LRB) and lower parts (Mekong River Basin, MRB). The entire length of the LMR is 4,880 km with a total area of 795,000 km2 (Dong et al., 2022). The main stream of the Lancang River is 2,161 km long and covers a drainage area of 165,000 km2, accounting for 20.7% of the total area of the LMRB. The main stream of the Mekong River is 2,668 km long and covers a drainage area of approximately 630,000 km2, accounting for 79.3% of the whole LMRB.
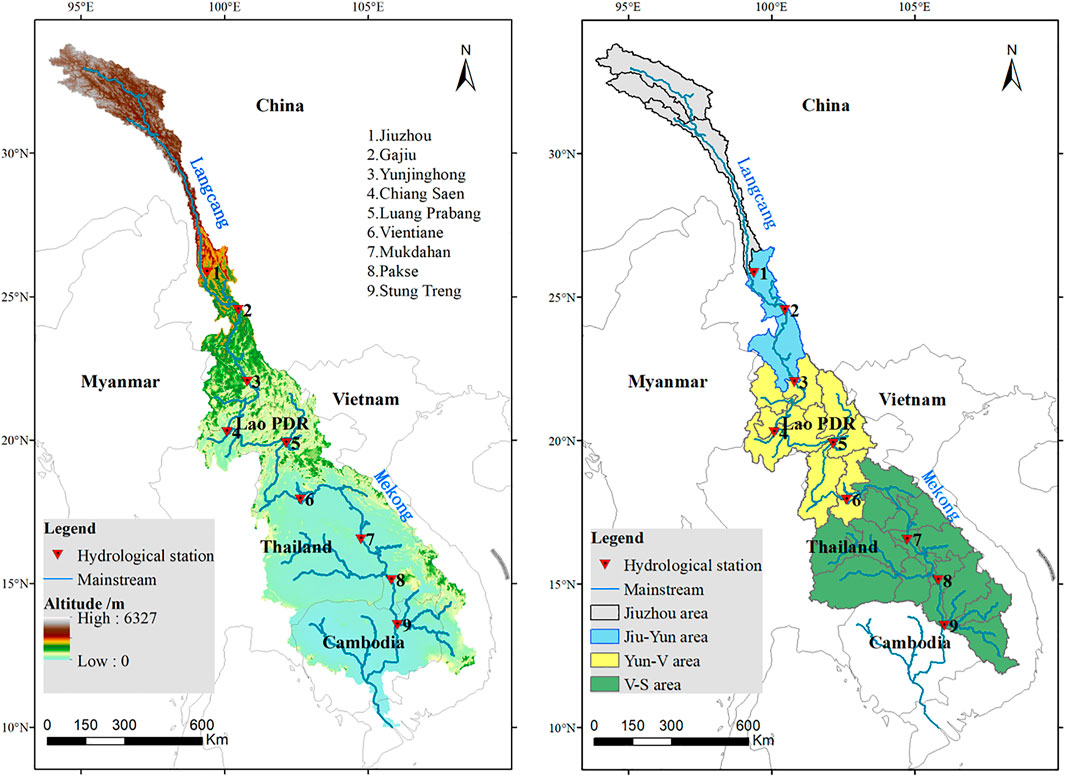
FIGURE 1. The Lancang-Mekong River Basin and the distribution of hydrological stations.
The LMRB comprises high mountains (4,500 m elevation) and deep gullies in the upstream area, relatively flat terrain with medium-sized mountains in the midstream, and wide valleys and large tributary river systems in the downstream area, and is characterized by unique and complex hydrologic, climatic, and physiographic features (Fan and Luo, 2019). The distribution of mean annual precipitation over the whole basin follows a distinct north-to-south and west-to-east gradient. Annual precipitation can be as little as 600 mm in the north of the Jiuzhou area in the Tibetan Plateau, and as much as 1,700 mm in the southern mountains of the Jiu-Yun area. Regulated by the global monsoon system, the rain-soaked uplands in the V-S area receive the most precipitation (3,000 mm) and the semi-arid Khorat Plateau in the west receives the least (1,000 to 1,600 mm). The LMRB has two distinct seasons: a wet (May–October) and a dry season (November–April). Although interannual variation of monsoon precipitation is high, the wet season can contribute more than 80% of the annual regional precipitation. During the dry season, the basin is influenced mostly by dry air from the northeastern land (Räsänen and Kummu, 2013). The annual temperature in the LMRB is mainly influenced by latitude. The average temperatures in Jiuzhou, Jiu-Yun, Yun-V, and V-S are 2.5°C, 15.5°C, 26°C, and 30°C, respectively. Population density also increases with latitude from north to south.
In this study, the Mekong Estuary Delta region was not given a detailed investigation due to the lack of detailed hydrological data. According to the locations of Jiuzhou, Yunjinghong, Vientiane and Stung Treng hydrological stations (Figure 1), four parts of areas were zoned as Jiuzhou and above (Jiuzhou) area, Jiuzhou-Yunjinghong (Jiu-Yun) area, Yunjinghong-Vientiane (Yun-V) area and Vientiane-Stung Treng (V-S) area.
2.2 Data collection
The number of observation stations and data series in the LMRB, especially in the MRB, are insufficient, and the data sources and scales are inconsistent, which causes great difficulties for systematic and subsequent modeling analyses. To solve this problem, this study adopted the data input format as site in LRB + grid in MRB, with each observation and grid station containing one group of data, including precipitation, temperature, evapotranspiration, DEM, soil and land cover data. Specific data sources are as follows:
1) Meteorological data
Daily observed meteorological data such as precipitation, temperature, wind and solar radiation data of the LRB (Figure 2) were collected from the Chinese meteorological data sharing service system (http://data.cma.cn/). Daily grid meteorological data of the MRB were collected from Mekong River Commission (MRC, https://www.mrcmekong.org/) and the Asian Precipitation-Highly-Resolved Observational Data Integration Towards Evaluation (APHRODITE, 0.25° ⅹ 0.25°, http://aphrodite.st.hirosaki-u.ac.jp/download/), respectively. To compensate for the lack of APHRODITE data at the maximum and minimum temperature, this study used the Global Surface Summary of the Day (GSOD, https://data.noaa.gov/dataset/dataset/global-surface-summary-of-the-day-gsod) data and Global Historical Climatology Network data (GHCND, https://www.ncei.noaa.gov/products/land-based-station/global-historical-climatology-network-daily) from NOAA (National Oceanic Atmospheric Adminstration). Evapotranspiration was calculated using the Penman-Monteith equation based on weather generator in SWAT model with default parameters setting.
2) Hydrological and topographic data
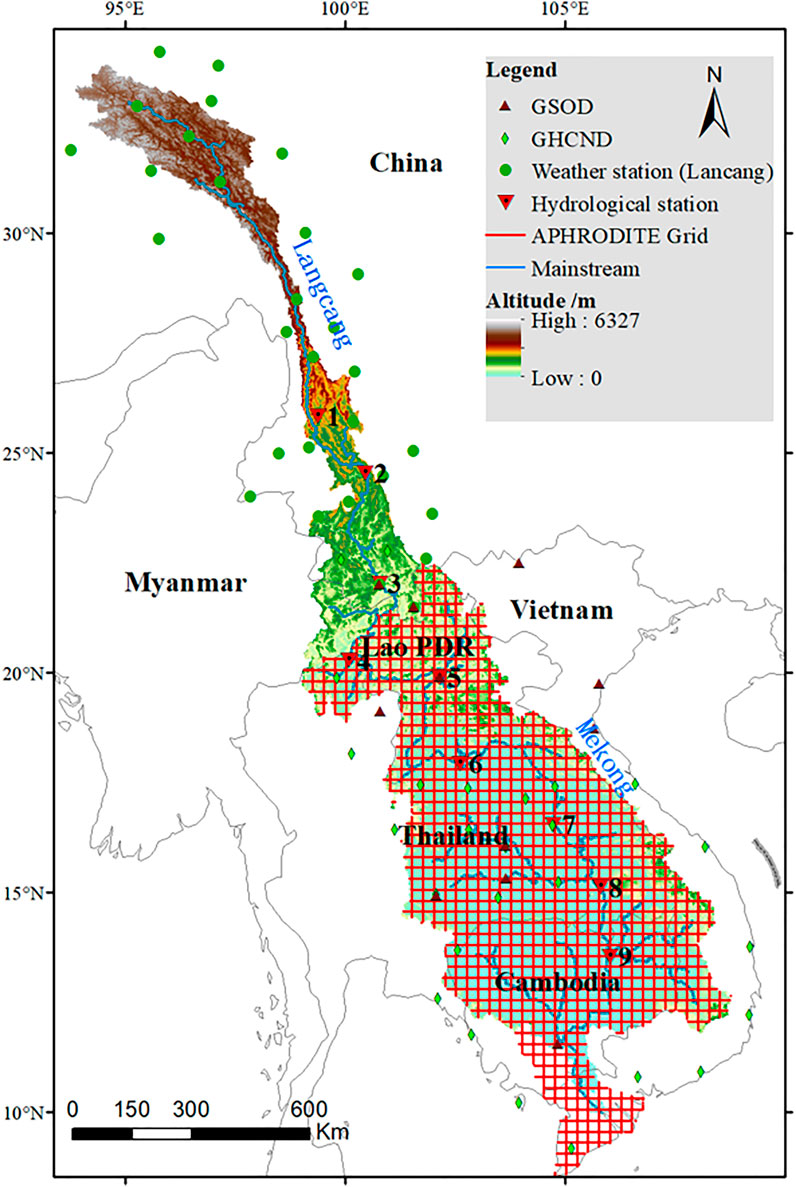
FIGURE 2. Distribution of meteorological stations in the Lancang-Mekong River Basin.
The streamflow data were provided by Yunnan University and the Mekong River Commission (MRC). The data series duration of Jiuzhou, Yunjinghong, Vientiane and Stung Treng station are 1961–2010, 1961–2014, 1961–2006 and 1961–2015, respectively. The geographical data, such as the 1 km × 1 km raster data, was extracted and resampled from 90 m resolution digital elevation model (DEM) data provided by the USGS (available from http://www.usgs.gov).
3) Land cover and soil data
The land use and land cover data of the LRB (1980–2015, per 5 years) were produced by the Institute of Geographical Sciences and Resources, Chinese Academy of Sciences, and the similar data of the MRB were downloaded and resampled from the Servir-Mekong dataset from 1987 to 2015 (available from https://servir.adpc.net). Soil data in LMRB was obtained from the Harmonized World Soil Database (HWSD).
2.3 Materials and methods
2.3.1 Construction of SWAT model in the study area
SWAT (Soil and Water Assessment Tool) model is a semi-distributed watershed hydrological model developed by Blackland Research and Extension Center of USDA in the early 1990s, which is mainly used to simulate the process of land and water surface cycle (Gassman et al., 2007). The land surface part can be divided into the process of streamflow generation and slope confluence, while the water surface part is the river network confluence (Paiva et al., 2011; Tan et al., 2022.).
Database including the spatial and attribute data is necessary to be bulit first. Spatial data such as DEM, the location of meteorological stations, land cover types, and soil distribution map, and attribute data such as meteorological data series and soil attribute data were edited and input into the SWAT model, respectively. Based on the established LMRB database, the LMRB system network was generated by extracting DEM data from the database. Combined with soil, land cover types, and slope values, the LMRB was divided into 35 sub-basins. Considering the calculation accuracy and processing speed, 35 sub-basins are further divided into 311 HRUs (hydrological response units) with an average area of 2,000 km2, as shown in Figure 3.
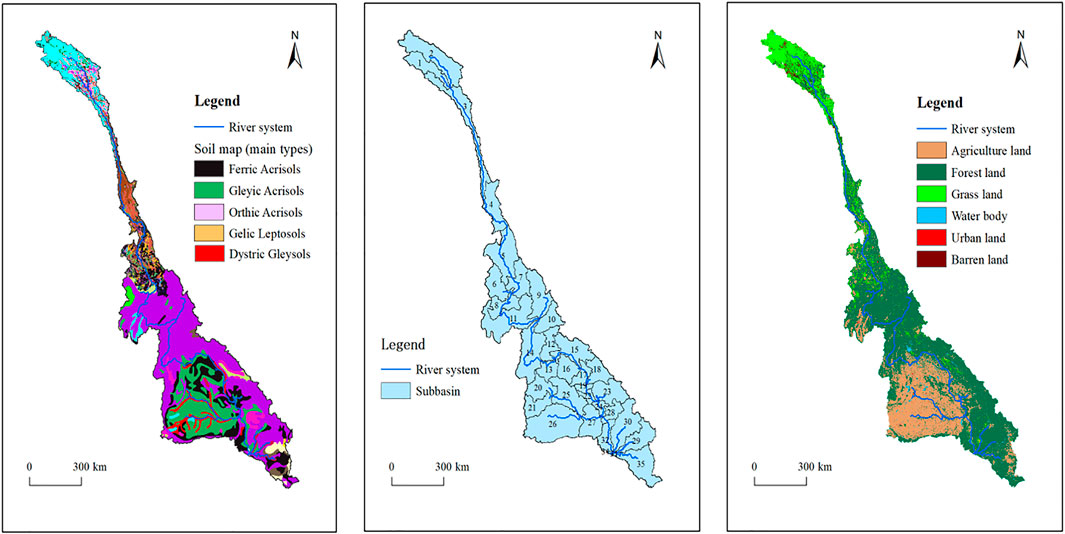
FIGURE 3. Sub-basin division by SWAT hydrological model in Lancang-Mekong River Basin (A) Watershed soil types map. (B) HRUs division map of sub-basins. (C) Watershed land use types map.
2.3.2 Calibration and validation of SWAT model
The calibration and validation periods of the SWAT model were from 1961 (3 years warm-up period) to 1980, and 1981 to 2015, respectively. For validation, 35 years of data was considered sufficiently long (Liu et al., 2010; Zhang et al., 2012), when compared with other studies that used 2–3 years of data. The land cover data of 1990, which was less affected by human activities, was input to the model as the underlying surface data for the restoration of natural streamflow. This study adopted the step-by-step calibration principle to validate the streamflow data from upstream to downstream and LH-OAT (Latin-Hypercube & One Factor-At-a-Time) method to analyze the sensitivity of the main parameters. Method LH-OAT assumes that there are p parameters to be analyzed in the model, which are divided into N layers in space according to the LH (Latin-Hypercube) sampling idea, and then taking a sampling in each layer. After that, parameters of each LH sampling parameter group are changed according to the OAT (one Factor-at-a-time) method, and each small change is recorded as GSi (global sensitivity). The sensitivity classification and the the detailed calibration process of the GSi are given in Table 1 and Formula 1, respectively.
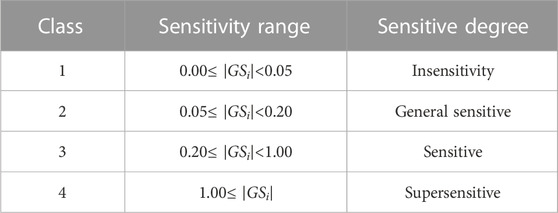
TABLE 1. Sensitivity classification.
M(*) is the indicator function of the kth LH sampling set; ei,k is the value of the ith parameter in the kth LH sampling layer; and Δei,k is some disturbance of parameter ei,k.
Before applying the SWAT model to reconstruct natural streamflow in the LMR, the simulation capability of the model needs to be evaluated in the study area. The coefficient of determination (R2) and the Nash–Sutcliffe efficiency (NSE) were used to evaluate the merits of the SWAT model. R2 calculates the linear correlations between observed and modelled data from SWAT. NSE evaluates the SWAT model’s goodness of fit. R2 and NSE are defined as follows:
Where
Figure 4 shows the observed and simulated monthly streamflow of Jiuzhou, Yunjinghong, Vientiane, and Stung Treng stations during the calibration and validation periods. The NSE values of the calibration period of the four stations were 0.75, 0.80, 0.88, and 0.75, respectively. During the validation period, the NSE values were 0.71,0.75, 0.82, and 0.72, respectively. The R2 values were all >0.84. Based on the recommendations of previous research, a hydrological simulation is satisfactory when NSE>0.50 and R2 >0.6.
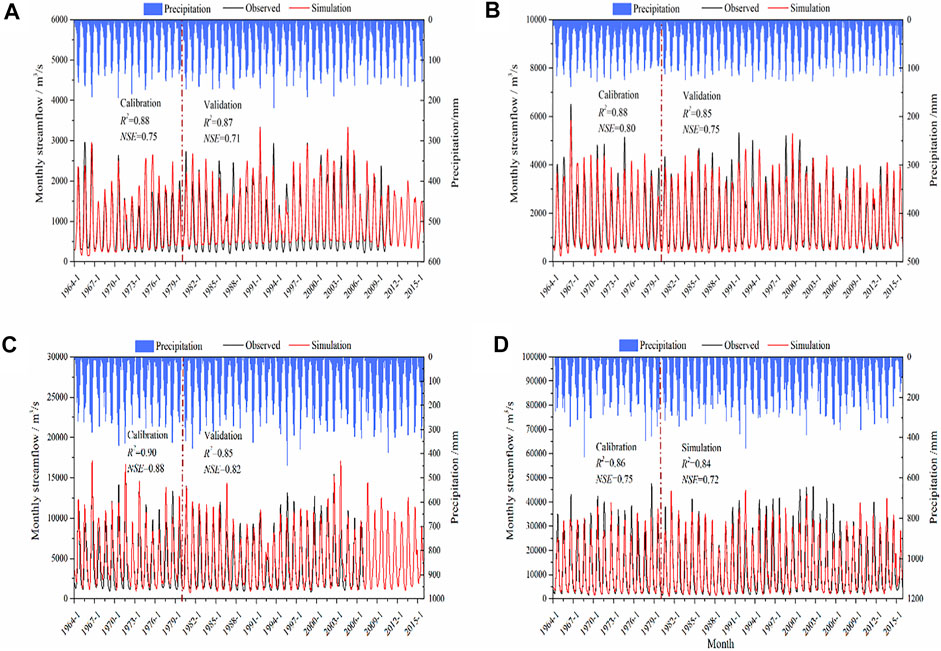
FIGURE 4. Calibration and validation results of the SWAT model for the monthly average streamflow at Jiuzhou (A), Yunjinghong (B), Vientiane (C), and Stung Treng (D) stations based on the flow data measured during 1961–2015 in line with the monthly average precipitation (the blue column with the right vertical axis).
2.3.3 Assessment of the contributions of climatic variations and human activities to streamflow changes
According to the calculation principle of the hydrological model, the difference in observed streamflow between the reference and change period is
where
3 Results and discussion
3.1 Reference and change periods judgement
The cumulative anomalies of streamflow series at Jiuzhou, Yunjinghong, Vientiane, and Stung Treng hydrological stations are shown in Figure 5, and an obvious decrease in the annual streamflow can be noticed from 1966 to 1980 at Jiuzhou (Figure 5A), from 1986 to 2000 at Yunjinghong (Figure 5B), and from 1986 to 1999 at Vientiane and Stung Treng stations (Figures 5C,D). Hence, the impact of human activities on streamflow from 1961 to 1980 can be regarded as at a low level and so the period is taken as the reference period in this study, while 1986 can be regarded as the sudden changing year in the annual streamflow series at these four stations. This division is consistent with the findings of other studies (e.g., Tang et al., 2014; Wang et al., 2017). Therefore, we divided the change periods of annual streamflow at four stations into two periods: at Jiuzhou, periods A1 (1986–1997) and B1 (1998–2010); at Yunjinghong, periods A2 (1986–2000) and B2 (2001–2014); at Vientiane, periods A3 (1986–1999) and B3 (2000–2006); and at Stung Treng, periods A4 (1986–1999) and B4 (2000–2015). Correspondingly, the reference periods were named Base1, Base2, Base3, and Base4, respectively.
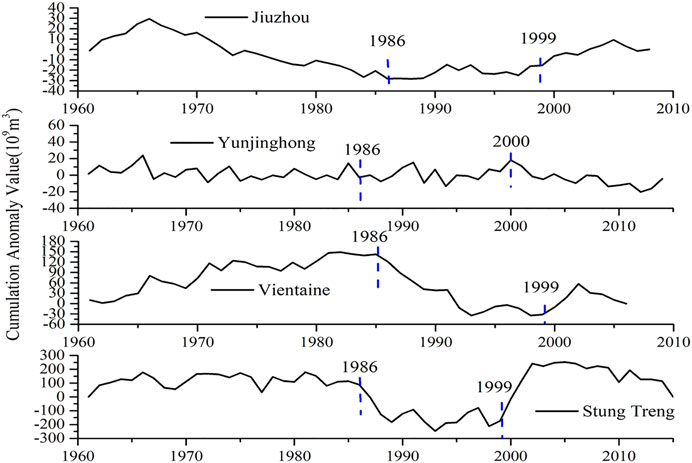
FIGURE 5. The cumulative anomaly variation of annual streamflow at Jiuzhou (A), Yunjinghong (B), Vientiane (C), and Stung Treng (D) station.
3.2 Trends of hydro-climatic factors during 1961–2015
The yearly and seasonal average streamflow at Jiuzhou, Yunjinghong, Vientiane, and Stung Treng stations in different periods are listed in Table 2. At the annual timescale, the streamflow volume at the four stations showed an obvious increase from upstream to downstream. By comparison with the volume of the streamflow in base periods, the volume of the streamflow increased in the changing period B1 at Jiuzhou station, B3 at Vientiane station, and B4 at Stung Treng station, and yet an obvious decrease in the changing period B2 at Yunjinghong station, A3 at Vientiane station, and A4 at Stung Treng station. At the seasonal timescale, the streamflow volume at the four stations showed little change in the dry season, but a much more dramatic change in the wet season.
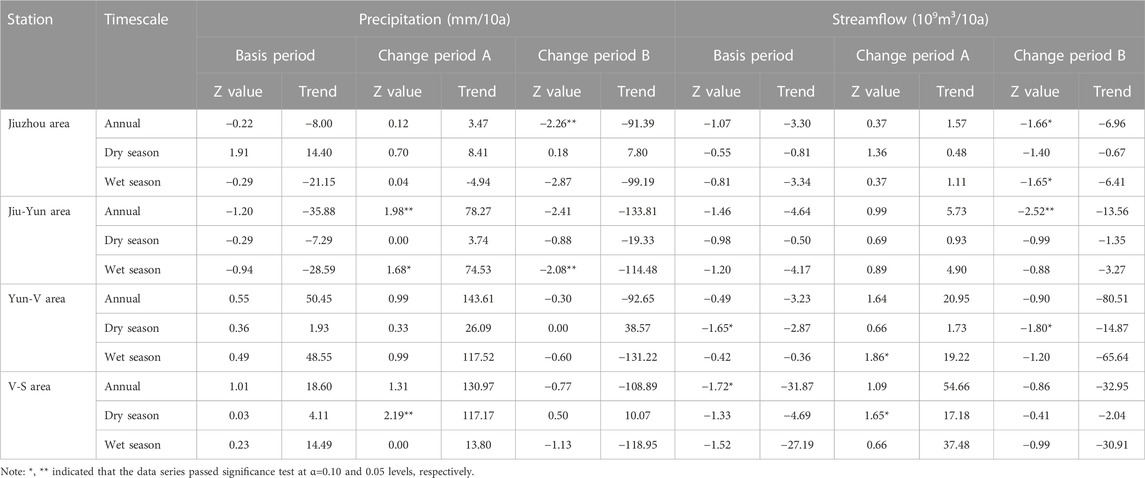
TABLE 2. The results of Mann-Kendall trend tests for the hydro-climatic data in Lancang-Mekong River.
The Mann-Kendall (M-K) non-parametric trend test method was used to conduct trend detection of streamflow at these four stations and precipitation in Jiuzhou, Jiu-Yun, Yun-V, and V-S areas on yearly and seasonal time scales from 1961 to 2015 (Kendall, 1975; Yanming et al., 2012; Noszczyk et al., 2017; Ning et al., 2021). The Z value, which is the result of M-K test, obeyed the standard normal distribution. A positive Z value indicates an increasing trend, while a negative Z value indicates a decreasing trend. The bilateral significance level test was used to test the monotonic trend of increase or decrease. If |Z| > 1.645, 1.96, and 2.576, it shows that the time series have passed the confidence test of α=0.01, 0.05, and 0.1 respectively. At the yearly time scale, the streamflow at Jiuzhou station and that in the basis period and A2 of Yunjinghong station did not show any obvious trends. However, the streamflow in change period B2 showed a significant decreasing trend (0.05 significance level). The total streamflow at Vientiane and Stung Treng stations showed decreasing and increasing trends, respectively. However, both showed an increasing trend first and then decreased in the changing periods. At the seasonal time scale, the variation trends of streamflow in the dry and wet seasons were basically consistent with that at the yearly time scale in each area. However, the streamflow had a significant downward trend at Vientiane station and a significant upward trend at Stung Treng station in the dry season, and a significant downward trend at Jiuzhou station and a significant upward trend at Vientiane station in the wet season, while other stations had little change.
According to the correlation calculation results, the correlated degree of annual average precipitation and streamflow reached 0.91 in Jiuzhou, 0.74 in Jiu-Yun, 0.65 in Yun-V, but only 0.17 in V-S. The streamflow trends were consistent with precipitation in the dry season (Nov-next Apr) throughout the four areas with more than 0.5 correlation values and less precipitation and streamflow variation than in the wet season. The streamflow trends were consistent with the annual precipitation variation in the wet season of the four areas and the correlation degree between regional average precipitation and streamflow gradually weakened from upstream to downstream.
3.3 Contributions of climate and human activities to streamflow changes
In terms of Formulas (4–9) and the different scenarios setting for quantitative contribution analysis of the human activities and climate change in LMRB (Table 3), the contributions of climate change and human activities to streamflow change were quantified by comparing the observed and simulated streamflow during basic and change periods. The contributions of the two factors were analyzed at the yearly and seasonal time scales, respectively. The results are illustrated in Figure 6.
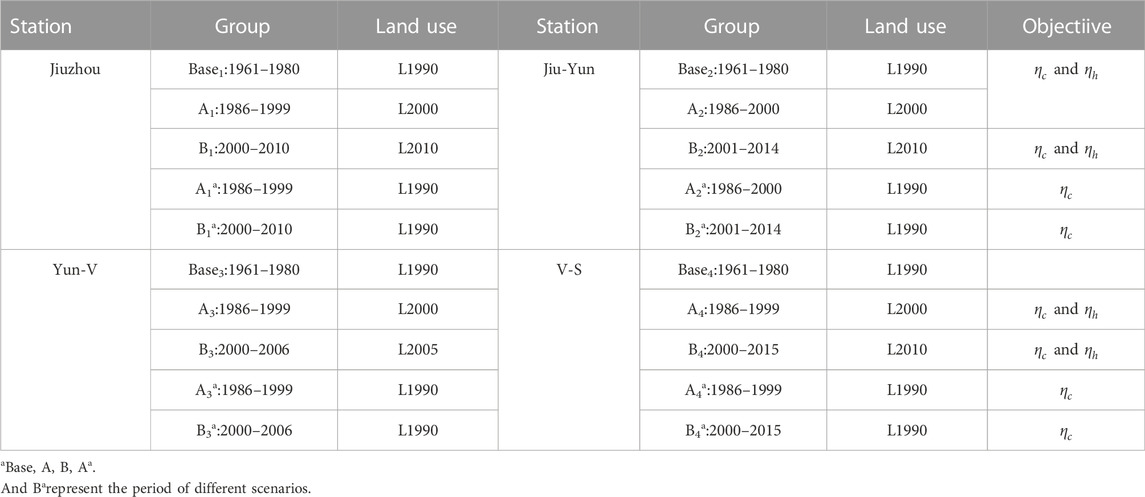
TABLE 3. Scenarios for quantitative analysis the contributions of human activities and climate change in Lancang-Mekong River Basin.
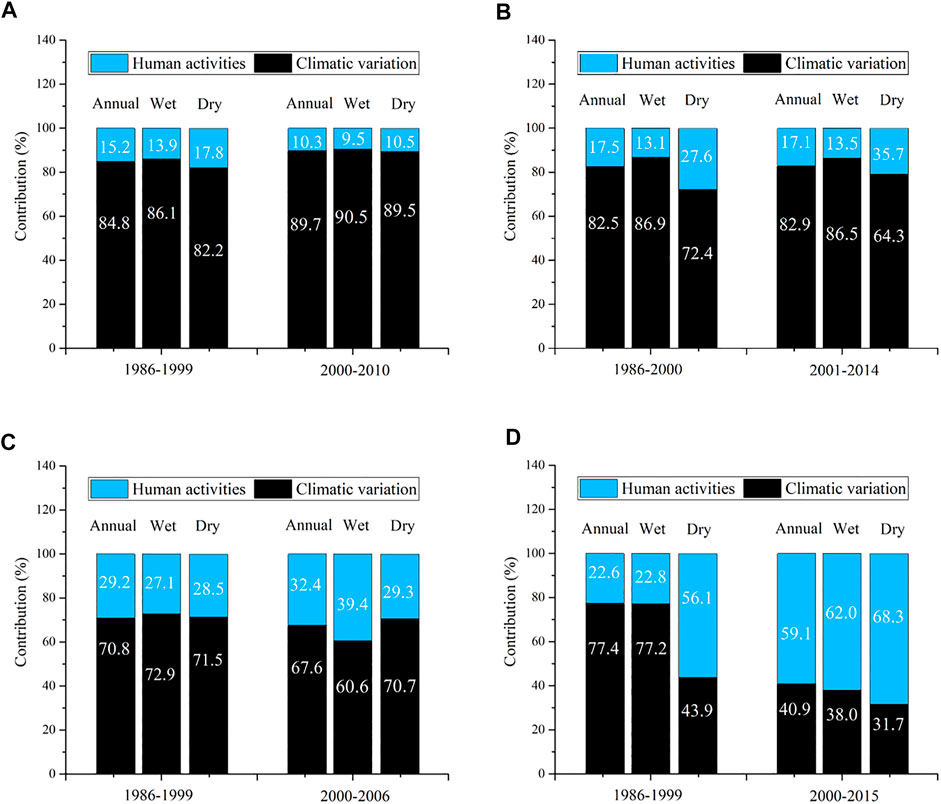
FIGURE 6. Contributions of climatic variations and human activities to annual and seasonal streamflow changes in Jiuzhou (A), Jiu-Yun (B), Yun-V (C), and V-S (D) area.
At the yearly time scale, the contributions of human activities (
At the seasonal time scale, human activities had a relatively larger contribution to streamflow changes during dry seasons than in wet seasons, such as the value of Jiu-Yun area between 1986 and 2000, where the
3.4 Impact of land use type change on streamflow in different areas
In terms of Formulas (10) and 11and the control scenarios in Table 3, further quantitative assessment of the impact from land use type changes (
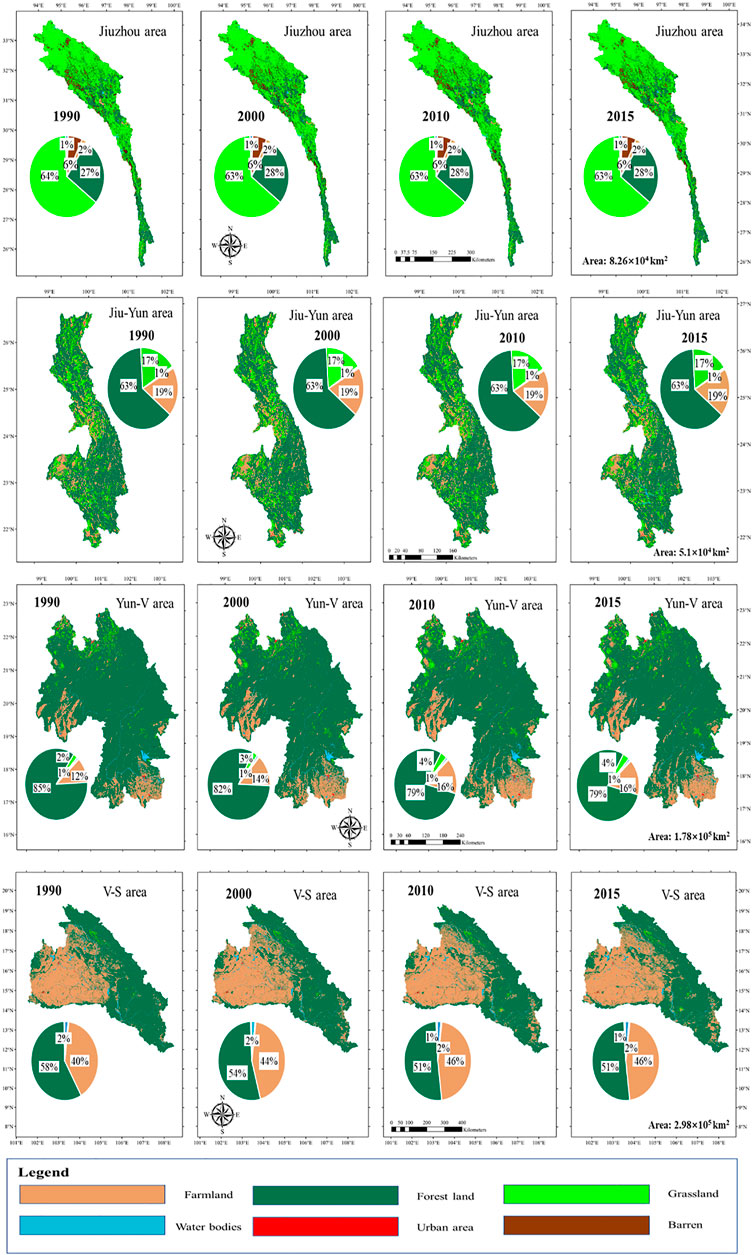
FIGURE 7. The situation of Land use types change in Lancang-Mekong River Basin.
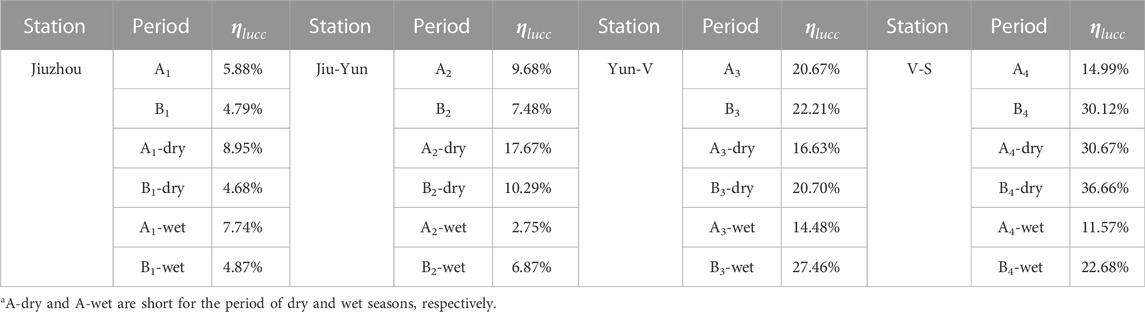
TABLE 4. The contributions of land use types change to annual and seasonal streamflow changes in Lancang-Mekong River Basin.
In Jiuzhou, each area of land use types remained stable except from a small proportion reduce of the grassland from 1990 to 2000, so the
3.5 Discussion
3.5.1 Uncertainties in the simulation
Although this study provides a quantitative evaluation of the impacts of climatic variation and human activities on streamflow changes in the integrated form in LMRB and the SWAT model could well simulate the natural streamflow, there are still some uncertainties in the model simulations (Sangam et al., 2022). The uncertainty mainly comes from the reference and change periods judgement, the model structure setting, input data and parameter calibration (Han and Zheng, 2016; Chen et al., 2022). First, this study judged the mutation year by cumulative anomalies of streamflow series, but different assumptions and methods may lead to different changing points, further affecting the follow-up analysis. Second, SWAT model assumes that each HRU has the same slope, which may affect the flow production and confluence simulation of different land types. Third, multi-source meteorological data such as reanalysis data and interpolated data were used as the input data in the simulation process, which may cause bias to some extent (Li et al., 2022; Sudesan et al., 2022). Finally, our model was calibrated and validated based on only observed streamflow data, and thus, the simulation of evaporation and infiltration need to be further validated after the calculation of observed data (Gowda et al., 2022).
3.5.2 Limitations of this research
Due to the large span of time-space and great differences in geographical conditions in the LMRB, the observed data was difficult to be obtained. The limitation was related to three aspects. The first limitation is that the streamflow data in the most of the stations in LMRB were absent and inconsecutive, which lead to the streamflow simulation of estuary area was not been achieved. The second limitation is that the human activities such as the reservoir discharge and irrigation water were not considered in this study. Reservoirs, such as the Xiao wan and Nuozhadu hydropower stations in LRB may affect the simulation result in certain years (Wang et al., 2017). The third limitation is that this study used muti-source data in the format like site in LRB + grid in MRB instead of all grid data (Han et al., 2012; Tang et al., 2019). Through comparing the correlation between these two data forms and the observed streamflow series, using the site data in LRB could ensure the accuracy of streamflow simulation and the process of calibration and validation to the maximum extent (Swain et al., 2018; Tang et al., 2021).
4 Conclusion
As the largest transboundary river in Asia, the Lancang-Mekong River (LMR) not only connects six countries with significant geographical, economic, and cultural differences, but also spans the alpine, temperate, and tropical climatic zones, making the Lancang-Mekong River Basin (LMRB) suffer significant influences from climate change and human activities. This study performed a detailed analysis of the impacts of climate and human activities across the entire LMRB on streamflow process over the recent decades in an integrated form using a large number of multi-source data, trend analysis and cumulative anomaly methods and SWAT model. The main results obtained in this study are:
1) At the yearly timescale, there is no significantly increasing or decreasing trend showing in the streamflow process at Jiuzhou station, but a significant decrease at Yunjinghong station, an insignificant decreasing trend at Vientiane station and an increasing trend at Stung Treng station. At the seasonal timescale, the varying trend of streamflow at each hydrological station was consistent essentially with that at the yearly timescale.
2) At the yearly timescale, the ratios of the contributions of human activities (ηh) to the streamflow changes before 2000 to the counterparts after 2000 are 15.2% and 10.3%, 17.5% and 17.1%, 29.2% and 32.4%, 22.6% and 59.1% in Jiuzou, Jiu-Yun, Yun-V and V-S areas, respectively. At the seasonal timescale, ηh in the dry season before to after 2000 is 17.8% and 10.5%, 27.6% and 35.7%, 28.5% and 29.3%, 56.1% and 68.3%, respectively. In the wet season, ηh is 13.9% and 9.5%, 13.1% and 13.5%, 27.1% and 39.4%, 22.8% and 62%, respectively.
3) The impacts of climate change on streamflow in the LMRB gradually decreased from the upper to the lower reaches, while the impacts of human activities gradually increased. Furthermore, the impacts of climate change on streamflow in the dry season were more significant than in the wet season. The contributions of Land use types change (
Although this study provides a quantitative evaluation of the impacts of climatic variation and human activities on streamflow changes in the integrated form in LMRB, some shortcomings remain. While this study took the effects of climate, topography, soil, vegetation, and other spatial-temporal variability on streamflow into consideration, the parameter values, sensitivity, and scale effects of those factors on streamflow process were not systematically investigated and further detailed studied are required (Ahn and Merwade, 2014; Gao et al., 2020; Andaryani et al., 2021; Wang et al., 2021).
Data availability statement
Publicly available datasets were analyzed in this study. This data can be found here: 1) Meteorological data. Daily precipitation and temperature data of the LMRB were collected from the Chinese meteorological data sharing service system (available from http://data.cma.cn/data/detail/dataCode/A.0012.0001.html) and the Asian Precipitation-Highly-Resolved Observational Data Integration Towards Evaluation (APHRODITE, 0.25° ⅹ 0.25°, available from http://aphrodite.st.hirosaki-u.ac.jp/download/), respectively. To compensate for the lack of APHRODITE data at the maximum and minimum temperature, this study used the Global Surface Summary of the Day (GSOD, available from https://data.noaa.gov/dataset/dataset/global-surface-summary-of-the-133 day-gsod) data from NOAA and Global Historical Climatology Network (GHCND, available from https://www.ncei.noaa.gov/products/land-based-station/global-historical-climatology-network-daily) data. Evapotranspiration was calculated using the Penman-Monteith equation. 2) Hydrological and topographic data. The streamflow data were provided by Yunnan University and the Mekong River Commission (MRC). The geographical data, such as the 1 km × 1 km raster data, was extracted and resampled from 90 m resolution digital elevation model (DEM) data provided by the USGS (available from http://www.usgs.gov). 3) Land cover and soil data. The land use and land cover data of the LRB (1980–2015, per 5 years) were produced by the Institute of Geographical Sciences and Resources, Chinese Academy of Sciences, and the similar data of the MRB were downloaded and resampled from the Servir-Mekong dataset from 1987 to 2015 (available from https://rlcms-servir.adpc.net/en/landcover). Soil data in LMRB was obtained from the Harmonized World Soil Database (HWSD).
Author contributions
Conceptualization, RL and HH; methodology, RL and RZ; software, RL and ZW; validation, RL and HH; formal analysis, RL and HH; investigation, RL, HH, and ZW; resources, HH and RZ; data curation, RL; writing—original draft preparation, RL; writing—review and editing, RL and HH; visualization, RL and HH; supervision, HH and ZW; project administration, HH and ZW; funding acquisition, ZW and HH.
Funding
This research was financially supported by the Strategic Priority Research Program of the Chinese Academy of Sciences (XDA19030204) and National Natural Science Foundation of China (Grant No. 41,561,144,012).
Conflict of interest
The authors declare that the research was conducted in the absence of any commercial or financial relationships that could be construed as a potential conflict of interest.
Publisher’s note
All claims expressed in this article are solely those of the authors and do not necessarily represent those of their affiliated organizations, or those of the publisher, the editors and the reviewers. Any product that may be evaluated in this article, or claim that may be made by its manufacturer, is not guaranteed or endorsed by the publisher.
References
Ahn, K. H., and Merwade, V. (2014). Quantifying the relative impact of climate and human activities on streamflow. J. Hydrology 515, 257–266. doi:10.1016/j.jhydrol.2014.04.062
Ali, S., Wang, Q., Liu, D., Fu, Q., Mafuzur Rahaman, M., Abrar Faiz, M., et al. (2022). Estimation of spatio-temporal groundwater storage variations in the Lower Transboundary Indus Basin using GRACE satellite. J. Hydrology 605, 127315. doi:10.1016/j.jhydrol.2021.127315
Andaryani, S., Nourani, V., Ball, J., Jahanbakhsh Asl, S., Keshtkar, H., and Trolle, D. (2021). A comparison of frameworks for separating the impacts of human activities and climate change on river flow in existing records and different near-future scenarios. Hydrol. Process. 35 (7), e14301. doi:10.1002/hyp.14301
Chen, Changzheng, Gan, Rong, Feng, Dongmei, Yang, F., and Zuo, Q. (2022). Quantifying the contribution of SWAT modeling and CMIP6 inputting to streamflow prediction uncertainty under climate change. J. Clean. Prod. 364, 132675. doi:10.1016/j.jclepro.2022.132675
Dong, Z., Liu, H., Hu, H., Khan, M. Y. A., Wen, J., Chen, L., et al. (2022). Future projection of seasonal drought characteristics using CMIP6 in the Lancang-Mekong River Basin. J. Hydrology 610, 127815. doi:10.1016/j.jhydrol.2022.127815
Ep, A., Hlh, B., Dvbc, D., Kantoush, S., Poh, D., Alcantara, E., et al. (2021). Impacts of agricultural expansion on floodplain water and sediment budgets in the Mekong River. J. Hydrology 605, 127296. doi:10.1016/j.jhydrol.2021.127296
Fan, X., and Luo, X. (2019). Precipitation and flow variations in the Lancang-Mekong river basin and the implications of monsoon fluctuation and regional topography. Water 11 (10), 2086. doi:10.3390/W11102086Gowda
Gao, X., Yan, C., Wang, Y., Zhao, X., Zhao, Y., Sun, M., et al. (2020). Attribution analysis of climatic and multiple anthropogenic causes of runoff change in the loess plateau-A case-study of the jing River Basin. Land Degrad. Dev. 31 (13), 1622–1640. doi:10.1002/ldr.3557
Gassman, P. W., Reyes, M. R., Green, C. H., and J. G. Arnold, (2007). The soil and water assessment tool: Historical development, applications, and future research directions. Trans. ASABE 50 (4), 1211–1250. doi:10.13031/2013.23637
Gowda, A. N. B., Patil, N. S., and Natarajan, M. (2022). “Multisite calibration of the ghataprabha sub-basin using soil and water assessment tool,”. Editors R. Jha, V. P. Singh, V. Singh, L. B. Roy, and R. Thendiyath (Cham: Springer), Vol. 109. doi:10.1007/978-3-030-81358-1_12Hydrol. Model.
Gupta, A. (2022). Large rivers: Geomorphology and management. Second Edition, 661–686. doi:10.1002/9781119412632.ch22The M ekong river: Morphology, evolution, and management
Han, F., and Zheng, Y. (2016). Multiple-response bayesian calibration of watershed water quality models with significant input and model structure errors. Adv. Water Resour. 88, 109–123. doi:10.1016/j.advwatres.2015.12.007
Han, Z., and Zhou, T. (2012). Assessing the quality of aphrodite high-resolution daily precipitation dataset over contiguous China. Chin. J. Atmos. Sci. doi:10.3878/j.issn.1006-9895.2011.11043
Hu, K. X., Awange, J. L., Kuhn, M., Nanteza, J., et al. (2021). Inference of the spatio-temporal variability and storage potential of groundwater in data-deficient regions through groundwater models and inversion of impact factors on groundwater, as exemplified by the Lake Victoria Basin. Sci. Total Environ. 800, 149355. doi:10.1016/j.scitotenv.2021.149355
Kendall, M. G. (1975). Rank correlation methods. 2nd impression. In Charles Griffin and Company Ltd. London and High. Wycombe; Griffin, London, UK.
Li, C. Y., and Fang, H. Y. (2021). Assessment of climate change impacts on the streamflow for the Mun River in the Mekong basin, southeast Asia: Using SWAT model. Catena 201, 105199. doi:10.1016/j.catena.2021.105199
Li, Q., Zeng, T., Chen, Q., Han, X., Weng, X., He, P., et al. (2022). Spatio-temporal changes in daily extreme precipitation for the lancang–mekong River Basin. Nat. Hazards (Dordr). doi:10.1007/s11069-022-05569-4
Li, R., Huang, H., Yu, G., Bridhikitti, A., and Su, T. (2020). Trends of runoff variation and effects of main causal factors in Mun River, Thailand during 1980–2018. Water 12 (3), 831. doi:10.3390/w12030831
Liu, D. D., Chen, X. H., Lian, Y. Q., and Lou, Z. (2010). Impacts of climate change and human activities on surface runoff in the Dongjiang River Basin of China. Hydrol. Process. 24, 1487–1495. doi:10.1002/hyp.7609
Liu, J., Chen, D., Mao, G., Irannezhad, M., and Pokhrel, Y. (2021). Past and future changes in climate and water resources in the lancang–mekong River Basin: Current understanding and future research directions. Engineering 13, 144-152. doi:10.1016/j.eng.2021.06.026
MRC (2022). Mekong low flow and drought. Vientiane, Laos, Asia: MRC Secretariat. doi:10.52107/mrc.qx5yo7
Ning, Y. N., Yang, X. N., Sun, W. Y., Mu, X. m., Gao, P., Zhao, G. j., et al. (2021). The trend of runoff change and its attribution in the middle reaches of the Yellow River. J. Nat. Resour. 36 (1), 256–269. http://www.jnr.ac.cn/EN/Y2021/V36/I1/256. doi:10.31497/zrzyxb.20210117
Noszczyk, T., Rutkowska, A., and Hernik, J. (2017). Determining changes in land use structure in Małopolska using statistical methods. Pol. J. Environ. Stud. 26, 211–220. doi:10.15244/pjoes/64913
Paiva, R. C. D., Collischonn, W., and Tucci, C. E. M. (2011). Large scale hydrologic and hydrodynamic modeling using limited data and a GIS based approach. J. Hydrology 406 (3-4), 170–181. doi:10.1016/j.jhydrol.2011.06.007
Räsänen, T. A., and Kummu, M. (2013). Spatiotemporal influences of ENSO on precipitation and flood pulse in the Mekong River Basin. J. Hydrology 476, 154–168. doi:10.1016/j.jhydrol.2012.10.028
Song, S., Wang, S., Fu, B., Liu, Y., Wang, K., Li, Y., et al. (2020). Sediment transport under increasing anthropogenic stress: Regime shifts within the Yellow River, China. Ambio 49, 2015–2025. doi:10.1007/s13280-020-01350-8
Ssa, B., Bba, D., Rt, C., and Virdis, S. G. P. (2022). Integrated assessment of the landuse change and climate change impacts on the sediment yield in the Songkhram River Basin, Thailand. Catena (Amst). 209, 105859. doi:10.1016/j.catena.2021.105859
Sudesan, S., Remesan, R., and Sen, D. (2022). “Hydrologic modeling with SWAT in an eastern Indian River Basin using different gridded data sets,”. Editors R. Jha, V. P. Singh, V. Singh, L. B. Roy, and R. Thendiyath (Cham, Switzerland: Springer), 109. doi:10.1007/978-3-030-81358-1_34Hydrol. Model.
Swain, S., Verma, M. K., and Verma, M. K. (2018). “Streamflow estimation using SWAT model over seonath River Basin, Chhattisgarh, India,”. Editors V. Singh, S. Yadav, and R. Yadava (Singapore: Springer), 81. doi:10.1007/978-981-10-5801-1_45Hydrol. Model.
Tan, Xueling, Liu, Suning, Tian, Yong, Zhou, Z., Wang, Y., Jiang, J., et al. (2022). Impacts of climate change and land use/cover change on regional hydrological processes: Case of the guangdong-Hong Kong-Macao greater bay area. Front. Environ. Sci. 9, 783324. doi:10.3389/fenvs.2021.783324
Tang, J., Yin, X. A., Yang, P., and Yang, Z. (2014). Assessment of contributions of climatic variation and human activities to streamflow changes in the Lancang River, China. Water Resour. manage. 28 (10), 2953–2966. doi:10.1007/s11269-014-0648-5
Tang, X., Woodcock, C. E., Olofsson, P., and Hutyra, L. R. (2021a). Spatiotemporal assessment of land use/land cover change and associated carbon emissions and uptake in the Mekong River Basin. Remote Sens. Environ. 256, 112336. doi:10.1016/j.rse.2021.112336
Tang, X., Zhang, J., Gao, C., Ruben, G., and Wang, G. (2019). Assessing the uncertainties of four precipitation products for swat modeling in Mekong river basin. Remote Sens. (Basel). 11, 304. doi:10.3390/rs11030304
Tang, X., Zhang, J., Wang, G., Ruben, G. B., Bao, Z., Liu, Y., et al. (2021b). Error Correction of multi-source weighted-ensemble precipitation (MSWEP) over the Lancang–Mekong river basin. Remote Sens. (Basel). 13, 312. doi:10.3390/rs13020312
Tatsumi, K., and Yamashiki, Y. (2015). Effect of irrigation water withdrawals on water and energy balance in the Mekong River Basin using an improved VIC land surface model with fewer calibration parameters. Agric. Water Manag. 159, 92–106. doi:10.1016/j.agwat.2015.05.011
Wang, C., Xu, J., Chen, Y., and Li, W. (2019). An approach to simulate the climate-driven streamflow in the data-scarce mountain basins of Northwest China. J. Earth Syst. Sci. 128 (4), 95–15. doi:10.1007/s12040-019-1117-6
Wang, J., Yun, X., Pokhrel, Y., Yamazaki, D., Zhao, Q., Chen, A., et al. (2021). Modeling daily floods in the lancang-mekong River Basin using an improved hydrological-hydrodynamic model. Water Resour. Res. 57 (8), e2021WR029734. doi:10.1029/2021WR029734
Wang, W., Lu, H., Ruby Leung, L., Li, H. Y., Zhao, J., Tian, F., et al. (2017). Dam construction in Lancang-Mekong River Basin could mitigate future flood risk from warming- induced intensified rainfall. Geophys. Res. Lett. 44, 10378–410386. doi:10.1002/2017GL075037
Wu, J., Chen, Y. F., and Hang, Q. (2016). Analysis of inconsistent hydrological frequency based on TFPW-MK-pettitt and EEMD, [C]. Proceedings of the Environmental Science and Sustainable Development: International Conference on Environmental Science and Sustainable Development (ICESSD 2015). 198–207. Bangkok, Thailand, doi:10.1142/9789814723039_0027
Yanming, Z., Jun, W., and Xinhua, W. (2012). in Future computer, communication, control and automation (Heidelberg, Germany: Springer), 505–513. doi:10.1007/978-3-642-25538-0_71Study on the change trend of precipitation and temperature in Kunming city based on Mann-Kendall analysis
Yun, X., Tang, Q., Wang, J., Liu, X., Zhang, Y., Lu, H., et al. (2020). Impacts of climate change and reservoir operation on streamflow and flood characteristics in the Lancang-Mekong River Basin. J. Hydrology 590, 125472. doi:10.1016/j.jhydrol.2020.125472
Zhang, A. J., Zhang, C., Fu, G. B., Wang, B., Bao, Z., and Zheng, H. (2012). Assessments of impacts of climate change and human activities on runoff with SWAT for the Huifa River Basin, northeast China. Water Resour. manage. 26 (8), 2199–2217. doi:10.1007/s11269-012-0010-8
Keywords: Lancang-Mekong river basin, climate change, human activities, streamflow, SWAT model
Citation: Li R, Huang HQ, Wang Z and Zhao R (2023) Quantitative assessment of the impacts of climate and human activities on streamflow of the Lancang-Mekong river over the recent decades. Front. Earth Sci. 10:1024037. doi: 10.3389/feart.2022.1024037
Received: 20 August 2022; Accepted: 05 December 2022;
Published: 04 January 2023.
Edited by:
Dabang Jiang, Institute of Atmospheric Physics (CAS), ChinaReviewed by:
Mohamad N. Azra, Universiti Malaysia Terengganu, MalaysiaHaiyun Shi, Southern University of Science and Technology, China
Copyright © 2023 Li, Huang, Wang and Zhao. This is an open-access article distributed under the terms of the Creative Commons Attribution License (CC BY). The use, distribution or reproduction in other forums is permitted, provided the original author(s) and the copyright owner(s) are credited and that the original publication in this journal is cited, in accordance with accepted academic practice. No use, distribution or reproduction is permitted which does not comply with these terms.
*Correspondence: Zhonggen Wang, d2FuZ3pnQGlnc25yci5hYy5jbg==