
94% of researchers rate our articles as excellent or good
Learn more about the work of our research integrity team to safeguard the quality of each article we publish.
Find out more
ORIGINAL RESEARCH article
Front. Earth Sci., 06 January 2023
Sec. Structural Geology and Tectonics
Volume 10 - 2022 | https://doi.org/10.3389/feart.2022.1022719
This article is part of the Research TopicGeomechanics and Induced Seismicity for Underground Energy and Resources ExploitationView all 9 articles
During the construction of subway tunnels, the geotechnical body is affected by excavation to produce three-dimensional spatial deformation. The deformation of geotechnical bodies is an important safety hazard for project advancement, so it is important to understand the excavation disturbance range and deformation mechanism. The current related research is mainly about the theory of land subsidence and the two-dimensional plane displacement of the stratum, and there are few studies on the specific three-dimensional disturbance mode and its mechanism. In order to better understand the three-dimensional displacement characteristics of the tunnel excavation soil, a tunnel excavation model test was established based on a true triaxial stress loading system combined with three-dimensional scanning technology for a superimposed sandy soil. Based on the established model, the vector displacement response range and three-dimensional deformation characteristics of the excavation face were studied in the main displacement affected area around the excavation face. Meanwhile, the deformation characteristics, such as vertical settlement and horizontal displacement of the stratum in the main influence area were analyzed. The results show that the main influence area of tunnel excavation is elliptical and distributed within a range of twice the diameter of the tunnel axis. The main influence range is bell-shaped in the vertical direction and inverted wedge-shaped in the horizontal direction. The three-dimensional space presents a “W” deformation distribution. The three-dimensional deformation theoretical model of the excavation face established in this paper can provide some references for the excavation engineering of superimposed sand-soil tunnels.
With the continuous advancement of the urbanization process, more and more underground tunnel excavation projects are being carried out. In tunnel construction, controlling strata movement to ensure effective excavation is the main problem that must be considered (Mair, 2008; Zhu, 2014). The analysis of the characteristics of stratum disturbance caused by tunnel construction generally believes that the stratum movement presents regional differences around the tunnel, and the interface between the disturbance areas changes with the different working face soil (Yuan et al., 2018). Strata movement is inevitable during tunnel excavation and different geological conditions show different displacement characteristics (Pinto et al., 2014). Taking the typical sandy soil in the Beijing area as an example, the excavation displacement of the tunnel in the sandy soil layer is particularly obvious (Li and Ma, 2011; Cheng et al., 2019). The existing research on face subsidence and stratum displacement is relatively complete, but the research on the three-dimensional displacement of the excavation face at a certain excavation position after excavation is limited, and the research on the influence of the superimposed stratum displacement of different soils is even less. Therefore, this paper proposes a specific study on the displacement of the excavation face caused by the full-section tunnel excavation of the superimposed sand layer.
The displacement of soil mass on the face and in the stratum can be predicted through theoretical calculation (Yoshikoshi et al., 1978; Mair et al., 1993; Verruijt, 1998; Park, 2005; Pinto and Whittle, 2014). Peck (1969) integrated a large number of tunnel excavation face settlement monitoring data and found that the shape of the settlement tank per unit length can be estimated by a normal (Gaussian) distribution curve. On the basis of a series of in situ observations and a theory of face loss, an empirical solution for estimating face subsidence caused by tunnel excavation is systematically proposed for the first time (Peck, 1969). In addition, the mirror image method (Sagaseta, 1987; Loganathan and Poulos, 1998) and the random medium theory system (Litwiniszyn, 1957; Yang and Wang, 2011) are also widely used in the study of soil deformation caused by tunnel construction. However, the theoretical analysis of relevant scholars is more about face subsidence, and the impact of excavation on the face built environment is understood through the description of the face subsidence tank (Hagiwara et al., 1999; Mollon et al., 2012; Cao et al., 2020; Yang et al., 2021). The stratum movement is three-dimensional during the tunneling process, and Attewell et al. (1986) extended the Peck formula to establish a three-dimensional empirical solution (Attewell et al., 1986). Pinto and Whittle simplified soil plasticity and derived a relatively innovative analytical solution (Pinto et al., 2014). The three-dimensional solution is mostly based on the time-history curves of land subsidence and overall formation subsidence from the two-dimensional solutions. The three-dimensional displacement is shown by combining the two-dimensional displacements.
In the last 3 decades, laboratory physical models have played an increasingly important role in tunnelling research (Meguid et al., 2008; Marshall et al., 2012). In order to study the response of tunnel excavation to strata, more and more modeling techniques have been developed and applied. From the point of view of gravity mechanics, the model tests mainly include centrifugal model tests and conventional model tests (Nomoto et al., 1999; Berthoz et al., 2012; Berthoz et al., 2018; Chen et al., 2018; Song and Marshall, 2020). N. Loganathan accelerated the centrifuge to 100 g, used a scale model of 1:100, and evaluated the soil deformation caused by tunnel excavation through three centrifugal model tests and measured the vertical and lateral ground motions induced by the excavation (Loganathan et al., 2000). Mahmoud Ahmed uses transparent soil to simulate sand, and studies the movement characteristics of the ground and nearby soil caused by shield tunnel construction through the analysis of full-field displacement vector, ground deformation profile, and internal strain (Ahmed and Iskander, 2011). Even though the effect of gravitational acceleration can be taken into account in the centrifugal test to simulate the natural gravity state of the soil as well as possible, the tunneling process is usually simulated as a two-dimensional response process.
At present, there are many methods for predicting the face subsidence disturbed by tunnel excavation, but there are few studies on the three-dimensional subsidence deformation of the tunnel. Based on the elastic analysis method proposed by Verruijt and Booker and the principle of conservation of ground loss (Verruijt and Booker, 1998), Haiqing Yang studied the influence of tunnel burial depth on face settlement and the influence of different excavation length and burial depth on three-dimensional settlement grooves through the tunnel radial shrinkage model test (Yang et al., 2019). Hongliang Tu used a numerical simulation method to study the deformation of surrounding rock and the mechanical properties of supporting structures under different excavation methods. Different soils will lead to differences in stratum movement. During excavation, it is necessary to monitor the internal displacement of surrounding rock, understand the mechanism of stratum movement, and determine the sliding failure face and stratum subsidence curve. It is also necessary to establish a specific kinematic model of the excavation face.
In order to simulate the typical sandy soil in the Beijing area and compare the deformation characteristics of different soils, several sections of the soil at the construction site were selected for laboratory physical property measurement and reshaping applications. Ten soil screening tests showed that the soil was sandy soil. According to the soil sample preparation standard (Geotechnical test method standard GBT50123-2019), the material is mixed evenly with a mixer, and the model space is filled layer by layer with an appropriate compaction method by hammering, and the model density is adjusted by controlling the material quality and filling height. The experimental simulation in this paper refers to Beijing Metro Line 17. The outer diameter of the shield tunnel is 6.4 m and the inner diameter is 5.8 m. The thickness of the segment is 0.3 m. As shown in Figure 1, according to the theoretical ratio of similar models of 160:1, the diameter of the excavated tunnel in the experiment is 55 mm, and the length, width and height of the model sample are 300 mm each. In order to avoid the influence of the boundary effect, this size meets the basic requirement that the boundary range of the model is greater than 5 times the diameter of the tunneling work face. The physical and mechanical parameters of the sandy soil are shown in Table 1.
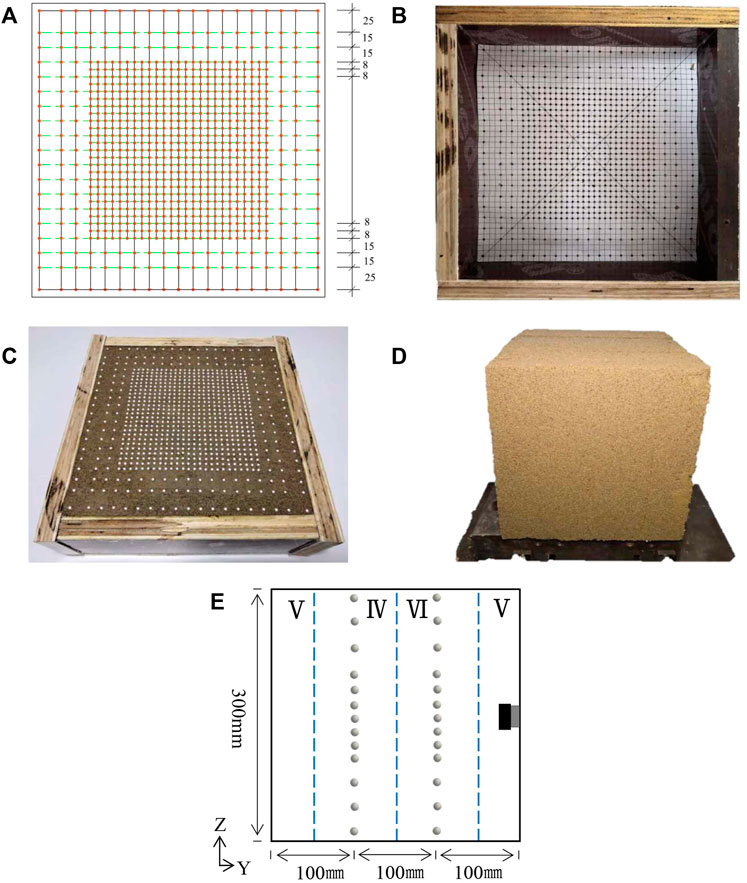
FIGURE 1. Sample preparation: (A) Marker layout plan, (B) Marker localization, (C) Marker placement effectmonitoring surface, (D) Overall cube specimen, (E) Marker monitoring surface position.
Since this study focuses on the deformation on the excavation face of the tunnel, in order to focus on considering the influence range of the hole after excavation, the grid density of the marking points buried around the tunnel is higher than that of the marking points in the external area, so as to achieve the effect of establishing an accurate model. The specimens were compacted in six layers, which are silty clay, 60% sandy soil, 40% sandy soil, and silty clay in sequence. Figure 1 shows two monitoring sections arranged perpendicular to the excavation direction, located at 1/3 and 2/3 along the excavation direction. The first monitoring section is in the 60% sandy soil layer, and the second is in the 40% sandy soil layer. This is so that the overall movement of the excavation face in the different sandy soil layers can be tracked in three dimensions. (Figure 1). The specific placement process for the markers is as follows:
- Prepare the sandy soil into the model box with multiple sieves to 200 mm from the excavation direction;
- Set the initial position of the marker on this plane using cardboard (a positioning device);
- Embedding the marker into the monitoring plane by means of a positioned coordinate point and sprinkling a small amount of 5,000 mesh ultra-fine mica powder on the surface (to facilitate the splitting of the specimen);
- Continue to sieve the sandy soil to the position of 100 mm in the excavation direction, after installing the marker at the 100 mm position, prepare the sand until the initial position of excavation.
In the past, researchers often arranged markers outside the model monitoring surface and took moving pictures of the simulated tunnel construction monitoring surface (Grant and Taylor, 2000) to measure the displacement and deformation of the soil. Such a displacement observation method is not only limited by dimensions (two-direction displacement in two dimensions and limited in the third direction), but also affected by the friction of the model frame itself. Trends and displacements have an effect.
The minimum display size of the 3D scanner is 0.04 mm. In order to reduce the influence of marker density on the experimental effect, Ga2O with a diameter of 1 mm and a specific gravity of 2.8 g/cm3 was selected as the displacement tracking marker after scanning as shown in Figure 2. In addition, the face of the marker is sanded to increase friction in order to diminish the effects of the contact face between the materials.
The test system was developed by the Institute of Geology and Geophysics, Chinese Academy of Sciences. The stress loading system is composed of a high-stiffness true triaxial servo control loading unit, an excavation bit, and a 3D scanner measuring system, as shown in Figure 3. Three independent hydraulic piston cylinders apply confining pressure, and the effective force measuring range is 10N-3000 kN . The resolution of force measurement is 15 N, the accuracy of force measurement is within ±1%, the fluctuation of force control is less than 0.1%, and the loading rate in each direction is 10 N-10 kN/s. The computer carries out servo control of test force, stress, deformation, strain and displacement for the whole test process and can be maintained. In the triaxial loading shown in the figure, the interlocking staggered placement of wooden spacers wraps the specimen, so that both the stress can be applied effectively and the pads can be pushed relative to each other to form a perfect closure. The wooden spacers are dried and then sprayed with a reinforcing agent of a modified polyurethane nature. In this case, the hardness of the wooden spacers is up to 2.5–3H on the Brinell scale, and the modulus of elasticity is up to 100 MPa. A film with lubricant is attached between the bearing plate and the sample surface. The lubricant is high-quality Vaseline, which reduces the friction between the sample and the bearing plate. The applied stress has no effect on the deformation of the wooden spacers or the specimen.
Traditional land subsidence monitoring methods generally use micrometers, and most of them are two-dimensional point measurements. Here we use laser scanning to locate the marking beads embedded in the sample and develop a three-dimensional laser scanning displacement comparison technology of the excavation face to reconstruct the three-dimensional point cloud model of the vertical tangent plane before and after the tunnel excavation. The model after foundation displacement changes is compared with the model in the initial stage, so as to observe the three-dimensional deformation of the rock mass around the excavation face and give the three-dimensional deformation and displacement model of the excavation face under the condition of true three-dimensional in-situ stress.
In this study, a three-dimensional (3D) laser scanner with a resolution of 0.04 mm (the distance between the midpoints of two parallel scan lines) was used to measure the three-dimensional morphology of the test face before and after excavation. Measure and obtain face features under the establishment of a three-dimensional world coordinate system. After scanning, the images were analyzed using the Geomagic Studio software. Three stereoscopic machine heads can cover a maximum scanning area of about 500 mm * 500 mm. From the 300 mm * 300 mm square pattern window generated by scanning, 817 embedded marker beads are read to characterize the specific position coordinates of each point on its face. An “Isometric View” of the selected digital copy is shown in Figure 4.
During progressive or intermittent excavation of underground tunnels, unloading excavation will inevitably lead to obvious spatial adjustment and transfer of the internal stress of the rock mass. The soil redistribution stress makes the stress concentrated in specific areas of the cavern chamber and leads to the gradual transfer of soil displacement to the deep part after driving soil displacement around the cavern (Jiang et al., 2017). In the experiment, three sections of rigid aluminum alloy casing of 120 mm in length, 50 mm in outer diameter, and 1 mm in wall thickness are used to simulate the support and effectively control the continuous deformation displacement of the surrounding rock in the stress concentration area. Taking the deformation-inhibiting design for the stability of full-section excavation surrounding rock under full ground stress as the guideline (Jiang et al., 2019):
Where: S is the excavation scheme, P is the support parameter, T is the support timing, D is the destroyed depth, and RFD is the fracture evaluation index of the surrounding sandy soil.
The entire project uses the method of simulating support after the excavation bit with an aluminum alloy casing. The applied force is based on the maximum deformation range, and the further deformation of the surrounding rock is suppressed by the support. Rigid support is used to fully use the surrounding rock’s own bearing performance to keep and rebuild the soil-bearing arch and reach the goal of supporting to control deformation.
Before and after full stress loading, the 3D scanning marker position change and surrounding rock deformation observation steps are as follows: initial monitoring surface 3D scanning—true triaxial full stress loading—sand sample unloading dismantling monitoring surface 3D scanning—reloading sample stress loading and excavating the tunnel—end of excavation secondary unloading to dismantle the specimen and carry out 3D scanning of the monitoring surface. By excavating under full ground stress loading and then observing the 3D scan without loading, the 3D coordinate changes of the markers are derived, and the plastic deformation range of the two superimposed sand enclosures is obtained.
The stress is applied successively in the form of graded loading. The initial in-situ stress field is determined by the soil bulk density γ and the lateral pressure coefficient
(1) Vertical self-weight stress:
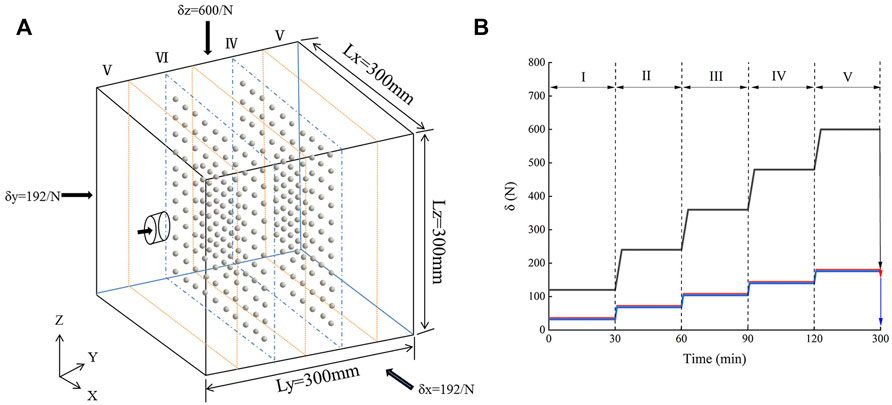
FIGURE 5. Isotropic stress applied to cube specimen during five loading stages: (A) Schematic diagram of model excavation, (B) Stress loading time-history curve.
(2) Horizontal self-weight stress:
According to the dimensional analysis method of the similarity principle in the model test, combined with factors such as the simulation range and the loading conditions of the testing machine, the geometric similarity constant Cl = 160, the stress similarity ratio Cσ = 160, and the severe similarity coefficient Cγ = 1. Figure four depicts the calculated principal stress loading of 600 N and lateral stress of 192 N.
In order to fully simulate the impact of open full-section excavation on the surrounding rock and working face of the tunnel, the total length of the tunnel is excavated in stages. According to the similarity theory, in the experiment, the excavation was 10 mm per minute and then the drilling was stopped for 1 min (one excavation step) to simulate the excavation and downtime in the project, respectivelyand the excavation was divided into 30 steps and took 60 min to complete. As shown in Figure 6, the entire excavation process is divided into three major sections based on the location of the monitoring surface in the sample in three equal parts and the method of hard aluminum alloy support in three sections. Excavation to the first monitoring section, digging to the position of 100 mm of the sample, total excavation time of 10 steps is 20 min; excavation to the second monitoring sample of 200 mm, total excavation time of 20 steps is 40 min; and finally, excavation to the sample penetration, total excavation time of 30 steps is 60 min Monitoring surfacemonitoring surface.
At present, there is not much accumulation of measured data of stratum displacement caused by tunnel construction in rock and soil mass, especially the continuous stratum displacement data below the face, which is rare. In this paper, the deformation of surrounding rock and the subsidence of a foundation are analyzed in detail through laboratory tests. The displacement markers embedded in the model show that the original equilibrium state of the surrounding rock was destroyed by the tunnel excavation, and the stress redistribution occurred inside the rock mass, resulting in the deformation of the surrounding rock. Through Geomagic Studio’s point cloud reconstruction, the deformation of the monitored section perpendicular to the excavation direction is constructed. The displacement of surrounding rock X and Y under different excavation steps is shown in Figure 7. These displacements come from the measuring points on sections I and II, and it can be seen from the Figure that the marked points around the holes have obvious displacements. Since the experiment mainly studies the displacement and deformation of the surrounding rock and the excavation face during the excavation process, the effects of grouting on the project are not considered. The displacement of the mark points is mainly concentrated around the hole, and all of them move towards the tunnel axis. On the whole, the displacement of the excavation face 2 is larger than that of the excavation face 1.
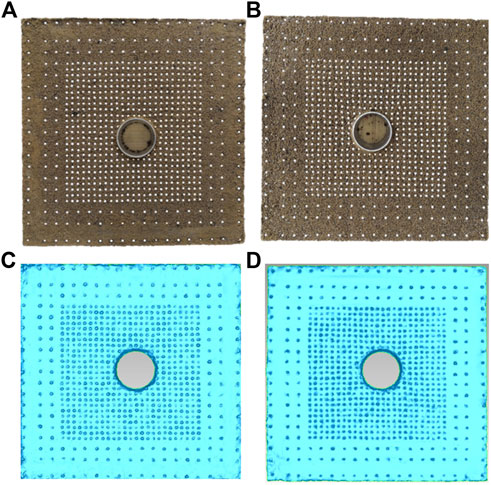
FIGURE 7. Monitoring section after excavation: (A) Experimental results of excavation face 1, (B) Experimental results of excavation face 2, (C) 3D scanning image of excavation face 3, (D) 3D scanning image of excavation face 2.
The damage caused by displacement is mainly influenced by plastic deformation, and the deformation-inhibiting design applied above mainly targets the control of plastic deformation as well. In this paper, the focus is on the effect of plastic deformation on the tunnel’s surrounding rock; the related elastic deformation is less studied than plastic deformation. On the other hand, it is also because this part of elastic deformation is basically recoverable and will not directly lead to settlement damage, so this paper will consider less elastic deformation compared to plastic deformation.
The displacements of the markers in the sand layer are represented by vector arrows, which represent the main deformations of the surrounding soil under different soils of the tunnel. The initial coordinates are obtained by scanning the radiograph before excavation in Figure 6 (the initial settlement is 0), and the vector within the range of 1.5 times the diameter of the hole outside the hole is used to characterize the orientation trend of the displacement vector on the excavation face. It presents the stratum reaction characteristics and deformation characteristics before and after tunnel excavation and reflects the change of rock mass stiffness in a certain area.
Z values at three-dimensional coordinate points of markers are extracted centeredly in order to observe vertical settlement. The X value after loading and excavation and the X value before excavation are regarded as the same fixed value, and then the Z value of the two is compared so as to intuitively give the specific vertical settlement of the marked points around the hole.
It can be seen from Figure 8 that the vertical displacements of both strata are distributed in a “bell shape.” The vertical displacement on the excavation face increases sequentially from the distal end to the proximal end of the tunnel axis, and the maximum settlement occurs at the top and bottom of the hole. On the one hand, due to the influence of the settlement tank, with the change of the depth, the soil layer above the tunnel produces soil arches when the stratum is lost, and the soil arches limit the development of stratum settlement. On the other hand, due to the redistribution of the surrounding rock stress during the excavation of the hole, the linear shape of the three-dimensional stress disturbance at the near-axis end increases, resulting in a significant displacement along the hole direction. Under the vault and parallel to the axis, the vertical settlement trend is opposite to that outside the vault or arch bottom. Because under the vertical load of self-weight stress, the vertical stress and reaction force at the tunnel axis position are almost superimposed, the interference of the two forces cancels out, and the vertical displacement decreases significantly toward the axis position.
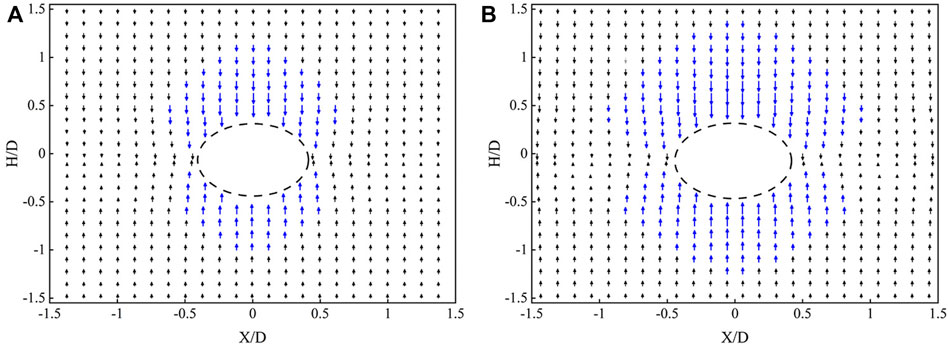
FIGURE 8. Displacement vector comparison of vertical influence range (In order to express clearly, it is not drawn according to the actual scale, and the effect is enlarged at a scale of 1.5 times): (A) Vertical displacement vector diagram of plane 1, (B) Vertical displacement vector diagram of plane 2.
It is not difficult to see from the Figure ure that the main influence range of excavation face 1 is obviously smaller than that of excavation face 2, which accounts for about 2/3 of that of excavation face 2. Among them, the influence range of the excavation face 1 is mainly concentrated on the sixth floor above the top of the tunnel, which is about 45 mm away from the top of the tunnel, which is 0.75 times the diameter of the tunnel. The main influence area below the bottom of the cave is within the range of 0.5 times the diameter of the cave on the fourth floor. The influence range of the excavation face 2 is 9 floors above the top of the tunnel, which is 68 mm from the top, which is 1.2 times the diameter of the tunnel. The main influence area below the bottom of the cave is within 0.75 times the diameter of the cave on the sixth floor. The upper compression is a little bit bigger than the lower compression. This is because the acting force is the main stress, and the tunnel vault is more likely to fail in a tensile way when the ground load is acting on it. As a result, there is more deformation and movement along the diameter of the tunnel.
The horizontal displacement trend on both sides of the tunnel axis is mainly manifested as the indented displacement towards the central axis of the tunnel. Due to the constraints outside the tunnel excavation boundary, the horizontal intrusion displacement mainly occurs within the range of 1 * the hole diameter of the tunnel face. The horizontal intrusion displacement outside the main influence area of the tunnel perimeter is only 20%–30% of the maximum horizontal intrusion displacement in the central area, and the intrusion displacement gradually becomes negligible outside the area where the radial distance from the tunnel axis is greater than 1.5D.
For horizontal displacement, first the Z value of each marker after loading excavation and the Z value before excavation are treated as the same constant value. Then, the X values of both are compared to find the marker point’s horizontal displacement vector.
Figure 9 shows that the horizontal displacement mainly occurs on the left and right sides of the tunnel, and that the two sides are basically symmetrically distributed. The main influence range of the horizontal displacement is in an “inverted wedge” distribution as a whole, and the horizontal movement of excavation face o1 and excavation face 2 decreases from the two sides of the tunnel axis, from the proximal end to the distal end. Affected by the coincidence of the horizontal stress on both sides of the axis, the horizontal stress on both sides of the axis gradually increases along the outside of the axis and reaches a state of equilibrium near the axis.
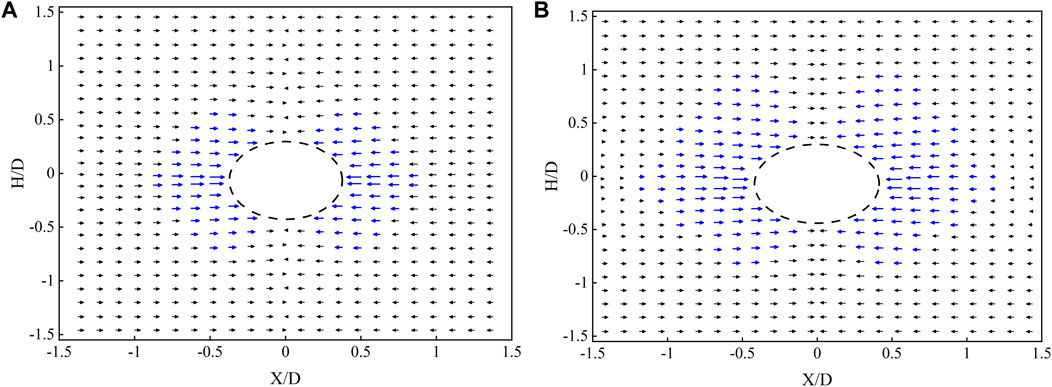
FIGURE 9. Displacement vector comparison of horizontal influence range: (A) Horizontal displacement vector diagram of face 1. (B) Horizontal displacement vector diagram of face 2.
Similarly, the influence range of excavation face 2 is obviously larger than that of excavation face 1, and the influence range is about 1.5 times that of excavation face 2. The influence area of the excavation face is mainly concentrated in the four floors outside the side of the tunnel, which is about 30 mm from the side of the tunnel, or 0.5 times the diameter of the tunnel, and the main influence area below the bottom of the tunnel accounts for about 4/5 of the area above the top of the tunnel. The influence range of the excavation face 2 is 6 floors outside the side of the tunnel, 45 mm away from the side of the tunnel, or 0.75 times the diameter of the tunnel. The main influence range above the top of the tunnel is about 1.67 times that below the bottom of the tunnel. Under the impact of horizontal load, the vertical settlement of soil at the tunnel’s waistline becomes horizontal displacement.
The excavation faces are located at 1/3 and 2/3 to obtain the X+Y overall shear strain vector distribution. The X and Z values in the 3D coordinates of the markers were extracted by scanning. The X and Z value coordinate points after loading excavation were compared with the X and Z value coordinate points before excavation in terms of position, and the 2D displacement vector and the main disturbance zone were depicted on the cross section. The main influence areas of both are shown in Figure 10. The main influence range of displacement and settlement of excavation face 1 and excavation face 2 is elliptical distribution, and the settlement range on the top of the cave is slightly larger than the displacement at the bottom of the cave. In Figure 10A., the deformation around the hole on the first excavation face occurs within one to two radii around the tunnel, and in Figure 10B., the deformation on the second excavation face occurs within two to three radii around the tunnel. The specific numerical value of the displacement influence range in each direction is basically the same as the vertical settlement and horizontal displacement data described above. The specific range value will not be repeated.
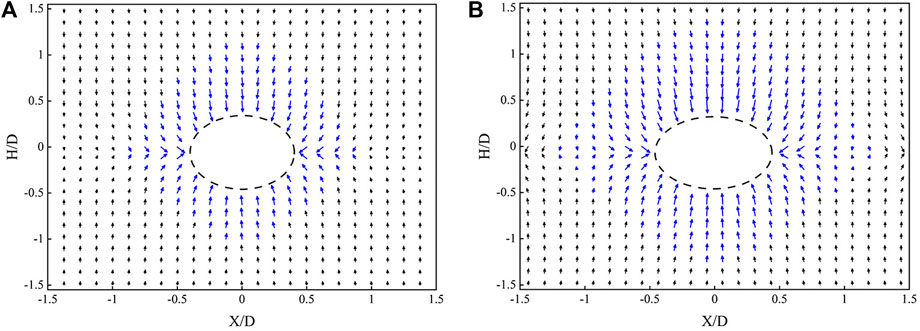
FIGURE 10. Displacement vector comparison of two-dimensional influence range in plane: (A) Displacement vector diagram of plane 1 X+Z, (B) Displacement vector diagram of plane 2 X+Z.
The range of tunnel settlement and uplift is much larger than the displacement range of the sidewall convergence, and the horizontal movement is relatively smaller than the vertical movement. Tunnel excavation is the main cause of stratum subsidence. After the excavation is completed, the overall tunnel is in the form of upper part sinking、 lower part uplifting, and both sides shrinking. Due to the different stress states of the soil around the cutter head, the spatial displacements of soil elements are different under the same nodal stress. Affected by the stress difference of overexcavation effect, the displacement moves to the direction of the hole with large stress difference. Under the action of different uniform loads, the tunnel’s overall deformation shows a non-uniform convergence elliptical non-equivalent radial movement deformation trend.
Figure 11 shows the vertical displacement response curves of the marked points in the soil layer at different buried depths on the excavation face 1 and the excavation face 2. The results show that the vertical displacement and settlement curves of soil bodies with different buried depths up and down the central axis of the tunnel under the principal stress load show a normal distribution (Gaussian function curve) along the horizontal direction of the stratum, which can be expressed by Eq. 5 (Wei et al., 2006). The vertical strata subsidence data in the Figure match the “modified Loganathan” formula; the measured data agrees well with the modified Loganathan formula calculation results; the analytical solution is smaller than the width of the ground subsidence trough monitored in this paper; and the maximum calculated displacement of the soil is greater than the monitoring mark deformation.
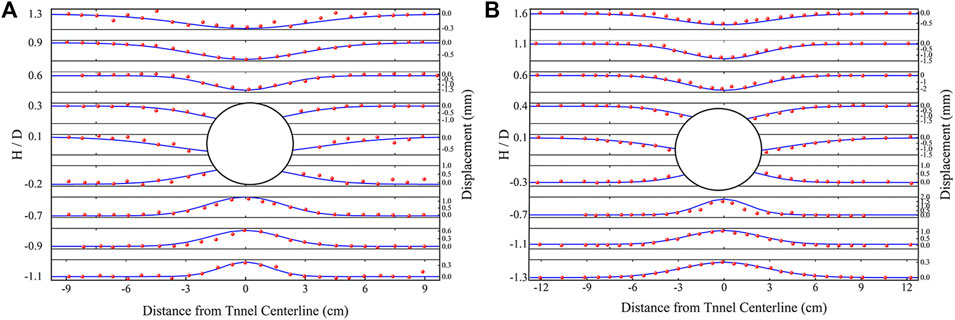
FIGURE 11. Vertical monitoring displacement curve of formation: (A) Vertical displacement curve of face 1, (B) Vertical displacement curve of face 2.
Under both geological conditions, the maximum displacement of surrounding rock occurs at the top and bottom of the tunnel. The vertical displacement of a hole roof on the excavation face is 0.6–1.3 d, decreasing successively from the maximum 1.5 mm–0.8 mm and 0.3 mm; the hole bottom 0.7–1.1 d vertical displacement of 1, 0.6, and 0.3 mm. When the X value between the top and bottom of the tunnel is equal, the maximum displacement values from top to bottom are 0.7, 0.4, and 0.5 mm, respectively. The vertical displacement decreases linearly as the top and bottom of the tunnel approach the axis.
The excavation face 2 and the excavation face 1 show the same trend of change, but the response range and response value are larger than the overall response range. Among them, the 0.6, 1.1, and 1.6D settlements above the top of the cave are 2, 1.2, and 0.5 mm; the 0.7, 1, and 1.3D displacements below the bottom of the cave are 1.7, 0.9, and 0.3 mm, respectively; and the maximum vertical direction of the monitoring point between the top and bottom of the cave is 1, 0.6, and 0.8 mm, respectively. The smallest amount of movement is up and down the axis, which is centered on the change from horizontal to maximum movement.
(1) Soil vertical displacement calculation formula
Where
(2) Soil horizontal displacement calculation formula:
Figure 12 shows the horizontal movement curve of soil. The displacements on both sides of the tunnel are symmetrically distributed, and the measured data are in good agreement with the modified Loganathan formula as a whole. The horizontal displacement measured in the upper section of the axis is smaller than the calculated horizontal displacement, and the difference between the calculated value and the measured value in the section below the axis is small. This is because the modified Loganathan formula is based on the idea of an ideal elastic-plastic homogeneous soil layer. However, the laboratory soil will always have stress concentrations under rigid construction loading, and the real stress distribution in the soil layer is fairly complicated, so there may be errors in the calculation results and experimental data.
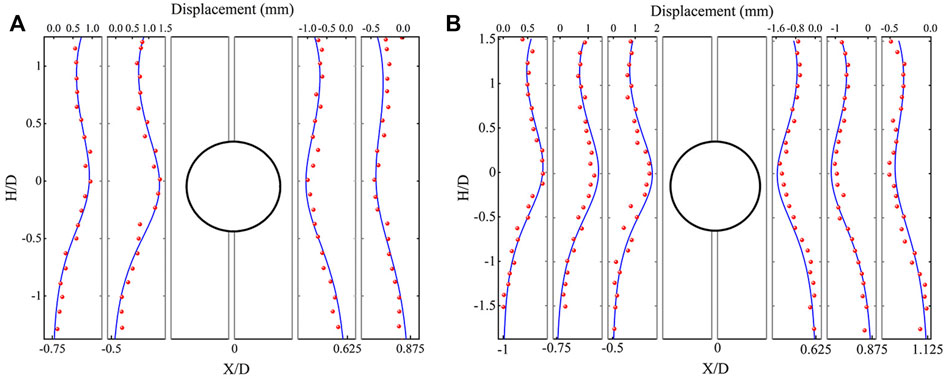
FIGURE 12. Horizontal monitoring displacement curve of formation: (A) Horizontal displacement curve of plane 1, (B) Horizontal displacement curve of plane 2.
Figure 12A shows the horizontal displacement of a tunnel from 0.5D to 0.875D on the excavation face 1. The horizontal displacement gradually decreases with the increase of the axial extension of the tunnel, until the value beyond the minimum displacement tends to be stable, with a maximum horizontal displacement of 1.5 mm and a minimum of 0.5 mm. Figure 12B shows the data and fitting curve of the horizontal displacement monitoring points at 0.5D to 1.125D around the second hole on the excavation face. The maximum horizontal displacement at the edge of the hole is 2 mm, and the minimum horizontal displacement at 1.125D at the outer edge is 0.5 mm. The overall horizontal displacement of excavation face 1 is smaller than that of excavation face 2. The influence range of horizontal displacement of excavation face 1 is extended by about 1/3D, and the extension of excavation face 2 is about 1/2D.
When calculating the displacement of soil due to loading or unloading, it is mainly assumed that the soil is an ideal linear elastic body. This assumption is often not in line with the soil properties, especially for soft soils, and even results in erroneous calculations. Some scholars have derived a two-dimensional analytical model considering the influence of soil viscoelasticity. However, tunnel excavation is a three-dimensional dynamic evolution process, which exhibits soil disturbance caused by excavation and soil displacement caused by additional force with time. Therefore, the study of the three-dimensional displacement model of the excavation face is of great significance to accurately understanding and predicting the disturbance and displacement trend of surrounding rock caused by construction.
The specific 3D coordinate X, Y, and Z values of the marker are extracted by scanning, and the 3D coordinate values of the marker after loading excavation are compared with the coordinate values before excavation to construct a 3D deformation trajectory of the excavation surface.
Figure 13 shows the excavation faces 1 and 2 and the integrated displacement characteristic faces of the first and second faces, respectively. It is not difficult to imagine that due to the excavation of the soil body, the surrounding soil body is in a state of active Earth pressure and stratum loss occurs on both sides and in the upper and lower areas, resulting in soil movement. In the early stage of tunnel excavation, the excavation disturbance has little effect on the markers buried in the model, and the displacement is in a relatively stable state. As the excavation advances, the cutter head gradually approaches the measuring point, which has an obvious disturbance effect on the surrounding rock, and the displacement value increases significantly.
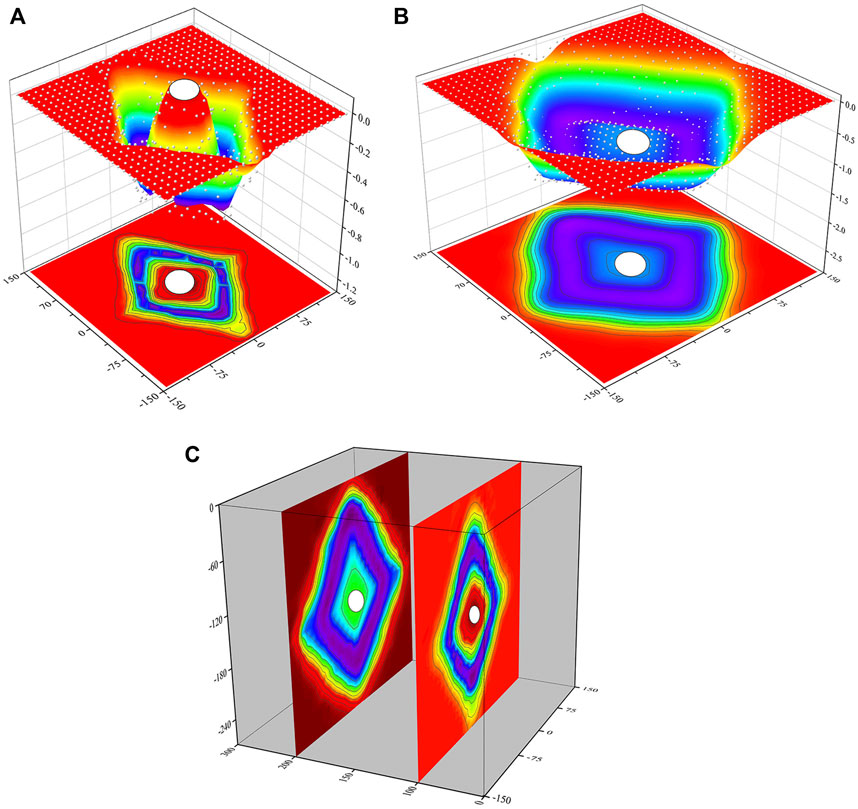
FIGURE 13. Displacement deformation model of excavation face: (A) Displacement deformation model of excavation face 1, (B) Displacement deformation model of excavation face 2, (C) superimposed displacement deformation model.
When the cutter head is excavated to the front of the excavation face measurement point, due to the thrust of the cutter head, the excavation face is displaced along the tunnel excavation direction, which appears as a bulge state on the ground face. When the cutting section of the cutter head approaches the measuring point, the displacement tends to increase due to the circumferential support of the cutter head. The tool head is close to the section of the measuring point, and the stagnation of the tool head causes the emergence of intermittent voids. Under the action of three-way stress, the displacement of surrounding soil in the air direction (X, Y and Z directions) increases sharply, and the face changes from uplift to settlement. Then, as the cutter head keeps moving forward, it finally stops moving and stays stable within a certain range of values.
As shown in Figure 14, the three vertical sections perpendicular to the X-axis direction, that is, the displacement components in the Y-direction, are symmetrically distributed along the X-axis. The displacement deformation mode of excavation face 1 is the same as that of excavation face 2, but the influence range and displacement value are different. The excavation face 1 is at X=0 of the tunnel axis, as shown in Figure 14A, and the top of the tunnel is gradually sunk from 1D to 1.5D. The maximum sag is −0.7 mm; close to the edge of the hole within 0.5D, the maximum protrude to 0 mm. The up and down displacements of the tunnel axis are symmetrically distributed, with a small difference in value. X = 1D, 0.5D to 1.25D within the largest sag range of −0.4 mm; axis at 0.5D within the maximum raised to −0.2 mm. At X = 2D, the whole thing barely deforms.
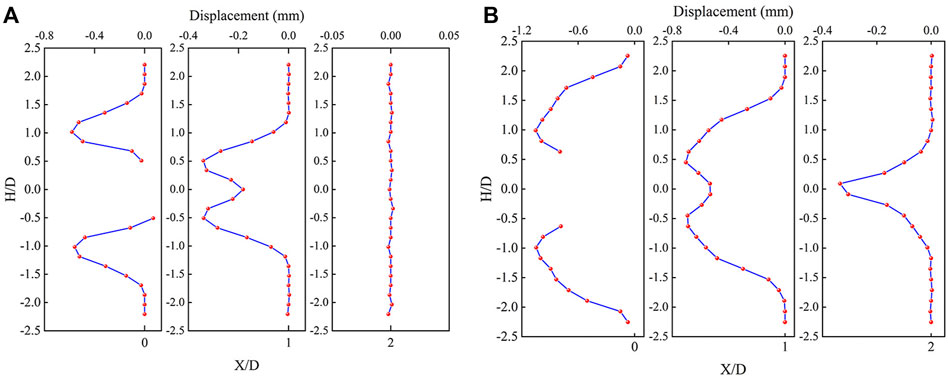
FIGURE 14. Displacement curve of excavation section: (A) Displacement curve of section 1, (B) Displacement curve of section 2.
Figure 14B The excavation face is gradually concave in a quadratic function form between 1D and 2D, and the maximum sag value is −1.1 mm. The largest sag to the hole edge position is deformation gradually reverse protruding, the largest protruding to −0.6 mm. At X=1D, between 0.5D and 1.5D near the axis, the maximum concave value of gradual concave deformation is −0.7 mm; within the range of 0.5D above and below the axis, it gradually protrudes and deforms, and the maximum convexity value is displaced by −0.3 mm. The upward displacement of the tunnel axis is slightly larger than the downward displacement, and the shapes are almost the same. At X = 2D, the overall deformation is concave, and the maximum displacement value is 0.4 mm at the axis.
Due to the disturbance of excavation and unloading, the soil near the excavation face will produce dynamic elastic-plastic deformation along the forward and reverse directions of the excavation face. The deformation of the plastic zone of tunnel excavation is mainly divided into three stages: the depression deformation stage of the working face affected by the propulsion force, the rapid outward convex deformation stage of the tunnel facing the void, and the stable deformation stage. In the early stage of excavation, with the advancement of the cutter head, the soil body is subjected to the continuous thrust and disturbance of the cutter head, and a certain three-dimensional disturbance zone is formed within the range of 0.5 times the diameter in front of the cutter head. Before reaching the monitoring surface, under the thrust of the cutter head, the monitoring surface is mainly deformed along the excavation direction, and the deformation gradually increases to the maximum as the cutter head approaches; During the simulation support period, the surrounding rock with a diameter of about 1 times the diameter around the tunnel rapidly moved plastically toward the reverse excavation direction. After the excavation continued to exceed the monitoring surface, due to the rigid support, the plastic deformation of the surrounding rock of the tunnel gradually tended to be stable, with gradual deformation smoothing to a certain value. Finally, the plastic deformation characteristics of the sag outside the tunnel and the surrounding bulge were observed. The specific deformation is caused by many geological factors, like the kind of soil and where it is.
The internal reason for the deformation of the surrounding rock mass caused by full-face excavation is that the initial stress state of the soil has changed, making the undisturbed soil experience complex stress paths such as extrusion, shearing, and twisting. The disturbance of the surrounding soil is mainly manifested as a change in stress and strain states. When the total thrust of the drill bit is greater than the initial equilibrium stress of the sample, the soil in front of the drill bit is in a state of compression loading, and elastic-plastic deformation occurs. The range of soil affected by extrusion is indicated by the cone in the dotted line in Figure 15. Under the action of thrust, the stress of soil extrusion loading is concentrated, and the soil bodies in ② and ④ areas are subjected to large extrusion deformation. The horizontal and vertical stresses in ② area both increase, and the effect of shear stress is obvious; ④ area concentratedly reflects the extrusion stress. Effect; ③The soil in the area is affected by the cutting friction of the cutter head, and is in a very complex stress state. When the cutter head is in a static state, the total thrust of the drill bit is less than the total equilibrium stress of the sample. At this time, it corresponds to the state of severe over-excavation of the soil, and the stress relaxation of the excavation surface is obvious if the support is not timely. Because the soil in front of the excavation did not apply support in time, the stress of the soil was released, and it slipped to the free surface. Excessive ground stress release on the excavation surface will cause large plastic deformation of the surrounding rock, which will transform from a stable state to an unstable state. After a certain expansion process at the boundary of the plastic zone, the maximum shear stress can gradually decrease due to the confining pressure due to the existence of the plastic zone. After the rigid support is added, the deformation of the surrounding rock is effectively controlled, the sandy soil is in sub-consolidation and creep deformation, and the total stress gradually returns to a relatively balanced state. The specific relationship between surrounding rock deformation and stress state is shown in Table 2.
In this study, a new experimental model of tunnel excavation confining pressure disturbance was used to study the displacement response characteristics of the excavation face in different soils. The real in-situ stress is simulated by the true triaxial loading method, and the three-dimensional displacement and deformation of the excavation face are obtained by using a full-section three-dimensional scanning device. Based on the reconstructed spatial displacement patterns, the impact degree of specific excavation disturbance of different soil masses was evaluated. The following conclusions are drawn:
1 The excavation of the full-section tunnel will cause displacement and deformation of the surrounding strata, and these displacements are mainly vertical and horizontal. The displacement vector is concentrated at the top, bottom, shoulder, waist, and other positions of the tunnel, and the main influence range is within 2 times the diameter of the tunnel extension, which is elliptically distributed on the two-dimensional plane.
2 The tunnel deformation caused by excavation is the combined effect of three basic modes: radial shrinkage, non-uniform elliptical shrinkage, and three-dimensional face deformation. The displacement of the surrounding soil increases with proximity to the tunnel, and the vertical and horizontal displacement curves conform to the modified Loganathan formula.
3 The change process of the excavation face is a deformation pattern that is concave first and then convex. The specific protruding and concave displacements are closely related to the mechanical properties and location of the soil itself. Under the influence of overlapping and crossing strata, the movement characteristics of the face before and after are the same and the displacement amount is different.
4 In the sand model test, the method of arranging measurement markers to establish a grid description, combined with 3D digital image scanning and image analysis methods, is a simple and effective non-contact deformation field measurement method within a certain deformation range. It gives a good way to analyze the local deformation and three-dimensional displacement of the excavation model in a more quantitative way.
The original contributions presented in the study are included in the article/Supplementary Material, further inquiries can be directed to the corresponding author.
EL: conceptualization, investigation, methodology, writing—original draft, writing–review and editing; QG: supervision, funding acquisition; XL: conceptualization, resources, investigation. TM: resources; BZ: investigation.
This work was supported by the National Natural Science Foundation of China (51734009).
The authors declare that the research was conducted in the absence of any commercial or financial relationships that could be construed as a potential conflict of interest.
All claims expressed in this article are solely those of the authors and do not necessarily represent those of their affiliated organizations, or those of the publisher, the editors and the reviewers. Any product that may be evaluated in this article, or claim that may be made by its manufacturer, is not guaranteed or endorsed by the publisher.
Ahmed, M., and Iskander, M. (2011). Analysis of tunneling-induced ground movements using transparent soil models. J. Geotech. Geoenviron. Eng. 137 (5), 525–535. doi:10.1061/(asce)gt.1943-5606.0000456
Attewell, P. B., Yeates, J., and Selby, A. R. (1986). Soil movements induced by tunnelling and their effects on pipelines and structures. London: Blackie and Son Ltd, 10–50.
Berthoz, N., Branque, D., Subrin, D., Wong, H., and Humbert, E. (2012). Face failure in homogeneous and stratified soft ground: Theoretical and experimental approaches on 1g EPBS reduced scale model. Tunn. Undergr. Space Technol. 30, 25–37. doi:10.1016/j.tust.2012.01.005
Berthoz, N., Branque, D., Wong, H., and Subrin, D. (2018). TBM soft ground interaction: Experimental study on a 1 g reduced-scale EPBS model. Tunn. Undergr. Space Technol. 72, 189–209. doi:10.1016/j.tust.2017.11.022
Cao, L., Zhang, D., and Fang, Q. (2020). Semi-analytical prediction for tunnelling-induced ground movements in multi-layered clayey soils. Tunn. Undergr. Space Technol. 102, 103446. doi:10.1016/j.tust.2020.103446
Chen, R., Yin, X., Tang, L., and Chen, Y. (2018). Centrifugal model tests on face failure of Earth pressure balance shield induced by steady state seepage in saturated sandy silt ground. Tunn. Undergr. Space Technol. 81, 315–325. doi:10.1016/j.tust.2018.06.031
Cheng, H., Chen, J., and Chen, G. (2019). Analysis of ground surface settlement induced by a large EPB shield tunnelling: A case study in beijing, China. Environ. Earth Sci. 78 (20), 605. doi:10.1007/s12665-019-8620-6
Grant, R. J., and Taylor, R. N. (2000). “Tunnelling-induced ground movements in clay,” in Proceedings of the institution of civil engineers - geotechnical engineering.
Hagiwara, T., Grant, R. J., Calvello, M., and Taylor, R. N. (1999). The effect of overlying strata on the distribution of ground movements induced by tunnelling in clay. Soils Found. 39 (3), 63–73. doi:10.3208/sandf.39.3_63
Jiang, Q., Fan, Y., Feng, X., Li, Y., Pei, S., and Liu, G. (2017). Unloading break of hard rock under high geo-stress condition:inner cracking observation for the basalt in the Baihetan¢s underground powerhouse. Chin. J. Rock Mech. Eng. 36 (05), 1076–1087. doi:10.13722/j.cnki.jrme.2016.1112
Jiang, Q., Feng, X., Li, S., Su, G., and Xiao, Y. (2019). Cracking-restraint design method for large underground caverns with hard rock under high geostress condition and its practical application. Chin. J. Rock Mech. Eng. 38 (06), 1081–1101. doi:10.13722/j.cnki.jrme.2018.1147
Li, H., and Ma, X. (2011). “Analysis of settlement caused by TBM construction in sand formations in Beijing,” in Icptt 2011: Sustainable solutions for water, sewer, gas, and oil pipelines, 1884–1896.
Litwiniszyn, J. (1957). “The theories and model research of movements of ground masses,” in Proceedings of the European congress on ground movement (Leeds, United Kingdom: University of leeds), 203–209.
Loganathan, N., and Poulos, H. G. (1998). Analytical prediction for tunneling-induced ground movements in clays. J. Geotech. Geoenviron. Eng. 124 (9), 846–856. doi:10.1061/(asce)1090-0241(1998)124:9(846)
Loganathan, N., Poulos, H. G., and Stewart, D. P. (2000). Centrifuge model testing of tunnelling-induced ground and pile deformations. Géotechnique 50 (3), 283–294. doi:10.1680/geot.2000.50.3.283
Mair, R. J. (2008). Tunnelling and geotechnics: New horizons. Geotechnique 58 (9), 695–736. doi:10.1680/geot.2008.58.9.695
Mair, R., Taylor, R., and Bracegirdle, A. J. G. (1993). Subsurface settlement profiles above tunnels in clays. Geotechnique 43 (2), 315–320. doi:10.1680/geot.1993.43.2.315
Marshall, A. M., Farrell, R., Klar, A., and Mair, R. (2012). Tunnels in sands: The effect of size, depth and volume loss on greenfield displacements. Géotechnique 62 (5), 385–399. doi:10.1680/geot.10.P.047
Meguid, M. A., Saada, O., Nunes, M. A., and Mattar, J. (2008). Physical modeling of tunnels in soft ground: A review. Tunn. Undergr. Space Technol. 23 (2), 185–198. doi:10.1016/j.tust.2007.02.003
Mollon, G., Dias, D., and Soubra, A.-H. (2012). Probabilistic analyses of tunneling-induced ground movements. Acta Geotech. 8 (2), 181–199. doi:10.1007/s11440-012-0182-7
Nomoto, T., Imamura, S., Hagiwara, T., Kusakabe, O., and Fujii, N. (1999). Shield tunnel construction in centrifuge. J. Geotech. Geoenviron. Eng. 125 (4), 289–300. doi:10.1061/(asce)1090-0241(1999)125:4(289)
Park, K.-H. (2005). Analytical solution for tunnelling-induced ground movement in clays. Tunn. Undergr. Space Technol. 20 (3), 249–261. doi:10.1016/j.tust.2004.08.009
Peck, R. B. (1969). Deep excavations and tunneling in soft ground, 7th Int. Conf. on SMFE, Mexico City: State of the Art Volume, 225–290.
Pinto, F., and Whittle, A. J. (2014). Ground movements due to shallow tunnels in soft ground. I: Analytical solutions. J. Geotech. Geoenviron. Eng. 140 (4). doi:10.1061/(asce)gt.1943-5606.0000948
Pinto, F., Zymnis, D. M., and Whittle, A. J. (2014). Ground movements due to shallow tunnels in soft ground. II: Analytical interpretation and prediction. J. Geotech. Geoenviron. Eng. 140 (4). doi:10.1061/(asce)gt.1943-5606.0000947
Sagaseta, C. (1987). Analysis of undrained soil deformation due to ground loss. Géotechnique 37 (3), 301–320. doi:10.1680/geot.1987.37.3.301
Song, G., and Marshall, A. M. (2020). Centrifuge modelling of tunnelling induced ground displacements: Pressure and displacement control tunnels. Tunn. Undergr. Space Technol. 103, 103461. doi:10.1016/j.tust.2020.103461
Verruijt, A., and Booker, J. R. (1998). Surface settlements due to deformation of a tunnel in an elastic half plane. Géotechnique 48 (5), 709–713. doi:10.1680/geot.1998.48.5.709
Verruijt, A. (1998). Deformations of an elastic half plane with a circular cavity. Int. J. Solids Struct. 35 (21), 2795–2804. doi:10.1016/s0020-7683(97)00194-7
Wei, G., Wei, X., Gong, C., and Ding, Z. (2006). Study on calculation for shield tunneling-induced ground movements in clays. Rock Soil Mech. (06), 995–999. doi:10.16285/j.rsm.2006.06.030
Yang, G., Zhang, C., Min, B., and Chen, W. (2021). Complex variable solution for tunneling-induced ground deformation considering the gravity effect and a cavern in the strata. Comput. Geotech. 135, 104154. doi:10.1016/j.compgeo.2021.104154
Yang, H., Liu, F., and Lin, S. (2019). Investigation on the 3D ground settlement induced by shallow tunneling considering the effects of buildings. KSCE J. Civ. Eng. 24 (2), 365–376. doi:10.1007/s12205-019-2201-9
Yang, X. L., and Wang, J. M. (2011). Ground movement prediction for tunnels using simplified procedure. Tunn. Undergr. Space Technol. 26 (3), 462–471. doi:10.1016/j.tust.2011.01.002
Yoshikoshi, W., Watanabe, O., and Takagi, N. (1978). Prediction of ground settlements associated with shield tunnelling. Soils Found. 18 (4), 47–59. doi:10.3208/sandf1972.18.4_47
Yuan, W., Fu, H., Zhang, J., and Huang, Z. (2018). Analytical prediction for tunneling-induced ground movements with modified deformation pattern. Int. J. Geomech. 18 (6). doi:10.1061/(asce)gm.1943-5622.0001156
Keywords: full-section tunnel, true triaxial loading, model test, stratum deformation, displacement vector, excavation face displacement model
Citation: Li E, Gao Q, Li X, Mao T and Zheng B (2023) Displacement response characteristics of different sand tunnel excavation faces under true triaxial loading. Front. Earth Sci. 10:1022719. doi: 10.3389/feart.2022.1022719
Received: 18 August 2022; Accepted: 22 November 2022;
Published: 06 January 2023.
Edited by:
Wenzhuo Cao, Imperial College London, United KingdomReviewed by:
Lu Jun, Shenzhen University, ChinaCopyright © 2023 Li, Gao, Li, Mao and Zheng. This is an open-access article distributed under the terms of the Creative Commons Attribution License (CC BY). The use, distribution or reproduction in other forums is permitted, provided the original author(s) and the copyright owner(s) are credited and that the original publication in this journal is cited, in accordance with accepted academic practice. No use, distribution or reproduction is permitted which does not comply with these terms.
*Correspondence: Erchao Li, YnF0MTgwMDYwNDAyOUBzdHVkZW50LmN1bXRiLmVkdS5jbg==
Disclaimer: All claims expressed in this article are solely those of the authors and do not necessarily represent those of their affiliated organizations, or those of the publisher, the editors and the reviewers. Any product that may be evaluated in this article or claim that may be made by its manufacturer is not guaranteed or endorsed by the publisher.
Research integrity at Frontiers

Learn more about the work of our research integrity team to safeguard the quality of each article we publish.