 Jingjing Dai
 Tingyue Liu
 Yuanyi Zhao3
 Chuanyong Ye
95% of researchers rate our articles as excellent or good
Learn more about the work of our research integrity team to safeguard the quality of each article we publish.
Find out more
ORIGINAL RESEARCH article
Front. Earth Sci. , 05 January 2023
Sec. Structural Geology and Tectonics
Volume 10 - 2022 | https://doi.org/10.3389/feart.2022.1022280
This article is part of the Research Topic Sichuan-Tibet Traffic Corridor: Fundamental Geological Investigations and Resource Endowment View all 11 articles
The Zabuye Salt Lake in Tibet, China is the only salt lake in the world that contains natural crystalline lithium carbonate. The grade and spatial distribution of mineral resources are of great importance to the development and utilization of salt lake mineral resources. The use of remote sensing technology for salt lakes observations can overcome the disadvantages of traditional station observations, such as spatial discontinuity, high time consumption, and high labor costs. In addition, machine learning algorithms can efficiently analyze the information from remote sensing data. In this study, Landsat-8 remote sensing image data and the Light Gradient Boosting Machine (LightGBM) algorithm were used to perform inversions of the depth, salinity, and lithium concentration of the Zabuye Salt Lake. Moreover, the water volume, total salinity, and total lithium content of Zabuye Salt Lake in 2000 and 2017 were estimated, and the distribution of mineral resources and changes during the study period were analyzed. The results show that the water depth and volume of the entire lake increased sharply in 2017, resulting in a decrease in salinity and lithium concentration in the lake. Due to the inflow from the surrounding dry salterns, the South Lake experienced a relatively small change. Furthermore, the amount of lithium resources in North Lake decreased significantly in 2017 compared to 2000, possibly due to higher temperatures during the month of observation, which led to precipitation of lithium carbonate. Our study proves the feasibility and accuracy of the LightGBM machine learning algorithm for rapid inversion of salt lakes, which provides technical insight into remote sensing inversion of other mineral resources in salt lakes. Thus, the development of remote sensing technology in recent years can provide increasingly detailed assessments of salt lake resources in the future.
The Tibetan Plateau is one of the four concentrated distribution areas of salt lakes in China. The salt lakes on the Tibetan Plateau are rich in potassium salt, lithium chloride, boron, and other mineral resources, and have high economic value (Lu et al., 2016; Yang et al., 2017; Lei, 2019). The Zabuye Salt Lake in Tibet has the second highest lithium grade followed Chile’s Atacama Salt Lake in the world (Zheng et al., 2004). In particular, it is the only salt lake in the world with naturally occurring crystalline lithium carbonate (Zheng and Liu., 1987). With a high lithium to magnesium ratio, it is easy to form natural lithium carbonate deposits with high purity (Luo and Zheng, 2004). In recent years, the Zabuye Salt Lake Company has mainly mined and developed lithium resources, with an annual production capacity of about 5,000 tons and a gross profit margin of about 29%.
Since 1990, the Zabuye Salt Lake has shown a dramatic expansion trend, and this change will not only have an impact on the surrounding grasslands and salt pans, but also affect the salinity and lithium concentration in the brine during the salt lake development. However, the degree and scale of the impact is still unclear. Continuous observation of the Zabuye Salt Lake has been conducted by the Salt Lake Research Team of the Chinese Academy of Geological Sciences during the past 40 years, which has provided a large amount of meteorological, hydrological, and hydrochemical data (Qi and Zheng, 2006a, 2006b; Kong et al., 2017). However, there are some limitations to the observational data. While temporal continuity can be easily achieved, it is difficult to achieve spatial continuity of the data.
Remote sensing technology can be used to observe salt lakes from a macro perspective. It not only provides the spatial distribution of objects at different times, but also can reduce the required labor, material, and financial resources (Letey et al., 2011; Zhang et al., 2013; Pan et al., 2015; Liu et al., 2018; Fan et al., 2021). Therefore, remote sensing technology is an important tool for monitoring salt lakes. The most important parameters for remote sensing monitoring are chlorophyll concentration, suspended solids content, dissolved organic matter, water temperature, and water depth (Forget et al., 1999; Zhang et al., 2009; Zhang et al., 2010; Shi et al., 2011; Siswanto et al., 2011; Xi and Zhang, 2011; Zhu et al., 2011; Figueiredo et al., 2016; Cao et al., 2021), but there are relatively few studies on remote sensing inversion of mineral resources in salt lakes. Because the composition of the water of salt lakes is quite different from that of conventional freshwater lakes, it is difficult to transfer existing remote sensing results from freshwater lakes to salt lakes. Similarly, there are few studies on the spectra of the various mineral concentrations of brines in salt lakes (Yan and Zheng, 2015).
In addition, existing remote sensing inversion methods for salinity and lithium concentration in salt lakes generally use empirical inversion methods, such as principal component analysis, linear regression models, and multiple linear regression models (Su et al., 2008). However, the applied models usually have simple calculations and low inversion accuracy (Lyzenga, 1978). In recent years, machine learning algorithms have been increasingly used for inversion in remote sensing. Numerous studies have shown that machine learning algorithms have higher accuracy than traditional linear regression methods (Rogan et al., 2003; Larya et al., 2016; Rouet-Leduc et al., 2017; Maxwell et al., 2018). Machine learning algorithms currently used in salt lake research primarily include Back Propagation (BP) neural networks and Random Forest (RF) (Zhou et al., 2016; Wang, 2019). Light Gradient Boosting Machine (LightGBM) is an improved product based on RF, Extreme Gradient Boosting (XGBoost) and other algorithms. It is a new decision tree method proposed by Google in recent years (Xie et al., 2019; Pan et al., 2021). So far, it has not been used in salt lake research. However, in a few applications in other fields (Zhou et al., 2016; Xie et al., 2019; Song, 2021; Pan et al., 2021), its application results are better than those of traditional BP neural network, RF, Support Vector Machine (SVM) algorithms and other methods, with higher accuracy and running speed.
In this study, we used the LightGBM algorithm to perform an inversion of the depth, salinity, and lithium concentration of Zabuye Salt Lake from 2000 to 2017, to estimate the water volume, total salinity, and total lithium content. Based on these results, we analyzed the spatial distribution and changes of the mineral resources in the salt lake, which provided technical support for remote sensing inversion of other mineral resources in the salt lakes.
Zabuye Salt Lake is located in the hinterland of the Tibetan Plateau at the northern foot of the western Gangdise Mountains. Its geographical coordinates are 83°57′10″–84°15′08″ E and 31°27′10″– 31°34′30″ N. The salt lake is divided into the South lake and the North lake. The South Lake is a solid-liquid lake with a depth of less than 1 m, while the North Lake is a brine lake with a depth of about 2 m. The South Lake has been under industrial development for the production of lithium carbonate since 2003.
The climate is characterized by low temperatures, large temperature differences, strong radiation, low precipitation, and high evaporation (Qi and Zheng, 2006b). Moreover, the annual precipitation is only 192 mm, but the annual evaporation can reach 2,269 mm. The lake is replenished by river water, atmospheric precipitation, and groundwater (Tian et al., 2005; Qi and Zheng, 2006a; Xu et al., 2017), and the water system around the lake is relatively well developed. The LangmeGaqu, Luojuzangbo, Sangmujiuqu, Jiabuqu, and Quanshui rivers are the main rivers in this region. Other springs are mainly located on the travertine island in the middle of the lake and on the Qiulinanmu in the northern part of the lake. These rivers and springs contain various mineral resources, such as lithium and boron. The main exposed strata in this area are Carboniferous, Permian, Cretaceous, Paleogene, Neogene, and Quaternary (Figure 1A). Lithium and boron in river water are mainly derived from Quaternary sediments, surface weathering, and subsurface rocks. Lithium in spring water is mainly from surrounding rocks in contact with deep circulating groundwater (Liu et al., 2007). Due to the strong evaporation, the lithium concentration of Zabuye Salt Lake, which is greater than 1 g/L, can form a natural lithium carbonate deposit favourable for lithium extraction.
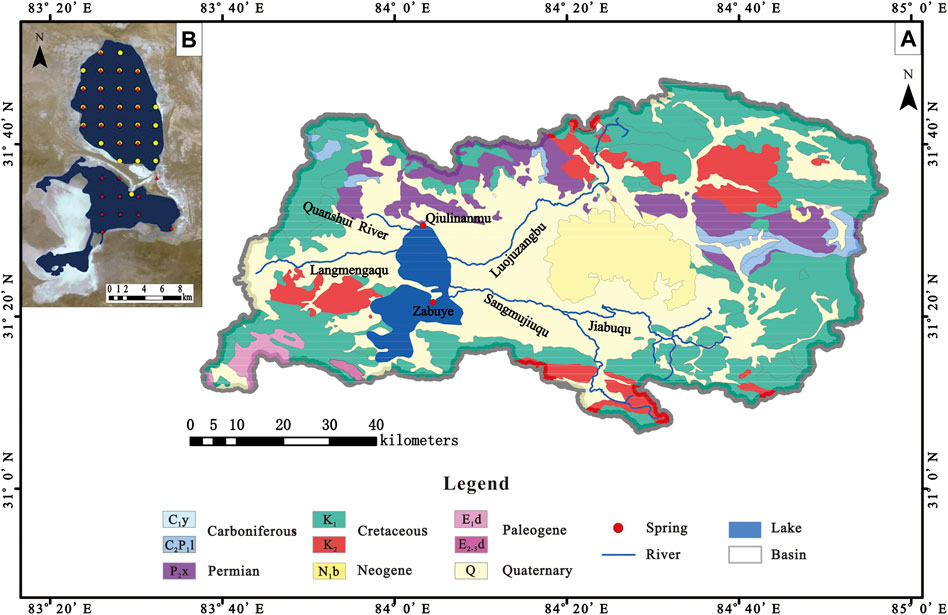
FIGURE 1. (A) Geological map of the Zabuye watershed. (B) Distribution map of sampling points (The red points are in 2000, and the yellow points are in 2017).
In our study, there are two periods with measurement data: January 2000 and August 2017. The 2017 measurement data were provided by the Zabuye Salt Lake Field Observatory of the Chinese Academy of Geological Sciences, and the 2000 data were obtained from the literature (Tian et al., 2005; Tian et al., 2006). These data include the latitude and longitude coordinates, water depth, salinity, and lithium concentration of each sampling site. A distribution map of the sampling sites is shown in Figure 1B. Sampling sites were selected according to the Geological Exploration Standard of Saline Lake and Salt Minerals, and arranged in a 2 km × 2 km grid. However, the sampling data for the different study periods were slightly different. The 2000 data were relatively complete and covered the entire lake, while most of the 2017 data were from the North Lake, and only one measured data was from the South Lake. Then the data of the North and South Lake in 2000, the North Lake in 2017 were used as model training data in the inversion, and the data of the South Lake in 2017 were used for validation.
The image data in the study are Landsat data with a medium resolution of 30 m. The Landsat data provide data in the spectral range from visible near infrared to thermal infrared (Yagmur et al., 2021) (Table 1). In this study, Landsat seven and eight data from visible to shortwave infrared were used to perform the remote sensing inversion, including bule, green, red, near-infrared (NIR), short-wave infrared1 (SWIR1), short-wave infrared2 (SWIR2) and panchromatic bands. Landsat 7 data with the scene-number LE07_L1TP_142038_20000215_20170213_01_T1 in 2000 and Landsat 8 data with the scene-number LC08_L1TP_143038_20170823_20170912_01_T1 in 2017 were selected. The acquisition times of these images were found to be essentially the same as the sampling time of the measured data.
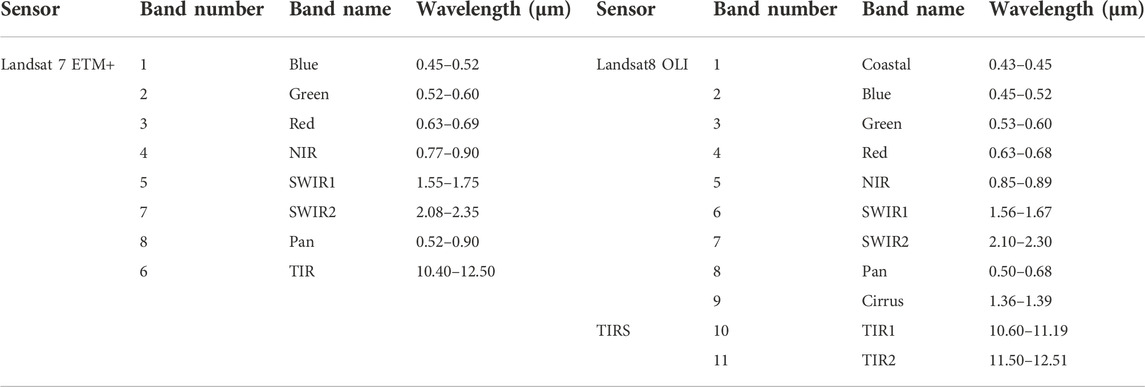
TABLE 1. Landsat 7/8 image data band setting.
Radiometric calibration and atmospheric correction were performed prior to remote sensing inversion to correct for radiation distortion during image acquisition and to obtain the reflectance from remote sensing imagery (Lu et al., 2019).
In this study, we examined the spectra of different water depths, salinity, and lithium concentration, trained a LightGBM regression model, and determined the relationship between radiation data and measured values to predict and retrieve the water depth, salinity, and lithium concentration of the Zabuye Salt Lake. Since no records were abalibale for South Lake in 2017, two data periods were used to train the LightGBM model to improve its generalizability and obtain accurate water depth, salinity, and lithium concentration data for South Lake in 2017. Finally, using the area volume formul, and mass density volume formula, the total water volume, total salinity and total lithium content of the lake were calculated for each observation period.
Few studies have been made about the spectral measurements of water depth and salinity of salt lakes; therefore, the spectral responses are unclear. For this reason, spectral measurements and analyzes of the salt lake water samples were performed using Analyical Spectral Device (ASD) FieldSpec4 spectrum analyzer. The detection range of the FieldSpec4 covers the visible, near-infrared, and shortwave infrared regions (350–2,500 nm), and the spectral resolution is 3 nm in the near-inferred wavelength region and 8 nm in short wave-inferred wavelength region (MinJee et al., 2022). RS3 software was used to optimize the instrument and analyze the reflectance data.
Water depth measurements were performed as follows: 1) The instrument was set up and the illumination was adjusted to an angle of 45–60° between the light source and the water surface (Tang et al., 2004). The positions of the instrument and the sample remained unchanged during the measurements. 2) We standardized and calibrated the reflectance curve of the sample using a whiteboard. 3) We filled 50, 100, 150, and 200 ml of the salt lake water samples into the beakers. The temperature, light source, and salinity level remained the same, only the water depth was changed. 4) We recorded the reflectance curves of the samples with the ASD spectrum analyzer and performed a comparative analysis. The measurement procedure was similar for different salinity. The water depth and water volume remained the same, and only the salinity was changed.
Landsat satellite imagery has a panchromatic band with higher spatial resolution at a wavelength of 0.52–0.90 μm. Image fusion allows the use of spatial and spectral information, improves the correlation between spectral values and water depth, enhances texture and detail of ground objects, and reduces spatial information redundancy between image components (Dionisio et al., 2017; Vivone et al., 2020). Image fusion was then performed to obtain a high-resolution multispectral image. Research in recent years has shown that the wavelet transform, High Pass Filter (HPF) transform, Gram-Schmidt (GS) transform, and Nearst Neighbor Diffusion (NNDiffuse) transform provide the best results. In this study, these methods were compared and a correlation analysis of the transformed spectral values with water depth, salinity, and lithium content was performed.
Direct sunlight and scattered light received from a body of water is strongly reflected in the red, green, and blue bands, while bodies of water absorb light in the near-infrared (NIR) wavelength. That is, the red, green, and blue bands reflect more solar radiation and contain more information about the water body. Waters with different depths, salinity, and lithium content have differences in the reflectance and absorption characteristics. Correlation analyses and regression fits were performed between the spectral values of the remote sensing images and water depth, salinity, and lithium concentration to determine the optimal inversion band (Li et al., 2013).
The technical route of a salt lake inversion based on LightGBM is shown in Figure 2. It mainly includes three steps: the acquisition of spectral data from the sampling sites, the construction of LightGBM regression model, and the inversion of water depth, salinity, and lithium concentration. The whole experimental process is performed in ArcGIS and JupterNotebook, and the model accuracy is evaluated by the average relative error, root mean square error, and chi-square (R2) (Nhu et al., 2020).
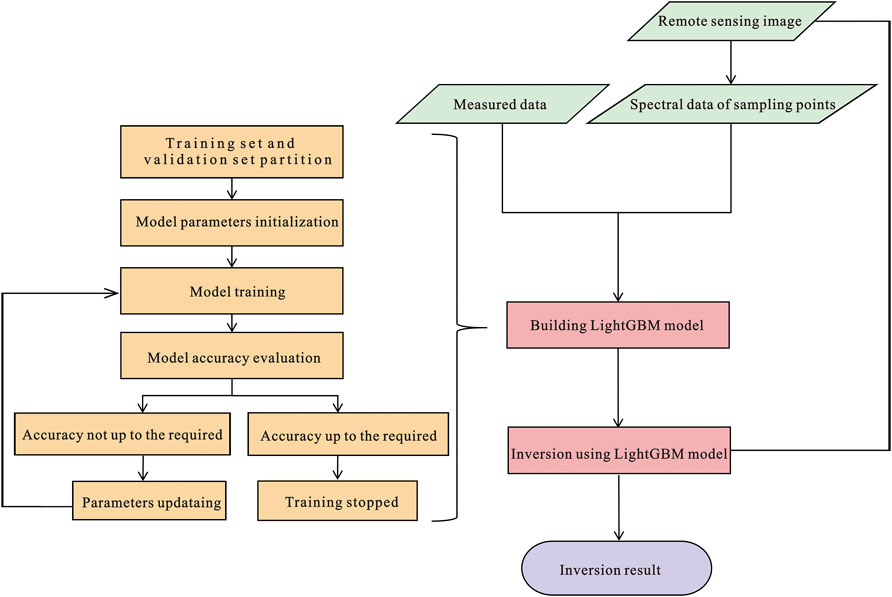
FIGURE 2. Technical flow chart of this study.
The spectral data used in this study were obtained from remote sensing imagery. A mineral spectrum usually contains a set of characteristic absorption bands that were interpreted for each mineral. The vector data of the sample sites were generated according to the latitude and longitude, and the spectrum values of all remote sensing image bands in the same period were extracted into the vector of sampling sies that attributes to form the model training data according to the spatial location (Chen et al., 1995).
LightGBM is a gradient boosting decision tree that widely used for various regression predictions (Duba et al., 2021; Gábor et al., 2022). Multiple decision trees are integrated in LightGBM, which can synthesize the decision results of multiple decision trees and avoid the low accuracy of a single learner. In addition, a histogram-based segmentation algorithm, a leaf growth strategy with depth constraint, a Goss sampling method, and a unique feature binding are used in LightGBM to improve the accuracy and training speed and filter effective data features (Zhang et al., 2019; Li et al., 2021; Song et al., 2021). Therefore, this algorithm is suitable for solving problems related to the complex mapping relationship between the radiation value and lithium concentration caused by the limited number of Landsat remote sensing bands.
The LightGBM regression model is constructed as follows: 1) First, the measured data and spectral data were divided into a training set and a verification set; 2) The parameters of the LightGBM regression model were initialized; 3) The training set was used to train the LightGBM regression model. 4) The verification set was used to evaluate the accuracy of the training model. If the accuracy was not acceptable, the parameters were updated and re-trained. 5) The training was repeated until the accuracy was acceptable or could not be improved, and the regression model was built.
Pixel, the basic unit of a remote sensing image, provides the spectral properties of the brine. Therefore, the basic unit of inversion of water depth, salinity, and lithium concentration is also the pixel. First, the remote sensing image is read in and a format conversion and rearrangement of the data is performed. Each pixel of the remote sensing data is converted into training data and input into the model, i.e., the pixel value of each band is used as a set of spectral data, and the pixel value of each band is used as an inversion feature. Second, the spectral data obtained in the first step are input to the trained LightGBM regression model to invert the value of each pixel point. According to the distribution of the previous spectral data in the spatial dimension of the remote sensing image, the obtained array of values is then inverted and merged into a single band image. Finally, the basic information such as the image coordinate system and the number of rows and columns are specified, and the image in TIFF format is output to obtain the inversion result.
When the water depth, salinity, and lithium concentration data are inverted at each pixel, integrals can be used to calculate the total water volume, salinity, and lithium of the entire lake area, where the entire lake is regarded as a collection of n (n = lake area/pixel area) times of water columns. The height of the water column is the water depth at that point, and the length and width of the water column are equal to the length and width of the pixel. Since the pixel resolution of the Landsat image is 30 m, the length and width of the water column are both 30 m, and the bottom area of the water column is 900 m2.
According to the volume equation, the water depth retrieved by each pixel multiplied by the pixel area is the water volume corresponding to 900 m2 of water. Similarly, the mass of the lake corresponding to each pixel can be determined by the product of water volume and density. Then, the volume of the entire lake area can be determined by a cumulative calculation. Salinity is calculated by the ratio of the mass of salt dissolved in the water to the mass of water, while lithium concentration refers to the mass of lithium ions dissolved in a unit volume of water. Therefore, the salinity of each pixel is the product of the salinity retrieved by the LightGBM and the volume of water in the area, while the lithium content is the product of the lithium concentration retrieved by the LightGBM and the volume of water in the area. The total salinity and lithium content can also be calculated using an accumulation calculation.
The spectra of waters with different depths and salinity shared the water characteristic of high spectral reflctance in blue, green, red, NIR bands and low reflectance in SWIR bands. The most significant difference in the spectra of waters with different depths is their reflectance (Figures 3A,B). As water depth increases, reflectance decreases in all bands. The most significant difference in the spectra of water with different salinity is also the reflectivity, and the regions at 440–1,000 nm are suitable for distinguishing them (Figures 3C,D). The reflectivity increases with increasing salinity. Thus, all bands in the visible light range up to the SWIR can be used to retrieve the water depth.
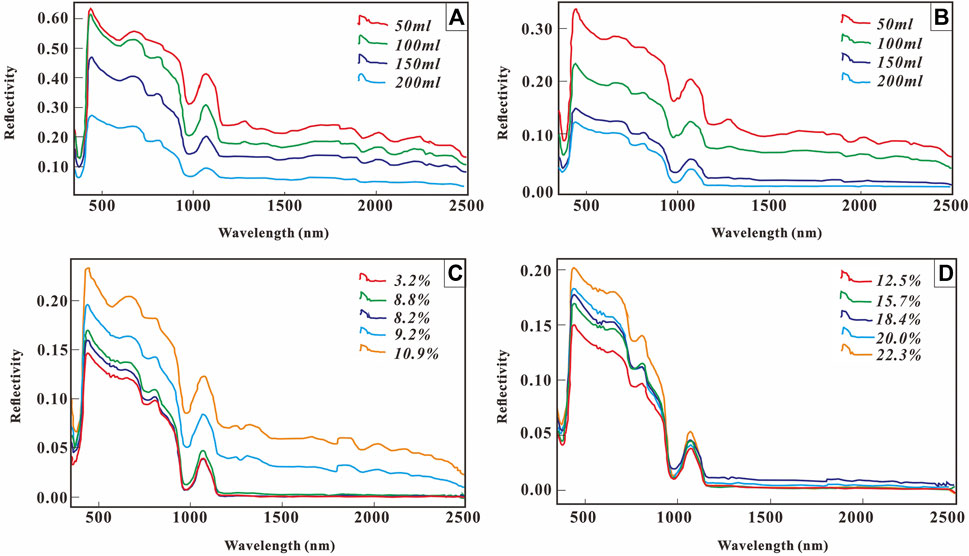
FIGURE 3. Spectral measurement results of the water with different depths and salinities. (A) Measured spectra of water at different depths in the North Lake; (B) Measured spectra of water at different depths in the South Lake; (C) Measured spectra of water at different salinities in the North Lake; (D) Measured spectra of water at different salinities in the South Lake.
The images were fused using the wavelet transform, HPF transform, and NNDiffuse transform and GS transform. The correlation results show that the correlation between the spectral value and the water depth improved significantly after the GS transformation. The highest correlation coefficient (0.956) occurs in the red band (Table 2). These results show that the GS fusion improves the correlation between the spectral value of the image and the water depth, and the fused image data is more suitable for determining the water depth than the original data.
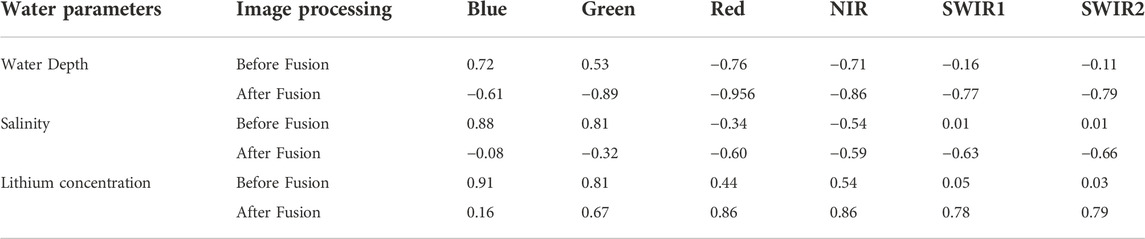
TABLE 2. The correlation between the spectral value and the water depth, salinity and lithium concentration before and after image fusion.
The results of the correlation analysis (Table 2) show weak correlations between the reflectance values of different Landsat bands and salinity, especially in the red and SWIR bands. The panchromatic band show no correlation with salinity, for most of the correlation coefficients are less than 0.1. The GS transformation does not substantially improve the correlation, so the image fusion result was not suitable for salinity inversion, so as for the lithium concentration inversion.
In water depth inversion studies, blue, green, and red bands have been widely used for distinguishing water depth, but the accuracy of using one or two bands is not as high as using multiple bands (Mao et al., 2012). Based on the correlation between salinity and reflectance of individual band, the correlation coefficient between the blue band and salinity is the highest with R2 of 0.88. However, the correlation coefficient between all bands and salinity is 0.90, which is higher than that of the individual bands (Table 3).
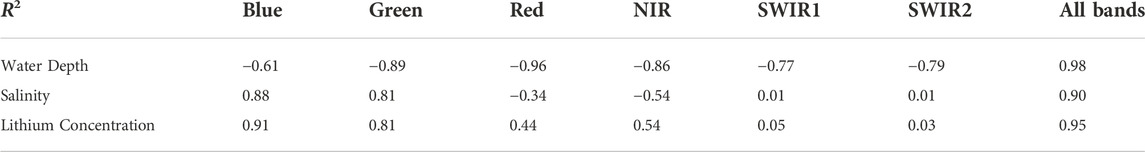
TABLE 3. The correlation between the reflectance of Landsat imagery and the measured spectral value in single band and all bands.
Lithium chloride and lithium carbonate are part of the total salt mineral resources, and their concentrations are closely related to salinity. Based on the correlation between lithium concentration and reflectance at the measured points, the correlation coefficient between all bands and lithium concentration is the highest, with R2 of 0.95 (Table 3).
Due to the time interval between the two image dates is long, the lake and the surrounding environment have changed significantly. Therefore, the spectral values are likely to be very different. It is feasible to use one or two bands to fit the water depth value at one time point, but there are limitations to fitting the measured value at multiple time. The best result of fitting between reflectance and measured water depth is 0.96 for the red band and 0.98 for all bands (Table 3). Using all bands reduces the noise and highlights the effective information. Therefore, it is best to use all bands for inversion.
Linear fitting and three machine learning algorithms including BP neural network, RF, and LightGBM, were compared to determine the water depth, salinity, and lithium concentration. The results are shown in Figure 4 and Table 4. Machine learning algorithms have advantages over linear fitting. All three machine learning methods provide good fitting accuracy, and all points of the test set are close to a straight line, and the true value is close to the predicted value (Figure 4). Moreover, the LightGBM algorithm has the highest accuracy (Table 4). Therefore, the LightGBM algorithm was selected to retrieve the water depth, salinity, and lithium concentration.
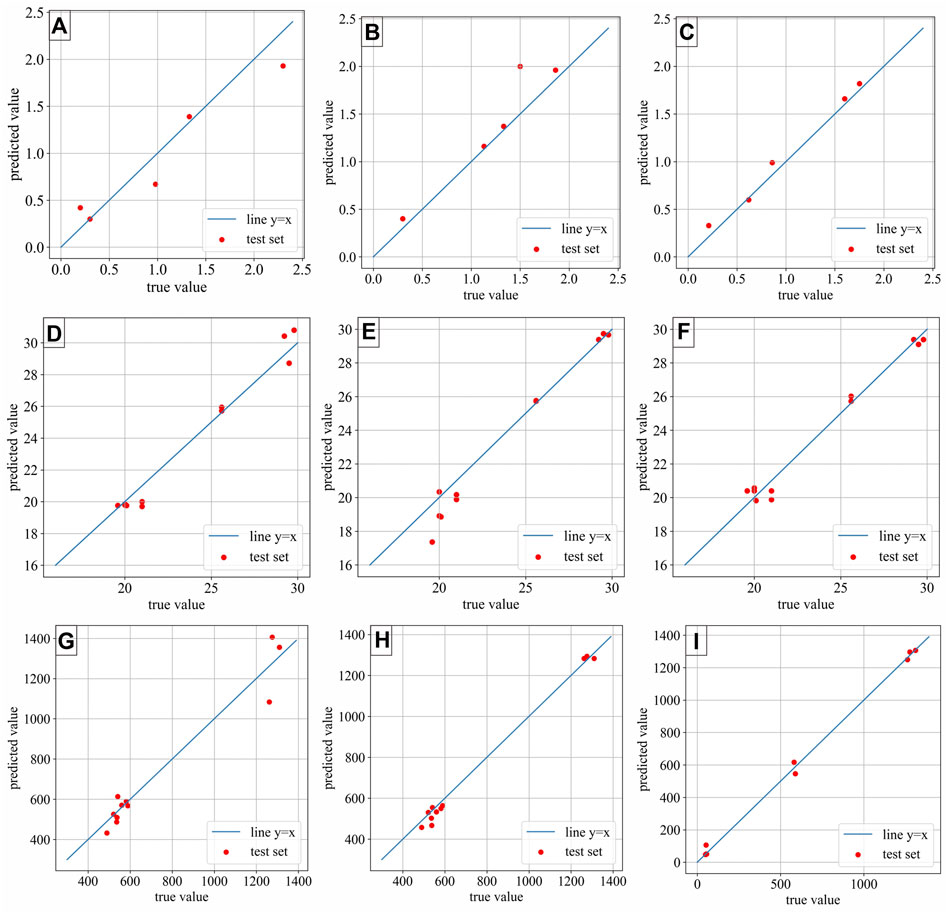
FIGURE 4. Comparison of true and predicted values in the test data set with different machine learning algorithms. (A) Water depth inversion based on BP neural network; (B) Water depth inversion based on Random Forest; (C) Water depth inversion based on LightGBM; (D) Salinity inversion based on BP neural network; (E) Salinity inversion based on Random Forest; (F) Salinity inversion based on LightGBM; (G) Lithium concentration inversion based on BP neural network; (H) Lithium concentration inversion based on Random Forest; (I) Lithium concentration inversion based on LightGBM.
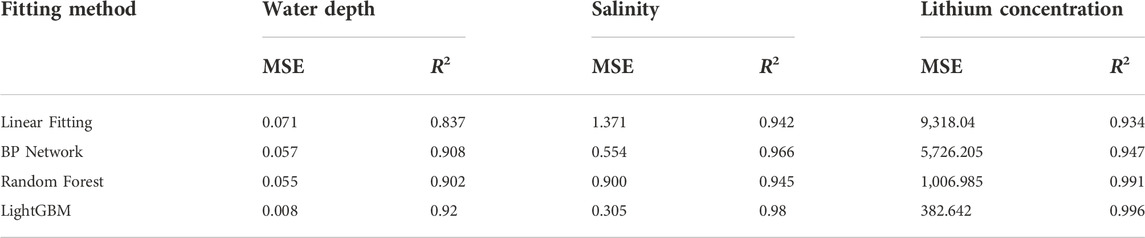
TABLE 4. Fitting results for different methods.
In 2017, the water depth at the South Lake verification point was about 0.3 m. LightGBM predicted a water depth of 0.32 m at this point without the training data of South Lake, which is a good match. The water depth inversion result is shown in Figures 5A,B. This result shows that the machine learning algorithm can accurately predict the water depth using images with different dates. The water depth changes of the North and South Lakes are completely opposite. The water depth of the North Lake in 2017 was more than 1.5 m, which was much higher than in 2000, while the water depth of the South Lake in 2017 was lower than in 2000.
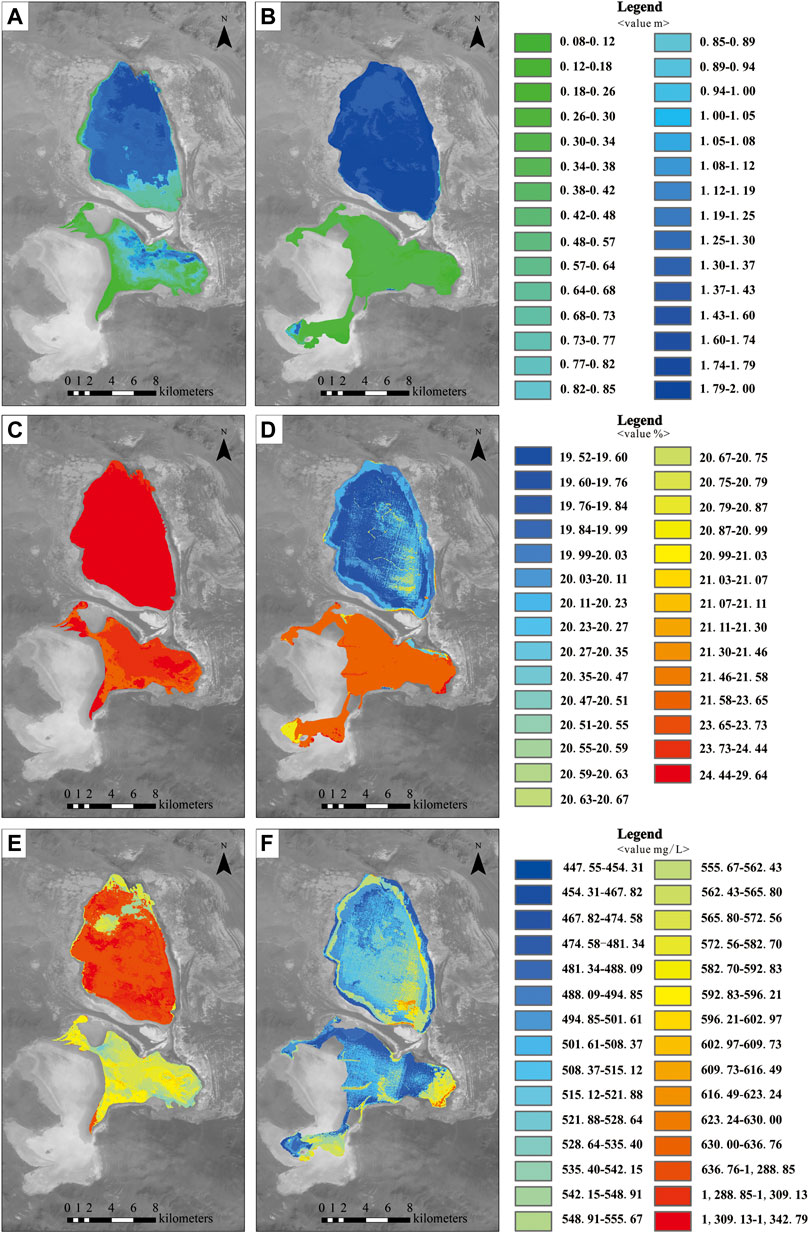
FIGURE 5. Water depth, salinity and lithium concentration inversion results. Water depth in (A) 2000 and (B) 2017; Salinity in (C) 2000 and (D) 2017; Lithium concentration in (E) 2000 and (F) 2017.
The salinity at the South Lake verification point was 23%, and the predicted value was 22.5% in 2017. The salinity predicted by LightGBM agreed well with the measurements, indicating the machine learning algorithm can accurately predict the salinity of lake water. The salinity inversion results are shown in Figures 5C,D. Salinity ranged from 21 to 29% in 2000 and from 19 to 21% in 2017, indicating a downward trend in salinity in the South Lake.
Figures 5E,F show the result of the inversion of lithium concentration in lake water. It was above 530 mg/L in 2000 and below 530 mg/L in 2017, which shows a significant downward trend in the last 20 years. The lithium concentration at the South Lake verification point was 372 mg/L, and the predicted value was 527 mg/L in 2017. The actual value is lower than the inversion result, indicating that the actual downward trend of lithium concentration is more significant than the inversion result.
After inversion and calculation, the total lithium content was determined (Figure 6). In the North Lake, the total water volume in 2000 was 1,037.22 × 105 m3, resulting in a total salt content of 35.94 million tons. The total water volume in 2017 was 1,667.19 × 105 m3, with a total salt content of 39.83 million tons. In the South Lake, the total water volume in 2000 was 269.36 × 10⁵ m3, and the total salt content was 7.734 million tons. After the development and exploitation of South lake, the water volume and salt content have decreased by about 27% and about 30%, respectively. In the last 20 years, the water volume of the North Lake has increased significantly, with a growth rate of 60.73%. In 2000, there were 653,700 tons of lithium carbonate in the North Lake and 81,800 tons in the South Lake; in 2017, there were 462,500 tons in the North Lake and 53,000 tons in the South Lake. The lithium resources decreased by 29.2% in the North Lake and 35.2% in the South Lake.
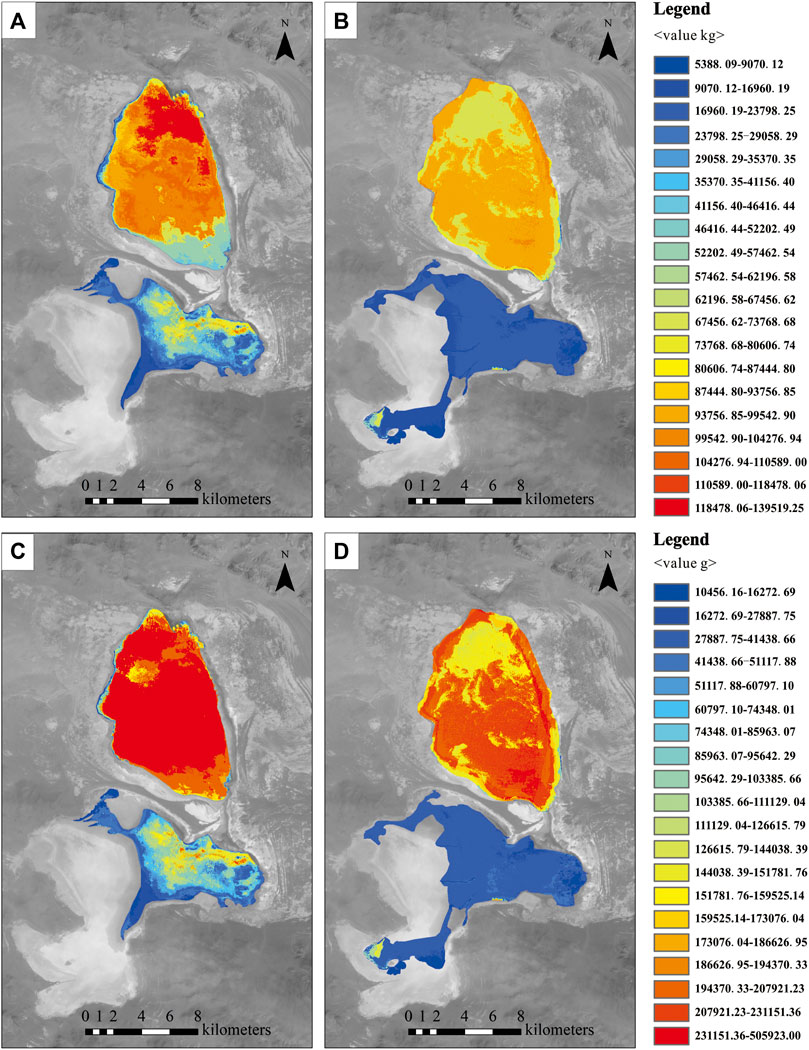
FIGURE 6. The total salinity and lithium content assessment results. Total salt content in (A) 2000 and (B) 2017; Total lithium content in (C) 2000 and (D) 2017.
In this study, Landsat remote sensing imagery is used to determine the salinity and lithium concentration of the Zabuye Salt Lake, and the influence of salt lake expansion on salt and lithium content from 2000 to 2017 is analyzed. The Zabuye Salt Lake is recharged by atmospheric precipitation, alpine ice and snowmelt water, and spring water. Annual precipitation and evaporation obtained from field observation stations (Figure 7A) show no significant changes in precipitation and evaporation, so atmospheric precipitation is not the major reason for those changes in Zabuye Salt Lake.

FIGURE 7. Evaporation, precipitation and temperature changes in Zabuye Salt Lake from 2000 to 2018. (A) Evaporation and precipitation trends from 2000 to 2018; (B) Temperature trend from 2000 to 2018.
Meteorological data from the Zabuye Salt Lake Observatory show that the temperature in the area has increased over the past 20 years (Figure 7B). Under the influence of climate change, the surrounding glaciers have melted, and river discharge in the Zabuye area has increased significantly, resulting in an increase in water volume and depth in the North Lake. The water depth in South Lake has decreased over the past 20 years due to the extensive development and utilization of lithium-bearing brine.
The expansion of the Zabuye Salt Lake will have a series of impacts on the quality of mineral resources. The most important impact on the lake water is the decrease in salinity and lithium concentration. From 2000 to 2017, the salinity of the North Lake shows a significant downward trend, while the salinity of the South Lake decreased slightly. The main reason for this is the difference of replenishment between the two lakes. Another reason is the dry salt flats replenish South Lake time to time. The difference in recharge between the two lakes is due to surface runoff and subsurface runoff. In addition to the spring water from Qiulinanmu, the North Lake is recharged by four large surface runoffs and several subsurface drains, while the South Lake is mainly recharged by spring water from Zabuye Island. In addition, the dry salt flats around the South Lake can replenish the salt in the South Lake, so the salinity decrease is less than in the North Lake.
The downward trend of lithium concentration is also obvious. In 2000, the lithium concentration in salt lakes was above 530 mg/L, and after 2017, most of them were below 530 mg/L. The distribution of lithium concentration shows a certain regularity that gradually increase from north to south. Because the spring water is mainly distributed in the north of the lake and flows into the lake from north to the south. Normally, the lithium concentration of the spring water is lower than lake water, so the lithium concentration tends to increase from north to south.
The North Lake is an undeveloped lake, and the inversion results show that the lithium resources of the North Lake have decreased which may be related to the increasing temperature. The increase in temperature in the lake catchment cause the precipitation of lithium carbonate and then dissolved lithium resources in lake waters decrease accordingly. One reason for the decrease of lithium resources in the South Lake is the precipitation of lithium carbonate, and another reason is the development and utilization of the South Lake. In 2000, there were 653,700 tons of lithium carbonate in North Lake and 81,800 tons in the South Lake; in 2017, there were 462,500 tons in North Lake and 53,000 tons in South Lake. The lithium resources decreased by 29.2% in North Lake and 35.2% in South Lake. Based on the precipitation of lithium carbonate in the North Lake which was 29.2% from 2000 to 2017, we suggested the decrease of 4,900 tons in the South Lake is most likely attributed to the development and utilization. However, the mining volume of lithium in South Lake has far exceeded 4,900 tons in the past 20 years. Therefore, the spring water and dry salt flats of South Lake have provided large quantities of lithium for the South Lake.
Landsat satellite imagery has recorded global changes over the past 50 years, and provides important historical data for studying areas that have only recently been developed and exploited, such as the Tibetan Plateau. Satellite imagery and image processing can be used to monitor resources and environmental changes comprehensively and accurately, providing scientific support for resource development and environmental protection. In this study, the machine learning algorithms were used for inversion and information extraction in areas with incomplete data. The result shows that machine learning algorithms can provide accurate predictions using limited training data, and enable multi-dimensional feature analysis. Existing inversion studies for the salt lake generally use combination of one or more bands. While it is feasible to fit the value of water parameters at a given time point, scalability at multiple time points is limited. This study uses the effective information of the whole band, while using the automatic screening feature of the LightGBM algorithm to reduce the data dimension and significantly improve the inversion accuracy.
The idea of using Big Data is contribute to realize the inversion and extraction of salt lake information. The accumulation of measured data is of great significance. When the amount of measured data is relatively large, machine learning between different lakes in different time periods can also make more accurate predictions. If the measured data of multiple salt lakes in multiple time periods are combined into a large data set, the mineral concentrations of salt lakes can be predicted without observation stations or measured data, which will save a lot of manpower and material resources for managing the development and utilization of salt lakes.
The inversion of mineral concentration in salt lakes also depends on the quality of remote sensing images. In the future, we can also strengthen the spectral exploration of minerals, improve the ability of remote sensing satellites to acquire information, and comprehensively improve the spatial and spectral resolution. Thus, we can obtain relatively accurate information about lake water without the support of measurement data, and make better use of remote sensing technology.
In this study, the Landsat remote sensing data and a high-precision LightGBM algorithm were used for the inversion of water depth, salinity, and lithium concentration. To improve the generalizability of the model and overcome the shortcomings of incomplete measured data, data in Zabuye Lake from 2000 to 2017 were selected for training the model. After a series of image processing, data statistics, and analysis, we came to the following conclusions:
Compared to 2000, the water depth of the lake increased in 2017, as did the water volume. The expansion of the Zabuye Salt Lake led to the decrease in salinity and lithium concentration. After the extensive development and exploitation of the South lake, the total amount of salt and lithium resources decreased from 2000 to 2017, with more dramatical trend in South Lake.
The salt lake inversion method in this study proved that the LightGBM algorithm has higher prediction accuracy than conventional analysis methods. Machine learning algorithms are feasible and superior in remote sensing inversion research. In addition, the accumulation of measurement data is of great significance to the analysis and prediction of salt lakes.
Remote sensing images contain important spectral information that can be used in inversion studies for salt lakes. With the development of remote sensing technology in recent years, the spatial and spectral resolutions of remote sensing images have greatly improved, which is important for more detailed assessment of salt lake resources in the future.
The original contributions presented in the study are included in the article/supplementary material, further inquiries can be directed to the corresponding author.
JD wrote the manuscript, designed the study and provided guidance and funds; TL and YZ collected the material and performed the investigation; ST, CY, and ZN provided the geological information and guidance. All authors contributed to manuscript revision, read, and approved the submitted version.
This research was supported by the Academician Workstation Projects (HE2205 and HE2206), the National Natural Science Foundation of China (42172332), the China geological survey project (DD20221684), and the Basic Research Projects of the Institute of Mineral Resources, Chinese Academy of Geological Sciences (KK2102).
We would like to acknowledge assistance from the Institute of Mineral Resources of the Chinese Academy of Geological Sciences, the Zabuye Salt Lake field observation station of the Chinese Academy of Geological Science and China University of Geosciences (Beijing) for providing us with the field measured data. We are also grateful to Yongjie Lin, Andong Chen and Fanjing Kong from the Institute of Mineral Resources, Chinese Academy of Geological Sciences for their constructive comments, which improved the paper significantly.
The authors declare that the research was conducted in the absence of any commercial or financial relationships that could be construed as a potential conflict of interest.
All claims expressed in this article are solely those of the authors and do not necessarily represent those of their affiliated organizations, or those of the publisher, the editors and the reviewers. Any product that may be evaluated in this article, or claim that may be made by its manufacturer, is not guaranteed or endorsed by the publisher.
Cao, H., Han, L., Li, W., Liu, Z., and Li, L. (2021). Inversion and distribution of total suspended matter in water based on remote sensing images-A case study on yuqiao reservoir, China. Water Environ. Res. 93 (4), 582–595. doi:10.1002/wer.1460
Chen, K., Kao, W., and Tzeng, Y. (1995). Retrieval of surface parameters using dynamic learning neural network. Int. J. Remote Sens. 16 (5), 801–809. doi:10.1080/01431169508954444
Dionisio, R. E., Marcello, J., Eugenio, F., Angel, G. R., and Consuelo, G. M. (2017). Object-based quality evaluation procedure for fused remote sensing imagery. Neurocomputing 255, 40–51. doi:10.1016/j.neucom.2016.06.091
Duba, R. D., Girma, D. T., Achim, I., and Gachena, N. W. (2021). Diagnosis of diabetes mellitus using gradient boosting machine (LightGBM). Diagnostics 11 (9), 1714. doi:10.3390/diagnostics11091714
Fan, J., Luo, Y., Tan, S., Ma, W., Zhang, H., and Liu, F. (2021). Accuracy evaluation of the FY-3C/MWRI land surface temperature product in Hunan Province. Remote Sens. Land & Resour. 33 (1), 249–255. doi:10.6046/gtzyyg.2020066
Figueiredo, I. N., Pinto, L., and Gonçalves, G. (2016). A modified lyzenga’s model for multispectral bathymetry using tikhonov regularization. IEEE Geosci. Remote Sens. Lett. 13 (1), 53–57. doi:10.1109/lgrs.2015.2496401
Forget, P., Ouillon, S., Lahet, F., and Broche, P. (1999). Inversion of reflectance spectra of nonchlorophyllous turbid coastal waters. Remote Sens. Environ. 68, 264–272. doi:10.1016/S0034-4257(98)00117-5
Gábor, C., Krisztina, L. P., Bence, F., Ádám, M., and Veronika, K. (2022). Human activity recognition of children with wearable devices using LightGBM machine learning. Sci. Rep. 12 (1), 5472. doi:10.1038/s41598-022-09521-1
Kong, W., Bu, L., Zheng, M., and Nie, Z. (2017). Overview of salt lake stations on Tibetan Plateau. Sci. Technol. Rev. 35 (6), 103–107. doi:10.3981/j.issn.1000-7857.2017.06.013
Larya, D. J., Alavib, A. H., Gandomic, A. H., and Walker, A. L. (2016). Machine learning in geosciences and remote sensing. Geosci. Front. 7, 3–10. doi:10.1016/j.gsf.2015.07.003
Lei, L. (2019). Study on changes of lake areas since 2000 and it response to the climatic factors in Tibetan Plateau. Chengdu, China: Chengdu University of Technology.
Letey, J., Hoffman, G. J., Hopmans, J. W., Grattan, S. R., Suarez, D., Corwin, D. L., et al. (2011). Evaluation of soil salinity leaching requirement guidelines. Agric. Water Manag. 98, 502–506. doi:10.1016/j.agwat.2010.08.009
Li, L., Li, Y., Yu, D., Liu, Z., Gao, Ya., and Qian, J. (2021). A multi-organ fusion and LightGBM based radiomics algorithm for high-risk esophageal varices prediction in cirrhotic patients. IEEE Access 9, 15041–15052. doi:10.1109/ACCESS.2021.3052776
Li, Y., Li, Y., Shi, K., Lv, H., Guo, Y., Zhou, L., et al. (2013). Evaluation of total suspended matter based on spectral classification. Spectrosc. Spect. Anal. 3 (10), 2721–2726. doi:10.3964/j.issn.1000-0593(2013)10-2721-06
Liu, F., Wang, C., and Wang, X. (2018). Application of near-surface remote sensing in monitoring the dynamics of forest canopy phenology. J. Appl. Ecol. 29 (6), 1768–1778. doi:10.13287/j.1001-9332.201806.016
Liu, X., Zheng, M., and Qi, Wen. (2007). Sources of ore-forming materials of the superlarge B and Li deposit in Zabuye salt lake, Tibet, China. Acta Geol. Sin. 81 (12), 1709–1715. doi:10.3321/j.issn:0001-5717.2007.12.011
Lu, S., Xiao, G., Jia, L., Zhang, W., and Luo, H. (2016). Extraction of the spatial-temporal lake water surface dataset in the Tibetan Plateau over the past 10 years. Remote Sens. Land. Resour. 28 (3), 181–187. doi:10.6046/gtzzyg.2016.03.28
Lu, T., Chen, S., Tu, Y., Yu, Y., Cao, Y., and Jiang, D. (2019). Comparative study on coastal depth inversion based on multi-source remote sensing data. Chin. Geogr. Sci. 29 (2), 192–201. doi:10.1007/s11769-018-1013-z
Luo, S. S., and Zheng, M. P. (2004). Exploitation actuality of saline lake lithium resources in Tibet. Geol. Prospect. 40 (3), 11–14. doi:10.3969/j.issn.0495-5331.2004.03.003
Lyzenga, D. R. (1978). Passive remote sensing techniques for map-ping water depth and bottom features. Appl. Opt. 17 (3), 379–383. doi:10.1364/AO.17.000379
Mao, Z., Chen, J., Pan, D., Tao, B., and Zhu, Q. (2012). A regional remote sensing algorithm for total suspended matter in the east China sea. Remote Sens. Environ. 124, 819–831. doi:10.1016/j.rse.2012.06.014
Maxwell, A. E., Warner, T. A., and Fang, F. (2018). Implementation of machine-learning classification in remote sensing: An applied review. Int. J. Remote Sens. 39 (9), 2784–2817. doi:10.1080/01431161.2018.1433343
MinJee, K., HyeIn, L., JaeHyun, C., Jae, L. K., and Changyeun, M. (2022). Development of a soil organic matter content prediction model based on supervised learning using vis-NIR/SWIR spectroscopy. Sensors 22 (14), 5129. doi:10.3390/s22145129
Nhu, V. H., Mohammadi, A., Shahabi, H., Shirzadi, A., Al-Ansari, N., Ahmad, B. B., et al. (2020). Monitoring and assessment of water level fluctuations of The lake Urmia and its environmental consequences using multitemporal Landsat 7 ETM+Images. Int. J. Environ. Res. Public Health 17, 4210–4216. doi:10.3390/ijerph17124210
Pan, X., Li, G., Liu, F., Wu, X., Kondoh, A., and Shen, Y. (2015). Using remote sensing to determine spatio-temporal variations in winter wheat growing area in the North China Plain. Chin. J. Eco-Agriculture 23 (4), 497–505. doi:10.13930/j.cnki.cjea.141505
Pan, Z., Fang, S., and Wang, H. (2021). LightGBM technique and differential evolution algorithm-based multi-objective optimization design of DS-APMM. IEEE Trans. Energy Convers. 36 (1), 441–455. doi:10.1109/TEC.2020.3009480
Qi, W., and Zheng, M. (2006b). Time-serial analyses of water level fluctuation of Zabuye salt lake, Tibet. Sci. Geogr. Sin. 26 (6), 693–700. doi:10.3969/j.issn.1000-0690.2006.06.009
Qi, W., and Zheng, M. (2006a). Winters and ARIMA model analysis of The lake ievel of salt lake Zabuye, tibeatan plateau. J. Lake Sci. 18 (1), 21–28. doi:10.3321/j.issn:1003-5427.2006.01.003
Rogan, J., Miller, J., Stow, D., Franklin, J., Levien, L., and Fischer, C. (2003). Land-cover change monitoring with classification trees using Landsat TM and ancillary data. Photogramm. Eng. remote Sens. 69 (7), 793–804. doi:10.14358/PERS.69.7.793
Rouet-Leduc, B., Hulbert, C., Lubbers, N., Barros, K., Humphreys, C. J., and Johnson, P. A. (2017). Machine learning predicts laboratory earthquakes. Geophys. Res. Lett. 44, 9276–9282. doi:10.1002/2017GL074677
Shi, K., Li, Y., Liu, Z., Xu, Y., Xu, X., Ma, W., et al. (2011). Estimation of total suspended matter concentration based on semi-analysis algorithm in inland turbid waters. Environ. Sci. 32 (6), 1571–1580. doi:10.13227/j.hjkx.2011.06.016
Siswanto, E., Tang, J., i Yamaguchi, H., Ahn, Y., Ishizaka, J., Yoo, S., et al. (2011). Empirical ocean-color algorithms to retrieve chlorophyll-a, total suspended matter, and colored dissolved organic matter absorption coefficient in the Yellow and East China Seas. J. Oceanogr. 67, 627–650. doi:10.1007/s10872-011-0062-z
Song, J., Liu, G., Jiang, J., Zhang, P., and Liang, Y. (2021). Prediction of protein–ATP binding residues based on ensemble of deep convolutional neural networks and LightGBM algorithm. Int. J. Mol. Sci. 22 (2), 939. doi:10.3390/ijms22020939
Su, H., Liu, H., and Heyman, W. (2008). Automated derivation of bathymetric information from multi-spectral satellite imagery using a non-linear inversion model. Mar. Geod. 31 (4), 281–298. doi:10.1080/01490410802466652
Tang, J. W., Tian, G., Wang, X., Wang, X., and Song, Q. (2004). The methods of water spectra measurement and analysis Ⅰ: Above-water method. J. Remote Sens. 9 (1), 37.
Tian, S., Hong, Y., and Qin, X. (2006). A remote sensing approach to the depth of the highly concentrated salt lake. Remote Sens. Land. Resources 1, 26.
Tian, S., Qin, X., Zheng, M., Hong, Y., and Kuang, S. (2005). Quantitative analysis of remote sensing on the total salinity of Zabuye salt lake in Tibet. Geoscience 19 (4), 506.
Vivone, G., Mura, M. D., Garzelli, A., Restaino, R., Scarpa, G., Ulfarsson, M. O., et al. (2020). A new benchmark based on recent advances in multispectral pansharpening: Revisiting pansharpening with classical and emerging pansharpening methods. IEEE Geosci. Remote Sens. Mag. 9 (1), 53–81. doi:10.1109/mgrs.2020.3019315
Wang, D. (2019). Models for predicting the Li content in salt lake based on remote sensing: A case study of Argentina’s arzaro salt lake. Jilin, China: Jilin University.
Xi, H., and Zhang, Y. (2011). Total suspended matter observation in the Pearl River estuary from in situ and MERIS data. Environ. Monit. Assess. 177, 563–574. doi:10.1007/s10661-010-1657-3
Xie, Y., Xiang, W., Ji, M., Peng, J., and Huang, Y. (2019). An application and analysis of forecast housing rental based on xgboost and lightgbm algorithms. Comput. Appl. Softw. 36 (9), 152–155. doi:10.3969/j.issn.1000-386x.2019.09.027
Xu, W., Bu, L., Kong, W., Zheng, M., and Nie, Z. (2017). Monitoring of the dynamic change of Zabuye salt lake: A remote sensing approach. Sci. Technol. Rev. 35 (6), 89–96. doi:10.3981/j.issn.1000-7857.2017.06.011
Yagmur, N., Bilgilioglu, B. B., Dervisoglu, A., Musaoglu, N., and Tanik, A. (2021). Long and short-term assessment of surface area changes in saline and freshwater lakes via remote sensing. Water Environ. J. 35, 107–122. doi:10.1111/wej.12608
Yan, L., and Zheng, M. (2015). Influence of climate change on saline lakes of the Tibet Plateau, 1973-2010. Geomorphology 246, 68–78. doi:10.1016/j.geomorph.2015.06.006
Yang, K., Yao, F., Dong, D., Dong, W., and Luo, J. (2017). Spatiotemporal monitoring of lake area dynamics on the Tibetan plateau. J. Geo-information Sci. 19 (7), 972–982. doi:10.3724/SP.J.1047.2017.00972
Zhang, C., He, J., and Ma, Z. (2013). Remote sensing monitor of sea fog in fujian coastal region. Chin. J. Agrometeorology 34 (3), 366–373. doi:10.3969/j.issn.1000-6362.2013.03.018
Zhang, M., Tang, J., Dong, Q., Song, Q., and Ding, J. (2010). Retrieval of total suspended matter concentration in the Yellow and East China Seas from MODIS imagery. Remote Sens. Environ. 114 (2), 392–403. doi:10.1016/j.rse.2009.09.016
Zhang, Y., Liu, M., Wang, X., Zhu, G., and Chen, W. (2009). Bio-optical properties and estimation of the optically active substances in Lake Tianmuhu in summer. Int. J. Remote Sens. 30 (11), 2837–2857. doi:10.1080/01431160802558592
Zhang, Y., Wang, Y., Gao, M., Ma, Q., Zhao, J., Zhang, R., et al. (2019). A predictive data feature exploration-based air quality prediction approach. IEEE Access 7, 30732–30743. doi:10.1109/ACCESS.2019.2897754
Zheng, M. P., Xiang, R. J., and Ge, Z. H. (2004). Exploitation actuality and prospect of saline lake resources in Western China. Land Resour. Inf. (2), 21–25.
Zhou, Y., Zhang, R., Ma, H., Zhang, J., and Zhang, X. (2016). Retrieving of salt lake mineral ions salinity from hyper - spectral data based on BP neural network. Remote Sens. Land. Resour. 28 (2), 34–40. doi:10.6046/gtzyyg.2016.02.06
Keywords: Zabuye Salt Lake, remote sensing, LightGBM algorithm, lithium, Tibetan Plateau
Citation: Dai J, Liu T, Zhao Y, Tian S, Ye C and Nie Z (2023) Remote sensing inversion of the Zabuye Salt Lake in Tibet, China using LightGBM algorithm. Front. Earth Sci. 10:1022280. doi: 10.3389/feart.2022.1022280
Received: 18 August 2022; Accepted: 14 September 2022;
Published: 05 January 2023.
Edited by:
Qiuming Pei, Southwest Jiaotong University, ChinaReviewed by:
Hengkai Li, Jiangxi University of Science and Technology, ChinaCopyright © 2023 Dai, Liu, Zhao, Tian, Ye and Nie. This is an open-access article distributed under the terms of the Creative Commons Attribution License (CC BY). The use, distribution or reproduction in other forums is permitted, provided the original author(s) and the copyright owner(s) are credited and that the original publication in this journal is cited, in accordance with accepted academic practice. No use, distribution or reproduction is permitted which does not comply with these terms.
*Correspondence: Jingjing Dai, ZGFpamluZ2ppbmc4NjNAc2luYS5jb20=
Disclaimer: All claims expressed in this article are solely those of the authors and do not necessarily represent those of their affiliated organizations, or those of the publisher, the editors and the reviewers. Any product that may be evaluated in this article or claim that may be made by its manufacturer is not guaranteed or endorsed by the publisher.
Research integrity at Frontiers
Learn more about the work of our research integrity team to safeguard the quality of each article we publish.