 Meiben Gao
 Tianbin Li2,3*
 Yang Gao
 Yan Zhang
 Qingwen Yang
 Qingqing He
95% of researchers rate our articles as excellent or good
Learn more about the work of our research integrity team to safeguard the quality of each article we publish.
Find out more
ORIGINAL RESEARCH article
Front. Earth Sci. , 16 January 2023
Sec. Geohazards and Georisks
Volume 10 - 2022 | https://doi.org/10.3389/feart.2022.1020834
This article is part of the Research Topic Advanced Application of Deep Learning, Statistical Modelling, and Numerical Simulation on Geo-Environmental Hazards View all 59 articles
Brittleness is an important parameter to evaluate the performance of rock engineering. A scientific and reasonable brittleness evaluation method is of great significance to theoretical research and the engineering practice of rock mechanics. In view of the existing statistical constitutive models of rock based on the Weibull distribution being able to express various constitutive behaviors well, such as brittleness, plasticity, strain softening, this paper wants to determine rock brittleness from constitutive models. First, the parameter m, which can effectively reflect the overall characteristics of the rock stress-strain curve, and the parameter δ, which can reflect the post-peak characteristics, are selected. Then, a brittle evaluation method based on rock statistical damage constitutive parameters is proposed, and the brittleness index Bm (Bm = m·δ) is established. The feasibility is verified by the testing data of granite, sandstone and marble under different conditions. The results show that the brittleness of those hard rocks decrease with the increasing of confining pressure. For confining pressures of 5 MPa and 15 MPa, the brittleness of granite under triaxial unloading test is greater than that under triaxial compression test. The calculation results quantitatively reflect the brittle characteristics of sandstone, marble and granite in the test. Compared with the existing representative brittleness indexes, it is found that the brittleness index Bm can effectively reflect the characteristics of rock brittleness decreasing with increasing confining pressure and enhancement under unloading stress path. This paper provides a way to evaluate rock brittleness from the perspective of a constitutive model, which is helpful to enrich our understanding of rock brittleness.
As one of the basic properties of rock materials, brittleness is a key index to evaluate rock performances. Accurate evaluation of rock brittleness has important guiding significance for effective exploitation and utilization of mineral resources, underground engineering construction and geological disaster prevention and reduction. For example, in terms of the development and utilization of oil and gas shales and mineral resources, brittleness is a key parameter to evaluate reservoir mechanical characteristics, borehole stability, hydraulic fractures, coal mining and granite applicable range (Holt et al., 2015; Wang et al., 2019; Zou et al., 2021; Cui et al., 2021; Yin et al., 2022). In terms of underground engineering construction, the brittleness of rock mass determines the efficiency of TBM tunneling and hob rock breaking (Kahraman, 2002; Gong & Zhao, 2007). In terms of geological disaster prevention and reduction, brittleness is an important parameter for the evaluation and prediction of stability of surrounding rock, collapse, rock slide and earthquake (Qin et al., 2010; Zhou et al., 2021), such as underground engineering stability (Hajiabdolmajid & Kaiser, 2003; Yagiz, 2009), progressive failure of slope (Aligholi et al., 2017) and brittle failure of fault clavicle segment (Chen et al., 2017). Therefore, regardless of whether it is from the perspective of rock engineering projects or rock mechanical theory development, the ability to describe and evaluate rock brittleness effectively is crucial.
For the characterization of brittleness behavior, sudden collapse, ejection, splitting, plate cracking of surrounding rock and rock burst of rocks are all brittle failure phenomena. Various researchers have indirectly defined rock brittleness for different purposes. Representative determinations include the following. From the view of strain, Hetenyi (1966) defined brittleness as the loss of plasticity of materials. From the view of strength, Ramsay (1967) argued that brittle failure occurred when the cohesion of rock was destroyed. Obert and Duvall (1967) believed that brittleness was a feature describing the failure behavior of rock materials when the yield strength of rock is reached or exceeded. In addition, rock brittleness is also related to the accumulated energy and macroscopic fracture characteristics (Gong and Wang, 2022; Wang, et al., 2022). Tarasov and Potvin (2013) pointed out that rock brittleness is its ability to self-maintain macroscopic damage through energy balance of the postpeak stage. Li et al. (2012) believed that brittleness was a comprehensive property of rock materials, i.e., the ability to generate local damage and to develop spatial fractures under an internal nonuniform stress distribution caused by the inherent heterogeneity of the rock. Moreover, from the view of mathematics, many constitutive models, which can better express the brittle behavior of rocks, have been established by using different strength criteria in combination with statistical strength theory, damage theory and effective stress principle (Wang et al., 2007). However, an internationally accepted norm and a standard measurement of brittleness have not been established yet (Altindag, 2010). The common features (Hucka and Das, 1974) for rock with high brittleness are concluded as follows: 1) Failure occurs at small strain and is dominated by fractures, 2) formation of fines, 3) higher ratio of compressive to tensile strength, 4) higher resilience, 5) higher internal friction angle (rupture angle) and 6) fully developed fractures during hardness tests.
In addition, many brittleness indices were proposed to quantitatively evaluate rock brittleness (Zhang et al., 2021; Liu et al., 2022). Hucka and Das (1974) analyzed seven determining methods of brittleness index, finding that the values of brittleness are not identical; then, they pointed out it would be better to define different types of brittleness, such as brittleness based on the strain ratio, brittleness based on the energy ratio, etc. Recently, Meng et al. (2015), Zhang et al. (2016), Ai et al. (2016), and Chen et al. (2019) conducted a comprehensive review on different formulations and definitions of rock brittleness, and the brittleness indices could generally fall into three categories: 1) Brittleness indices based on physical tests. 1) Mineral composition-based analysis: Jarvie et al. (2007) and Rickman et al. (2008) believed that the brittleness increased with the increase of quartz mineral, based on which they proposed a brittleness index to quantify rock brittleness as a function of the amount of quartz, carbonate and clay minerals in rocks. However, this index did not take the effects of porosity, grain size, cementation, and the confining stresses on brittleness into consideration, which would lead to some rocks having the same mineral proportions while showing different brittle features. This implies that consideration of only the weight percentages of brittle minerals in a rock mass cannot precisely describe its brittleness. 2) Porosity-based analysis: Porosity is also an effect on rock performance. By investigating the correlation between the mineralogy-derived brittle indices with neutron porosity, Jin et al. (2014) claimed that there is a global correlation between them, and can serve as a benchmark brittleness value. Meanwhile, Heidari et al. (2014) pointed out that there was no correlation between the brittleness index values and the porosity values. Sometimes, this method may lead to contradictory results in field applications (Cho and Perez, 2014). 3) Hardness based analysis: Hardness based brittleness indices were proposed for ceramic engineering (Honda and Sanada, 1956). As the index was proposed and used for ceramics, no additional data are available for rock materials, making it difficult to compare and determine the applicability and accuracy in the evaluation of rock brittleness. 2) Brittleness indices based on rock mechanical tests. 1) Strength-based analysis: Based on rock compressive and splitting tests, various brittleness indices were built using crack-initiation stress, peak stress, residual stress and tensile strength, such as the ratio of compressive strength to tensile strength (Hucka and Das, 1974; Altindag and Guney, 2010), ratio of the difference of peak strength and residual strength to the peak strength (Bishop, 1967), and ratio of peak strength to crack-initiation stress (Wang et al., 2014). However, many scholars criticized that those indices yielded contradictory results with respect to those calculated from the perspective of strain or energy. Furthermore, the results are not monotonic and continuous. In addition to the above limitations, rock brittleness can be affected by the stress state, and rocks may show less brittleness and more ductility at high confining pressure conditions, so those indices are not suitable for a complex stress environment (Meng et al., 2015). 2) Strain based analysis: Meanwhile, strain based brittleness indices have been proposed (Hucka and Das, 1974; Andreev, 1995; Gong and Zhao 2007). For example, Coates (1966) determined the brittleness by the ratio of the recoverable strain to the total strain. Hajiabdolmajid and Kaiser (2003) introduced a plastic strain-dependent brittleness index which considers the cohesion weakening and frictional strengthening processes. However, those indices do not consider the postpeak characteristics, which are critical for characterizing the brittle features (Li et al., 2017). 3) Energy-based analysis: After analyzing the energy ratio data obtained from laboratory compressive tests, Tarasov and Potvin (2013) proposed a brittleness index based on the complete stress-strain curve of energy balance. Due to the simplified assumption, they cannot precisely describe different rocks characterized by the same E and M (Meng et al., 2015; Chen et al., 2019). 3) Brittleness indices based on other methods. Other indices have been derived based on penetration tests (Yagiz, 2009), point load testing (Reichmuth, 1967), overconsolidation ratio (OCR)-based analysis (Nygård et al., 2006), geophysical λρ-μρ crossplot-based analysis (Goodway et al., 1999), and Mohr’s Circle (Hucka and Das, 1974). They all have some limitations, e.g., the penetration test requires specific equipment for the sampling and testing of rock, leading to its limited use. There is a lack of sufficient evidence in the point load testing method on why the values of Kb differed for various rocks. Recently, with the development of artificial intelligence and big data technology (Li et al., 2022), many scholars have used intelligent algorithms to evaluate the brittleness of rock. For example, Parsajoo et al. (2022) proposed a precise neuro-fuzzy model enhanced by artificial bee colony techniques for assessment of rock brittleness index. By integration the Sparrow Search Algorithm (SSA) and the Extreme Learning Machine (ELM), a new hybrid model is proposed for predicting the brittleness index (Zhang et al., 2022). In fact, rock is made of various kinds of mineral particles with voids, cracks and joints inside, and these weak structures are the typical embodiment of rock damage. Rock brittle deformation and brittleness are closely related to the distribution of internal cracks and the generation, propagation and connection of micro fractures. In addition, the micro inhomogeneity of rock, determined by the inner voids and minerals, could be described by the Weibull distribution (Wang et al., 2007). Thus, various statistical meso-damage constitutive models have been put forward from this perspective, and those models can be used to express the brittle behavior of hard rocks.
However, little attention has been given to building the brittleness index via rock statistical constitutive model parameters. Through investigation of the existing literature, it is found that Chen et al. (2017) selected the shape parameter m in the two-parameter Weibull distribution as the index to assess the brittle failure degree of rock, but m, as the parameter to characterize the heterogeneity of rock materials, reflected more the characteristics of the whole curve features and was limited in describing the postpeak characteristics of rock materials. Li et al. (2017) discussed rock brittleness based on statistical constitutive relations, and proposed an energy-based brittleness index. They only considered the prepeak stage without the postpeak stage. However, the brittleness is closely related to the postpeak characteristics of rock stress-strain curves. Previous research showed that the postpeak characteristics of rock stress-strain curves for a statistical constitutive model can be effectively characterized by introducing the damage variable correction coefficient δ (Cao et al., 2013). Therefore, in combination with the thermal-mechanical-damage constitutive model (established based on the Weibull distribution) parameters (m, δ), and granite, sandstone and marble testing data, this paper explores the feasibility of establishing the brittleness index based on these parameters (m, δ).
After introduction of statistical damage theory, great acheivements have been gotted on rock statistical damage constitutive models (Wang et al., 2007; Cao et al., 2013; He et al., 2021). Those damage statistical models assume that the defects random distribution in rock materials and rock micro-element strength obeys Weibull distribution. Meanwhile, rock is isotropy macroscopically, rock micro-element has failure and non-failure two states, and micro-element before failure complies with Hooke’s law. In this work, based on previous work of statistical damage constitutive model of rocks (Wang et al., 2007; Cao et al., 2013; He et al., 2021), a damage statistical constitutive model was proposed by introducing a three-parameter Weibull distribution. The details are as follow (Gao et al., 2022).
1) Damage variable. The damage variable D is the ratio of the number of damaged micro-elements to the total number of micro-elements N.
where
2) Constitutive equation
where E is elastic modulus. m, F, γ are the mean uniformity, peak strength, and damage evolution threshold, respectively, which represents the shape, scale, dimension, and position. μ is Poisson’s ratio.
3) Parameters According to previous work (Cao and Li, 2008; Gao et al., 2022), calculation formulas for constitutive parameters δ, γ, m and F are shown in Eqs. 3–6
where σci is crack initiation stress.
An effective brittleness index should fully consider the whole rupture process of rock, the effects of mechanical parameters and the external loading conditions (Ai et al., 2016; Xia et al., 2017). For example, Ai et al. (2016) proposed an index which considered the pre-peak and the post-peak stages of the stress-strain curve. In this paper, the constitutive model parameters m and δ were selected to establish a brittleness index. The parameter m can effectively reflect the overall characteristics of rock behavior, and the parameter δ can reflect the post-peak characteristics of the stress-strain curve.
In general, under external loading conditions, rocks show plastic, elastic, strain softening and brittle behaviors. From the perspective of damage statistics, a large number of scholars have studied the constitutive behavior of rocks under various conditions by using the Weibull distribution, finding that the rock damage statistical constitutive model based on the Weibull distributions can express elastic-brittle, elastic-plastic and strain softening behaviors of rocks (Wang et al., 2007; Li et al., 2012). For the constitutive fitting of different rock behaviors, the constitutive model is the same, but different constitutive parameters determine different constitutive curves, which indicates that the constitutive parameters determine the characteristics of the constitutive curves. For example, based on a unified statistical damage constitutive model, the elasticity, brittleness, plasticity or strain softening characteristics of rocks can be described by selecting the appropriate constitutive parameters. This lays the foundation for estimating brittleness by using constitutive parameters. This paper builds a new brittleness index via the parameters m and δ.
Figure 1 shows the theoretical curve of a granite sample changing with the constitutive parameters m and δ. According to Figure 1A, the larger the parameter m is, the greater the slope of the curve behind the peak is and the faster the stress falls. When m = 1, the theoretical curve exhibits no obvious stress drop phenomenon, showing plastic characteristics, and if the m value increases, the stress drop after the peak in the theoretical curve is obvious. In fact, m embodies the characteristics of rock mineral particles, also known as the inhomogeneity coefficient. The greater the m value, the more brittle the rock. According to Figure 1B, the post-peak of the curve falls faster with the increase of δ. Based on the influence of the parameters m and δ, it is found that different constitutive behaviors can be expressed by setting reasonable values for the two parameters (Figure 1C).
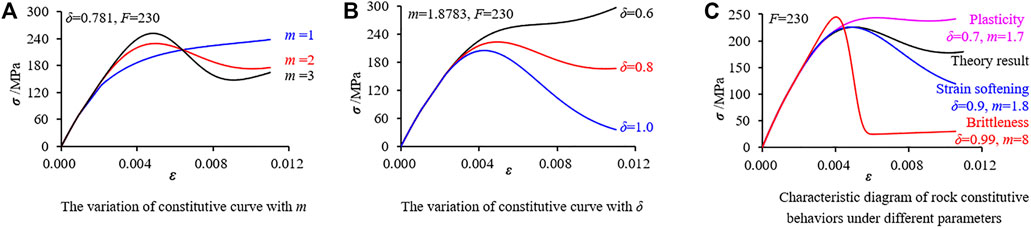
FIGURE 1. Theoretical analsis of constittive curves with different parameters.
According to the above theoretical analysis, when m and δ are both large, the stress would drop much more quickly after the peak, which means the brittleness characteristics are prominent. Therefore, m and δ are selected as the two parameters to establish a new index for evaluating rock brittleness (Gao et al., 2022).
The steps of this brittleness evaluation method based on rock constitutive parameters are as follows:
1) Qualitatively judge the brittleness characteristics by the post-peak features of the stress-strain curve.
2) Calculate the values of the constitutive parameters via testing data, and then depict the theory curve.
3) Adjust constitutive parameters values, making the theory curve and test curve match well. Sometimes, there would be a slight difference between the theory curve and the test curve. This may be caused by errors of the testing and parameter values. The testing error, includes system errors and operation errors. For the parameters’ values, there may be a few errors because of the subjectivity of determining residual stress and crack-initiation stress. Therefore, in order to accurately assess the brittleness, it is advisable to match the theory curve and test curve well by adjusting the values of m and δ properly. In this way, the previous errors can be eliminated.
4) Establish the brittleness index via m and δ, and the calculation formula is as follow:
As detailed in the theoretical analysis, the curve drops quickly after the peak when both m and δ values are greater, so the product of m and δ is taken as the new brittleness index.
5) Comprehensively evaluate the brittleness of rock by considering both the stress-strain curve characteristics and brittleness index value.
In this section, the new brittleness index Bm will be verified from two aspects by combining the test data of granite, sandstone and marble. Firstly, the brittleness index Bm was preliminarily verified by different lithologies test data under the confining pressure of 5–35 MPa. Secondly, the brittleness index Bm is verified by granite test data under loading and unloading conditions. The feasibility of brittleness index Bm under different confining pressures and loading modes will be verified.
Granite, sandstone, and marble used in the manuscript are respectively collected from Gaoligongshan Tunnel of Da-Rui Railway, Bamiao Tunnel of Taoba Highway and Jinping II Hydropower Station. In order to further analyze the fabric characteristics of the sample, X-ray diffraction experiment and polarized light microscopic section experiment were carried out. The results are shown in Table 1.
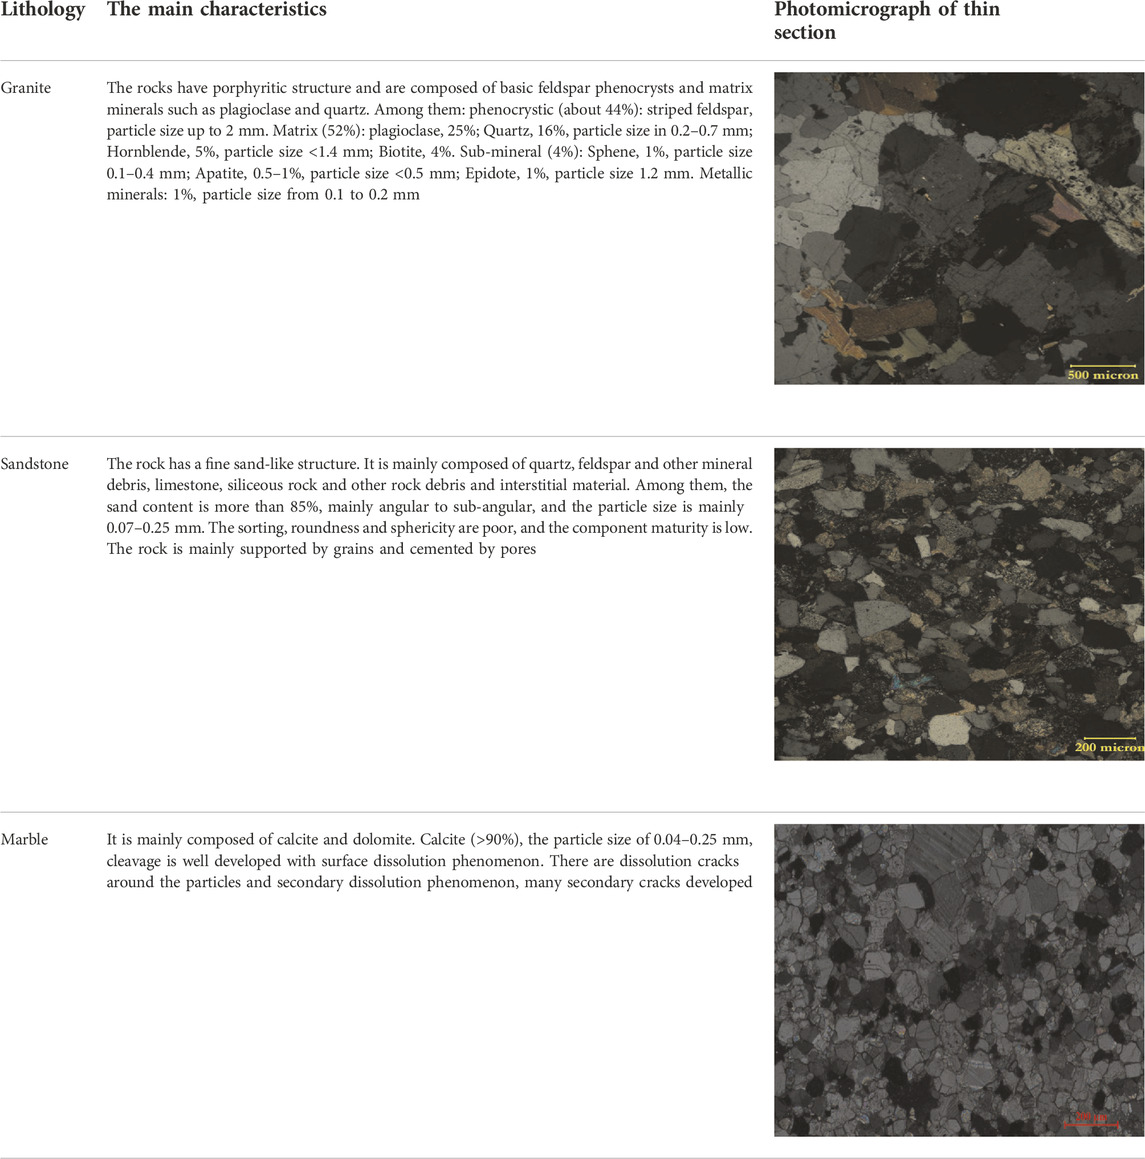
TABLE 1. Fabric characteristics of rock samples (Xu, 2014; Wang, 2014; Zhong, 2017).
Figure 2 shows the stress-strain curves, macroscopic fracture characteristics, peak strength and calculation results of brittleness index Bm of granite at 5–30 MPa. According to Figure 2A, the stress-strain curves of granite under different confining pressures can be roughly divided into linear elastic deformation, stable crack growth, unstable crack growth, peak and residual strength, etc. Due to the confining pressure, the crack-closure stage of stress-strain curve is not obvious. Under the condition of 5 MPa, the curve quickly reaches the peak stage, and then it drops rapidly, showing typical brittleness characteristics. Under the condition of 15 MPa, the curve slowly reaches the peak point after unstable crack growth, and there is a certain plastic deformation before the peak. Finally, the stress drops rapidly, showing a brittle character. Under the condition of 25 MPa, the slope of the curve is the largest, but the curve near the peak maintains near-horizontal, which is plastic deformation. The peak characteristic is not obvious. The post-peak stress falls in stages, which shows that it falls quickly for a short time, then slowly, then falls quickly for a short time and finally enters the residual stage. Under the condition of 25 MPa, the curve shows brittle-plastic characteristics. Under the condition of 30 MPa, the curve shows typical strain softening characteristics. According to Figure 2B, at 5 MPa, the sample shows through tensile fracture, and a secondary shear crack develops at the top, which is generally tensile fracture. At 15 MPa, the specimen has only one fracture surface, and the upper part of the fracture is inclined shear fracture, while the lower part is vertical tension fracture, which is realized as tension-shear mixed fracture. At 25 MPa, the specimen developed four fracture surfaces, among which the main fracture showed mixed tension-shear fracture, with shear as the main fracture, and the secondary fracture surfaces were tensile fracture. At 30 MPa, the specimen shows inclined shear fracture with a tendency of conjugate shear, which is a typical shear fracture. Combined with Figures 2A,B, the relationship between brittleness of granite samples under the condition of 5–35 MPa triaxial compression tests can be preliminarily determined, that is, the brittleness of granite samples under the condition of 5 MPa is the largest, followed by 15 MPa, then 25 MPa, and finally 30 MPa. The brittleness of granite is weak and the degree of brittleness decreases with increasing confining pressure under triaxial compression tests. According to Figure 2C, under the condition of 5–30 MPa triaxial compression tests, the peak strength of granite increases with the increase of confining pressure, whose values are 140 MPa, 229 MPa, 253 MPa, and 268 MPa, respectively. The values of the brittleness index Bm are 2.5, 1.9, 1.8, and 1.4, respectively. The calculated results quantitatively indicate that granite brittleness weakens with increasing confining pressure.
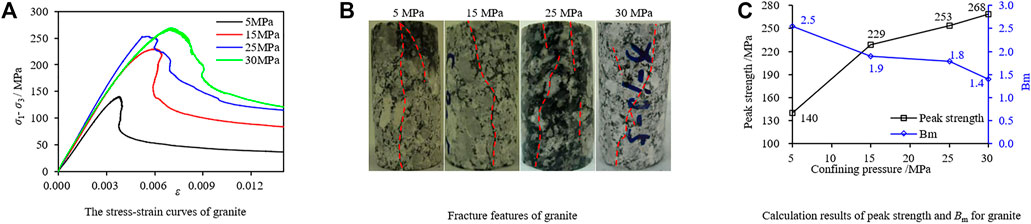
FIGURE 2. Test results and Bm values granite under different confining pressures.
Figure 3 shows the stress-strain curves, macroscopic fracture characteristics, peak strength and calculation results of brittleness index Bm of sandstone at 5–35 MPa. According to Figure 3A, the stress-strain curves of sandstone under different confining pressures have obvious linear elastic deformation and post-peak stress drop. Among them, under the conditions of 5 MPa and 15 MPa, the stress-strain curve increases slowly in the initial stage, showing a obvious crack closure characteristics. This is related to the diagenetic process of sandstone, which is a typical sedimentary rock. In the diagenetic process, the pressure is relatively small and the void volume compression is limited, resulting in its high porosity. At the same time, with the increase of confining pressure, the crack closure characteristics of the curves gradually weakened under the conditions of 25 MPa and 35 MPa, but the plastic characteristics of the curves gradually became prominent in the unstable crack growth stage. Especially at 35 MPa, the curve shows obvious plastic deformation near the peak, and then the stress drops rapidly. According to Figure 3B, sandstone samples under different confining pressures show tensile fracture. At 5 MPa, the specimen exhibits a penetrating vertical tensile fracture, which is a brittle failure. At 15 MPa, the specimen also exhibits a penetrating vertical tensile fracture, but the upper fracture surface is curved, with some shear components, and the overall failure is brittle. At 25 MPa, the specimen developed multiple tension-shear mixed fracture planes, but the tension fracture was the main one. At 35 MPa, the failure of the sample is the most serious one. After the test, some blocks of the sample fall rapidly. The main fracture surface is tension-shear fracture, and several secondary shear fracture surfaces develop near the main fracture surface. Combined with Figures 3A,B, the relationship between brittleness of granite samples under the condition of 5–35 MPa triaxial compression tests can be preliminarily determined, that is, the brittleness of granite samples under the condition of 5 MPa is the largest, followed by 15 MPa, then 25 MPa, and finally 35 MPa. The brittleness of sandstone is weak and the degree of brittleness decreases with increasing confining pressure under triaxial compression tests. According to Figure 3C, under the condition of 5–35 MPa triaxial compression tests, the peak strength of sandstone increases with the increase of confining pressure, whose values are 112 MPa, 118 MPa, 240 MPa, and 249 MPa, respectively. The values of the brittleness index Bm are 9.9, 9.0, 6.0, and 3.6, respectively. The calculated results quantitatively indicate that sandstone brittleness weakens with increasing confining pressure.
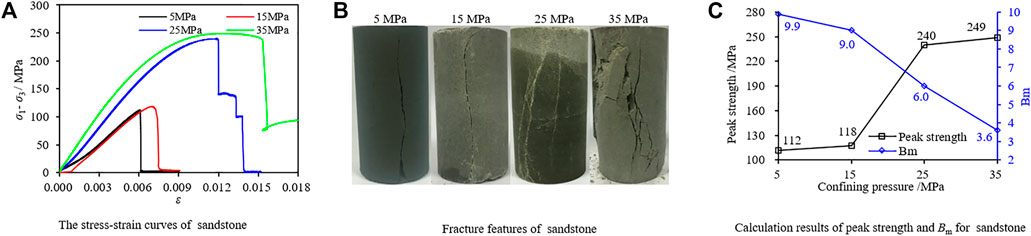
FIGURE 3. Test results and Bm values sandstone under different confining pressures.
Figure 4 shows the stress-strain curves, macroscopic fracture characteristics, peak strength and calculation results of brittleness index Bm of marble at 5–35 MPa. According to Figure 4A, the curves of marble have a certain crack closure characteristics at low confining pressure, but it weaken at high confining pressure. The plasticity strengthens with the increase of confining pressure. At 5 MPa, there is a small section of stress drop behind the peak, and then it shows softening property. At 15–25 MPa, with the increase of confining pressure, the plastic deformation interval increases, the plasticity increases, and the peak is not obvious. At 35 MPa, the curve has a tendency of plastic hardening. According to Figure 4B, at 5 MPa, the sample develops multiple vertical tensile fractures, which are typical brittle failures. At 15 MPa, the specimen developed a tensile-shear mixed main fracture surface, accompanied by several secondary tensile fracture surfaces, showing a tensile-shear mixed failure. At 25 MPa, the specimen showed through shear fracture. At 35 MPa, the specimen developed a main shear fracture surface, accompanied by a secondary shear fracture surface. The brittleness of marble is weak and the degree of brittleness decreases with increasing confining pressure under triaxial compression tests. According to Figure 4C, under the condition of 5–35 MPa triaxial compression tests, the peak strength of marble increases with the increase of confining pressure, whose values are 203 MPa, 269 MPa, 284 MPa, and 313 MPa, respectively. The values of the brittleness index Bm are 6.0, 1.7, 1.1, and 0.8, respectively. The calculated results quantitatively indicate that marble brittleness weakens with increasing confining pressure.
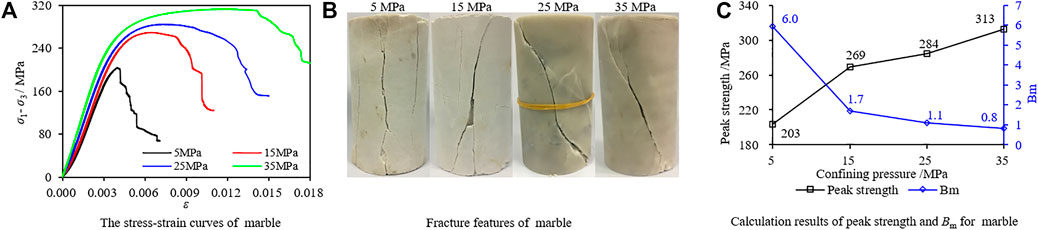
FIGURE 4. Test results and Bm values marble under different confining pressures.
In general, the brittleness weakens with increasing confining pressure. Above on the analyzing from Figures 2–4, the calculated results of the brittleness index Bm are consistent with the experimental curve characterization results and previous works (Zhou et al., 2014; Meng et al., 2015; Ai et al., 2016; Xia et al., 2017; Chen et al., 2019), which effectively reflect the change of brittleness index with confining pressure. This demonstrates the rationality and effectiveness of the new brittleness index Bm to a certain extent.
It is considered that rock brittleness under unloading conditions is more obvious than that under conventional compression conditions (Li et al., 2016). Therefore, comparison analyses were made using granite samples from the triaxial compressive tests (5 MPa, 15 MPa) and unloading tests (5 MPa, 15 MPa). According to Figure 5A, the post-peak curve dropped rapidly under unloading test at 5 MPa. Compared with the loading condition of 5 MPa, the curve has a left protrusion trend, indicating that the brittleness is larger. Under the unloading test condition of 15 MPa, the post-peak curve drops in stages. As mentioned above, at 15 MPa compression test, there is a certain plastic deformation before the peak value of the curve, and then the stress drops rapidly. In comparison, the brittleness of rock under 15 MPa unloading condition is greater than that under 15 MPa compression condition. According to Figure 5B, under the unloading condition of 5 MPa, the granite sample has a vertical penetrating tensile fracture surface, accompanied by several secondary tensile planes, which is a typical brittle fracture. Under the unloading condition of 15 MPa, there is a through tensile-shear mixed main fracture surface in the specimen. The upper part of the fracture surface is tensile-shear mixed failure, and the lower part is mainly vertical tensile fracture, which is mainly tensile brittle fracture. Combined with Figures 5A,B, it can be preliminarily determined that the sample brittleness is greater under unloading test condition when the confining pressure is the same. According to Figure 5C, the peak strength of granite sample under the unloading test at 5 MPa and 15 MPa are 135 MPa and 186 MPa respectively, which are less than 140 MPa and 229 MPa under compression test. The values of the brittleness index Bm under unloading tests are 3.6 and 3.2, which is larger than that at compression tests (2.5 and 1.9). According to Figure 5, it can be concluded that the sample peak strength under compression tests is larger than that at unloading tests, wihle the brittleness under compression tests is smaller than that at unloading tests. The calculated results are consistent with the actual situation, indicating that the new brittleness index Bm can reflect the brittleness of rocks under different loading modes, and it also demonstrates its rationality and effectiveness again.
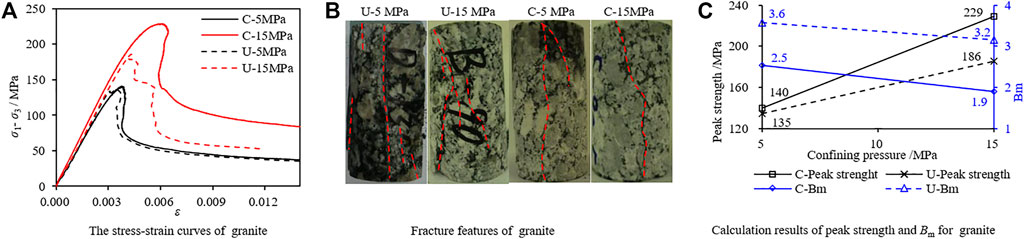
FIGURE 5. Test results and Bm values granite under different loading modes (C: compression tests, U: unloading tests).
At the present, various brittleness indices exist for rocks. In this section, a comparison was made between the proposed brittleness index (Bm) and four other commonly used brittleness indices. In view of the heterogeneity and anisotropy of rock material selected brittleness indices are shown in Table 2. Figure 6 is the schematic diagram for the brittleness indices B1, B2 and B4.
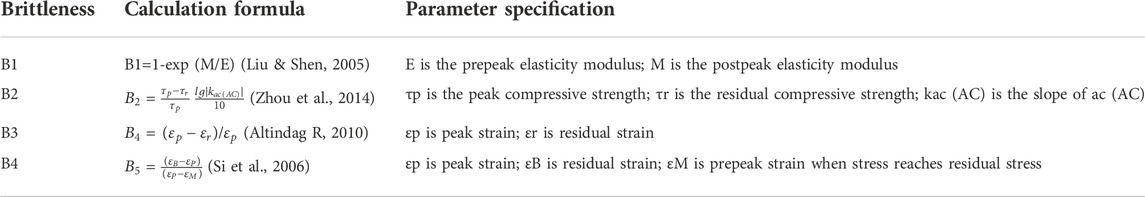
TABLE 2. Brittleness indices for comparative analysis.
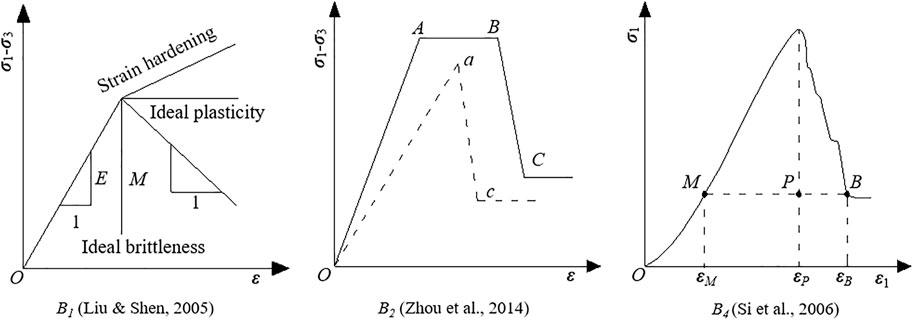
FIGURE 6. Schematic diagram of the calculation model of partial brittleness evaluation index.
In addition, a suggested classification of rock brittleness was established based on the research of the brittleness index B1 (Liu & Shen, 2005). There are 6 grades of rock brittleness, as shown in Table 3.
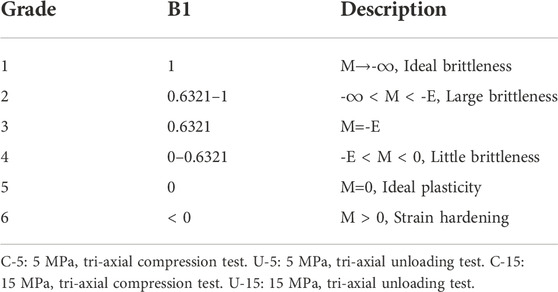
TABLE 3. Classification and description of brittleness index B1 (Liu & Shen, 2005).
The brittleness evaluation results of Bm, B1-B4 are compared and analyzed for different confining pressures, loading modes.
Figure 7 shows the evaluation results of different brittleness indexes of granite in triaxial compression test under various confining pressures. At 5–25 MPa, the values of B1 and B2 decrease with the increase of confining pressure, which effectively reflects the relationship that brittleness decreases with the increase of confining pressure. However, at 30 MPa, the values of B1 and B2 are slightly larger than those at 25 MPa, showing an abnormal phenomenon. According to Table 3, at 5–15 MPa, the values of B1 are 0.85 and 0.67, respectively, between 0.6321 and 1, which belongs to large brittleness. At 25–30 MPa, the value is between 0 and 0.6321, which belongs to little brittleness and has plastic characteristics. The evaluation results are consistent with the actual test. B3 and B4 have a tendency to increase with the increase of confining pressure. According to the calculation formula of B3 and B4, the larger the value of B3 and B4, the smaller the brittleness of rock. The calculation result shows that B3 and B4 can reflect the change law of brittleness with confining pressure to a certain extent. Bm shows a monotonically decreasing law with the increase of confining pressure, effectively reflecting the influence law of confining pressure on brittleness. In general, the calculated values of B1-B4 show a slight fluctuation with the increase of confining pressure, and the change law is not monotonically increasing or decreasing, which is somewhat different from the law of brittleness decreasing with the increase of confining pressure. Of course, this may be related to the heterogeneity of the sample itself, but i generally speaking, B1-B4 can reflect the influence law of confining pressure on brittleness. Comparative analysis shows that Bm and B1-B4 can be used to evaluate the change of granite brittleness with confining pressure.
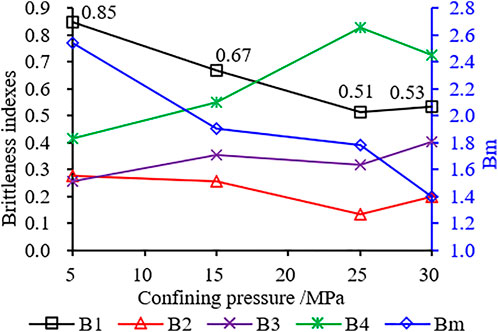
FIGURE 7. Calculation results of brittleness index for granite under different confining pressures.
Figure 8 shows the evaluation results of different brittleness indexes of sandstone in triaxial compression test under various confining pressures. At 5–25 MPa, the value of B1 has no change with the increase of confining pressure, which is 1.00. Its value decreases from 1.00 to 0.70 at 25–35 MPa. According to Table 3, the value of B1 is between 0.6321 and 1 at 5–35 MPa, which belongs to large brittleness. However, the test curve shows plasticity at 35MPa, and the calculated result is not consistent with the test result. At 5–25 MPa, B2 decreases with the increase of confining pressure. However, at 35 MPa, the value of B2 is slightly larger than that at 25 MPa, showing an abnormal phenomenon. But on the whole, B2 can reflect the influence of confining pressure on brittleness. The changes of B3 and B4 with confining pressure are consistent, showing that their values increase with confining pressure increasing. At 5–25 MPa, the increase of B3 and B4 is small, but from 25 MPa to 35 MPa, the increase is relatively large. Bm shows a monotonically decreasing law with the increase of confining pressure, effectively reflecting the influence law of confining pressure on brittleness. In general, the calculated values of B1 and B2 showed a slight fluctuation with the confining pressure increasing, and the change law was not monotonically increasing or decreasing. Bm, B3 and B4 change monotonically with confining pressure increasing with strong regularity. Comparative analysis shows that Bm, and B1 - B4 can be used to evaluate the change of sandstone brittleness with confining pressure except for some data.
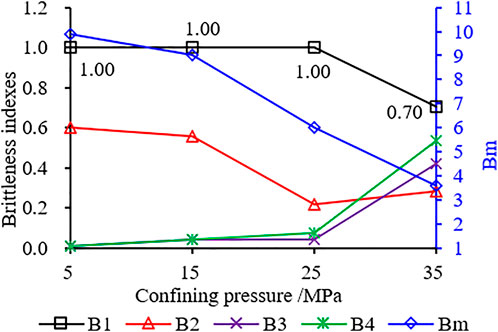
FIGURE 8. Calculation results of brittleness index for sandstone under different confining pressures.
Figure 9 shows the evaluation results of different brittleness indexes of marble in triaxial compression test under various confining pressures. At 5–35 MPa, the value of B1 decreases with the increase of confining pressure, which is 0.76, 0.30, 0.23 and 0.19 respectively. According to Table 3, at 5 MPa, the value of B1 is between 0.6321 and 1, which belongs to large brittleness. At 15–35 MPa, the value of B1 is between 0 and 0.6321, which belongs to little brittleness. The calculated results are in good agreement with the experimental results. With the increase of confining pressure, the value of B2 has little change and shows a decreasing trend. The changes of B3 and B4 are consistent with the confining pressure increasing. At 5–25 MPa, B3 and B4 increase greatly with confining pressure increasing, but from 25 MPa to 35 MPa, their values decrease with confining pressure increasing. Bm shows a monotonically decreasing with confining pressure increasing, effectively reflecting the influence law of confining pressure on brittleness. In general, the calculated values of B2 - B4 show a slight fluctuation with the increase of confining pressure, and the change law is not monotonically increasing or decreasing. Bm and B1 change monotonically with confining pressure increasing with strong regularity. Comparative analysis shows that Bm, and B1 - B4 can be used to evaluate the change of marble brittleness with confining pressure except for some data.
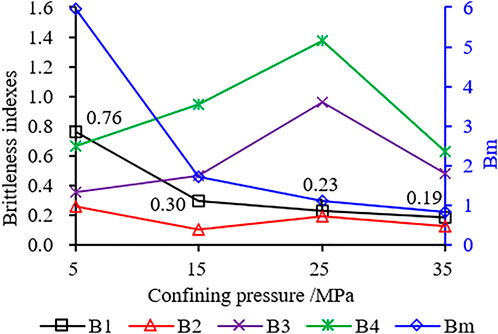
FIGURE 9. Calculation results of brittleness index for marble under different confining pressures.
Table 4 shows the evaluation results of each brittleness index of granite under different loading modes. According to Table 4, when the confining pressure is 5 MPa, the values of B1 under compression and unloading conditions are 0.85 and 0.89, respectively, and the brittleness is high under unloading conditions. The value of B2 are 0.28 and 0.26, respectively, and the brittleness is large under compression condition, which is somewhat different from the experimental results. The values of B3 and B4 under unloading condition are smaller than those under compression condition, indicating that the brittleness is larger under unloading condition. Therefore, it is concluded that Bm, B1, B3 and B4 can reflect the influence of different loading modes on granite brittleness at 5 MPa, except B2. When the confining pressure is 15 MPa, the change law of Bm, B1, and B2 is consistent, and the value under unloading condition is greater than that under compression condition, indicating that granite is more brittle under unloading condition. The change law of B3 and B4 is consistent, and the value under unloading condition is greater than that under compression condition. According to the calculation formula in Table 2, the larger the value, the smaller the brittleness. The calculation results show that the brittleness of granite under compression condition is greater, which is inconsistent with the test results. Based on the above analysis, it is concluded that Bm and B1 can effectively reflect the brittleness characteristics of granite in compression and unloading tests under different confining pressures.
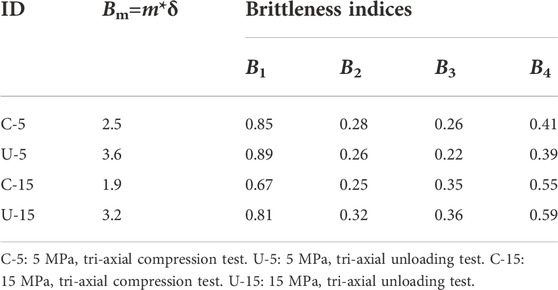
TABLE 4. Calculation results of brittleness index for granite under different loading modes.
In the process of writing this paper, the author consulted many literatures on brittleness index, only a few literatures selected constitutive parameters to evaluate rock brittleness (Chen et al., 2017; Li et al., 2017). This paper adopts the form of Bm = m*δ, which is not reported in previous two literatures. The highlight of this paper is the construction of brittleness index from the perspective of constitutive parameters. Although this method was verified by different lithologies’ test data and comparing with the existing brittleness index, as it is only a preliminary stage, this method inevitably has some shortcomings and limitations, as follows:
First, it is not convenient and efficient enough, mainly reflected in the following two aspects. 1) it is necessary to build a constitutive model to fit the stress-strain curve. 2) the new brittleness index Bm involves parameters m and δ, and the derivation and calculation process are complicated.
Second, the parameter δ fails to effectively reflect the deformation-related characteristics. In this paper, the parameter δ is the square root of the ratio of residual strength to peak strength (
Third, when the residual stage is not obvious, the determination of parameter δ is subjective.
1) The thermal-mechanical-damage statistical constitutive model based on the Weibull distribution function has good expression ability. By setting up reasonable constitutive parameters, it can express many kinds of constitutive behaviors, such as brittleness, plasticity, strain softening and so on.
2) A brittleness evaluation method, based on parameters of the thermal-mechanical-damage statistical constitutive model, has been proposed by selecting the parameters m and δ, and the brittleness index expression is Bm=m·δ. The parameter m can effectively reflect the overall characteristics of the rock stress-strain curve and δ can reflect the postpeak characteristics.
3) When the confining pressure is 5–30 MPa, granite changes from typical brittle fracture to strain softening with the increase of confining pressure, and the proportion of shear cracks increases continuously. Bm values were 2.5, 1.9, 1.8 and 1.4, respectively. The calculated results are consistent with the experimental law, which can effectively reflect the characteristic of brittleness decreasing with confining pressure increasing.
4) When the confining pressure is 5–35 MPa, sandstone changes from typical brittle fracture to plastic deformation with the increase of confining pressure, and the proportion of shear cracks increases continuously. Bm values were 9.9, 9.0, 6.0, and 3.6, respectively. The calculated results are consistent with the experimental law, which also can effectively reflect the characteristic of brittleness decreasing with confining pressure increasing.
5) When the confining pressure is 5–35 MPa, marble changes form typical brittle fracture to plastic deformation with the increase of confining pressure, and the plastic deformation value increases, and the failure mode changes from tensile to shear. Bm values were 6.0, 1.7, 1.1, and 0.8, respectively. The calculated results are consistent with the experimental law, which can effectively reflect the characteristic of brittleness decreasing with confining pressure increasing too.
6) When the confining pressure is 5MPa, Bm values were 3.6 and 2.5 under unloading and loading conditions, respectively. For confining pressure 15MPa, Bm values were 3.2 and 1.9 under unloading and loading conditions, respectively. It can be seen that the proposed index Bm can effectively reflect the characteristics of rock brittleness under unloading test.
7) The brittleness index Bm can effectively reflect the effects of different loading modes, confining pressures and lithology on rock brittleness. Under the same conditions, the brittleness of rock under triaxial unloading test is larger than that under triaxial compression test, and the brittleness of rock under low confining pressure is larger than that under high confining pressure.
The original contributions presented in the study are included in the article/Supplementary Material, further inquiries can be directed to the corresponding authors.
MG and YG were responsible for writing and method. YZ and ZH carried out the tests and data analyzing. QY and QH were making comparation analyzing. TL was responsible for review and proofreading.
This work was supported in part by the National Natural Science Foundation of China (Nos. 42130719, U19A20111, 42107211, and 42107281), Opening fund of State Key Laboratory of Geohazard Prevention and Geoenvironment Protection (Chengdu University of Technology) (Nos. SKLGP 2017Z001 and SKLGP 2022K014), the Opening Foundation of Key Laboratory of Geohazard Prevention of Hilly Mountains, Ministry of Natural Resources (Fujian Key Laboratory of Geohazard Prevention) (Grant No. FJKLGH 2022K005), and the On-campus Talent Introduction Project at Xihua University (No. Z201125).
The authors declare that the research was conducted in the absence of any commercial or financial relationships that could be construed as a potential conflict of interest.
All claims expressed in this article are solely those of the authors and do not necessarily represent those of their affiliated organizations, or those of the publisher, the editors and the reviewers. Any product that may be evaluated in this article, or claim that may be made by its manufacturer, is not guaranteed or endorsed by the publisher.
Ai, C., Zhang, J., Li, Y. W., Zeng, J., Yang, X. L., and Wang, J. G. (2016). Estimation criteria for rock brittleness based on energy analysis during the rupturing process. Rock Mech. Rock Eng. 49 (12), 4681–4698. doi:10.1007/s00603-016-1078-x
Aligholi, S., Lashkaripour, G. R., and Ghafoori, M. (2017). Strength/Brittleness classification of igneous intact rocks based on basic physical and dynamic properties. Rock Mech. Rock Eng. 50 (1), 45–65. doi:10.1007/s00603-016-1106-x
Altindag, R. (2010). Assessment of some brittleness indexes in rock-drilling efficiency. Rock Mech. Rock Eng. 43 (3), 361–370. doi:10.1007/s00603-009-0057-x
Altindag, R., and Guney, A. (2010). Predicting the relationships between brittleness and mechanical properties (UCS, TS and SH) of rocks. Int. J. Sci. Res. Essays 5 (16), 2107–2118. doi:10.1371/journal.pone.0012158
Andreev, G. E. (1995). Brittle failure of rock materials: Test results and constitutive models. Rotterdam: Balkema, 446.
Bishop, A. W. (1967). “Progressive failure with special reference to the mechanism causing it,” in Proceedings of the geotechnical conference, Oslo, 142–150.
Cao, R. L., He, S. H., Wei, J., and Wang, F. (2013). Study of modified statistical damage softening constitutive model for rock considering residual strength. Chin. J. Rock Soil Mech. 34 (6), 1652–1660. doi:10.16285/j.rsm.2013.06.018
Cao, W. G., and Li, X. (2008). A new discussion on damage softening statistical constitutive model for rocks and method for determining its parameters. Rock Soil Mech. 29 (11), 2952–2956. doi:10.3969/j.issn.1000-7598.2008.11.011
Chen, G. Q., Jiang, W. Z., Sun, X., Zhao, C., and Qin, C’A. (2019). Quantitative evaluation of rock brittleness based on crack initiation stress and complete stress-strain curves. Bull. Eng. Geol. Environ. 78 (8), 5919–5936. doi:10.1007/s10064-019-01486-2
Chen, H. R., Qin, S. Q., Xue, L., Yang, B. C., Zhang, K., and Wu, X. W. (2017). Characterization of brittle failure of rock and limitation of Weibull distribution. Prog. Geophys. 32 (5), 332–338. doi:10.6038/pg20170548
Cho, D., and Perez, M. (2014). “Rock quality assessment for hydraulic fracturing: A rock physics perspective,” in Proceedings of the 2014 SEG Annual Meeting, Society of Exploration Geophysicists, 2814–2818.
Coates, D. F., and Parsons, R. (1966). Experimental criteria for classification of rock substances. Int. J. Rock Mech. Min. Sci. Geomechanics Abstr. 3, 181–189. doi:10.1016/0148-9062(66)90022-2
Cui, S. H., Pei, X. J., Jiang, Y., Wang, G. H., Fan, X. M., Yang, Q. W., et al. (2021). Liquefaction within a bedding fault: Understanding the initiation and movement of the Daguangbao landslide triggered by the 2008 Wenchuan Earthquake (Ms = 8.0). Eng. Geol. 295, 106455. doi:10.1016/j.enggeo.2021.106455
Gao, M. B., Cui, S. H., Li, T. B., Ma, C. C., Wu, Z. T., Zhang, Y., et al. (2022). Investigation on the expression ability of a developed constitutive model for rocks based on statistical damage theory. Lithosphere 2022, 13. doi:10.2113/2022/9874408
Gong, F. Q., and Wang, Y. L. (2022). A new rock brittleness index based on the peak elastic strain energy consumption ratio. Rock Mech. Rock Eng. 55, 1571–1582. doi:10.1007/s00603-021-02738-y
Gong, Q. M., and Zhao, J. (2007). Influence of rock brittleness on TBM penetration rate in Singapore granite. Tunn. Undergr. Space Technol. 22 (3), 317–324. doi:10.1016/j.tust.2006.07.004
Goodway, B., Chen, T. W., and Downton, J. (1999). Improved AVO fluid detection and lithology discrimination using Lamé petrophysical parameters; “λρ”, “μρ”, & “λ/μ fluid stack”, from P and S inversions. in SEG technical program expanded abstracts, 183–186. doi:10.1190/1.1885795
Hajiabdolmajid, V., and Kaiser, P. (2003). Brittleness of rock and stability assessment in hard rock tunneling. Tunn. Undergr. Space Technol. 18 (1), 35–48. doi:10.1016/S0886-7798(02)00100-1
He, Z. H., Pei, X. J., Cui, S. H., Sun, W. T., Luo, L. G., and He, C. R. W. (2021). Investigation on physicomechanical properties and constitutive model of tuff in Mila mountain tunnel under dry and saturated conditions. Adv. Civ. Eng. 2021, 1–12. doi:10.1155/2021/7725185
Heidari, M., Khanlari, G. R., Torabi-Kaveh, M., Kargarian, S., and Saneie, S. (2014). Effect of porosity on rock brittleness. Rock Mech. Rock Eng. 47, 785–790. doi:10.1007/s00603-013-0400-0
Holt, R. M., Fjær, E., Stenebraten, J. F., and Nes, O. M. (2015). Brittleness of shales: Relevance to borehole collapse and hydraulic fracturing. J. Pet. Sci. Eng. 131, 200–209. doi:10.1016/j.petrol.2015.04.006
Hucka, V., and Das, B. (1974). Brittleness determination of rocks by different methods. Int. J. Rock Mech. Min. Sci. Geomechanics Abstr. 11 (10), 389–392. doi:10.1016/0148-9062(74)91109-7
Jarvie, D. M., Hill, R. J., Ruble, T. E., and Pollastro, R. M. (2007). Unconventional shale-gas systems: The mississippian barnett shale of north-central Texas as one model for thermogenic shale-gas assessment. Am. Assoc. Pet. Geol. Bull. 9 (4), 475–499. doi:10.1306/12190606068
Jin, X. C., Shah, S. N., Truax, J. A., and Roegiers, J. C. (2014). “A practical petrophysical approach for brittleness prediction from porosity and sonic logging in shale reservoirs,” in SPE Conference. doi:10.2118/170972-MS
Kahraman, S. (2002). Correlation of TBM and drilling machine performances with rock brittleness. Eng. Geol. 65 (4), 269–283. doi:10.1016/S0013-7952(01)00137-5
Lemaitre, J. (1985). A continuous damage mechanics model for ductile fracture. J. Eng. Mat. Technol. 107 (1), 83–89. doi:10.1115/1.3225775
Li, D. Y., Sun, Z., Li, X. B., and Xie, T. (2016). Mechanical response and failure characteristics of granite under different stress paths in triaxial loading and unloading conditions. Chin. J. Rock Mech. Eng. 35 (S2), 3449–3457.
Li, H. J., He, Y. S., Xu, Q., Deng, J. H., Li, W. L., and Wei, Y. (2022). Detection and segmentation of loess landslides via satellite images: A two-phase framework. Landslides 19 (3), 673–686. doi:10.1007/s10346-021-01789-0
Li, Q. H., Chen, M., Jin, Y., Wang, F. P., Hou, B., and Zhang, B. W. (2012). Indoor evaluation method for shale brittleness and improvement. Chin. J. Rock Mech. Eng. 31 (8), 1680–1685.
Li, Y. W., Jia, D., Rui, Z. H., Peng, J. Y., Fu, C. K., and Zhang, J. (2017). Evaluation method of rock brittleness based on statistical constitutive relations for rock damage. J. Pet. Sci. Eng. 153, 123–132. doi:10.1016/j.petrol.2017.03.041
Liu, E. L., and Shen, Z. J. (2005). Study on brittleness of geomaterials. Chin. J. Rock Mech. Eng. 24 (19), 3449–3453. doi:10.3321/j.issn:1000-6915.2005.19.007
Liu, Q. S., and Xu, X. C. (2000). Damage analysis of brittle rock at high temperature. Chin. J. Rock Mech. Eng. 19 (4), 408–411.
Liu, Y. F., Guan, M., Zhao, H. T., Wang, H. P., Gao, T. Y., and Jiang, Y. (2022). Brittleness evaluation method of shale based on confining pressure correction. Acta Geophys. 70, 211–223. doi:10.1007/s11600-022-00729-3
Martin, C. D., and Chandler, N. A. (1994). The progressive fracture of Lac du Bonnet granite. Int. J. Rock Mech. Min. Sci. Geomechanics Abstr. 31 (6), 643–659. doi:10.1016/0148-9062(94)90005-1
Meng, F. Z., Zhou, H., Zhang, C. Q., Xu, R. C., and Lu, J. J. (2015). Evaluation methodology of brittleness of rock based on post-peak stress-strain curves. Rock Mech. Rock Eng. 48, 1787–1805. doi:10.1007/s00603-014-0694-6
Nygård, R., Gutierrez, M., Bratli, R. K., and Høeg, K. (2006). Brittle-ductile transition, shear failure and leakage in shales and mudrocks. Mar. Pet. Geol. 23 (2), 201–212. doi:10.1016/j.marpetgeo.2005.10.001
Obert, L., and Duvall, W. I. (1967). Rock mechanics and the design of structures in rock. New York: Wiley, 78–82.
Parsajoo, M., Armaghani, D. J., and Asteris, P. G. (2022). A precise neuro-fuzzy model enhanced by artificial bee colony techniques for assessment of rock brittleness index. Neural comput. Appl. 34, 3263–3281. doi:10.1007/s00521-021-06600-8
Qin, S. Q., Xu, X. W., Hu, P., Wang, Y. Y., Huang, X., and Pan, X. H. (2010). Brittle failure mechanism of multiple locked patches in seismogenic fault system and exploration on a new way for earthquake prediction. Chin. J. Geophys 53 (4), 1001–1014. doi:10.3969/j.issn.0001-5733.2010.04.025
Reichmuth, D. R. (1967). “Point load testing of brittle materials to determine tensile strength and relative brittleness,” in The 9th US Symposium on Rock Mechanics (USRMS) (American Rock Mechanics Association), p134–p159.
Rickman, R., Mullen, M., Petre, E., Grieser, B., and Kundert, D. (2008). “A practical use of shale petrophysics for stimulation design optimization: All shale plays are not clones of the barnett shale,” in SPE annual technical conference and exhibition, society of petroleum engineers. doi:10.2118/115258-MS
Si, G. C., Ge, X. R., and Lu, Y. D. (2006). Experimental study on coefficients of brittle stress drop of marble. Chin. J. Rock Mech. Eng. 25 (8), 1625–1631. doi:10.3321/j.issn:1000-6915.2006.08.016
Tarasov, B. G., and Potvin, Y. (2013). Universal criteria for rock brittleness estimation under triaxial compression. Int. J. Rock Mech. Min. Sci. (1997). 59, 57–69. doi:10.1016/j.ijrmms.2012.12.011
Wang, F. (2014). Microscopic fracture mechanisms of hard rock and rock burst prediction criterion under H-M coupling Effects. Chengdu: Chengdu university of technology, 18–20.
Wang, H., Wu, T., Fu, X., Liu, B., Wang, S., Jia, R., et al. (2019). Quantitative determination of the brittle-ductile transition characteristics of caprocks and its geological significance in the Kuqa depression, Tarim Basin, Western China. J. Pet. Sci. Eng. 173, 492–500. doi:10.1016/j.petrol.2018.10.042
Wang, W., Wang, Y., Chai, B., Du, J., Xing, L. X., and Xia, Z. H. (2022). An energy based method to determine rock brittleness by considering rock damage. Rock Mech. Rock Eng. 55, 1585–1597. doi:10.1007/s00603-021-02727-1
Wang, Y., Li, X., Wu, Y. F., Beng, Y. X., Li, D. S., Hao, J. M., et al. (2014). Research on relationship between crack initiation stress level and brittleness indices for brittle rocks. Chin. J. Rock Mech. Eng. 33 (2), 264–275. doi:10.13722/j.cnki.jrme.2014.02.003
Wang, Z. L., Li, Y. C., and Wang, J. G. (2007). A damage-softening statistical constitutive model considering rock residual strength. Comput. Geosciences 33 (1), 1–9. doi:10.1016/j.cageo.2006.02.011
Xia, Y. J., Li, L. C., Tang, C. A., Li, X. Y., Ma, S., and Li, M. (2017). A new method to evaluate rock mass brittleness based on stress–strain curves of class I. Rock Mech. Rock Eng. 50, 1123–1139. doi:10.1007/s00603-017-1174-6
Xu, Z. Y. (2014). Effect of heterogeneity of brittle rock on fracture mechanism under thermal-mechanical coupling effect. Chengdu: Chengdu university of technology, 14–17.
Yagiz, S. (2009). Assessment of brittleness using rock strength and density with punch penetration test. Tunn. Undergr. Space Technol. 24 (1), 66–74. doi:10.1016/j.tust.2008.04.002
Yin, T. B., Ma, J. X., Wu, Y., Zhuang, D. D., and Yang, Z. (2022). Effect of high temperature on the brittleness index of granite an experimental investigation. Bull. Eng. Geol. Environ. 81, 476. doi:10.1007/s10064-022-02953-z
Zhang, D., Ranjith, P. G., and Perera, M. S. A. (2016). The brittleness indices used in rock mechanics and their application in shale hydraulic fracturing: A review. J. Pet. Sci. Eng. 143, 158–170. doi:10.1016/j.petrol.2016.02.011
Zhang, F. J., Deng, S. G., Zhao, H., and Liu, X. (2022). A new hybrid method based on sparrow search algorithm optimized extreme learning machine for brittleness evaluation. J. Appl. Geophys. 207, 104845. doi:10.1016/j.jappgeo.2022.104845
Zhang, Y., Feng, X. T., Yang, C. X., Han, Q., Wang, Z. F., and Kong, R. (2021). Evaluation method of rock brittleness under true triaxial stress states based on pre-peak deformation characteristic and post-peak energy evolution. Rock Mech. Rock Eng. 54, 1277–1291. doi:10.1007/s00603-020-02330-w
Zhong, Y. Y. (2017). Research on mechanical properties of marble and the effects on rock burst under thermal-mechanical coupling. Chengdu: Chengdu university of technology, 70–75.
Zhou, H., Meng, F. Z., Zhang, C. Q., Xu, R. C., and Lu, J. J. (2014). Quantitative evaluation of rock brittleness based on stress-strain curve. Chin. J. Rock Mech. Eng. 33 (6), 1114–1122. doi:10.13722/j.cnki.jrme.2014.06.004
Zhou, J. R., Wei, J., Yang, T. H., Zhang, P. H., Liu, F. Y., and Chen, J. K. (2021). Seepage channel development in the crown pillar: Insights from induced microseismicity. Int. J. Rock Mech. Min. Sci. 145 104851. doi:10.1016/j.ijrmms.2021.104851
Keywords: hard rocks, statistical damage constitutive model, stress-strain curve, brittleness index, weibull distribution
Citation: Gao M, Li T, Gao Y, Zhang Y, Yang Q, He Z and He Q (2023) A method to evaluation rock brittleness based on statistical damage constitutive parameters. Front. Earth Sci. 10:1020834. doi: 10.3389/feart.2022.1020834
Received: 16 August 2022; Accepted: 07 November 2022;
Published: 16 January 2023.
Edited by:
Jingren Zhou, Sichuan University, ChinaReviewed by:
Chang’An Qin, Beijing University of Civil Engineering and Architecture, ChinaCopyright © 2023 Gao, Li, Gao, Zhang, Yang, He and He. This is an open-access article distributed under the terms of the Creative Commons Attribution License (CC BY). The use, distribution or reproduction in other forums is permitted, provided the original author(s) and the copyright owner(s) are credited and that the original publication in this journal is cited, in accordance with accepted academic practice. No use, distribution or reproduction is permitted which does not comply with these terms.
*Correspondence: Tianbin Li, bHRiQGNkdXQuZWR1LmNu; Yan Zhang, emhhbmd5YW4yMDIwQGNkdXQuZWR1LmNu
Disclaimer: All claims expressed in this article are solely those of the authors and do not necessarily represent those of their affiliated organizations, or those of the publisher, the editors and the reviewers. Any product that may be evaluated in this article or claim that may be made by its manufacturer is not guaranteed or endorsed by the publisher.
Research integrity at Frontiers
Learn more about the work of our research integrity team to safeguard the quality of each article we publish.