 Zhengshuai Zhang
 Jianchang Zheng1*
 Fangbin Liu
- 1Shandong Earthquake Agency, Jinan, China
- 2Hebei Key Laboratory of Earthquake Dynamics, Sanhe, China
- 3School of Earth Sciences and Resources, China University of Geosciences, Beijing, China
- 4Key Laboratory of Western China’s Environmental Systems, Ministry of Education, College of Earth and Environmental Sciences, Lanzhou University, Lanzhou, China
In this paper, we collected the seismic phase arrival data of 14,033 local natural earthquakes above magnitude 3.0 recorded by 435 seismograph stations in the study area provided by the International Seismological Centre (ISC), covering the period from January 2011 to April 2020. We selected the first arrival P- and S-wave arrival time data and obtained 281,859 P- and 112,926 S-wave absolute arrival times and 528,250 P-differential and 207,968 S-differential arrival times. Then we determined 3-D P and S wave velocity structures from the Japan Trench to the back arc area under the Japan Islands by using double-difference tomography method. The results show strong lateral heterogeneities under the forearc region. The subducting Pacific slab is imaged clearly as a high-velocity (high-V) faster than the surrounding mantle. Low-velocity (low-V) zones are imaged in the mantle wedge with significant along arc variations under the volcanic front. The vertical section shows that the low velocity zone extends to a depth of approximately 70–150 km below the arc. The crust and mantle wedges beneath the front and back arcs of the volcanoes reveal a low-V anomaly, the likely main source of which is the partial melting of plate and mantle wedge material. Referring to the previous results of plate dehydration, mineral composition and thermal state, it is found that fluids play a crucial role in the arc magmatism and plate melting of mantle wedge behind Japan Trench. The fluids brought down by the Pacific subducting plate are released into the mantle wedge by dehydration and subsequently transported upward by the upwelling flow in the mantle wedge. The present results obtained using new and advanced imaging methods enrich the understanding of the velocity structure beneath Japan Islands, which may improve the understanding of the dynamic processes of subduction zones and mantle upwelling.
1 Introduction
The Northwest Pacific subduction zone is located at the eastern edge of the Eurasian continent, and is a product of the mutual subduction and collision between the Eurasian plate, the Pacific plate, the Philippine Sea (PHS) plate and the Okhotsk plate (Bird, 2003; DeMets et al., 2010), as shown in Figure 1. Strong interactions of the four lithospheric plates control the geological structure and tectonic evolution of this region, which are characterized by active subduction of oceanic plates (i.e., the Pacific and PHS plates). The Pacific plate is subducting under the Okhotsk and Philippine Sea plates at a rate of 8∼9 cm yr−1 from the Japan Trench (DeMets et al., 1994). From the southeast the Philippine Sea plate is descending beneath SW Japan at a rate of 4–5 cm yr−1 (Heki and Miyazaki, 2001; Miyazaki and Heki, 2001; Huang et al., 2011). Intensive seismicity, arc mechanisms, and volcanic activity are caused by the subduction process. In the upper mantle, the temperature varies laterally from several hundred to over 1,400°C due to the subduction processes and related magmatic and volcanic activities (Honda, 1985; Wada et al., 2015; Wang and Zhao, 2019). Abundant fluids released from the subducting Pacific and PHS slabs participate in mantle convection, making the dynamic processes beneath the Japan Islands even more vigorous and complicated (Zhao, 2017; Niu et al., 2018). These features make the Japan Islands an ideal place to understand subduction dynamics. Subduction zones are an important link in understanding material circulation and energy exchange in the Earth, continental lithosphere evolution, seismic and volcanic activities, and distribution of mineral resources. Subduction zones have become a research hotspot in the field of Earth sciences (Zhang et al., 2019; Wang et al., 2020; Yang et al., 2021). The high-resolution seismic tomography can provide an effective technical way to understand and explore these scientific issues. Since the end of the last century, with the continuous advancement of Earth science theories, methods and computing power, Earth scientists can not only observe the current surface geological processes of the Pacific Northwest subduction zone, but also explore its deep structural features and understand its evolution process. Among them, seismic tomography methods provide great constraints for identifying subducting plate morphology, discussing the physicochemical properties of the mantle wedge, and understanding the origin of island arc volcanoes and related geodynamic processes (Zhao et al., 1992; Zhao et al., 1994; Huang and Zhao, 2006; Wang and Zhao, 2008; Wang and Zhao, 2009; Wang and Zhao, 2010; Wang and Zhao, 2012; Wei et al., 2012; Zhao et al., 2012; Zhao et al., 2013; Zhao et al., 2015; Tao et al., 2018; Wang and Zhao, 2019; Zhao, 2021; Wang et al., 2022). It is of great importance to investigate the detailed 3-D crustal and mantle structure of this typical subduction zone so as to better understand the seismotectonics, volcanism and subduction dynamics.
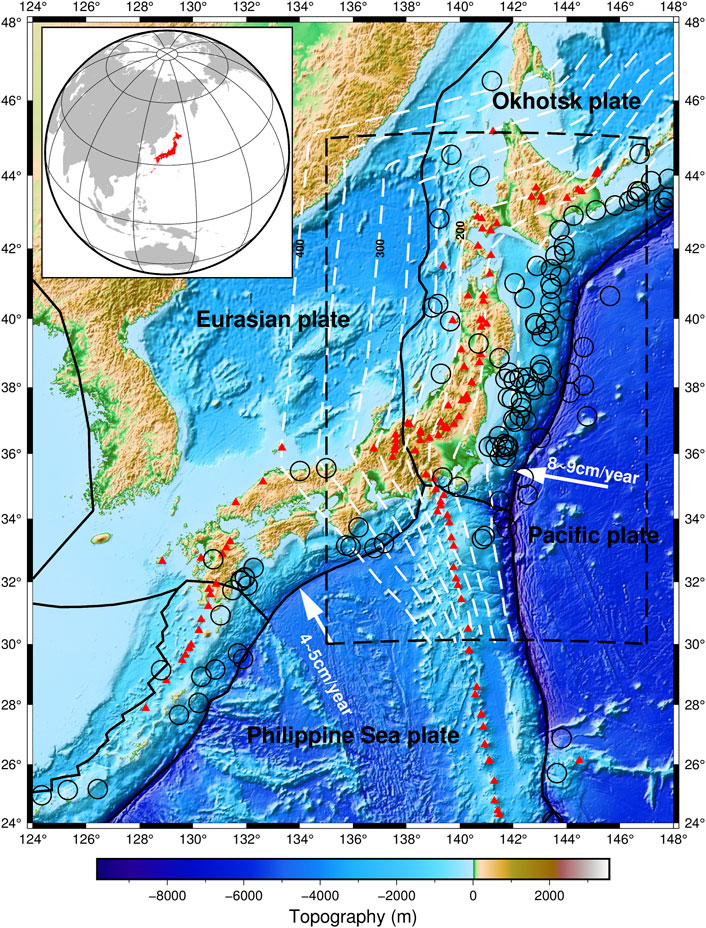
FIGURE 1. Seismicity in the study region (black pane) and surrounding regions. Major tectonic units are labeled, including the Pacific Plate, Philippine Sea Plate, Eurasian Plate, Okhotsk Plate. The solid white arrow represents the subduction direction of plate. The red triangles denote the active arc volcanoes. Plate boundary data are from Bird (2003). The white dotted line represents the depth of the subducting Pacific plate (Zhao et al., 2012). The top left sub-map represents the location of the island of Japan in the world.
In the last decades, many researchers have used seismic tomography to investigate the 3-D seismic velocity structure beneath Japan (Zhao et al., 2002; van Keken, 2003; Hasegawa et al., 2005; Zhao et al., 2007; Zhao et al., 2009; Huang et al., 2011). These tomographic studies have greatly improved the understanding of arc magmatism, seismogenesis and plate subductions in this region. Tomography was first proposed by Aki et al. (1977). Following, natural seismic tomography methods have been gradually developed and perfected, and new technologies such as travel-time tomography, finite frequency tomography, seismic wave attenuation tomography, and background noise layer imaging have emerged. Zhang and Thurber developed a double-difference tomography method (tomoDD) (Zhang, 2003; Zhang and Thurber, 2006), using both absolute and differential arrival times in a joint solution for event locations and velocity structure. Differential arrival times is mainly used to determine the fine structure of the source area, and arrival times are mainly used to determine the velocity structure of the area outside the source area. With standard absolute travel-time tomography, seismic event locations are somewhat scattered due to errors such as inaccurate pickup of the seismic phase, but in tomoDD, the use of the differential arrival times removes most of these errors, which will in turn remove some fuzziness from the velocity model. In addition, Since the double-difference tomography method takes into account the spatial variation of the velocity structure of the medium, it overcomes the assumption that the path between the station and the event pair is a constant velocity for the double-difference positioning pair, the earthquake event location results obtained are more accurate. The velocity model obtained with double difference tomography should also be superior to that from standard absolute travel-time tomography. The tomoDD method can reveal the detailed seismic velocity structure than standard absolute travel-time tomography methods. The tomoDD has been widely used to study the fine structure of basins, volcanoes and active fault areas (Zhang et al., 2004; Statz-Boyer et al., 2009; Panayotopoulos et al., 2014; Wang et al., 2018; Xin et al., 2019; Zhang et al., 2021).
In this work, we collected a large number of high-quality the seismic phase data that covers the Japan Islands densely and uniformly. we applied advanced double-difference tomography method to the Japan subduction zone dataset to obtain a more detailed model of the 3-D P- and S-wave velocity structure of the subduction zone around and within the subducting slab. Combined with previous analyses of mineralogical composition, thermal structure and attenuation imaging, the results of this paper provide further insight into the structure and dynamics of the Japanese subduction zone.
2 Data and method
In this paper, we collected the seismic phase data of natural earthquakes above 3.0 in the research region (130o-146oE,30o-45oN) and covered the period from January 2011 to April 2020 provided by International Seismological Centre (ISC). The distribution of earthquakes is shown in Figure 2A. In order to improve the resolution of the lithospheric structure, seismic phase data including Pg, Sg, Pn, Sn, P, and S were collected. Firstly, since the raw data format is different from the standard format followed by tomoDD, we wrote a program script to convert it to the standard input format. Then, we extract the first arrival seismic phases of different stations. Secondly, in order to ensure the data quality, we preferentially selected the travel time data according to the following principles: 1) the original data with travel time residuals kept within ±5 s are selected; 2) all selected events need to be recorded by at least 10 stations. After this selection, there are a total of 14,033 earthquake events, and then we used the ph2dt executable program in the hypoDD software to construct differential travel-times for event pairs that will be used for double-difference tomography (Waldhauser, 2002). It is required that the number of event pair links should be within the range of 10–600 and the maximum hypocentral separation should be no more than 10 km. Figures 3A,B show the distribution of seismic rays in the longitudinal and latitudinal planes for P- and S-waves, respectively. Seismic rays basically cover the Japan Islands from the Japan Trench to the back arc area. Figures 3C,D show the distribution of rays in the depth range for P- and S-wave, respectively. Due to the lack of the data recorded by ocean bottom seismometers in the Sea of Japan, there is a clear lack of ray coverage west of longitude 138° from Figures 3C,D. Finally, we obtained a total of 281,859 absolute P- and 112,926 absolute S-wave arrivals and 528,250 P- and 207,968 S-differential arrival times from 14,033 local earthquakes were recorded by 435 seismograph stations. Figure 3E shows the P- and S-wave travel-time distance curves for all selected earthquakes.
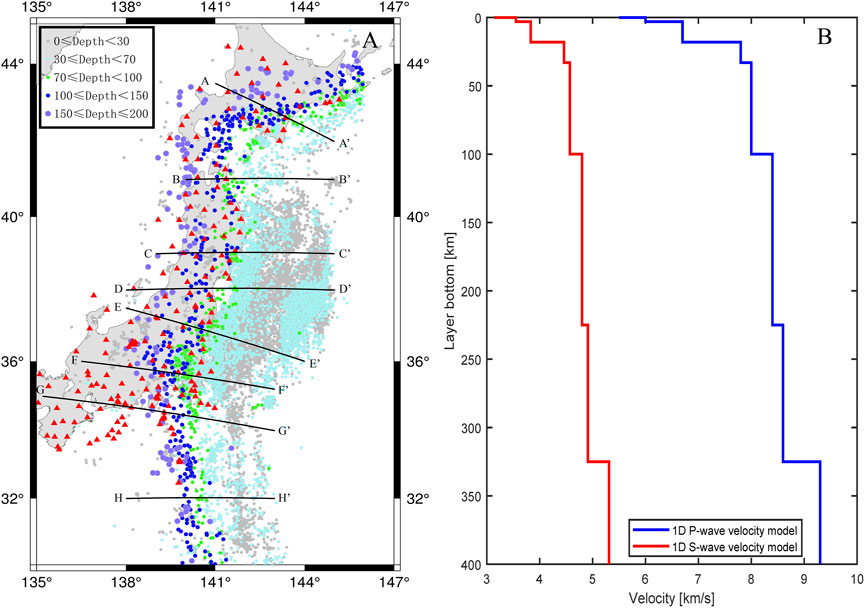
FIGURE 2. (A) Spatial distribution of the data set and 8 profiles location shown on the inset map. (B) The One-dimensional initial velocity model.
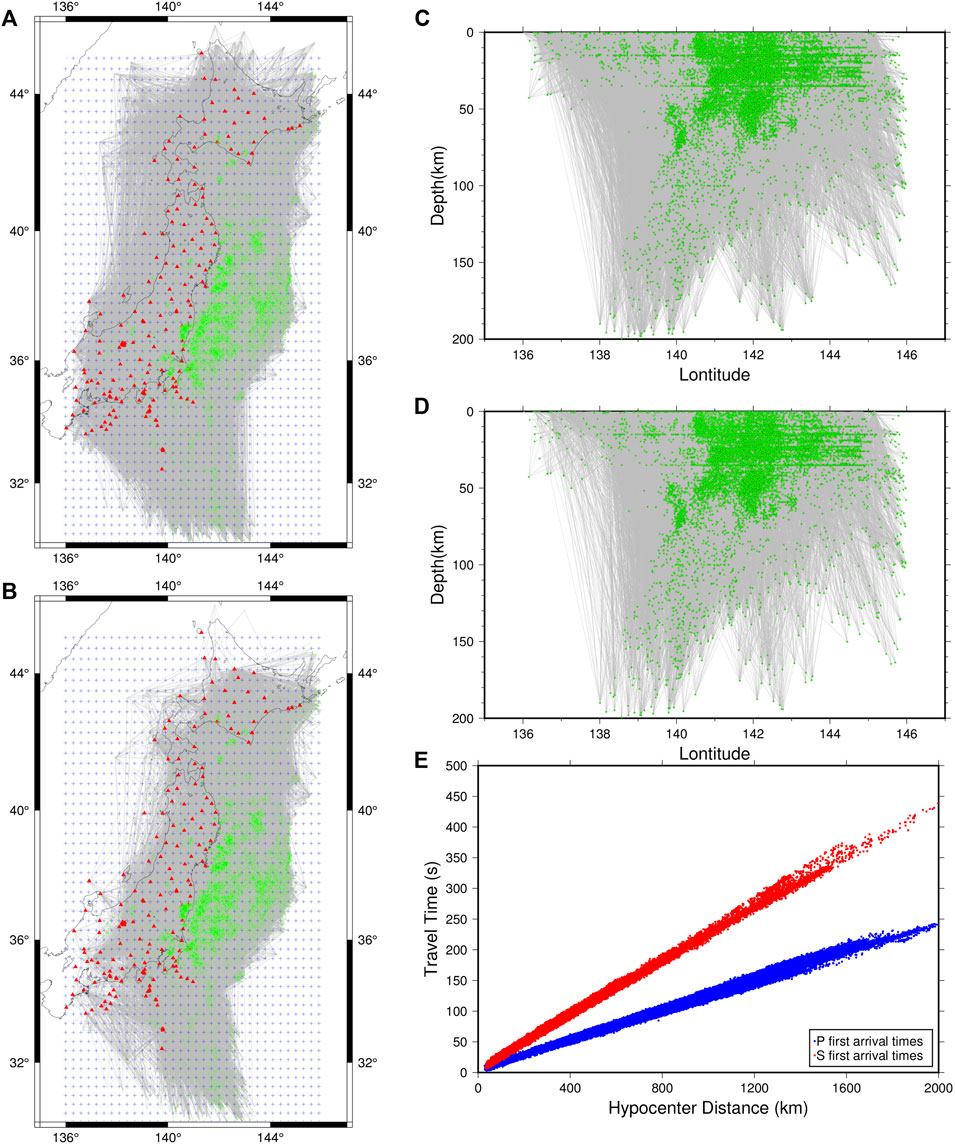
FIGURE 3. Seismic ray paths of P-wave (A) and S-wave (B) in the studied. Red triangles indicate seismic stations, green solid dots indicate earthquake locations, and blue crosses indicate inversion grid points. Seismic ray paths of P-wave (C) and S-wave (D) vertical projection; (E) Travel time distance curves of P and S wave.
The double-difference tomography is an efficient method for charactering the local and regional velocity structures and earthquake hypocenters. The double-difference tomography algorithm uses the differential arrival times from event pairs observed on common stations to simultaneously determine seismic event locations and velocity structure. The theoretical principle of tomoDD is that it is assumed that two seismic events are similar in spatial distance, recorded by the same seismic station and their seismic ray paths to the same station are similar. For a pair of events
where
Assuming that two seismic events are near each other so that the paths from the events to a common station are almost identical and the velocity structure is known, then Equation 3 can be simplified as
where
3 Inversion details and regularization parameter
Double-difference tomography algorithm is essentially based on linear inversion, so a reliable initial velocity model is necessary (Comte et al., 2016). Here, we used an initial One-dimensional velocity model considering both shallow and deep parts (Kubo et al., 2002), and translated it to a three-dimensional velocity grid model. The initial P and S velocity model is shown in Figure 2B. The nodes of the velocity model grid are shown in Figure 3A, and node spacing is 0.3°in the latitude and the longitude direction (as shown in Figures 3A,B in the blue cross grid), and inversion nodes in the vertical direction are located at 10, 30, 50, 80,120,150,200 and 250 km depth. In the current version of tomoDD, we use the pseudo-bending ray-tracing algorithm (Um and Thurber, 1987) to find the rays and calculate the travel-times between events and stations. The model is represented as a regular set of 3-D nodes, and the velocity values are interpolated by using the trilinear interpolation method. In the process of inversion, the velocity values on grid nodes are updated, and the velocity values between grid nodes are obtained by linear interpolation (Zhang, 2003). Two types of data, the absolute arrival times, the catalog differential arrival times are used in the inversion. To combine these two types of data into one system, we apply a hierarchical weighting scheme during the inversion, similar to the double-difference hypocenter locations (hypoDD). We first give more weight to the absolute data to obtain the large-scale velocity structure, and then gradually reduce the weight of the absolute data while increase the weight of the differential data. In this way, fine-scale velocity structures in the source region can be obtained. A total of 10 iterations are carried out in the whole inversion process, with two simultaneous seismic relocation and velocity tomography and one seismic relocation only performing alternately.
The complete system of linear Eqs 2, 3, along with the smoothing constraint equations, is solved by means of the LSQR algorithm (Paige and Saunders, 1982) for the damped least-squares problem. The trade-off of damping and smoothing weight parameters has a greater impact on the stability of the inversion results (Eberhart-Philips, 1986; Eberhart-Phillips and Michael, 1993; Lin et al., 2010). Therefore, in order to make the inversion more stable, we tested the damping factor (from 10 to 1,500) and the smoothing weight factor (from 0.001 to 10,000), and the equilibrium curve of the data variance and the model variance is drawn (Figure 4). Since the optimal regularization parameter corresponds to the point with the maximum curvature of the L-curve, and the point is called the L-corner, so the use of L-curve method to choose the optimal regularization parameter is actually to find the L-corner. After trade-off analysis, we choose the best smoothing factor 20 and damping factor 300 as the control parameters in the inversion process.
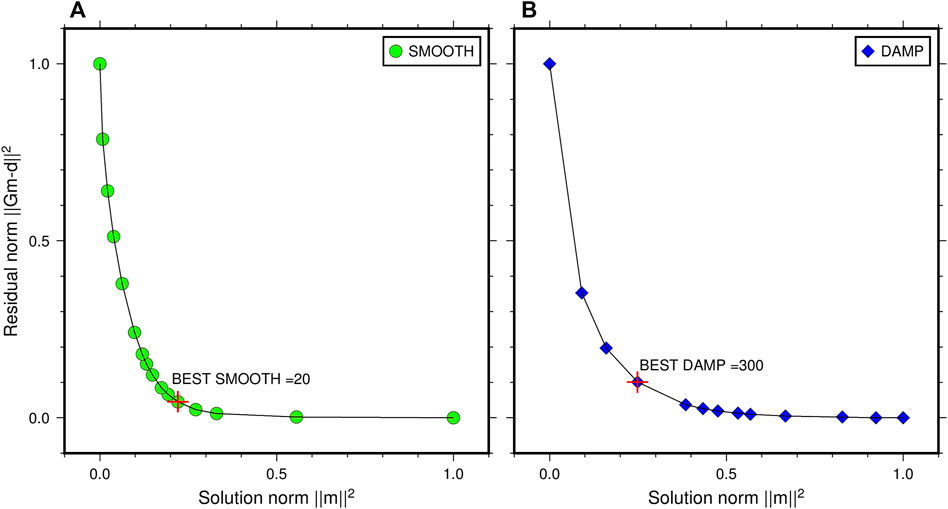
FIGURE 4. Trade-off curves of smoothing (A) and damping (B) weight parameters. The horizontal axis represents the normalized norm of slowness variation, the vertical axis represents the normalized norm of overall travel-time residual.
4 Analysis and results
Double-difference tomography can simultaneously invert the seismic position and 3-D P- and S-wave velocity structure. Figure 5 shows the P- and S-wave travel-time residuals histogram before and after earthquake relocation. Figure 5A shows that the initial P-wave travel time residuals were mainly distributed in the range of −4 to 4 s, and the average travel time residuals were 0.87 s, while the P-wave travel time residuals were mainly distributed in the range of 0.4 s after relocation, and the average residuals were reduced to 0.26 s. Figure 5B shows that the residuals of the initial S-wave travel time were also significantly reduced from 1.19 s to 0.37 s. Figure 5C shows that the residuals of the overall seismic travel time after relocation are mainly distributed in the range of −2 to 2 s, over 75% of the data have misfits within ±0.4 s after the inversion. The average residual error decreased from 0.89 s before relocation to 0.29 s after relocation, and the accuracy of seismic location was significantly improved.
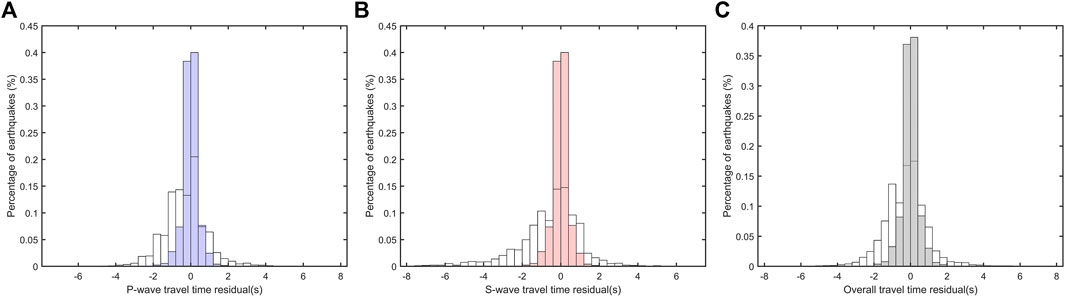
FIGURE 5. The colored filled histograms (blue filled, red filled, gray filled) represent the P-wave (A), S-wave (B) and Overall travel time (C) residuals after relocate, respectively; The unfilled histograms represent the initial travel time residuals.
Conditions such as earthquake distribution, station distribution, seismic ray density, and ray intersection will affect the resolution of the inversion results. In order to assess the ability of the inversions to recover known structure throughout the model, we conducted the checkerboard resolution tests (CRTs) to evaluate the resolutions of the 3-D tomographic structures before seismic tomography (Humphreys and Clayton, 1988). We created synthetic data with a checkerboard model (a pattern of alternate high and low attenuation elementary) by assigning ±5% positive and negative velocity anomalies to the grid nodes adjacent to P and S velocities. Secondly, use this theoretical checkerboard model to obtain the theoretical travel-time through forward calculation. Finally, according to the theoretical travel-time and the initial velocity model, each grid point velocity is inverted. It should be noted that the control parameters used in the checkboard test are consistent with the real data inversion. We made detailed resolution analyses using our dataset. Figures 6, 7 show the results of the resolution tests for P- and S-wave tomography with a grid spacing of 0.3° × 0.3°. Both the checkerboard pattern and amplitude of velocity anomalies are well reconstructed at different depth, except for the very edges of the model. Because of the use of more abundant P-wave arrival time dataset, the P-wave checkerboard resolution tests can still be reconstructed at a depth of 200 km. Compared to P-wave CRTs, S-wave CRTs shows good resolution mainly at depths <120 km, since the S-wave arrival data is about one-third the size of the P-wave. In terms of overall CRTs, main features of our tomographic results are reliable. In the actual analysis, Because the inversion uses natural seismic data, the distribution of earthquakes and stations is uneven. It is necessary to select a high-resolution region to analysis imaging results.
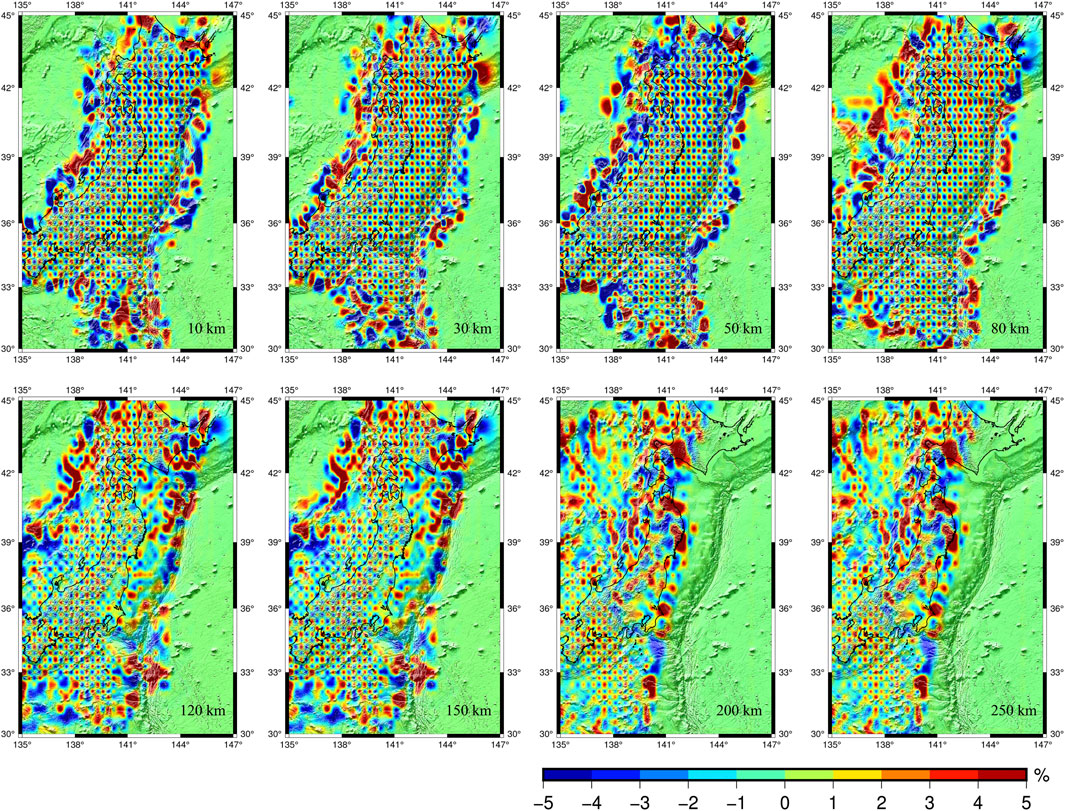
FIGURE 6. Results of a checkerboard resolution test for P-wave tomography. The velocity perturbation (in percent) scale is shown at the bottom. The amplitude of velocity perturbations is 5 percent in the input model. The layer depth is shown at the lower-right corner of each map.
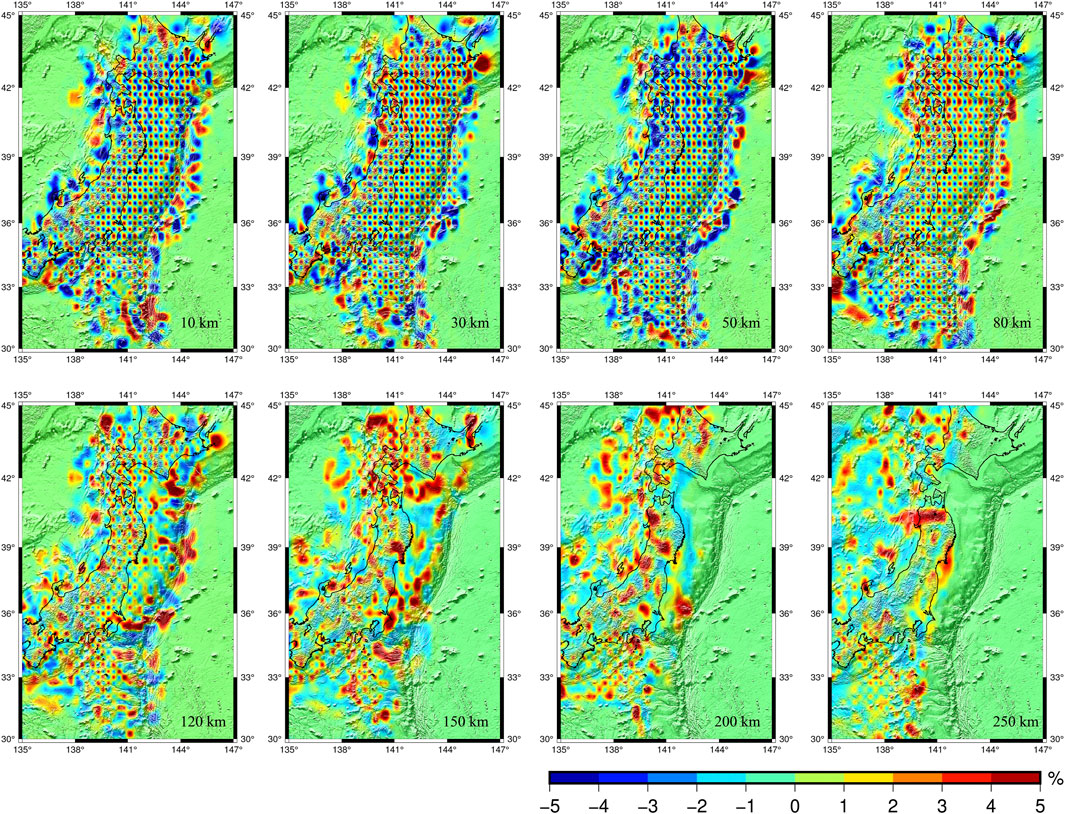
FIGURE 7. The same as Figure 6 but for a checkerboard resolution test for S-wave tomography.
Figures 8, 9 show map views of high-resolution 3-D tomographic P and S wave velocity model of the crust and mantle under the Japan subduction zone determined by this study; also shown in the maps are background seismicity distribution with in a layer of ≤30 km. Combined with the checkerboard resolution tests, this paper mainly analyzes the results of 3-D velocity structure imaging with the RES (resolution) higher than 0.7 (the highest resolution is 1). From the overall analysis, the crustal and mantle velocity structure in the study area shows obvious unevenness in the vertical and horizontal directions. This unevenness is not only manifested in different blocks, but also in the interior of the block. The most outstanding feature of Vp, Vs horizontal slice images is that two belts of negative and positive anomalies are disclosed along the volcanic front and the forearc region, respectively. As the subduction zone continues to subduct westward, the positive anomaly also expands westward. Figures 10, 11 show that the subducting Pacific slab is revealed as a high-V zone down to the mantle transition zone and Low-V exist in the mantle wedge. These features are generally consistent with the previous tomographic results in this region (Zhao et al., 1992; Nakajima et al., 2001; Huang and Zhao, 2006; Abdelwahed and Zhao, 2007; Hasegawa et al., 2009; Zhao et al., 2009; Wang and Zhao, 2010). Because seismic stations are located only on the land area, the results of this paper are also in the range of the Japan Islands and the eastern trench, so it is difficult to see the shape of the Pacific slab continuing to subduct westward. Recent regional and global tomographic models suggest that the Pacific plate has subducted to a depth of about ∼600 km below the eastern margin of the Asian continent, and then the plate stalled in the mantle transition zone in eastern China (Zhao, 2004; Huang and Zhao, 2006). The vertical cross-sections indicate significant low-V anomalies basically subparallel with the subducting slab are visible in the crust and uppermost mantle beneath the active arc volcanoes and in the middle of the mantle wedge under the back-arc side. Zhao (2004) proposed that a big mantle wedge (BMW) has formed above the stagnant slab, and the BMW exhibits low velocities under the Japan Sea and East China, which is consistent with the existence of active intraplate volcanoes (such as Changbai Mountain and Wudalianchi) and a thin lithosphere under Eastern China (Menzies et al., 2007).
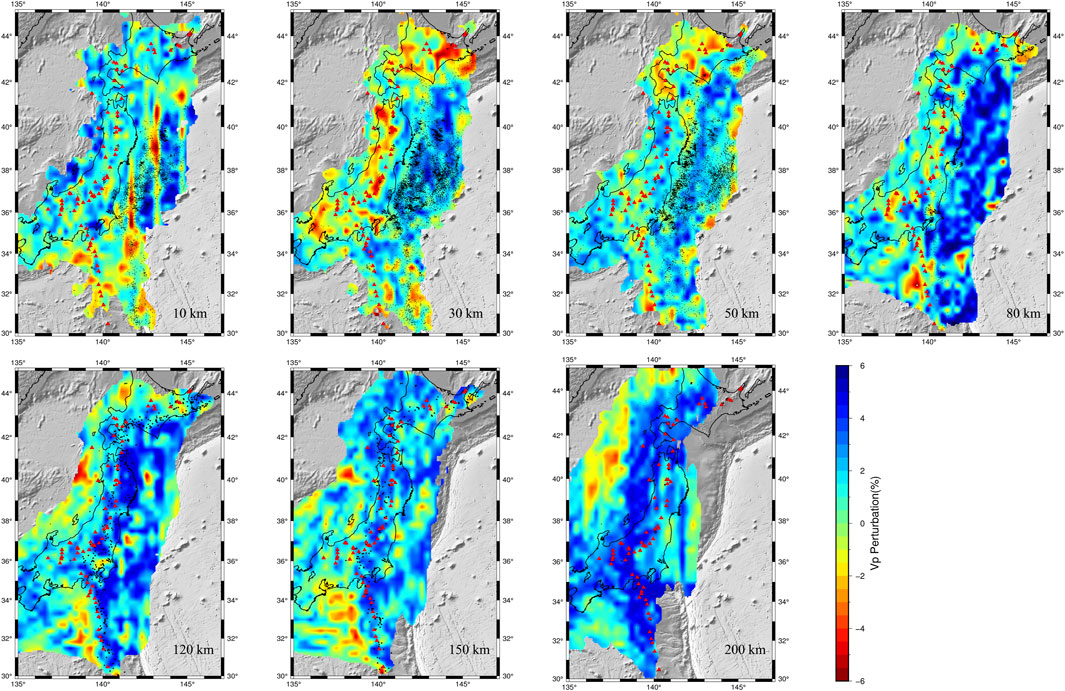
FIGURE 8. Map views of Vp structures. Black circles denote the background earthquakes that occurred within a layer of 30 km thickness bound to each slice. The red triangles denote the active arc volcanoes.
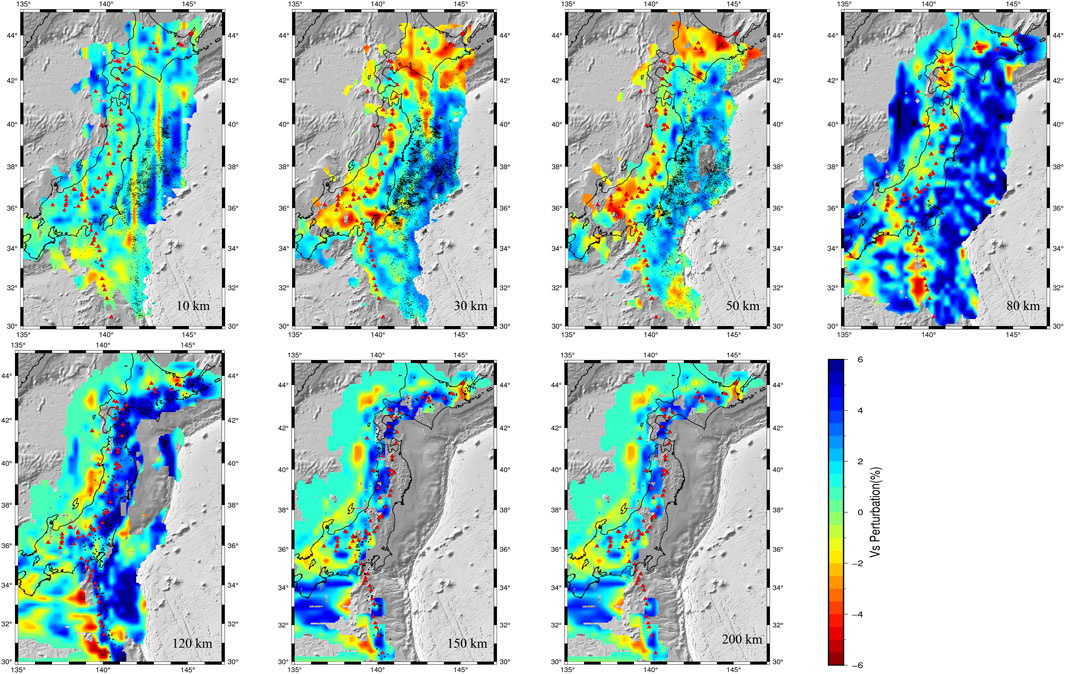
FIGURE 9. Map views of Vs structures. Black circles denote the background earthquakes that occurred within a layer of 30 km thickness bound to each slice. The red triangles denote the active arc volcanoes.
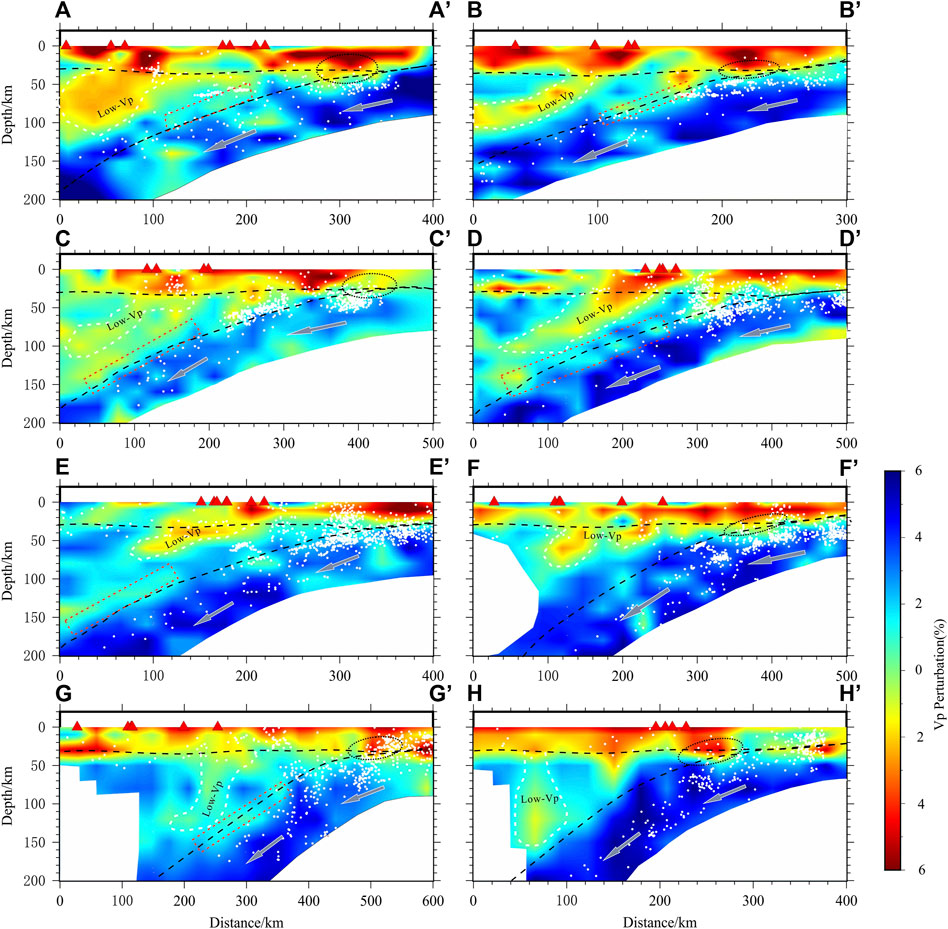
FIGURE 10. Vertical cross-sections of P-wave velocity (Vp) tomography along the 8 profiles shown on the Figure 2A. The red and blue colors denote low and high Vp perturbations (in %). The scales of Vp perturbation are exhibited at the right. Two black dash lines show the discontinuities of the Moho and the upper interface of the subducting Pacific plate along each section, respectively. The red triangles denote the active arc volcanoes. The gray arrow mark indicates the direction of subduction of the Pacific plate. The white dashed area represents the low-velocity anomaly in the mantle wedge. The white dots represent the relocated earthquakes within ∼35 km near the profile.
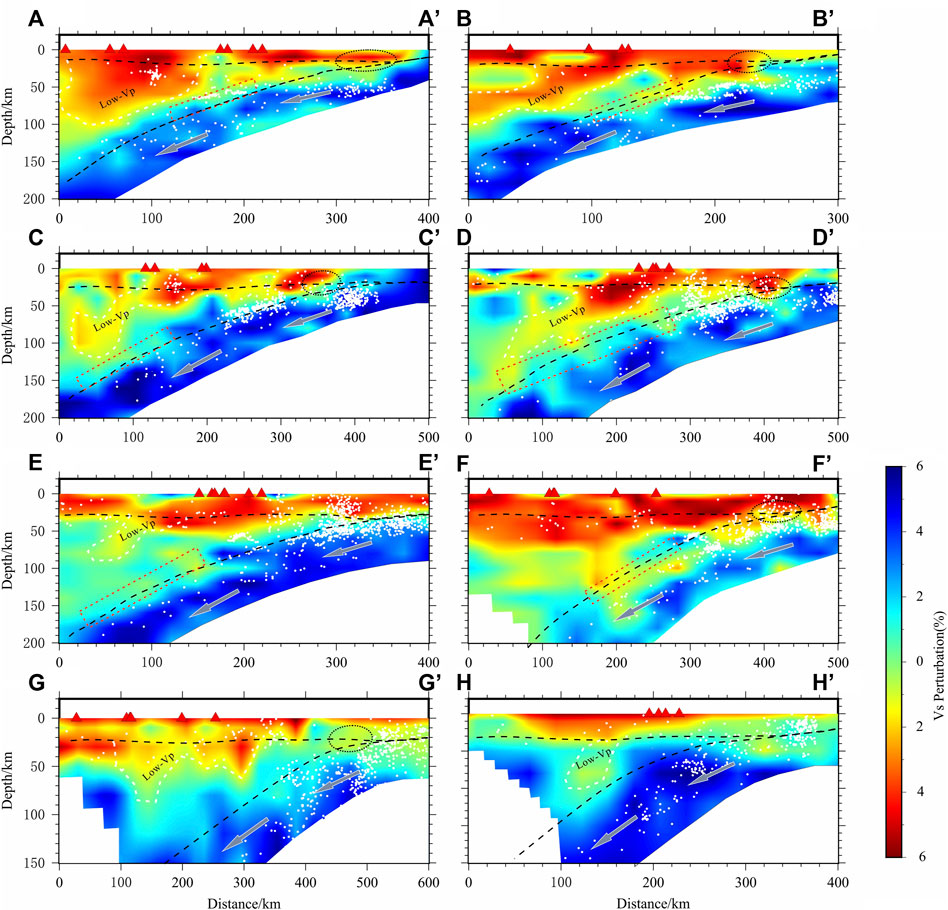
FIGURE 11. The same as Figure 10, but indicates S-wave velocity (Vs).
5 Interpretation and discussion
5.1 Velocity structures of subducting slab and the mantle wedge
P- and S-wave velocity images show a similar pattern of velocity variation on horizontal slices (Figures 8, 9) and vertical cross-sections (Figures 10, 11), suggesting that they are reliable features. Oceanic crust subducted into the deep mantle is much denser than the surrounding mantle, the imaging results also confirm this phenomenon. The present results clearly image that the Pacific plate is tilted at high speed below Japan and significant low-V anomalies are visible in the crust and uppermost mantle beneath the active arc volcanoes and in the central portion of the mantle wedge. The subducted Pacific slab is clearly imaged as high-V anomalies, 4%–6% higher than the normal mantle. Based on the analysis of velocity structure imaging results (Zhao et al., 1992; Nakajima et al., 2001; Wang and Zhao, 2005), many scholars inferred the geometry of the upper boundary of the Pacific subduction zone. As a result, some scholars introduced a Pacific subduction plate with a thickness of 85–100 km into the initial model for tomographic studies (Zhao et al., 1992; Zhao et al., 2009; Zhao et al., 2012; Liu and Zhao, 2016). The one-dimensional velocity model used in this paper does not impose geometric constraints on the initial model shape, but the imaging results can clearly reflect the morphological characteristics of the subduction zone, which can also indicate that the imaging results are reliable.
Thermal structure and attenuation imaging can also provide important additional information on slow thermal structure and dynamics (Gung and Romanowicz, 2004). Wang et al (2019) determine a model of P- and S-wave attenuation (Qp, Qs) tomography of the Japan subduction zone using an improved inversion scheme. Attenuation imaging also reveals strong lateral heterogeneities at each depth beneath the Japan Islands. The high-V anomalies in this paper corresponds to the low-attenuation (high-Q) subducting Pacific slab. Similarly, high-attenuation (low-Q) mantle wedge beneath the volcanic front and back-arc areas corresponds to the low-V in our results. In addition, through some thermal structure studies, it was found that the heat flow near the trench is very low, then increases sharply near the volcanic front, reaches a maximum at the back of the arc, and then tapers off at the back of the arc (Lu et al., 1981; Yamano et al., 1989; Furukawa, 1993; Wang et al., 2022). Thermal structure imaging using two lithological models of the upper mantle (a peridotite assemblage and a pyrolite assemblage) revealed a low-temperature (low-T, ≤ ∼900°C) feature in the forearc region and a high-temperature (high-T, ∼1,400°C) anomaly in the back-arc region of the volcanic forearc (Wang et al., 2022). The distribution of heat flow values is also consistent with our imaging results: high-T and low-V are under back-arc.
5.2 Slab dehydration and partial melt
One of the most important findings of subduction zone tomography studies is that significant low-V anomalies are visible in the crust and uppermost mantle beneath the active arc volcanoes and in the middle of the mantle wedge. These low-V anomalies may have provided the main source of material for arc magmatism and volcanism. Such features have also been found by using different seismic tomography methods, which are also consistent with some petrological studies (Tatsumi, 1989; Peacock, 1990; Iwamori and Zhao, 2000; Hacker et al., 2003). In this paper, Figure 10 demonstrate the presence of low-V anomalous velocities (white dashed areas) in the crust and mantle wedge beneath the volcanic front, although the extended depths of the low velocity anomalies are different from one another. For example, in the AA′ profile in northeastern Japan, the low-V anomaly extends to ∼120 km. The CC′ and DD ′ profiles in Honshu Island show that the low-V anomalies extend to ∼110 km, while the EE′ and FF′ profiles show that the low-V anomaly extends to ∼80 km depth. Figure 11 shows the vertical cross section of the S-wave velocity tomography along the 8 profiles, with the extension of the low-V anomalies generally consistent with Figure 10. Unraveling the source of these low-V anomalies is key to understanding arc magmatism. During the subduction of the Pacific slab, higher temperature, fluid content, and melting fraction can all contribute to anomalous velocity structures (Nakajima et al., 2001). In the subduction zone, the fluid content is considered to be an important factor contributing to the low V in the forearc zone. The black dashed ellipses in Figures 10, 11 show the low-Vp and low-Vs at the shallow subducting slab in the forearc region. At shallow depths, free water is released from oceanic crust, unconsolidated sediments and fluid-filled accretionary complexes after being affected by the high temperature of the surrounding mantle material (Mishra et al., 2003; Wang et al., 2012; Wang et al., 2019; Wang et al., 2022; Wang and Lin, 2022). This may reduce seismic velocity in the forearc region. The hydrated rocks continue to subduct into the deep mantle wedge and experiences a series of progressive geochemical reactions under the influence of high pressure and temperature (Kita et al., 2012; Wang et al., 2022). In this study, at a depth of about 70–150 km, there is a relatively low-V along the upper boundary of the slab (red dashed rectangle, Figures 10, 11). The imaged seismic models infer that the low-Vp and Vs bodies anomalies in the crust and mantle wedge are closely linked to the Pacific slab subduction.
We hypothesize that there are three possible sources of magma for arc magmatism: direct melting of subducting oceanic crust; melting of subducting plate upper mantle peridotite associated with plate dehydration; or both. According to the calculation of peridotite assemblage (Wada et al., 2015), the temperature at a depth of 60–120 km at the upper boundary of the slab is about 1,000–1,200°C. This temperature is sufficient to melt or partially melt the hydrated peridotite of the subducting plate. The low V anomaly in the red dashed rectangle above the plate at depths of 70–150 km shown in Figure 10 may indirectly reflect the state of partial melting of the slab. It should be noted that this low-V anomaly is not continuous above the plate. This spatial feature may indicate that partial melting occurs only locally, or the imaging resolution of this study is not sufficient to fully describe the spatial distribution of molten material. It is generally accepted that the main minerals in the upper mantle (≤400 km depth) are olivine, orthopyroxene, clinopyroxene, and garnet with minor chromite and ilmenite (Ringwood, 1975; Anderson and Bass, 1984; Anderson, 1989; Duffy and Anderson, 1989). However, adding water to a mantle wedge composed of olivine and orthopyroxene may form a variety of hydrous minerals (e.g., anti-olivine, chrysotile, lizardite, talc, and brucite). Therefore, the supply of H2O from the slab is believed to play an important role in the formation of arc magma in the mantle wedge. In the mantle wedge, hydrous fluids are primarily released from extensive metamorphic reactions in the subducted Pacific slab crust. The temperature of the mantle wedge in the subduction zone is greater than 900°C at depths above 60 km (Abers et al., 2017). Upwelling fluids from the subducting plates may have caused partial melting in the overlying mantle wedge due to the high temperatures there, reducing seismic wave velocities (Low-V anomalies in the mantle in Figures 10, 11). In conclusion, the possible magmatic sources of arc magmatism mainly include partial melting of subducting plates at depths of 70–150 km and melting of mantle material with the participation of water fluids.
5.3 Subduction dynamics and arc magmatism
Section 5.2 focuses on the analysis of the main sources of these low-V anomalies, but the dynamical mechanisms of low-V anomalies are still under investigation. In this section, we try to analyze subduction dynamics and arc magmatism by combining the previous studies and the results of this paper. According to the research of scholars, the Pacific plate becomes stagnant in the mantle transition zone and eventually collapses into the lower mantle due to the huge gravitational instability generated by the phase transition, which will cause turbulence and thermal instability in the mantle transition zone and the lower mantle. Perhaps it is the thermal instability of the thermal boundary layer that creates the upward thermal buoyancy (Maruyama et al., 2007; Zhao et al., 2012). We represent this buoyancy in the schematic structure model in Figure 12 with three upward white arrows. In addition, many studies have shown that mantle upwelling and downwelling (mantle corner flow, schematic arrows as shown in Figure 12) are prevalent in the mantle above subducting oceanic plates (Martinez and Taylor, 2002; Kelemen et al., 2003; Currie and Hyndman, 2006). As the mantle molten material migrates to the shallow part, the pressure and temperature decrease, and the viscous coupling between the mantle wedge and the subducting plate further promotes the circulation of the mantle to the deep part together with the overlying subducting plate. Although the phenomenon of mantle corner flow has been widely recognized, it is established through indirect observations such as seismic imaging and thermal structure simulation. The mantle corner flow processes on subducting oceanic plates have not been confirmed by direct petrological studies.
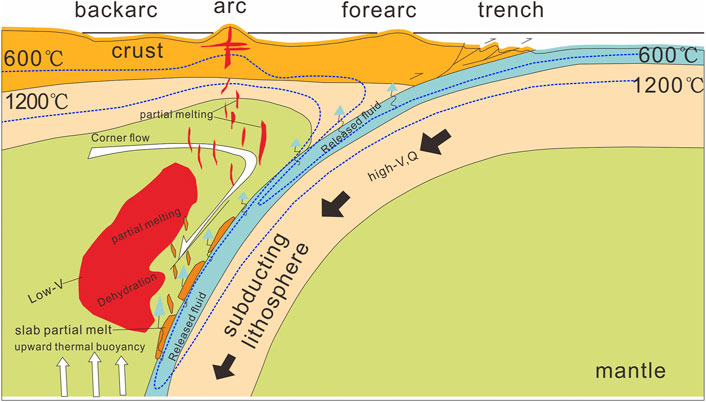
FIGURE 12. Schematic structure model of Japan subduction zone built on the calculated seismic velocity structures. Temperature contours are referenced from (Wada et al., 2015).
Water fluids play an irreplaceable role in subduction dynamics and arc magmatism. During the subduction process of the cold Pacific plate, surface water and sediments are carried into the interior of the Earth, which not only affects the physical and chemical properties of mantle materials (such as density, seismic wave velocity and elasticity, etc.), but also significantly changes the melting temperature and rheological properties. Firstly, significant dewatering of the oceanic plate occurs in the forearc region (released fluid as shown in Figure 12), which may reduce the seismic velocity at shallow depths within the forearc region. As subduction proceeds, the pressure and temperature increase and water is further released from the oceanic crust. Then, these released waters enters the mantle wedge, lowering the melting point of the mantle material and undergoing partial melting, forming a low-V anomaly. Moreover, Rayleigh-Taylor instability that can arise during melting, which may propel higher-velocity anomalies (“cold plumes”) within the mantle wedge (Gerya and Yuen, 2003; Gorczyk et al., 2006). As the plate continues to subduct, the garnet-peridotite slab may undergo direct partial melting along its upper boundary (as shown in the pink thin layer in Figure 12). The molten material migrates upward into the overlying mantle wedge and merges with fluid-dependent melting, where it forms magma. Low-frequency volcanic earthquakes (LFEs) studies show that many low-frequency micro seismic events occur in and around the low-V zone in the lower crust and top of the upper mantle (Hasegawa et al., 2005; Wang et al., 2019), which may represent the subduction of island arc magma from the mantle wedge to the surface. Therefore, we suggest that fluids associated with plate dehydration, mineral composition and thermal state play a fundamental role in arc magmatism and plate melting in the mantle wedge behind the Japan Trench. The repeated supply of magma from these molten low-V body in the mantle wedge into the overlying arc crust cause uplift and volcano formation.
6 Conclusion
We used advanced double-difference tomography to determine the 3-D velocity structure of the P- and S-waves under Japan Islands from the Japan Trench to the back-arc. We use the initial one-dimensional velocity model without geometric constraints on the subduction plate shape, and the imaging results can clearly reflect the morphological features of the subduction zone and the low-V anomalies in the mantle wedge, which can also illustrate the advanced imaging method and the reliability of the inversion results. The results well reveal the morphological and high-velocity characteristics of the subduction of the Pacific subducting plate and low-V anomalies in the surrounding mantle beneath the Japan Islands. The possible source of the significant low-V anomaly are partial melting of the mantle material and direct melting of the subducting oceanic crust itself, in which fluids released from extensive dehydration of the subducting oceanic crust are presumed to play a key role. These molten low-V bodies in the mantle wedge are upwelling into the overlying arc crust under the action of corner flow, leading to uplift and volcano formation.
Data availability statement
The original contributions presented in the study are included in the article/Supplementary Material, further inquiries can be directed to the corresponding authors.
Author contributions
All authors collected and analyzed the data; ZZ, JZ, and FL participated discussion; ZZ and SW drew the figures; ZZ and JZ wrote the paper with the help of all authors. All authors contributed to writing the manuscript and approved the submitted version.
Funding
This work was jointly supported by International Cooperative Research on Earthquake Predictability of China Earthquake Science Experiment Site (Grant No. 2018YFE0109700), Hebei Key Laboratory of Earthquake Dynamics (Grant No. FZ212204) and Earthquake Science and Technology Spark of the China Earthquake Administration (Grant No. XH20034Y).
Acknowledgments
We are very grateful to Prof. Haijiang Zhang of the University of Science and Technology of China for providing the double-difference tomography program and Dr. Lei Gao for his guidance in using the program. Most of the figures were made by using free software GMT (Wessel et al., 2019).
Conflict of interest
The authors declare that the research was conducted in the absence of any commercial or financial relationships that could be construed as a potential conflict of interest.
Publisher’s note
All claims expressed in this article are solely those of the authors and do not necessarily represent those of their affiliated organizations, or those of the publisher, the editors and the reviewers. Any product that may be evaluated in this article, or claim that may be made by its manufacturer, is not guaranteed or endorsed by the publisher.
References
Abdelwahed, M. F., and Zhao, D. (2007). Deep structure of the Japan subduction zone. Phys. Earth Planet. Inter. 162, 32–52. doi:10.1016/j.pepi.2007.03.001
Abers, G. A., van Keken, P. E., and Hacker, B. R. (2017). The cold and relatively dry nature of mantle forearcs in subduction zones. Nat. Geosci. 10, 333–337. doi:10.1038/ngeo2922
Aki, K., Christoffersson, A., and Husebye, E. S. (1977). Determination of the three-dimensional seismic structure of the lithosphere. J. Geophys. Res. 82, 277–296. doi:10.1029/JB082i002p00277
Anderson, D. L. (1989). Theory of the Earth. Osney Mead, Oxford: Blackwell Scientific Publications, 1–366.
Anderson, D. L., and Bass, J. D. (1984). Mineralogy and composition of the upper mantle. Geophys. Res. Lett. 11, 637–640. doi:10.1029/JB082i002p00277
Bird, P. (2003). An updated digital model of plate boundaries: Updated model of plate boundaries. Geochem. Geophys. Geosyst. 4, 1027. doi:10.1029/2001GC000252
Comte, D., Carrizo, D., Roecker, S., Ortega-Culaciati, F., and Peyrat, S. (2016). Three-dimensional elastic wave speeds in the northern Chile subduction zone: Variations in hydration in the supraslab mantle. Geophys. J. Int. 207, 1080–1105. doi:10.1093/gji/ggw318
Currie, C. A., and Hyndman, R. D. (2006). The thermal structure of subduction zone back arcs. J. Geophys. Res. 111, B08404. doi:10.1029/2005JB004024
DeMets, C., Gordon, R. G., Argus, D. F., and Stein, S. (1994). Effect of recent revisions to the geomagnetic reversal time scale on estimates of current plate motions. Geophys. Res. Lett. 21, 2191–2194. doi:10.1029/94GL02118
DeMets, C., Gordon, R. G., and Argus, D. F. (2010). Geologically current plate motions. Geophys. J. Int. 181, 1–80. doi:10.1111/j.1365-246X.2009.04491.x
Duffy, T. S., and Anderson, D. L. (1989). Seismic velocities in mantle minerals and the mineralogy of the upper mantle. J. Geophys. Res. 94, 1895–1912.
Eberhart-Philips, D. (1986). Three-dimensional velocity structure in northern California Coast Ranges from inversion of local earthquake arrival times. Bull. Seismol. Soc. Am. 76, 1025–1052.
Eberhart-Phillips, D., and Michael, A. J. (1993). Three-dimensional velocity structure, seismicity, and fault structure in the Parkfield Region, central California. J. Geophys. Res. 98, 15737. doi:10.1029/93JB01029
Furukawa, Y. (1993). Depth of the decoupling plate interface and thermal structure under arcs. J. Geophys. Res. 98, 20005–20013. doi:10.1029/93JB02020
Gerya, T. V., and Yuen, D. A. (2003). Rayleigh–Taylor instabilities from hydration and melting propel ‘cold plumes’ at subduction zones. Earth Planet. Sci. Lett. 212, 47–62. doi:10.1016/S0012-821X(03)00265-6
Gorczyk, W., Gerya, T. V., Connolly, J. A. D., Yuen, D. A., and Rudolph, M. (2006). Large-scale rigid-body rotation in the mantle wedge and its implications for seismic tomography: Rotation in the mantle wedge. Geochem. Geophys. Geosyst. 7, Q05018. doi:10.1029/2005gc001075
Gung, Y., and Romanowicz, B. (2004). Q tomography of the upper mantle using three-component long-period waveforms. Geophys. J. Int. 157, 813–830. doi:10.1111/j.1365-246X.2004.02265.x
Hacker, B. R., Abers, G. A., and Peacock, S. M. (2003). Subduction factory 1. Theoretical mineralogy, densities, seismic wave speeds, and H2O contents: Subduction zone mineralogy and physical properties. J. Geophys. Res. 108, B12029. doi:10.1029/2001JB001127
Hasegawa, A., Nakajima, J., Umino, N., and Miura, S. (2005). Deep structure of the northeastern Japan arc and its implications for crustal deformation and shallow seismic activity. Tectonophysics 403, 59–75. doi:10.1016/j.tecto.2005.03.018
Hasegawa, A., Nakajima, J., Uchida, N., Okada, T., Zhao, D., Matsuzawa, T., et al. (2009). Plate subduction, and generation of earthquakes and magmas in Japan as inferred from seismic observations: An overview. Gondwana Res. 16, 370–400. doi:10.1016/j.gr.2009.03.007
Heki, K., and Miyazaki, S. (2001). Plate convergence and long-term crustal deformation in central Japan. Geophys. Res. Lett. 28, 2313–2316. doi:10.1029/2000GL012537
Honda, S. (1985). Thermal structure beneath Tohoku, northeast Japan. Tectonophysics 112, 69–102. doi:10.1016/0040-1951(85)90173-8
Huang, J., and Zhao, D. (2006). High-resolution mantle tomography of China and surrounding regions. J. Geophys. Res. 111, B09305. doi:10.1029/2005JB004066
Huang, Z., Zhao, D., and Wang, L. (2011). Seismic heterogeneity and anisotropy of the Honshu arc from the Japan Trench to the Japan Sea: Heterogeneity and anisotropy of Honshu arc. Geophys. J. Int. 184, 1428–1444. doi:10.1111/j.1365-246X.2011.04934.x
Humphreys, E., and Clayton, R. W. (1988). Adaptation of back projection tomography to seismic travel time problems. J. Geophys. Res. 93, 1073. doi:10.1029/JB093iB02p01073
Iwamori, H., and Zhao, D. (2000). Melting and seismic structure beneath the Northeast Japan Arc. Geophys. Res. Lett. 27, 425–428. doi:10.1029/1999GL010917
Kelemen, P. B., Rilling, J. L., Parmentier, E. M., Mehl, L., and Hacker, B. R. (2003). “Thermal structure due to solid-state flow in the mantle wedge beneath arcs,” in Geophysical monograph series. Editor J. Eiler (Washington, D. C.: American Geophysical Union), 293–311. doi:10.1029/138GM13
Kita, S., Hasegawa, A., Nakajima, J., Okada, T., Matsuzawa, T., and Katsumata, K. (2012). High-resolution seismic velocity structure beneath the hokkaido corner, northern Japan: Arc-arc collision and origins of the 1970 M 6.7 hidaka and 1982 M 7.1 urakawa-oki earthquakes: Seismic velocity structure in hokkaido. J. Geophys. Res. 117, B12301. doi:10.1029/2012jb009356
Kubo, A., Fukuyama, E., Kawai, H., and Nonomura, K. (2002). NIED seismic moment tensor catalogue for regional earthquakes around Japan: quality test and application. Tectonophysics 356, 23–48. doi:10.1016/S0040-1951(02)00375-X
Lin, G., Thurber, C. H., Zhang, H., Hauksson, E., Shearer, P. M., Waldhauser, F., et al. (2010). A California statewide three-dimensional seismic velocity model from both Absolute and differential times. Bull. Seismol. Soc. Am. 100, 225–240. doi:10.1785/0120090028
Liu, X., and Zhao, D. (2016). P and S wave tomography of Japan subduction zone from joint inversions of local and teleseismic travel times and surface-wave data. Phys. Earth Planet. Inter. 252, 1–22. doi:10.1016/j.pepi.2016.01.002
Lu, R. S., Pan, J. J., and Lee, T. C. (1981). Heat flow in the southwestern Okinawa trough. Earth Planet. Sci. Lett. 55, 299–310. doi:10.1016/0012-821X(81)90109-6
Martinez, F., and Taylor, B. (2002). Mantle wedge control on back-arc crustal accretion. Nature 416, 417–420. doi:10.1038/416417a
Maruyama, S., Santosh, M., and Zhao, D. (2007). Superplume, supercontinent, and post-perovskite: Mantle dynamics and anti-plate tectonics on the Core–Mantle Boundary. Gondwana Res. 11, 7–37. doi:10.1016/j.gr.2006.06.003
Menzies, M., Xu, Y., Zhang, H., and Fan, W. (2007). Integration of geology, geophysics and geochemistry: A key to understanding the North China craton. Lithos 96, 1–21. doi:10.1016/j.lithos.2006.09.008
Mishra, O. P., Zhao, D., Umino, N., and Hasegawa, A. (2003). Tomography of northeast Japan forearc and its implications for interplate seismic coupling: Tomography of Northeast Japan forearc. Geophys. Res. Lett. 30, GL017736. doi:10.1029/2003GL017736
Miyazaki, S., and Heki, K. (2001). Crustal velocity field of southwest Japan: Subduction and arc-arc collision. J. Geophys. Res. 106, 4305–4326. doi:10.1029/2000JB900312
Nakajima, J., Matsuzawa, T., Hasegawa, A., and Zhao, D. (2001). Seismic imaging of arc magma and fluids under the central part of northeastern Japan. Tectonophysics 341, 1–17. doi:10.1016/S0040-1951(01)00181-0
Niu, X., Zhao, D., and Li, J. (2018). Precise relocation of low-frequency earthquakes in Northeast Japan: new insight into Arc magma and fluids. Geophys. J. Int. 212, 1183–1200. doi:10.1093/gji/ggx445
Paige, C. C., and Saunders, M. A. (1982). Algorithm 583: LSQR: Sparse linear equations and least squares problems. ACM Trans. Math. Softw. 8, 195–209. doi:10.1145/355993.356000
Panayotopoulos, Y., Hirata, N., Sato, H., Kato, A., Imanishi, K., Kuwahara, Y., et al. (2014). Investigating the role of the Itoigawa-Shizuoka tectonic line towards the evolution of the Northern Fossa Magna rift basin. Tectonophysics 615–616, 12–26. doi:10.1016/j.tecto.2013.12.014
Peacock, S. A. (1990). Fluid processes in subduction zones. Science 248, 329–337. doi:10.1126/science.248.4953.329
Ringwood, A. E. (1975). Composition and Petrology of the Earth’s Mantle. New York: McGraw-Hill, 618.
Statz-Boyer, P., Thurber, C., Pesicek, J., and Prejean, S. (2009). High precision relocation of earthquakes at Iliamna Volcano, Alaska. J. Volcanol. Geotherm. Res. 184, 323–332. doi:10.1016/j.jvolgeores.2009.04.016
Tao, K., Grand, S. P., and Niu, F. (2018). Seismic structure of the upper mantle beneath eastern Asia from full waveform seismic tomography. Geochem. Geophys. Geosyst. 19, 2732–2763. doi:10.1029/2018GC007460
Tatsumi, Y. (1989). Migration of fluid phases and Genesis of basalt magmas in subduction zones. J. Geophys. Res. 94, 4697–4707. doi:10.1029/JB094iB04p04697
Um, J., and Thurber, C. (1987). A fast algorithm for two-point seismic ray tracing. Bull. Seismol. Soc. Am. 77, 972–986. doi:10.1785/BSSA0770030972
van Keken, P. E. (2003). The structure and dynamics of the mantle wedge. Earth Planet. Sci. Lett. 215, 323–338. doi:10.1016/S0012-821X(03)00460-6
Wada, I., He, J., Hasegawa, A., and Nakajima, J. (2015). Mantle wedge flow pattern and thermal structure in Northeast Japan: Effects of oblique subduction and 3-D slab geometry. Earth Planet. Sci. Lett. 426, 76–88. doi:10.1016/j.epsl.2015.06.021
Waldhauser, F. (2002). Fault structure and mechanics of the Hayward Fault, California, from double-difference earthquake locations. J. Geophys. Res. 107, 2054. doi:10.1029/2000JB000084
Wang, Z., and Lin, J. (2022). Role of fluids and seamount subduction in interplate coupling and the mechanism of the 2021 Mw 7.1 Fukushima-Oki earthquake, Japan. Earth Planet. Sci. Lett. 584, 117439. doi:10.1016/j.epsl.2022.117439
Wang, Z., and Zhao, D. (2005). Seismic imaging of the entire arc of Tohoku and Hokkaido in Japan using P-wave, S-wave and sP depth-phase data. Phys. Earth Planet. Inter. 152, 144–162. doi:10.1016/j.pepi.2005.06.010
Wang, J., and Zhao, D. (2008). P-wave anisotropic tomography beneath Northeast Japan. Phys. Earth Planet. Inter. 170, 115–133. doi:10.1016/j.pepi.2008.07.042
Wang, J., and Zhao, D. (2009). P-wave anisotropic tomography of the crust and upper mantle under Hokkaido, Japan. Tectonophysics 469, 137–149. doi:10.1016/j.tecto.2009.02.005
Wang, J., and Zhao, D. (2010). Mapping P-wave anisotropy of the Honshu arc from Japan Trench to the back-arc. J. Asian Earth Sci. 39, 396–407. doi:10.1016/j.jseaes.2010.04.009
Wang, J., and Zhao, D. (2012). P wave anisotropic tomography of the Nankai subduction zone in Southwest Japan. Geochem. Geophys. Geosyst. 13, Q05017. doi:10.1029/2012GC004081
Wang, Z., and Zhao, D. (2019). Updated attenuation tomography of Japan subduction zone. Geophys. J. Int. 219, 1679–1697. doi:10.1093/gji/ggz339
Wang, Z., Huang, W., Zhao, D., and Pei, S. (2012). Mapping the tohoku forearc: Implications for the mechanism of the 2011 East Japan earthquake (mw 9.0). Tectonophysics 524–525, 147–154. doi:10.1016/j.tecto.2011.12.032
Wang, C., Wu, J., and Yang, T. (2018). Crustal structure beneath the Taiyuan Basin and adjacent areas revealed by double-difference tomography. Chin. J. Geophys Chin. 61, 963–974. doi:10.6038/cjg2018L0114
Wang, Z., Fukao, Y., Miyakawa, A., Hasegawa, A., and Takei, Y. (2019). Crustal extension and graben formation by fault slip-Associated pore Opening, kyushu, Japan. J. Geophys. Res. Solid Earth 124, 4879–4894. doi:10.1029/2018JB016649
Wang, X., Chen, Q.-F., Niu, F., Wei, S., Ning, J., Li, J., et al. (2020). Distinct slab interfaces imaged within the mantle transition zone. Nat. Geosci. 13, 822–827. doi:10.1038/s41561-020-00653-5
Wang, Z., Jin, Z., and Lin, J. (2022). Slab melting and arc magmatism behind the Japan Trench: Evidence from seismic and thermal structure imaging. Tectonophysics 833, 229340. doi:10.1016/j.tecto.2022.229340
Wei, W., Xu, J., Zhao, D., and Shi, Y. (2012). East Asia mantle tomography: New insight into plate subduction and intraplate volcanism. J. Asian Earth Sci. 60, 88–103. doi:10.1016/j.jseaes.2012.08.001
Wessel, P., Luis, J. F., Uieda, L., Scharroo, R., Wobbe, F., Smith, W. H. F., et al. (2019). The generic mapping tools version 6. Geochem. Geophys. Geosyst. 20, 5556–5564. doi:10.1029/2019GC008515
Xin, H., Zhang, H., Kang, M., He, R., Gao, L., and Gao, J. (2019). High-resolution lithospheric velocity structure of continental China by double-difference seismic travel-time tomography. Seismol. Res. Lett. 90, 229–241. doi:10.1785/0220180209
Yamano, M., Uyeda, S., Foucher, J.-P., and Sibuet, J.-C. (1989). Heat flow anomaly in the middle Okinawa Trough. Tectonophysics 159, 307–318. doi:10.1016/0040-1951(89)90136-4
Yang, F., Kim, S. W., Tsunogae, T., and Zhou, H. (2021). Multiple enrichment of subcontinental lithospheric mantle with Archean to Mesozoic components: Evidence from the Chicheng ultramafic complex, North China Craton. Gondwana Res. 94, 201–221. doi:10.1016/j.gr.2021.03.005
Zhang, H., and Thurber, C. (2006). Development and Applications of double-difference seismic tomography. Pure Appl. Geophys. 163, 373–403. doi:10.1007/s00024-005-0021-y
Zhang, H., Thurber, C. H., Shelly, D., Ide, S., Beroza, G. C., and Hasegawa, A. (2004). High-resolution subducting-slab structure beneath northern Honshu, Japan, revealed by double-difference tomography. Geology 32, 361. doi:10.1130/G20261.2
Zhang, H., Wang, F., Myhill, R., and Guo, H. (2019). Slab morphology and deformation beneath Izu-Bonin. Nat. Commun. 10, 1310. doi:10.1038/s41467-019-09279-7
Zhang, G., He, Y., Ai, Y., Jiang, M., Mon, C. T., Hou, G., et al. (2021). Indian continental lithosphere and related volcanism beneath Myanmar: Constraints from local earthquake tomography. Earth Planet. Sci. Lett. 567, 116987. doi:10.1016/j.epsl.2021.116987
Zhang, H. (2003). Double-difference tomography: The method and its Application to the Hayward Fault, California. Bull. Seismol. Soc. Am. 93, 1875–1889. doi:10.1785/0120020190
Zhao, D., Hasegawa, A., and Horiuchi, S. (1992). Tomographic imaging of P and S wave velocity structure beneath northeastern Japan. J. Geophys. Res. 97, 19909. doi:10.1029/92JB00603
Zhao, D., Hasegawa, A., and Kanamori, H. (1994). Deep structure of Japan subduction zone as derived from local, regional, and teleseismic events. J. Geophys. Res. 99, 22313–22329. doi:10.1029/94JB01149
Zhao, D., Mishra, O. P., and Sanda, R. (2002). Influence of fluids and magma on earthquakes: seismological evidence. Phys. Earth Planet. Inter. 132, 249–267. doi:10.1016/S0031-9201(02)00082-1
Zhao, D., Wang, Z., Umino, N., and Hasegawa, A. (2007). Tomographic imaging outside a seismic Network: Application to the Northeast Japan Arc. Bull. Seismol. Soc. Am. 97, 1121–1132. doi:10.1785/0120050256
Zhao, D., Wang, Z., Umino, N., and Hasegawa, A. (2009). Mapping the mantle wedge and interplate thrust zone of the northeast Japan arc. Tectonophysics 467, 89–106. doi:10.1016/j.tecto.2008.12.017
Zhao, D., Yanada, T., Hasegawa, A., Umino, N., and Wei, W. (2012). Imaging the subducting slabs and mantle upwelling under the Japan Islands: Subducting slabs and mantle upwelling. Geophys. J. Int. 190, 816–828. doi:10.1111/j.1365-246X.2012.05550.x
Zhao, D., Yamamoto, Y., and Yanada, T. (2013). Global mantle heterogeneity and its influence on teleseismic regional tomography. Gondwana Res. 23, 595–616. doi:10.1016/j.gr.2012.08.004
Zhao, D., Kitagawa, H., and Toyokuni, G. (2015). A water wall in the Tohoku forearc causing large crustal earthquakes. Geophys. J. Int. 200, 149–172. doi:10.1093/gji/ggu381
Zhao, D. (2004). Global tomographic images of mantle plumes and subducting slabs: insight into deep earth dynamics. Phys. Earth Planet. Inter. 146, 3–34. doi:10.1016/j.pepi.2003.07.032
Zhao, D. (2017). Big mantle wedge, anisotropy, slabs and earthquakes beneath the Japan Sea. Phys. Earth Planet. Inter. 270, 9–28. doi:10.1016/j.pepi.2017.06.009
Keywords: double-difference tomography, Pacific plate, subduction zone, mantle wedge, arc magmatism
Citation: Zhang Z, Zheng J, Wang S, Li C and Liu F (2023) Imaging the subducting slab and mantle upwelling under the Japan islands revealed by double-difference tomography. Front. Earth Sci. 10:1019408. doi: 10.3389/feart.2022.1019408
Received: 15 August 2022; Accepted: 31 October 2022;
Published: 12 January 2023.
Edited by:
Fei Xue, Hohai University, ChinaReviewed by:
Hu Yaping, East China University of Technology, ChinaHailiang Xin, Geophysical Exploration Center, China Earthquake Administration, China
Copyright © 2023 Zhang, Zheng, Wang, Li and Liu. This is an open-access article distributed under the terms of the Creative Commons Attribution License (CC BY). The use, distribution or reproduction in other forums is permitted, provided the original author(s) and the copyright owner(s) are credited and that the original publication in this journal is cited, in accordance with accepted academic practice. No use, distribution or reproduction is permitted which does not comply with these terms.
*Correspondence: Jianchang Zheng, empjbWFpbEB5ZWFoLm5ldA==; Fangbin Liu, bGl1ZmFuZ2Jpbjg5MDhAMTYzLmNvbQ==