 Zhizhong Su
 Yunqi Ma3,4
 Fumin Ren
- 1Xiamen Key Laboratory of Straits Meteorology, Xiamen Meteorological Bureau, Xiamen, China
- 2Fujian Key Laboratory of Severe Weather, Fuzhou, China
- 3CMA·Henan Key Laboratory of Agrometeorological Support and Applied Technique, Zhengzhou, China
- 4Henan Meteorological Observatory, Zhengzhou, China
- 5State Key Laboratory of Severe Weather, Chinese Academy of Meteorological Sciences, Beijing, China
- 6Public Meteorological Service Center of CMA, Beijing, China
The forecasting performance of the Dynamical–Statistical–Analog Ensemble Forecast (DSAEF) model for Landfalling Typhoon [or tropical cyclone (TC)] Precipitation (DSAEF_LTP), with new values of two parameters (i.e., similarity region and ensemble method) for landfalling TC precipitation over Fujian Province, is tested in four experiments. Forty-two TCs with precipitation over 100 mm in Fujian Province during 2004–2020 are chosen as experimental samples. Thirty of them are training samples and twelve are independent samples. First, simulation experiments for the training samples are used to determine the best scheme of the DSAEF_LTP model. Then, the forecasting performance of this best scheme is evaluated through forecast experiments. In the forecast experiments, the TSsum (the sum of threat scores for predicting TC accumulated rainfall of ≥250 mm and ≥100 mm) of experiments DSAEF_A, B, C, D is 0.0974, 0.2615, 0.2496, and 0.4153, respectively. The results show that the DSAEF_LTP model performs best when both adding new values of the similarity region and ensemble method (DSAEF_D). At the same time, the TSsum of the best performer of numerical weather prediction (NWP) models is only 0.2403. The improved DSAEF_LTP model shows advantages compared to the NWP models. It is an important method to improve the predictability of the DSAEF_LTP model by adopting different schemes in different regions.
1 Introduction
Tropical cyclones (TCs, or typhoons) are among the top 10 global natural disasters (Lei et al., 2019). The Northwest Pacific (including the South China Sea) is the most active region for TCs worldwide, with about 27 TCs per year and accounting for about one-third of the total number of TCs globally (Matsuura et al., 2013). Studies have shown that most TCs move westward and northwestward immediately after their generation, making China one of the most severely affected countries (Chen and Meng, 2001; Zhang et al., 2019), especially with the regard to landfalling TCs (LTCs).
Forecasting LTC precipitation is one of the major challenges of TC science. China has made remarkable progress in improving the prediction error of tropical cyclone track, but the progress in forecasting TC precipitation is still relatively slow. Besides, current understanding of TC rainfall distribution change is more qualitative than quantitative (AMS, 2000). Therefore, it is of great scientific significance and practical value to continue researching LTC precipitation and improving the quality and skill of its forecasting.
With regard to research approaches for forecasting LTC precipitation, three methods are widely applied: dynamical models, statistical methods, and dynamical–statistical methods. Among them, the dynamical–statistical method is an important approach to improving the forecasting skill for LTC precipitation, and can be generally divided into three categories (Ren and Xiang, 2017). The first category involves using the TC tracks forecasted by dynamical models along with historical rainfall observations, and the TC precipitation forecast is obtained from the perspective of the climatic average (Marks et al., 2002; Lee et al., 2006; Lonfat et al., 2007). The second type adopts TC track forecasts and the integration of rainfall from the initial rainfall rates to forecast the LTC precipitation (Kidder et al., 2005; Liu, 2009; Ebert et al., 2011). And the third type works by constructing a dynamical–statistical scheme that consists of various internal TC variables and its environmental fields (Li and Zhao, 2009; Zhong et al., 2009). There have been some important recent studies on hybrid analog-ensemble-based forecasts. For instance, Elsberry and Tsai (2014) developed a situation-dependent intensity prediction technique for western North Pacific TCs, based on the mean intensity changes from the 10 best historical track analogs, and successfully applied the technique to other TC cases (Tsai and Elsberry, 2015, Tsai and Elsberry, 2016, Tsai and Elsberry, 2017).
Recently, Ren et al. (2020) proposed the theory of the Dynamical–Statistical–Analog Ensemble Forecast (DSAEF) and applied it to LTC accumulated precipitation forecasting, developing the DSAEF model for landfalling TC precipitation (the DSAEF_LTP model). The initial model contained two physical factors: TC track and TC landfalling season. Subsequently, Ding et al. (2020) introduced TC intensity into the model and conducted rainfall forecast experiments for 21 LTCs over South China. Furthermore, Jia et al. (2020) added five new parameter values of similarity regions (2020) into the model and conducted simulation experiments on a single TC in 2019 (Lekima). In a follow-up study (Jia et al., 2022), the authors added five new values of ensemble forecast schemes and carried out further experiments on 10 TCs in 2018, which further improved the DSAEF_LTP model.
The above review reveals that so far only a small number of samples have thus far been adopted to conduct forecast experiments with the new similarity regions and ensemble forecast schemes added into the DSAEF_LTP model. In other words, evidence based on large-sample experiments are still missing. And how about? The forecast skill of the model for a small area, such as a province? This is the motivation behind the present study in which large-sample experiments are carried out with the improved model (with new parameter values added) in Fujian Province, which is located on the southeast coast of China and experiences frequent typhoon impacts as well as severe disaster-related losses, to evaluate the model’s forecast performance in this region.
The paper is structured as follows: The next section describes data and methods. Section 3 explains the experiments (samples and design). Results are presented in Section 4. A summary and discussion are given in Section 5.
2 Data and methods
2.1 Data
(1) The observed historical precipitation data during 1960–2020 with 24-h intervals at 1200 UTC used in this paper are from the National Meteorological Information Center (NMIC) of the China Meteorological Administration (CMA), covering 2027 meteorological stations, including 66 in Fujian.
(2) The historical best-track data at 6-h intervals during 1960–2020, including the position and strength of TCs, are from the Shanghai Typhoon Institute (Ying et al., 2014; Lu et al., 2021). The tracks of target TCs [both the best tracks and operational numerical weather prediction (NWP) model forecast tracks] are from the NMIC of the CMA.
(3) Forecasted precipitation data from NWP models are used to compare their forecast performance with that of the DSAEF_LTP model. The following four models are used: the European Centre for Medium-Range Weather Forecasts (ECMWF) model (0.125°×0.125°); the Global Forecast System (GFS) of the National Centers for Environmental Prediction (0.25°×0.25°); the Global/Regional Assimilation and Prediction System (GRAPES) model run by the CMA (0.25°×0.25°); and the Shanghai Meteorological Service WRF ADAS Real-Time Modeling System (SMS-WARMS) (0.09°×0.09°). For simplicity, the four NWP models, i.e., ECMWF, GFS, GRAPES and SMS-WARMS, are referred to as ECM, NCP, GRP, and mSH, respectively in the following.
2.2 Methods
2.2.1 The DSAEF_LTP model
The DSAEF_LTP model is used to predict the accumulated precipitation of the target TCs in this study. Figure 1 shows the flowchart of the forecasting procedure of the DSAEF_LTP model, and the procedure consists of four main steps: 1) obtaining the complete track of the target TC; 2) constructing the generalized initial values (GIVs); 3) discriminating the similarity of the GIV; and 4) ensemble-forecasting the LTC precipitation.
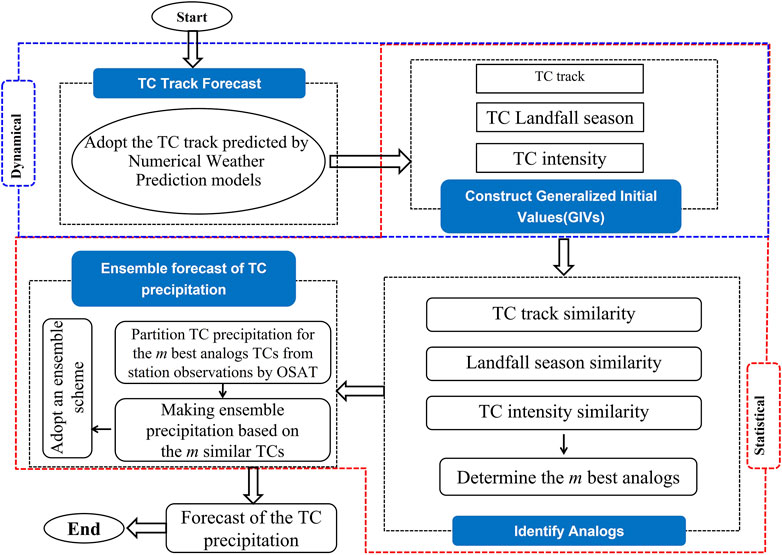
FIGURE 1. Flowchart of the DSAEF_LTP model.
In the first step, the complete track of the target TC is obtained by combining the observed track before the initial time and the forecast track after the initial time. The forecast track is based on the TC track forecast of the NWP model, and the initial time depends on the first parameter presented in Table 1.
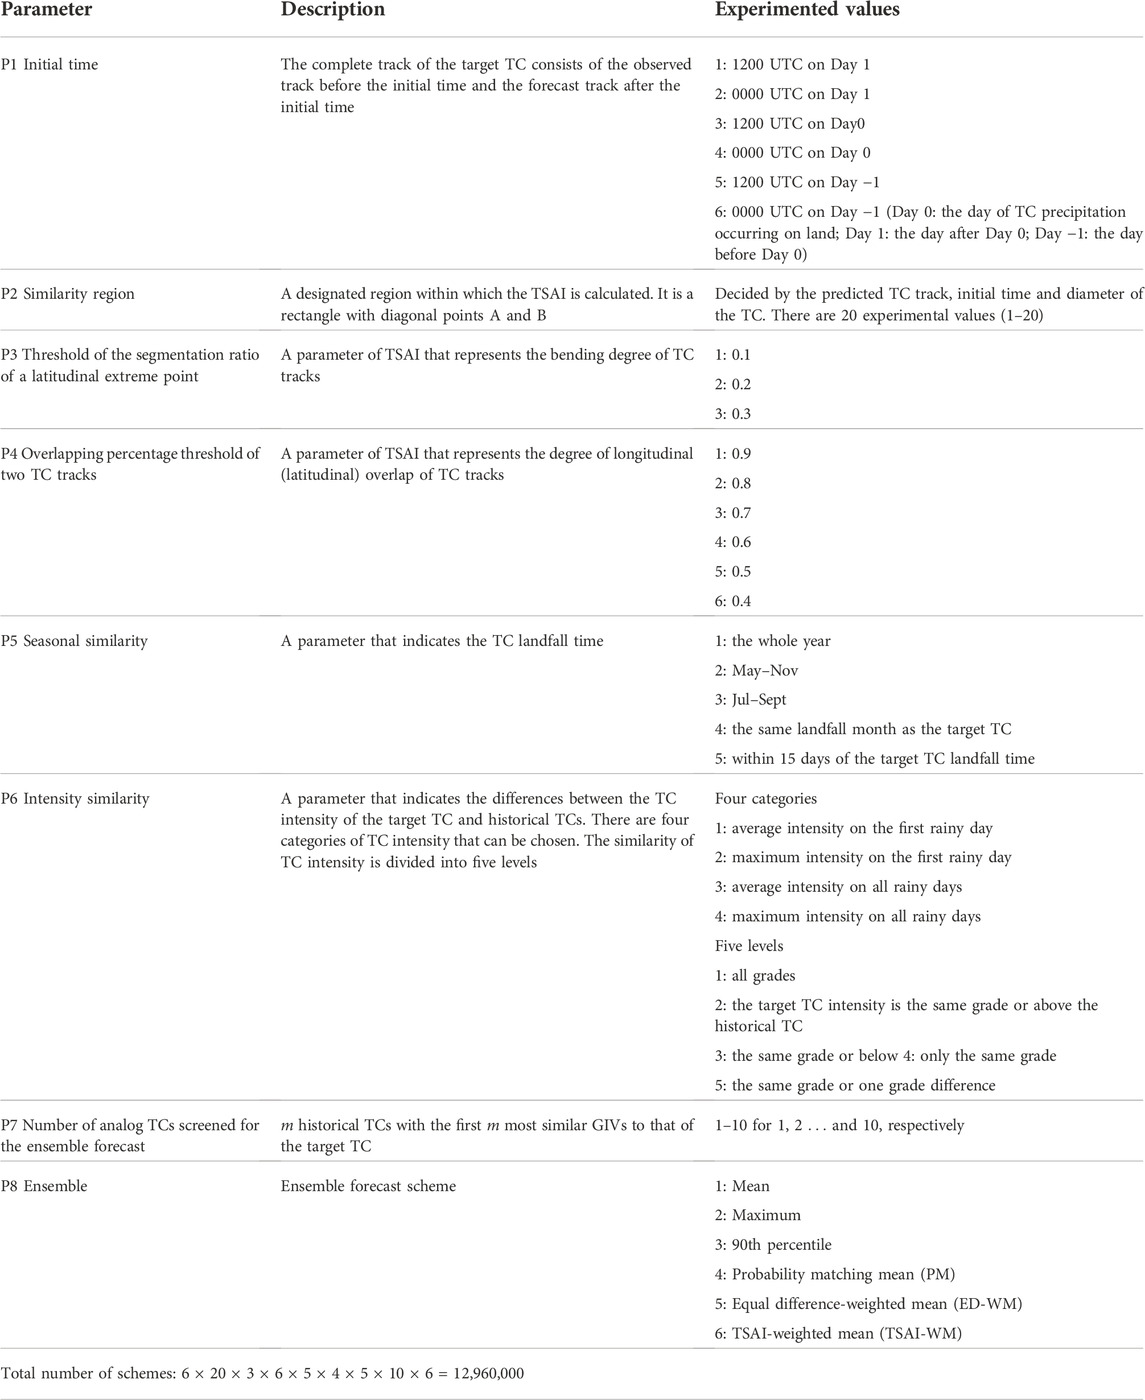
TABLE 1. Parameters of the DSAEF_LTP model.
In the second step, GIVs are constructed via physical factors that affect TC precipitation. Certain variables of TC characteristics (e.g., TC track, TC landfall season, TC intensity, TC translation speed, TC structure) and environmental fields (e.g., monsoons, subtropical high, low-level jet) that are important factors influencing TC precipitation should be considered. In this study, only three TC characteristic factors—TC track, TC landfall season and TC intensity—have been introduced into the model. The environmental factors will be considered to be introduced into the model in the future.
The third step is to distinguish the similarity of the GIVs. Specifically, it is used to discriminate the similarity of the GIVs constructed in the second step between the target TC and the historical TCs, and then m historical TCs that are most similar to the target TC can be selected. This step is determined by parameters (P) 2–6 in Table 1. The TC track similarity is determined by the TC track Similarity Area Index (TSAI) (Ren et al., 2018), which is calculated by using P2–P4. Meanwhile, P5 and P6 are used to determine the similarity of TC landfall season and intensity, respectively. Based on the above steps, m historical TCs are finally screened, and m is determined by P7.
The fourth step is the LTC precipitation ensemble forecast and the ensemble members are the similar historical TCs. In this context, the accumulated precipitation of m similar historical TCs screened during the third step are assembled to obtain the precipitation forecast of the target TC. The ensemble method is determined by P8. Here, the Objective Synoptic Analysis Technique is used to partition the precipitation generated by TCs from the historical accumulated precipitation (Ren et al., 2001, Ren et al., 2007).
2.2.2 The new parameter values of the DSAEF_LTP model
The improvement of the DSAEF_LTP model with two newly added parameter values is tested in Fujian Province. The parameters and their values in the model are listed in Table 1. The first parameter is the similarity region (P2 in Table 1). Fifteen values of this parameter are obtained in the first version of the DSAEF_LTP model. That is, fifteen rectangular areas with diagonal points A and B can be chosen, and the TSAI is calculated in these rectangular areas. The TSAI is the area enclosed by the track of the historical TCs and the target TC in a specified similarity region. A is the TC position at 0, 12 or 24 h prior to the maximum prediction time, and C is the TC position at 0, 12, 24, 36 or 48 h prior to the start time of the forecast (i.e., the initial time). Jia et al. (2020) found that these rectangular areas are rather too small or too eastward or southward considering that the maximum diameter of a TC is about 2000 km in the Northwest Pacific, so five new values that represent five 2000 km−2 regions of this parameter are added.
The second parameter is the ensemble forecast scheme (P8 in Table 1). There are only two ensemble methods in the first version of the DSAEF_LTP model: mean and maximum. To address the high rates of misses and false alarms of these two methods respectively, Jia et al. (2022) added five new ensemble methods (i.e., the 90th percentile, fusion, probability matching mean, equal difference-weighted mean, and TSAI-weighted mean) and demonstrated that the overall performance of the 90th percentile is superior. Four new ensemble methods, excluding the fusion method presented by Jia et al. (2022), have been added in this paper. We did not consider this ensemble method as its prediction result for precipitation above 100 mm is the same as that of the maximum method. In this paper, the forecast performances of the four new ensemble schemes and the two original schemes are tested for TC precipitation over the Fujian Province.
2.2.3 Evaluation methods
In order to evaluate the forecast performance of the DSAEF_LTP model, the threat score (TS), false alarm rate (FAR), and missing alarm rate (MAR) are used (Wang et al., 2021). The TS is calculated as
whereby its value ranges from 0 to 1. The closer TS is to 1, the better the forecast performance. To evaluate the forecast performance at two thresholds above 100 mm and 250 mm, TSsum = TS100 + TS250 is selected as an evaluation index (where TS100 and TS250 are the TSs at two thresholds, above 100 mm and 250 mm respectively). Therefore, a larger TSsum indicates a better forecast performance of the DSAEF_LTP model at these two thresholds. For the other metrics,
where in the smaller the value of FAR and MAR, the better the forecast. Similarly, FAR100, MAR100, FAR250, and MAR250 are the MARs and FARs at the two thresholds above 100 mm and 250 mm, respectively.
3 Experiments
3.1 Samples
From 2004 to 2020, the historical TCs that caused a maximum daily precipitation exceeding 100 mm in Fujian Province are selected as experimental samples. After excluding some TCs with missing data, a total of 42 TCs are picked out, of which 30 TCs from 2004 to 2015 are chosen as training samples (Figure 2A), while 12 TCs from 2016 to 2020 are chosen as independent samples (Figure 2B).
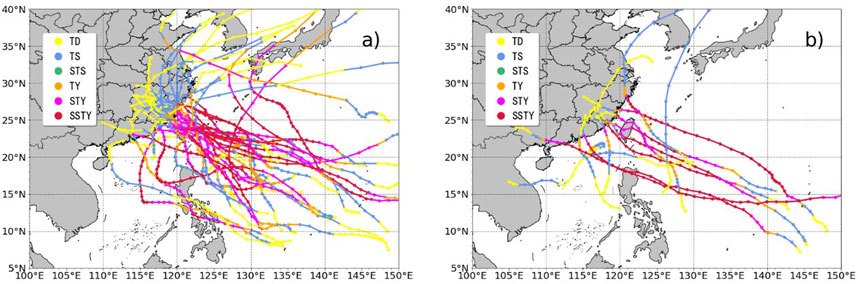
FIGURE 2. Tracks of (A) the 30 TCs used as training samples from 2004 to 2015 and (B) the 12 TCs used as independent samples from 2016 to 2020.
3.2 Design
The forecasting procedures of the DSAEF_LTP model and its parameters were introduced in Section 2.2.1. Table 1 provides the values and physical meanings of these parameters. As each parameter has several different values, there is a large number of combinations of these values, and each combination is a forecast scheme. The simulation experiment for training samples is conducted to determine the best scheme according to highest TSsum, i.e., the highest prediction accuracy. Then, the forecast performance of this best scheme is tested in Fujian Province.
To examine the forecast performance after introducing the two new parameter values into the DSAEF_LTP model, four experiments are designed. The first experiment is conducted by the original DSAEF_LTP model that contains three physical factors, (i.e., TC track, landfall season, and intensity) in the GIVs of the model, without adding the new parameter values of similarity region and ensemble method, and the experiment is named DSAEF_A. The second experiment is the model with five new similarity region parameter values, here stated as DSAEF_B. The third experiment is the model with four new ensemble methods, named DSAEF_C. And the fourth experiment, DSAEF_D, is conducted with new values of these two parameters simultaneously.
The procedures for selecting the best scheme are as follows: First, calculate the TSsum for each forecast scheme when simulating the accumulated precipitation of a single TC. Due to the short impact period of some TCs, some parameter values of the initial time and the similarity region cannot be used. Thus, when simulating the accumulated precipitation of a single TC, the total number of schemes may less than or equal to the number given in Table 1. The second step is to select the common scheme that can be used by all 30 TCs. In the third step, considering 100 mm and 250 mm are two important thresholds for operational forecasting of accumulated precipitation, the average values of TS250 and TS100 are calculated for each common scheme. The common scheme with the largest TSsum (the sum of TS250 and TS100) is considered as the best scheme, which will be applied to the TC precipitation forecast.
After the best schemes of the four experiments for the 30 training samples from 2004 to 2015 are determined, the four schemes are used to forecast the precipitation of 12 independent samples. Then, these forecast results are compared with the NWP models to further understand the forecasting skill of the best scheme for each configuration of experiments.
4 Results
4.1 Simulation experiments
The black scatter points in Figure 3 show the TSs of the best scheme of the four simulation experiments for 30 training samples. Each black dot in the figure represents a scheme whose horizontal and vertical coordinates are the TS250 and TS100 of this scheme, respectively. The figure shows that there is a significant increase in the number of DSAEF_B schemes compared with the number of DSAEF_A schemes, and the distribution of TSsum is more widespread. The maximum TSsum of DSAEF_B is 0.5571, while the maximum TSsum of DSAEF_A is 0.5035, indicating that the forecasting capability of DSAEF_LTP improved after adding the new parameter values of the similarity region. In experiment DSAEF_C, the maximum TSsum increases to 0.5353 after adding new values of the ensemble method, indicating that a suitable ensemble method plays an important role in improving the forecasting capability of DSAEF_LTP. In experiment DSAEF_D, when the new similarity region and ensemble method are added simultaneously, the model’s forecasting capability is significantly improved. Compared with DSAEF_A, the TS250 of DSAEF_D increases from 0.1998 to 0.3114, and the TS100 increases from 0.3037 to 0.3428, which is an increase of 55.8% and 12.8%, respectively. TSsum increases from 0.5035 to 0.6542, an increase of 29.9%.
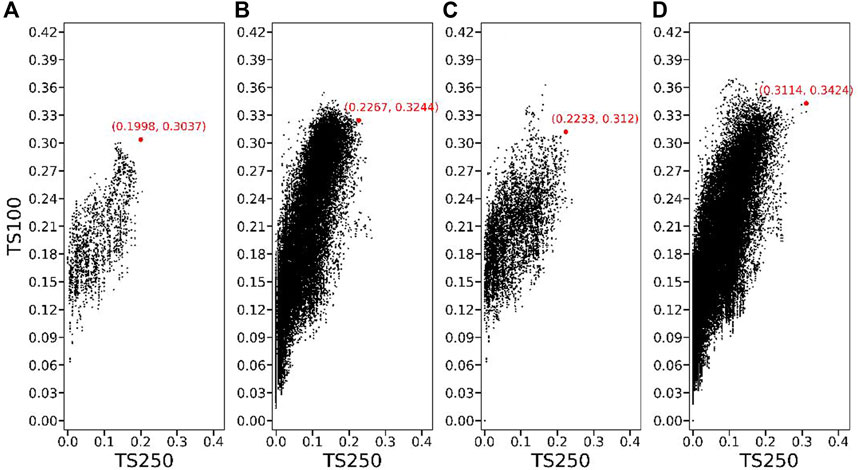
FIGURE 3. Threat scores of (A) DSAEF_A, (B) DSAEF_B, (C) DSAEF_C and (D) DSAEF_D in the accumulated precipitation simulation experiment for 30 training samples, in which each black dot represents a scheme and the red dot indicates the best scheme with the maximum TSsum (TSsum = TS250 + TS100).
The parameter values of the best scheme for the four experiments are given in Table 2. From Table 2, it can be seen that the parameters of the best scheme for the four experiments are very different, such as, the numbers of ensemble members (determined by P7) of DSAEF_A, B, C, D are 2, 5, 7, and 7, respectively. In the experiments with the addition of the new values of the similarity region (DSAEF_B and DSAEF_D), the new value of P2 is used in the best scheme. And the new ensemble method is also used in DSAEF_C and DSAEF_D. This indicates that the new values of similarity region and the ensemble scheme have a positive effect on the forecasting capability of the model.
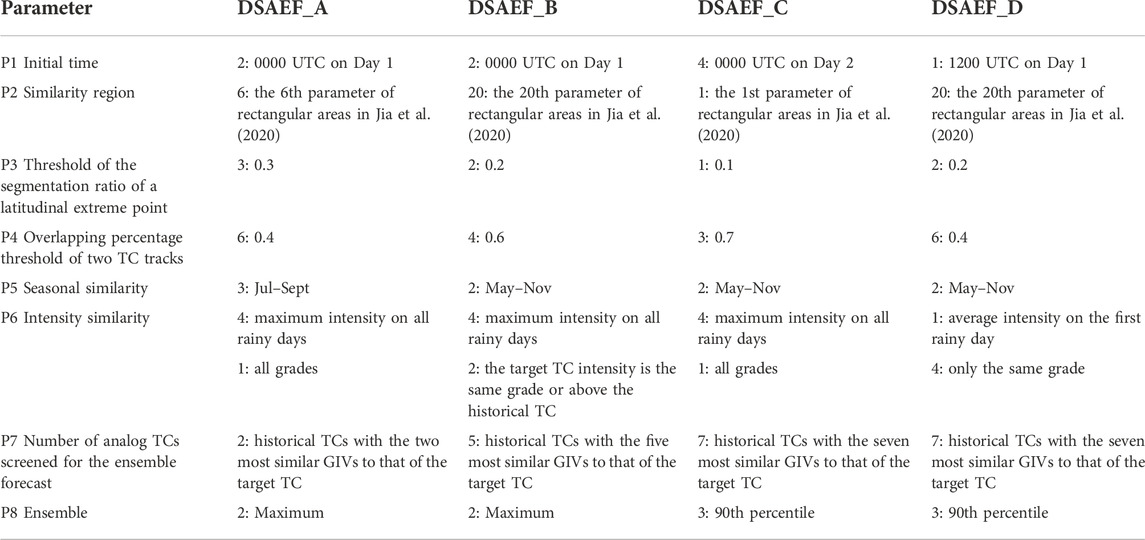
TABLE 2. Parameter values of the best scheme in the four experiments.
4.2 Forecast experiments
After obtaining the best scheme of the four experiments, as reported in the previous section, the four best schemes could be applied to the forecast experiments for 12 independent samples during 2016–2020, and their forecast performances were compared with the four NWP models (Figure 4). For the forecast of accumulated precipitation over 250 mm, the TS of both ECM and GRP is 0. The TS250 of the best schemes of the four models have advantages compared with the NWP models, demonstrating that DSAEF_LTP is good at forecasting precipitation over 250 mm, of which DSAEF_D performs the best, with a TS250 of 0.1767. For forecasts of accumulated precipitation ≥100 mm, DSAEF_D and DSAEF_B rank as the top two, with a TS100 of 0.2386 and 0.2268, respectively, which exceeds the best performer of the NWP models (mSH, with a TS100 of 0.2225). Except for DSAEF_A (original DSAEF_LTP model), whose TSsum (0.0974) is smaller than three of the NWP models (i.e., ECM, mSH and NCP), the TSsum of the best scheme of the other three improved DSAEF_LTP results exceeds those of the three NWP models. The TSsum of DSAEF_B, C and D is 0.2615, 0.2496 and 0.4153, respectively, and the TSsum of ECM, GRP, mSH, and NCP is 0.1769, 0.0622, 0.2403, and 0.2143. Among all the models, DSAEF_D ranks first, higher than DSAEF_A and higher than the best performer of the NWP models (mSH). From the forecast results above, regardless of whether adding the new values of ensemble method or similarity region or both, the forecast performance of the DSAEF_LTP model is improved when forecasting TC accumulated precipitation above 100 mm and 250 mm. The improved models (DSAEF_B to D) show advantages in predicting rainfall over 250 mm, and are comparable to the NWP models when predicting rainfall at magnitudes of 100 mm.
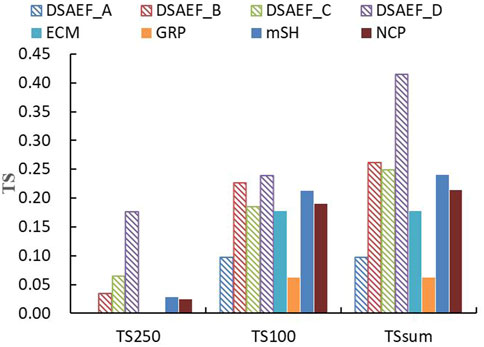
FIGURE 4. Comparison of the TS of the DSAEF_LTP model with four numerical models (ECM, GRP, NCP, mSH) in independent forecast experiments in Fujian Province.
To further analyze the forecast skill of the DSAEF_LTP model, Figure 5 shows the FAR and MAR results of the four experiments compared with the four NWP models. It can be seen from the FAR250 and MAR250 results that, in terms of the forecast of accumulated precipitation ≥250 mm, the performances of the different NWP models are diametrically opposed. ECM and mSH have a FAR close to 1, indicating that their forecasted precipitation amounts are higher, which may relate to the physical characteristics of these models. The NCP model has a FAR of 0 for only one typhoon case (1617), and there are neither hits nor false alarms, so the result of the average FAR250 of the 12 TC samples is 0. GRP fails to forecast hits and false-alarm stations. For MAR250, a gradual decrease from DSAEF_A to D is shown, with the best being DSAEF_D with a score of 0.4048. The score for mSH is 0.6670, while the other three NWP models are closer to 1. That is, the forecast performance of DSAEF_D is the best. In the forecasting of accumulated precipitation ≥100 mm, the FAR of the NWP models ranges from 0.48 to 0.61, while that of DSAEF_A to D is 0.61–0.7. The NWP model scores all exceed that of DSAEF_LTP, and DSAEF_LTP does not perform as well as the NWP models in terms of FAR100. For MAR100, DSAEF_B and D perform better among all the DSAEF models, with values of 0.4704 and 0.4885, which is also better than the best NWP model (mSH) with a MAR100 of 0.5224. From the above analysis, as the magnitude of TC precipitation increases, the DSAEF_D model begins to show lower FAR and MAR. This reflects the advantages of DSAEF_D in extreme precipitation forecasting. The new values of similarity region and ensemble method can further improve the capability of this model in forecasting precipitation.
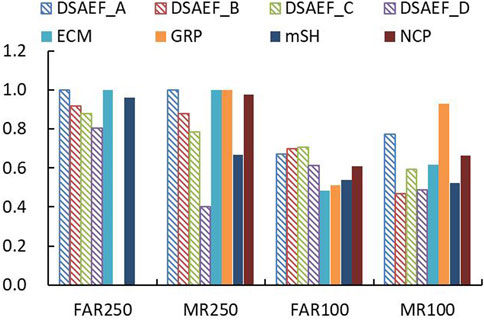
FIGURE 5. Comparison of the FAR and MAR of the DSAEF_LTP model with four numerical models (ECM, GRP, NCP, mSH) in independent forecast experiments in Fujian Province.
Figures 6A,B compare the forecast performances of the four configurations of the DSAEF_LTP model and the four NWP models for each LTC. The dashed line is the maximum single-station accumulated precipitation for each TC. In general, the larger the single-station maximum accumulated precipitation of a TC, the higher the TS value tends to be, both in terms of TS250 and TS100. For accumulated precipitation above 250 mm, only three TCs—TC1601, TC1614 and TC1617—caused more than 250 mm of precipitation in Fujian. Both the NWP models and the DSAEF_LTP models have no values on TS250 for the forecast of TC1601. In both TC1614 and TC1617, only one NWP model has forecasting ability on TS250 with a score less than 0.1, and the DSAEF_LTP models performed more prominently than the NWP models, with DSAEF_D scoring 0.33 for TC1614 and 0.55 for TC1617 on TS250, respectively. For accumulated precipitation above 100 mm, the advantages of the DSAEF_LTP models are not so obvious in the performance of TS100 as in TS250. Both the NWP models and the DSAEF_LTP models score 0 on TC 1822. Comparing the best performer of DSAEF_LTP models and NWP models, The forecasting ability of the NWP models are better than that of the DSAEF_LTP models for seven individual TC cases, and the remaining TC1619, TC2005, and TC2006 are the ones where the DSAEF_LTP models outperforms the NWP models, and it can be seen that all the NWP models score 0 in the TS100 for TC2005 and TC 2006, which basically has no forecasting ability, while the DSAEF_LTP model has forecasting ability for them, reflecting the unique advantages of the DSAEF model. In order to analyze the differences in the forecast performance of the DSAEF_LTP model in forecasting different TC precipitation in Fujian, the top four TCs with higher TSsum and the bottom four TCs with lower TSsum in independent sample tests simulated by the DSAEF_D model are analyzed, respectively. Figure 7 shows the tracks and intensities of the top four and bottom four TCs. It can be clearly seen (Figure 7A) that, among the top four TC cases, two TCs make landfall in Taiwan first and then along the central coast of Fujian, one TC directly makes landfall along the southern coast of Fujian after wiping off from southern Taiwan, and the track of one TC is located in the northern South China Sea, where it hovers and circles before finally moving westward away from Fujian. As for the forecast performance of the bottom four TCs (Figure 7B), it can be seen that all four do not land directly in Fujian; three of them are active in the South China Sea to the south of Fujian and land in Guangdong, and the remaining TC moves northward in the Northwest Pacific to the east of Taiwan, which is far away from Fujian.
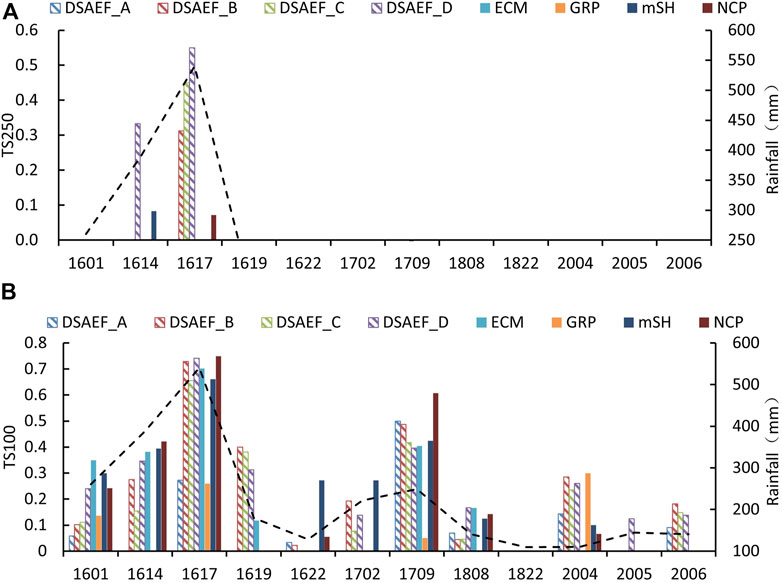
FIGURE 6. Comparison of the TS (histogram) in the four DSAEF_LTP model experiments and four NWP models (ECM, GRP, NCP, mSH) for each TC in independent forecast experiments and the maximum single-station accumulated precipitation (dashed line) for each TC accumulated precipitation (A) above 250 mm and (B) above 100 mm.
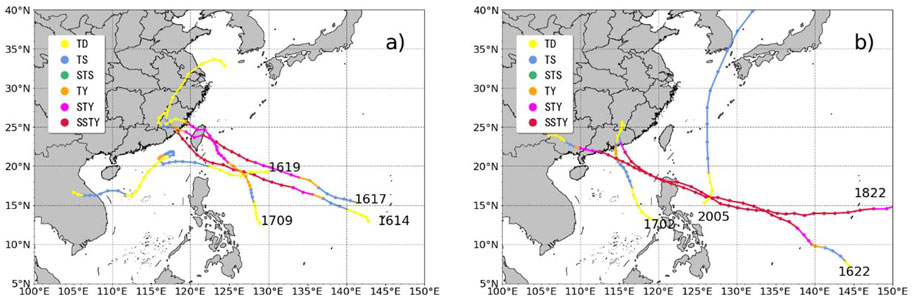
FIGURE 7. The TC tracks and intensity of (A) the top four TCs with higher TSsum and (B) the bottom four TCs with lower TSsum in independent forecast experiments simulated by the DSAEF_D model.
To better understand the characteristics of the DSAEF_LTP model and test whether DSAEF_LTP model has an advantage for NWP in the two subgroups of Figures 7, 8 compares the average TS of the DSAEF_LTP model with the NWP models for these two subgroups, i.e., the top four TCs with higher TSsum and the bottom four TCs with lower TSsum produced by the DSAEF_LTP models.
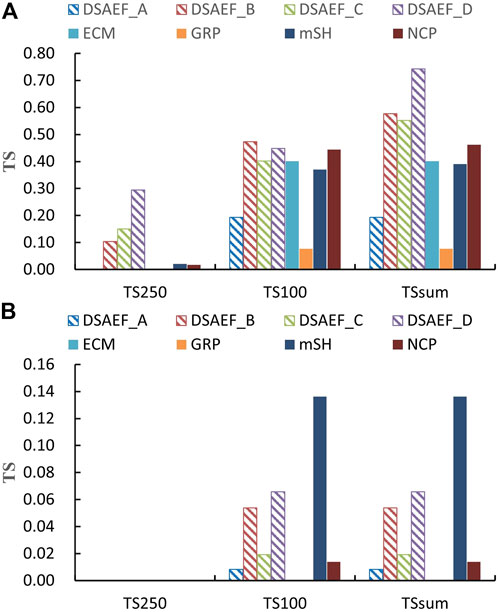
FIGURE 8. Comparison of the average TS of the DSAEF_LTP model with four numerical models (ECM, GRP, NCP, mSH) in independent forecast experiments in Fujian Province. (A) The top four TCs with higher TSsum,(B) the bottom four TCs with lower TSsum.
In terms of the four TCs with the best performance (i.e., TCs in Figure 7A) predicted by the DSAEF_LTP model, the improved DSAEF_LTP model generally outperforms the NWP models on the TS250 (Figure 8A), with the best DSAEF_D performance of 0.2944, while only mSH and NCP are greater than 0 among the four NWP models, and mSH only has the largest TS of 0.0208. The DSAEF_LTP model shows great advantages compared with NWP models at this precipitation level. When predicting the accumulated precipitation of ≥100 mm, the performance of DSAEF_LTP model and NWP model is closer, but the best performer of DSAEF_LTP model still has slight advantages over the best performer of NWP models. For TSsum, the DSAEF_D performs best among the DSAEF_LTP models with TSsum of 0.7432, which far exceeds the best performer NCP with TSsum of 0.4624.
In terms of the four TCs with the worst performance (i.e., TCs in Figure 7B), both the DSAEF_LTP model and NWP models have generally low TS (Figure 8B), and on the TS250, no member of DSAEF_LTP model or NWP gets a score; on the TS100, the highest TS is mSH of 0.1364 and DSAEF_D ranks second with 0.0657. Therefore, it can be seen that the DSAEF_LTP model is comparable to NWP models, but there is still a big gap with mSH.
From the above description, it is obvious that the DSAEF_LTP model performs better for heavy rainfall produced by TCs that travel westward and make landfall in Fujian, and does not perform well for individual TC cases that are active in the South China Sea and cause heavy precipitation in Fujian. Therefore, it is necessary to strengthen the forecasting ability of the model for TCs in the South China Sea.
4.3 Analysis of representative cases
To demonstrate the characteristics of the improved DSEAF_LTP model, Figures 9, 10 show the precipitation distribution fields of two TCs (TC1617, with higher TSsum, and TC1622, with lower TSsum) produced by the improved DSAEF_LTP model with the new parameter values of similarity region and ensemble method added.
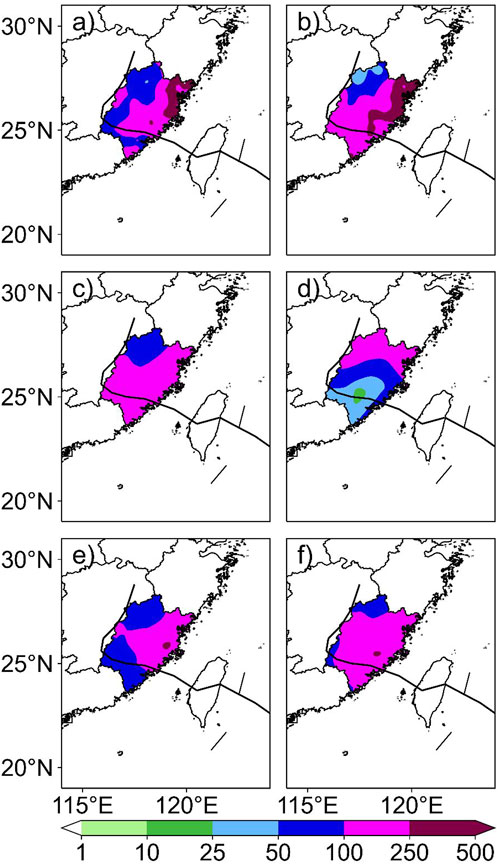
FIGURE 9. Accumulated precipitation distribution of TC1617 (Megi): (A) observed precipitation; (B) DSAEF_LTP model forecast; (C) ECM forecast; (D) GRP forecast; (E) mSH forecast; (F) NCP forecast. The black solid line is the observed track.
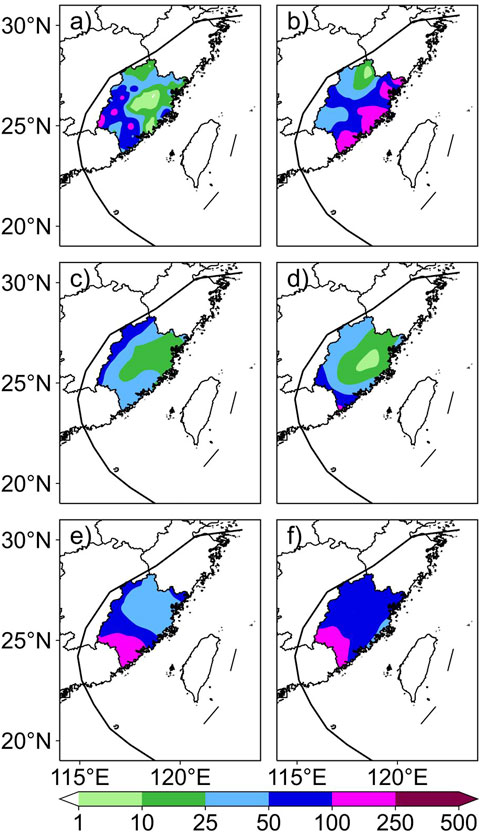
FIGURE 10. Accumulated precipitation distribution of TC1622 (Haima): (A) observed precipitation; (B) DSAEF_LTP model forecast; (C) ECM forecast; (D) GRP forecast; (E) mSH forecast; (F) NCP forecast. The black solid line is the observed track.
For TC1617 (Figure 9), DSAEF_D performs best in predicting the accumulated precipitation of ≥250 mm, and its precipitation patterns for northeastern Fujian agree well with observations, while the four NWP models cannot forecast heavy rainfall in northeastern Fujian Province at all. For the forecast of precipitation ≥100 mm, although the TS of DSAEF_D is the highest among the four experiments, however, it is still slightly worse than the NCP model. This is mainly caused by the false-alarming of heavy rainstorms in western and southern Fujian Province. Although the DSAEF_LTP model has imperfect forecasting effects in terms of fine-grained representation of TC heavy precipitation characteristics, the model-predicted heavy precipitation distribution can provide a good reference for forecasters and decision-makers in most cases.
For TC1622 (Figure 10), heavy rainfall ≥100 mm occurred in the south of Fujian. Only mSH and NCP successfully capture part of this heavy rainfall, and the forecast results of the other models, including DSAEF_D, ECM and GRP, have null TSs. For the DSAEF_LTP model, the heavy rainfall predicted by DSAEF_D is in the southeast of Fujian, which represents a relatively large deviation from the observed location, producing widespread false-alarm areas. Therefore, the DSAEF_LTP model needs to be further improved to reduce the FAR of its predictions.
It can be seen from the above analysis that DSAEF_D performs more stably and better than the other versions of the DSAEF_LTP model regardless of whether judging the performance according to the average value of TS, FAR or MAR of the independent sample TCs. Besides, compared with the other versions of the DSAEF_LTP model, DSAEF_D performs well for both of the precipitation thresholds focused upon in this work. Compared with the four NWP models, the TSsum of DSAEF_D is higher. Thus, applying DSAEF_D with the parameter values given in the fourth column in Table 2 in Fujian Province can provide reliable prediction results.
5 Summary and discussion
In this study, five new values of similarity region and four new ensemble methods are added in the DSAEF_LTP model. Then, four experiments are conducted to identify the best scheme of the original and improved versions of the DSAEF_LTP model, and the best schemes of the four experiments are applied to TC precipitation prediction in Fujian Province. The forecasting performances of the DSAEF_LTP model are then compared with those of four NWP models. The main conclusions are as follows:
(1) The forecasting performance of the DSAEF_LTP model is significantly improved by adding the new values of similarity region or ensemble method. Also, the performance in Fujian Province is maximized when the values of these two parameters are both added (DSAEF_D), with the TSsum increasing from 0.0974 to 0.4153 relative to DSAEF_A. Analysis of two representative cases (TC1617 and TC1622) further demonstrates that the DSAEF_D model can successfully capture the heavy rainfall center in Fujian Province, while the model needs to be further improved to reduce the FAR.
(2) Compared with the TSs of the four NWP models, the DSAEF_LTP model versions (DSAEF_A to D) show advantages in predicting heavy rainfall at magnitude of ≥250 mm, and the improved models (DSAEF_B to D) are comparable to or better than the NWP models in predicting rainfall of ≥100 mm, of which the TS of DSAEF_D ranks first. On the whole, the forecasting performances of the improved models are better than those of the NWP models, and the TSsum of the best-performing DSAEF_LTP model (i.e., DSAEF_D) is higher than the best-performing NWP model (i.e., mSH).
(3) Analysis of the DSAEF_LTP model in Fujian Province shows that the model is better able to forecast TC extreme precipitation when the TC has made landfall in Fujian Province. Conversely, it is poor at forecasting the precipitation of TCs in the South China Sea that do not make landfall in Fujian or move northward in the Northwest Pacific far away from Fujian, meaning further improvement of the DSAEF_LTP model for Fujian Province is necessary.
After building and improving the DSAEF_LTP model, its application becomes a major issue. Previous studies have rarely focused on a small area, such as a single province, to choose the experimental TC samples, the best scheme, and then test the forecasting performance of the DSAEF_LTP model. This paper provides ideas for the operational application of the DSAEF_LTP model in different provinces. Adopting different schemes in different regions is an important method to improve the predictability of the DSAEF_LTP model.
Data availability statement
The original contributions presented in the study are included in the article/Supplementary Material, further inquiries can be directed to the corresponding author.
Author contributions
FR designed research. ZS conceptualized the analysis and wrote the manuscript. All authors were involved in helpful discussions and contributions to the manuscript.
Funding
This work was supported by the Natural Science Foundation of Fujian Province, China (Grant No. 2022J01445 and 2021J01464), the National Key R&D Program of China (Grant No. 2019YFC1510205), the Major Science and Technology Projects of Fujian Key Laboratory of Severe Weather (2022TF02), the Hainan Provincial Key R&D Program of China (SQ2019KJHZ0028), and the Jiangsu Collaborative Innovation Center for Climate Change.
Conflict of interest
The authors declare that the research was conducted in the absence of any commercial or financial relationships that could be construed as a potential conflict of interest.
Publisher’s note
All claims expressed in this article are solely those of the authors and do not necessarily represent those of their affiliated organizations, or those of the publisher, the editors and the reviewers. Any product that may be evaluated in this article, or claim that may be made by its manufacturer, is not guaranteed or endorsed by the publisher.
References
Ams (2000). Policy statement: Hurricane research and forecasting. Bull. Amer Meteor Soc. 81 (6), 1341–1346.
Chen, L. S., and Meng, Z. Y. (2001). Progress of tropical cyclone research in China in the past decade(in Chinese). Chin. J. Atmos. Sci. 3, 420–432.
Ding, C., Ren, F., Liu, Y., Mcbride, J. L., and Feng, T. (2020). Improvement in the forecasting of heavy rainfall over south china in the DSAEF_LTP model by introducing the intensity of the tropical cyclone. Weather and Forecasting 35, 1–45. doi:10.1175/WAF-D-19-0247.1
Ebert, E. E., Turk, M., Kussion, S. J., Yang, J., Seybold, M., Keehn, P. R., et al. (2011). Ensemble tropical rainfall potential (eTRaP) forecasts. Weather Forecast. 26, 213–224. doi:10.1175/2010WAF2222443.1
Elsberry, R. L., and Tsai, H. C. (2014). Situation-dependent intensity skill metric and intensity spread guidance for Western North Pacific tropical cyclones. Asia. Pac. J. Atmos. Sci. 50 (3), 297–306. doi:10.1007/s13143-014-0018-5
Jia, L., Jia, Z., Ren, F., Ding, C., Wang, M., Feng, T., et al. (2020). Introducing TC intensity into the DSAEF_LTP model and simulating precipitation of super-typhoon Lekima (2019). Q. J. R. Meteorol. Soc. 146, 3965–3979. doi:10.1002/qj.3882
Jia, L., Ren, F., Ding, C., Jia, Z., Wang, M., Chen, Y., et al. (2022). Improvement of the ensemble methods in the dynamical-statistical-analog ensemble forecast model for landfalling typhoon precipitation. J. Meteorological Soc. Jpn. 100 (3), 2022–2592. doi:10.2151/jmsj.2022-029
Jia, Z., Ren, F., Zhang, D., Ding, C., Yang, M., Feng, T., et al. (2020). An application of the LTP_DSEF model to heavy precipitation forecasts of landfalling tropical cyclones over China in 2018. Sci. China Earth Sci. 63 (1), 27–36. doi:10.1007/s11430-019-9390-6
Kidder, S. Q., Kusselson, S. J., Knaff, J. A., Turk, M., Ferraro, R. R., and Kuligowski, R. J. (2005). The tropical rainfall potential (TRaP) technique. Part I: Description and examples. Weather Forecast. 20 (4), 456–464. doi:10.1175/WAF860.1
Lee, C. S., Huang, L. R., Shen, H. S., and Wang, S. T., A climatology model for forecasting typhoon rainfall in taiwan. Nat. Hazards (Dordr)., 2006, 37(1): 87–105, doi:10.1007/s11069-005-4658-8
Lei, X, Fong, C, Malano Vicente, B., and Che, I (2019). Overview on the progress of working group on meteorology of ESCAP/WMO typhoon committee in the recent 10 years. Trop. cyclone Res. Rev. 8 (2), 84–94. doi:10.1016/j.tcrr.2019.07.008
Li, B., and Zhao, S. X. (2009). Development of forecasting model of typhoon type rainstorm by using SMAT. J. Meteorol. (in Chinese) 35 (6), 3–12.
Liu, C. C. (2009). The influence of terrain on the tropical rainfall potential technique in taiwan. Weather Forecast. 24 (3), 785–799. doi:10.1175/2008WAF2222135.1
Lonfat, M., Rogers, R., Marchork, T., and Marks, F. D. (2007). A parametric model for predicting hurricane rainfall. Mon. Weather Rev. 135 (9), 3086–3097. doi:10.1175/MWR3433.1
Lu, X. Q., Yu, H., Ying, M., Zhao, B., Zhang, S., Lin, L., et al. (2021). western North pacific tropical cyclone database created by the China meteorological administration. Adv. Atmos. Sci. 38 (4), 690–699. doi:10.1007/s00376-020-0211-7
Marks, F. D., Kappler, G., and Demaria, M. Development of a tropical cyclone rainfall climatology and persistence (RCLIPER) model [R]. San Diego, CA, USA: Proceedings of the Preprints, 25th Conference on Hurricanes and Tropical Meteorology. June 2002, 327–328
Matsuura, T., Yumoto, M., and Iizuka, S. (2003). A mechanism of interdecadal variability of tropical cyclone activity over the Western North Pacific. Clim. Dyn. 21, 105–117. doi:10.1007/s00382-003-0327-3
Ren, F. M., Gleason, B., and Easterling, D. R. (2001). A technique for partitioning tropical cyclone precipitation. J. Trop. Meteorology (in Chinese) 17 (3), 308–313. doi:10.3969/j.issn.1004-4965.2001.03.015
Ren, F. M., Qiu, W. Y., Jiang, X. L., Wu, L. G., Xu, Y. L., and Duan, Y. H. (2018). An objective track similarity index and its preliminary application to predicting precipitation of landfalling tropical cyclones. Weather Forecast. 33, 1725–1742. doi:10.1175/WAF-D-18-0007.1
Ren, F. M., Wang, Y. M., Wang, X. L., and Li, W. (2007). Estimating tropical cyclone precipitation from station observations. Adv. Atmos. Sci. 24 (4), 700–711. doi:10.1007/s00376-007-0700-y
Ren, F., Ding, C., Zhang, D., Chen, D., Ren, H., and Qiu, W. (2020). A dynamical-statistical-analog ensemble forecast model: Theory and an application to heavy rainfall forecasts of landfalling tropical cyclones. Mon. Weather Rev. 148 (4), 1503–1517. doi:10.1175/mwr-d-19-0174.1
Ren, Fumin, and Xiang, Chunyi (2017). Review and prospect of researches on the pre liction of precipitation associated with landfalling tropical cyclones. Journal of Marine Meteorology 37 (4), 8–18. doi:10.19513/j.cnki.issn2096-3599.2017.04.002
Tsai, H. C., and Elsberry, R. L. (2017). Seven-Day intensity and intensity spread predictions for atlantic tropical cyclones. Weather Forecast. 32 (1), 141–147. doi:10.1175/WAF-D-16-0165.1
Tsai, H. C., and Elsberry, R. L. (2015). Seven-day intensity and intensity spread predictions for Western North Pacific tropical cyclones. Asia. Pac. J. Atmos. Sci. 51 (4), 331–342. doi:10.1007/s13143-015-0082-5
Tsai, H. C., and Elsberry, R. L. (2016). Skill of Western North Pacific tropical cyclone intensity forecast guidance relative to Weighted-Analog technique. Asia. Pac. J. Atmos. Sci. 52 (3), 281–290. doi:10.1007/s13143-016-0001-4
Wang, X. F., and Zhou, R. W., 2021.Performance verification of global precipitation forecast over Yalong River Basin in flood season (in Chinese).Meteor Mon, 47(10):1193–1205.
Ying, M., Zhang, W., Yu, H., Lu, X., Feng, J., Fan, Y., et al. (2014). An overview of the China meteorological administration tropical cyclone database. J. Atmos. Ocean. Technol. 31, 287–301. doi:10.1175/JTECH-D-12-00119.1
Zhang, F., Minamide, M., Nystrom, R. G., Chen, X., Lin, S., and Harris, L. M., (2019). Improving harvey forecasts with next-generation weather satellites: Advanced hurricane analysis and prediction with assimilation of GOES-R all-sky radiances. Bull. Am. Meteorol. Soc.100 (7), 1217–1222. doi:10.1175/BAMS-D-18-0149.1
Keywords: landfalling typhoon, accumulated precipitation forecast, DSAEF_LTP model, forecasting performance, Fujian province
Citation: Su Z, Ma Y, Jia L, Ren F and Ding C (2023) Application of the improved dynamical–Statistical–Analog ensemble forecast model for landfalling typhoon precipitation in Fujian province. Front. Earth Sci. 10:1018851. doi: 10.3389/feart.2022.1018851
Received: 14 August 2022; Accepted: 21 September 2022;
Published: 05 January 2023.
Edited by:
Yuqing Wang, University of Hawaii at Manoa, United StatesReviewed by:
Jianqi Sun, Institute of Atmospheric Physics (CAS), ChinaKelvin T. F. Chan, Sun Yat-sen University, China
Copyright © 2023 Su, Ma, Jia, Ren and Ding. This is an open-access article distributed under the terms of the Creative Commons Attribution License (CC BY). The use, distribution or reproduction in other forums is permitted, provided the original author(s) and the copyright owner(s) are credited and that the original publication in this journal is cited, in accordance with accepted academic practice. No use, distribution or reproduction is permitted which does not comply with these terms.
*Correspondence: Fumin Ren, Zm1yZW5AMTYzLmNvbQ==