 Aqsa Anees1†
 Hucai Zhang1
 Umar Ashraf1†Ren Wang2,3
 Hung Vo Thanh4
 Ahmed E. Radwan5Jar Ullah6Ghazanfer Raza Abbasi7Ibrar Iqbal8Nafees Ali9,10
 Xiaonan Zhang1Shucheng Tan11*Wanzhong Shi2,3*
- 1Institute for Ecological Research and Pollution Control of Plateau Lakes, School of Ecology and Environmental Science, Yunnan University, Kunming, China
- 2School of Earth Resources, China University of Geosciences, Wuhan, China
- 3Key Laboratory of Tectonics and Petroleum Resources, Ministry of Education, China University of Geosciences, Wuhan, China
- 4School of Earth and Environmental Sciences, Seoul National University, Seoul, South Korea
- 5Faculty of Geography and Geology, Institute of Geological Sciences, Jagiellonian University, Kraków, Poland
- 6Institute of Geophysics and Geomatics, China University of Geosciences, Wuhan, China
- 7Physical Science and Engineering Division, King Abdullah University of Science and Technology (KAUST), Thuwal, Saudi Arabia
- 8School of Earth Sciences, Zhejiang University, Hangzhou, China
- 9State Key Laboratory of Geomechanics and Geotechnical Engineering, Institute of Rock and Soil Mechanics, Chinese Academy of Sciences, Wuhan, China
- 10University of Chinese Academy of Sciences, Beijing, China
- 11School of Resource Environment and Earth Science, Yunnan University, Kunming, China
Future gas field development and prospect assessment depend on accurate reservoir parameter characterization. The understanding of the tight sand distribution of the Shanxi and Taiyuan Formations within the Hangjinqi area is ambiguous due to the presence of coal and mudstone lithofacies, high heterogeneity, and poor resolution of the seismic data. Thus, it is difficult to determine the reservoir’s thickness. To cope with this challenge, we have employed the advanced method of constrained sparse spike inversion (CSSI) utilizing 3D seismic and nine wells for the distinction of tight sandstone facies from the coal and mudstone facies. Results of petrophysical analysis of studied well J54 show that the coal and mudstone facies are dominant towards the T9c horizon, whereas tight sandstone facies are present towards the T9d horizon. The obtained findings show that the CSSI accurately identified the spatial distribution of sand-ratio in the zone of interest (ZOI) that lies between the T9c and T9d horizons. The acoustic impedance (AI) of coal shows the lowest AI values, whereas the tight sandstone shows the highest AI values. The tight sandstone facies shows moderate values of AI in the range of 8.5 × 10⁶ kg/m2s to 1.20 × 10⁷ kg/m2s. The impedance map of T9c suggested the presence of coal and mud facies, whereas the T9d impedance map suggest the presence of maximum tight sandstone facies. The sand-ratio map of T9d showed maximum reservoir thickness that ranges from 0.65-0-95, whereas the sand-ratio value mostly ranges from 0 to 0.5 on the T9c map. The maximum sand-ratio values on T9d show that the lower Shanxi Formation has good reservoir characteristics. Whereas, due to the presence of coal and mudstone in the Taiyuan Formation, the T9c map shows low values of sand-ratio. The maximum sand-ratio regions within the targeted T9c-T9d layers should be exploited for future gas explorations.
1 Introduction
Tight sandstone gas is the world’s top unconventional natural gas source and has emerged as a crucial characteristic for natural gas production. Also, unconventional tight gas contributes the most to China’s yearly production of natural gas, accounting for 24.6% of total output (Dai et al., 2012). Tight sandstone is generally defined as a reservoir with porosity of around 12% and less than 1mD (Dai et al., 2012). Henceforth, reservoir characterization and reservoir quality prediction are thus being studied by a large number of geologists, geophysicists, petrophysicist and petroleum engineers (Ehsan et al., 2018; Abdulaziz et al., 2019; Ashraf et al., 2019; Ehsan et al., 2019; Qiang et al., 2020; Radwan, 2020; Vo Thanh et al., 2020; Ashraf et al., 2021; Kassem et al., 2021; Radwan, 2021; Radwan et al., 2021; Dar et al., 2022; Jiang et al., 2022; Ullah et al., 2022; Vo Thanh and Lee, 2022). The Ordos Basin has China’s biggest yearly gas production (Duan et al., 2008; Yang et al., 2015). The Hangjinqi area lies in the Ordos Basin. Pure gas exploration began here a decade ago (Anees et al., 2022b). Hangjinqi has several wells, however, the distribution of sand-ratio in many zones is unclear. Reliable reservoir property calculations such as reservoir sand distribution in relation to the acoustic impedance (AI) are crucial for production policy and decision-making (Pendrel, 2006).
Seismic inversion calculates rock parameters for reservoir characterization (Saussus and Sams, 2012) and identifies reservoir parameters such as the distribution of tight sand in relation to the mud that can be exploited for future drilling and field development (Avadhani et al., 2006). Post-stacked seismic data is converted to p-impedance layer data for AI inversion (Latimer et al., 2000). The constrained sparse spike inversion (CSSI) is an advanced approach used by geoscientists in oil and gas (Wang and Guo, 2008). In previous studies, many authors have utilized CSSI as an advanced and effective tool to measure the elastic properties of gas hydrate-bearing sediments (Riedel et al., 2010), and to estimate the coal-strata thickness (Zhu, 2011). In a recent study, authors utilized the CSSI to evaluate the sand-ratio of a heterogeneous reservoir for reservoir-quality estimation (Ashraf et al., 2020). Traditional inversion methods are difficult to use because of their dependence on the starting model. As a result, CSSI is included in our analysis since it is independent of the model and relies only on the characteristics of the original data. CSSI offers a benefit over current approaches since it can be used to analyze whole bandwidth reflectivity (Simm et al., 2014).
The recent studies within the Shanxi and Tiayun Formations were focused on the pore-structure features (Wang and Guo, 2019), fractal characteristics (Gaoyuan et al., 2021), shale gas potential within the southern region of the Ordos Basin (Li et al., 2021; Wang et al., 2021), and sedimentary facies modeling (Li et al., 2021; Zhang et al., 2022). However, a comprehensive study addressing the tight sandstone facies within the Shanxi and Taiyuan Formations is still missing. Much attention is needed to address the accurate tight sandstone reservoir distribution. Therefore, in this study, we have focused on the identification of the horizontal and vertical distribution of lithofacies by means of the AI model via regional 3D seismic and well-log data. Also, we aim to highlight the low-impedance sandstone reservoir zones that can be exploited for future gas explorations.
2 Geology of the study area
The clastic rocks from the upper Paleozoic are the most important exploration prospects for natural gas in the Hangjinqi area. The black mudstone and coal of the tidal flat-delta-lake facies make up the majority of the gas source rocks and are found in the Shanxi and Taiyuan Formations (Wu et al., 2017). The cap rocks are comprised of the upper Shihezi Formation and Shiqianfeng Formation, while the reservoirs are composed of shore sand bodies, deltaic braided channels, interdistributary channels, and channel-bar sand bodies (all of which are found in the Shanxi and Lower Shihezi Formations). The tight sandstones of the Lower Shihezi Formation, which include sandy fluvial conglomerate and coarse-to-fine-grained sandstones, are acting as the primary reservoir within the Hangjinqi area (Zhang et al., 2009; Anees et al., 2019). Recent studies show that the member-1 of the Lower Shihezi Formation has good reservoir quality and has the potential to develop gas reserves on a regional and commercial scale (Anees et al., 2022a). In addition, the northern region of the member-2 and member-3 of the Lower Shihezi Formation also suggested good favorable zones for gas exploration (Anees et al., 2022b).
The Hangjinqi lies at the Yishan ramp and Yimeng uplift (Figure 1A). The paleo-high in the northern Ordos Basin makes Hangjinqi ideal for hydrocarbon migration (Xue et al., 2009). From west to east, three primary faults are dispersed throughout the research area, with Porjianghaizi Fault (P-fault) separating the Hangjinqi area into north and south (Xu et al., 2018; Liu et al., 2020) (Figure 1B). According to the present geomorphology, the central region of the Ordos Basin is relatively stable and does not contain many structures. On the other hand, the margins of the basin have been subjected to multiple tectonic activities, which has resulted in structural complexity (Ju et al., 2017). Since the end of the Carboniferous era, the whole area had subsided, marking the beginning of a period in which sedimentation was shifting from the ocean (marine) to the land (continental) settings (Ju et al., 2017). At the beginning of the Triassic period, the basin began to experience an intracontinental phase, and as a result, there were collisions that occurred between the North China Block and the South China Block, as well as the collision between the Qiangtang Block and the Eurasian Plate. Tectonic forces shifted from exerting compressional to exerting extensional stress throughout the Cenozoic epoch (Ju et al., 2017). During the Cenozoic, the Ordos Basin and North China Block parted, creating six tectonic areas on the Archean-Proterozoic basement. These includes Weibei uplift, Yimeng uplift, Western thrust belt, Jinxi flexural belt, Yishan slope, and Tianhuan depression (Yang et al., 2005).
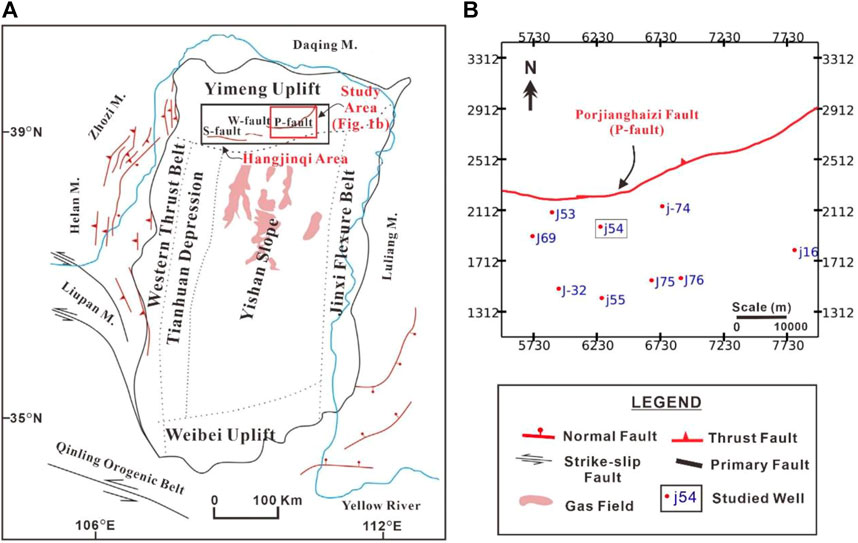
FIGURE 1. (A) The Ordos Basin’s primary tectonic units. The red colored text and box show the Hangjinqi study area. (B) 3D seismic grid along with wells utilized to execute the research. The P-fault is the main fault within the Hangjinqi area.
In the current study, we focus on the geological characteristics of the Lower Permian Shanxi (P1s) and Carboniferous Taiyuan (C3t) Formations (Figure 2). The Shanxi Formation further comprises of Shanxi-1 and Shanxi-2 members. The Taiyuan Formation was mostly formed in a marine sedimentary environment, while the Shanxi Formation was primarily deposited in a terrestrial sedimentary environment (Xu et al., 2015).
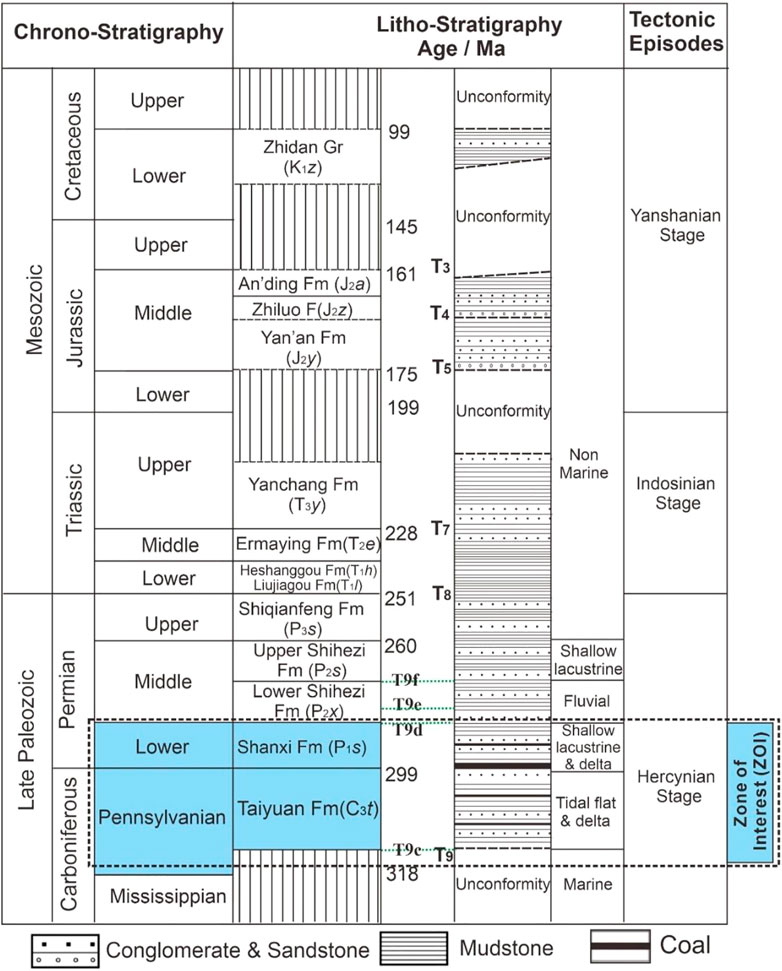
FIGURE 2. Simplified stratigraphic diagram of the study area. The highlighted blue colored text shows the studied region.
3 Data and methods
A vast grid of 3D post-stacked seismic data that incorporates around 1,000 km2 including nine wells (J16, J32, J53, J54, J55, J69, J74, J75, and J76) is utilized in our study to identify the tight sand thickness of the reservoir within the Hangjinqi area. In order to achieve the aim of the research, several geophysical logs, such as sonic (DT) (us/m), density (RHOB) (g/cm3), deep resistivity (LLD) (ohm.m), shallow resistivity (LLS) (ohm.m), caliper (CAL) (in), compensated neutron log(CNL) (dec), and gamma-ray (GR) (API), were included (Ehsan and Gu, 2020). The study was accomplished with the help of the Jason software package. In the first step of the interpretation, the stratigraphic and structural interpretations were done using seismic sections and well logs. Initially, we employed the petrophysical analysis to interpret the lithofacies and reservoir zone. Afterward, to create a synthetic seismogram, the seismic to well-tie approach was used (Ashraf et al., 2016). The T9c and T9d layers were identified as two distinct horizons within the Shaanxi and Taiyuan Formations which encompass the whole zone of interest (ZOI). The interpolation of the geological models was run along the T9c and T9d horizons. The two targeted horizons were utilized to help understand the extent of the reservoir facies and tight sand thickness distribution. In the second step, the thickness of ZOI was calculated using well-logging data on geophysical logs of the studied well J54. In the next step, to get the average wavelet, a wavelet was created for each well. It was integrated with a band-limited model to improve the inverted broadband model’s resolution by extracting average wavelet, seismic, log, and horizon data. A series of quality control (QC) tests followed to ensure the inversion results were accurate. The geostatistical analysis was used to examine the impedance maps and thickness maps in order to determine the distribution of lithofacies.
4 Results
4.1 Petrophysical analysis
In order to examine the generalized pattern of the vertical distribution of tight sand and coal facies, well J54 was selected as a case study to use as an example. The layer T9c lies at the bottom of the Taiyuan Formation, whereas T9d is situated at the top of the Shanxi (including the Shanxi-1 and Shanxi-2) Formation which is marked by red lines in Figure 3 to show the ZOI. The results of petrophysical analysis within the ZOI show the vertical distribution of coal, tight sandstone and mud lithofacies. There are three thin coal layers between 2,905–2,950 m, and a thick zone of coal lies between 2,957–2,978 m. The coal facies shows high resistivity values, low RHOB, high CNL, and low GR. The minor variations in logs values are associated with the different type of coal rank, type, gas content, and adsorption content (Mangi et al., 2020; Mangi et al., 2022; Wood and Cai, 2022). On the other hand, as compared to coal facies, the tight sandstone facies shows comparatively high GR, low resistivity values, high RHOB and low CNL. The particularly moderate values of porosity give the indication of tight sandstone in the study area. There are four porous zones that lie above the thick zone of coal facies. The tight sandstone facies are mainly present near the T9d layer. Whereas, towards the bottom of the ZOI, the region near the T9c layer shows the presence of mainly mudstone facies. The coal facies are acting as a source rock within the study, whereas the porous tight sandstone facies above the thick coal zone near 2950 m suggesting good porous zones that can act as a reservoir within the Hangjinqi area.
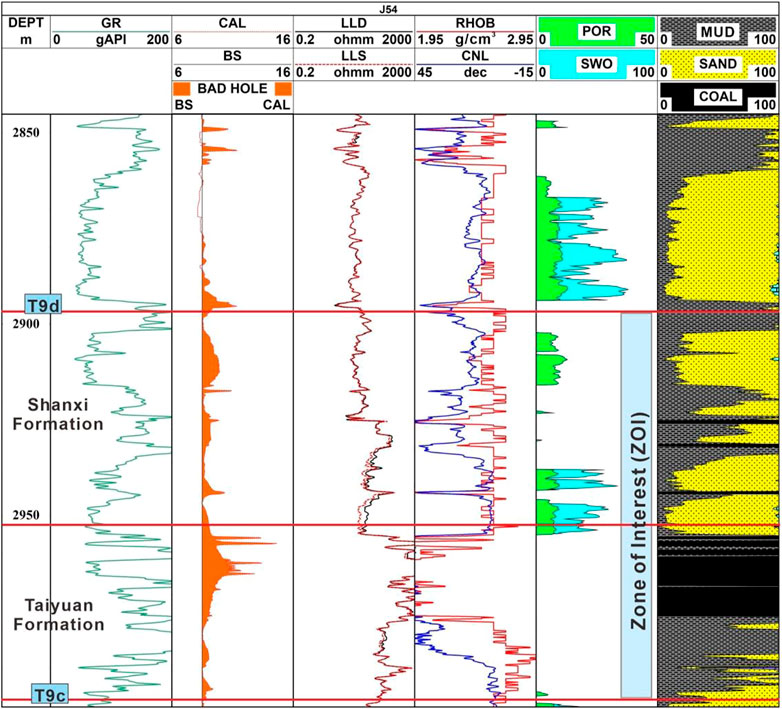
FIGURE 3. Well J54 interpretation shows the interpreted tight sandstone, mudstone and coal facies within the ZOI. The ZOI lies between the Shanxi and Taiyuan Formations.
4.2 Acoustic impedance inversion
4.2.1 Horizon interpretation
In order to make the interpretation mapping of the horizons as smooth as possible, the smoothing technique that is offered in the Jason software was used for the loaded horizons. This was done in order to limit the number of troughs and peaks in the data. The interpolation of the geological model runs along the horizons while this procedure creates a smoothed version of the interpolated well-log AI over the whole survey. The interpreted T9c and T9d horizons on the seismic section are shown in Figure 4A, while their interpolated structural maps are shown in Figure 4B and Figure 4C, respectively.
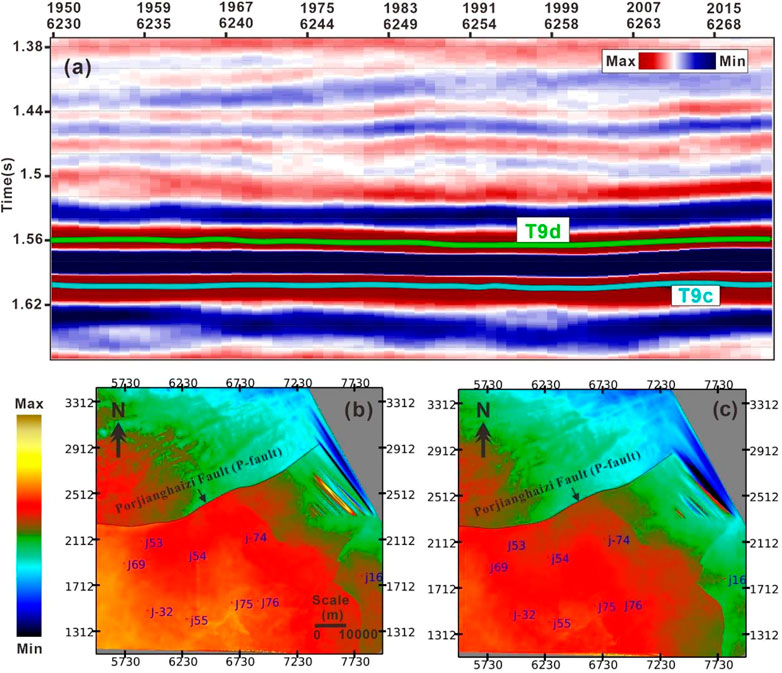
FIGURE 4. (A) Interpreted horizons T9c and T9d on the seismic section. Interpolations of horizons (B) T9c, and (C) T9d.
4.2.2 Generating missing logs
At the beginning of the investigation, the p-impedance log was not accessible for all of the study wells. As part of the process of completing the inversion, an AI log is required which was created by employing the Backus’ averaging of the DT log on the ZOI for the successful completion of the time-to-depth conversion. Since AI comprises RHOB and DT, therefore corrected DT log of some wells was utilized to generate the missing RHOB. The Jason suite has an in-built algorithm that can generate the missing RHOB log by applying Gardner’s equation (Eq. 1) to the data (Gardner et al., 1974).
4.2.3 Wavelet estimation and synthetic seismogram
In order to accomplish a reliable seismic inversion, an accurate wavelet estimate is required first and foremost. The amplitude spectrum and phase spectrum of a wavelet are the two main components. Also, it is more challenging to define the phase spectrum in comparison to the amplitude spectrum. Since the phase spectrum is the primary cause of producing errors in the inversion, it is of the utmost importance to take into consideration the correct phase spectrum, which ultimately leads to the correct inversion and the right results. The generation of synthetic seismograms for each well, which is the critical initial stage in the process of wavelet estimate, was completed so that the seismic and well data could be linked (Anees et al., 2017; Abbas et al., 2019). Because high-quality good ties are required in order to obtain the low-frequency AI trend, the step of creating a synthetic seismogram is followed by an iterative method for the tie process to improve the quality of the tie.
The amplitude spectrum is derived from the seismic data by performing an autocorrelation analysis on them. We have employed the autocorrelation technique to remove the phase from the seismic data by employing the temporal taper to the autocorrelation function in order to smooth out the spectrum (Table 1).
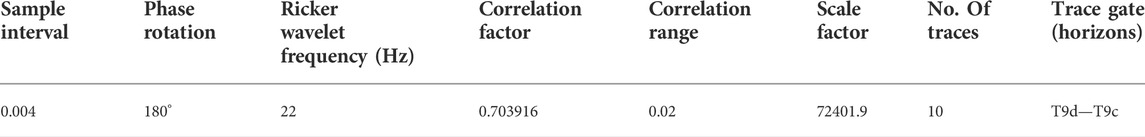
TABLE 1. Selected parameters for optimum wavelet estimation within the study area.
The seismic data was zero phase, therefore a zero phase wavelet was developed for the research region. This was done to ensure that there was a strong connection between the data from the well logs and the seismic data. The wavelet extraction was performed during the process of stretching and squeezing, and the resulting extracted wavelet was updated throughout the process of tying. This iterative procedure verifies the accurate extraction of the wavelet and creates a reliable connection between the data from the well log and the seismic data (Figure 5A). The sensitivity of the inversion procedure was evaluated with the aid of the various wavelets that were retrieved. Within the context of the seismic survey, the well placements and overall quality served as the primary considerations for the extraction of the average wavelet. The wavelet was derived from the targeted horizons of T9c to T9d, which entirely enclosed the reservoir (Figure 5B). All those wells were used to obtain the average wavelet for the available consistent wavelets which were having the DT and RHOB logs reaching the targeted depths of T9c and T9d.
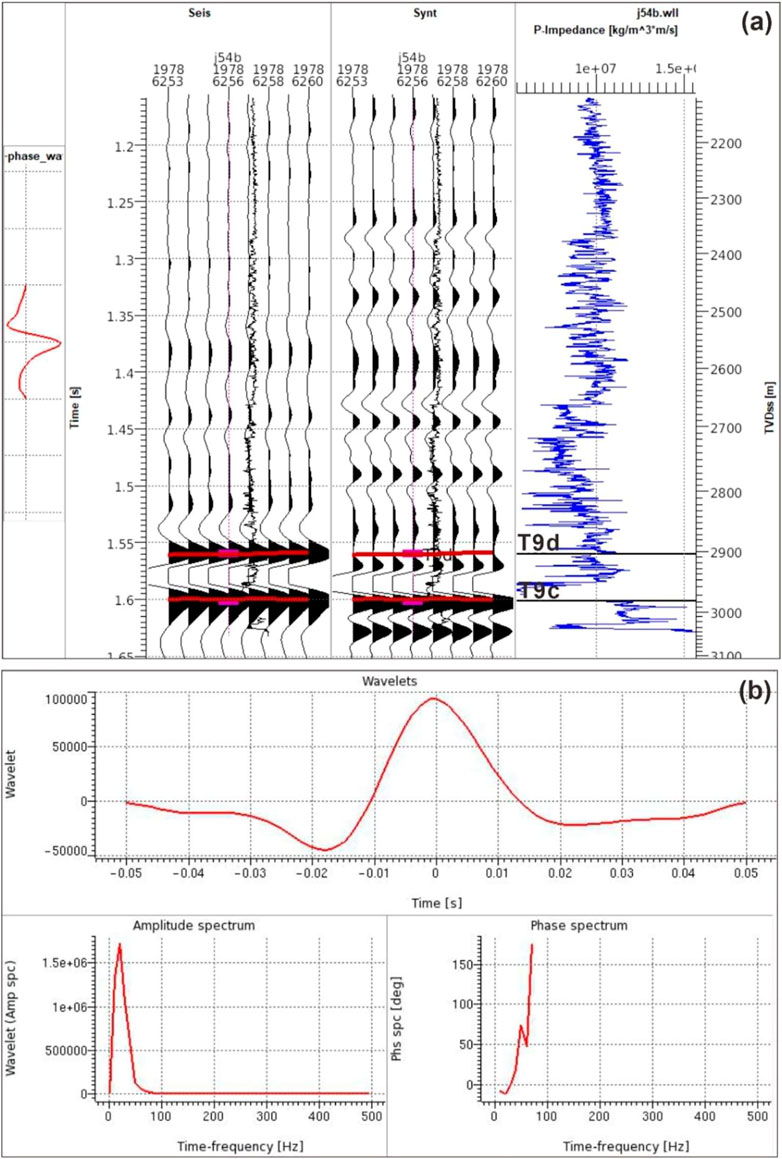
FIGURE 5. (A) Well editing window of well J54. The seismic data from chosen traces surrounding the well is shown on the left-hand panel. The synthetic from the acoustic impedance and the well logs are shown in the second and third panels, respectively. The integrated sonic was used to transform this data from depth to time from a vertical well. (B) The amplitude and phase spectrum of the average wavelet retrieved from the study wells.
4.2.4 Low-frequency model
To construct a low-frequency model, the phrases relative and absolute AI are often used to describe AI. The computation of relative AI does not take into account the development of a low-frequency model, despite the fact that it is a feature of the relative layer. The absolute AI, on the other hand, is a feature of the absolute layer that is employed for both qualitative and quantitative interpretations, as well as for the construction of low-frequency models. It is possible, however, to achieve absolute AI by using an inversion method that includes a low-frequency component (0–15 Hz) (Cooke and Cant, 2010). Sparse-spike inversion uses a distinct inversion technique for the low-frequency model, rather than using the inversion algorithm itself (Cooke and Schneider, 1983).
The presence of low-frequency disturbances in the seismic data spoils the low-frequency information, which in turn causes the low-frequency information to be disturbed in the recorded seismic data. The incorporation of the low-frequency model resulted in the generation of a zero-hertz component, which converted the relative AI values to the absolute AI values. As a result, the detection and resolution of the tight sandstone, mudstone, and coal facies were improved.
Ferguson and Margrave, 1996 provided the low-frequency AI model and algorithm that was employed in our study (Ferguson and Margrave, 1996). This model and technique are based on an approach known as iterative forward modeling (Veeken and Da Silva, 2004). This approach improved the low-frequency information by using integrated well-log data (mainly DT and RHOB logs), an estimate of seismic wavelet, 3D seismic data (band limited), and seismic horizons taken from the seismic reflectivity data. To create a low-frequency model, all wells that had logs extending to at least T9c horizon were utilized for seismic data. Figure 6 shows the generated low-frequency model for the Hangjinqi 3D seismic survey. The overlay AI log of well J54 show deflection towards the left side presenting low impedance values that are associated with the coal facies. In addition, the deflection of AI curve towards the right side shows high AI values gives the indication of mudstone and tight sandstone facies.

FIGURE 6. Low-frequency model created for study area.
Since AI inversion was band-limited, a low-frequency model was needed to create a broadband model. This low-frequency model was retrieved from well-log data and incorporated into a seismic-derived band-limited AI model. Because the distribution of the wells within the research region is not uniform, the inverse distance weighted and kriging interpolation approaches were not delivering the most accurate information. The triangulation approach was selected as the preferable method of interpolation since it was determined to be the most appropriate for the regional available data for the research. Due to the fact that it generates an interpolation of data that is continuous and smooth, this approach really produced the best interpolation results over the whole of the survey. In order to lead the interpolation between the well-logs, two different horizons (T9c and T9d) were incorporated. The low-frequency model that was produced provided a better understanding of the lateral and vertical variance of the facies that are present in the Taiyuan and Shanxi Formations.
4.2.5 Constrained sparse spike inversion
After completing the computation of the wavelets and the interpolation of the AI logs, the inversion process was completed by establishing additional parameters. They consist of the selection of lambda, trend mismatch, the maximum and lowest values of AI that the inversion is capable of achieving, as well as the p and q parameters for reflectivity and the seismic misfit term. The following is a description of the stages that were carried out in the process of inversion:
a) The preliminary step was composed of editing the trends. In most cases, the value of the p-impedance increases with the increase in the depth of the well logs. Therefore, the trends of all the wells using a targeted area (T9c-T9d) were edited.
b) Trace merging was carried out in order to combine two data sets: one that had information about the low-frequency band, and the other that contained information about the seismic bandwidth or above. The band-pass filter was applied. The frequency of the cut-off was determined to be between 0-50 (lowest to highest frequency) Hz.
c) Different QC procedures for the CSSI were carried out with the lambda factor serving as the testing variable.
After making adjustments to all of the QC parameters, CSSI was accomplished to get the results of the inverted bandlimited AI. In order to fill the missing element regarding the low-frequency, a low-frequency model was included in the model. To get the most accurate interpretation of the inversion, all of its many components were utilized. Since the full bandwidth contains the maximum bandwidth and the least amount of wavelet effects, the results of the full bandwidth inversion provided the most reliable information for interpretation. To carry out the quantitative analysis, these results were tied directly to the p-impedance logs of the wells. Once regions and ZOI on the full bandwidth result were recognized, the bandlimited and low-frequency components were further analyzed to define the underlying coalbeds from the channel tight sandstone and mudstone facies.
The results of the CSSI model are shown in Figure 7. After being integrated with the low-frequency model, the CSSI approach proves to be an efficient tool for the delineation of vertical and lateral changes in impedances of the various lithofacies. The broadband model that was generated displayed the maximum resolution possible and exhibited a vibrant variation in the AI. This variation made it possible to differentiate between the vertical and lateral extent of the coal and the tight sandstone reservoir facies that are present in the Hangjinqi region. The low-velocity influence of coal obscures the amplitude response of tight sandstone. Seismic resolution is insufficient to distinguish between coal and tight sandstone. As a result of the seismic section’s low-velocity coalbed layer producing such a high amplitude reflection, it creates a thick reflector. When it comes to interpretation, the thick reflector might be deceiving. An inversion of limited sparse spike inversion data evidently showed the coal deposit to be distinct from mudstone and tight sandstone. The coal bed (dark blue) is present between the T9d to T9c horizons in Taiyuan and Shanxi Formations. Furthermore, the AI broadband model shows that various lithologies are present in between T9c-T9d horizons which were not easily resolvable on the seismic section. The tight sandstone (yellow-brown color) is evidently differentiated from the coal layer (dark blue) and mudstone (cyan-green color). The impedance value of coal is quite low as compared to tight sandstone and mudstone facies. Whereas, the impedance of mudstone facies is moderate to high, and tight sandstone shows moderate-to-highest impedance. The impedance of coal facies lies around 6.5 × 10⁶ kg/m2s, 8.5 × 10⁶ kg/m2s for mudstone facies, and about 1 × 10⁷ kg/m2s for tight sand facies near J54 well location.
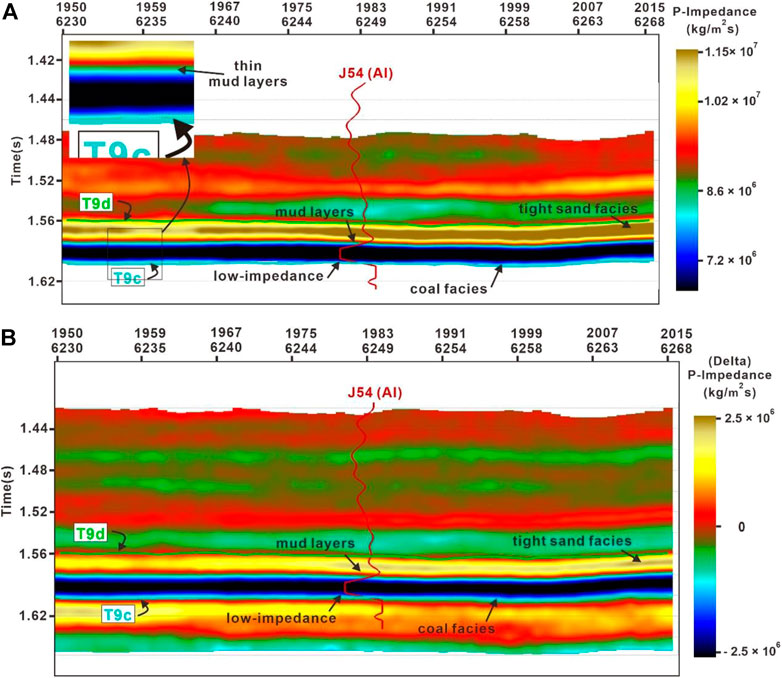
FIGURE 7. (A) Inverted broadband acoustic impedance model. Zoomed image shows the presence of thin mudstone layers (B). Inverted bandlimited acoustic impedance model. Well J54 is overlaying on the inverted models showing the vertical distribution of the p-impedance log.
Geoscientists often find worth in impedance sections that are placed between wells and overlay them with logs. As a result of the fact that impedance sections often demonstrate reservoir connection which can be correlated with porosity and impedance sections that are able to provide valuable information to geological models. For this reason, overlay log was utilized in order to validate the dependability of the inverted model. Because the seismic has a lower vertical resolution than the well logs, many beds that can be observed in the wells were not evident in the seismic. In order to make a more accurate comparison between the well logs and the inversion result, a high-cut filter was applied to the p-impedance (AI) log and then filtered back to the frequency of the inversion result. Following the completion of the filtering process, the Al log was then superimposed over the inverted AI sections.
At the J54 well site, a p-impedance log curve was superimposed on an inverted AI absolute (broadband) model (Figure 7A) and bandlimited model (Figure 7B). This indicates that the coal facies exhibit the lowest impedance values that range from 4.5 × 10⁶ kg/m2s to 6.5 × 10⁶ kg/m2s. Whereas, tight sandstone facies exhibits the highest impedance values that range from 8.5 × 10⁶ kg/m2s to 1.20 × 10⁷ kg/m2s at J54 well location. However, the mudstone facies shows a moderate value of impedance that ranges around 6.0 × 10⁶ kg/m2s to 1.15 × 10⁷ kg/m2s. For a conventional case, low AI is one of the key features of good gas reservoirs. In a previous study of conventional sand-shale reservoir, authors showed that the high-quality gas reservoirs fall somewhere in the region of 7.5 × 10⁶ kg/m2s to 9.9 × 10⁶ kg/m2s, whereas the higher values show the features of shales (Ibrahim, 2007). But, in our case, the tight sandstone shows unconventional behavior due to presence of coal. Since, the AI values of tight sandstone in the ZOI is highest as compared to mudstone and coal facies, therefore it suggests the presence of unconventional tight sandstone facies. In many recent studies, authors have showed that the tight sandstone within the Ordos Basin shows unconventional pattern where coal shows lowest impedance and tight sandstone shows highest impedance values as compared to mudstone facies (Liu et al., 2022; Pan et al., 2022).
Furthermore, the test confirmed that the inverted AI model is reliable and can be used for further reservoir characterization of sand-ratio identification.
5 Discussion
5.1 Distribution of the acoustic impedance on the targeted intervals
The AI maps of layers T9c to T9d (Taiyuan and Shanxi Formations) were generated to interpret the coal seams and the fluvial channel sandstone facies distribution of the targeted area. The AI map of T9c horizon shows the distribution of tight sandstone, mudstone and coal seam in the Taiyuan and Lower Shanxi Formations (Figure 8A). The AI map of T9d horizon shows the distribution of only tight sandstone and mudstone. Since this horizon lies at the top of the Shanxi Formation and the bottom of the Lower Shihezi-1 Formation, the majority of the area within the T9d map shows the distribution of the mainly reservoir tight sandstone (Figure 8B). The sand bodies are developed and overlapped with each other. It can also be seen from the T9d map that the effect of coal from the underlying Shanxi and Taiyuan Formations is negligible on this horizon map.
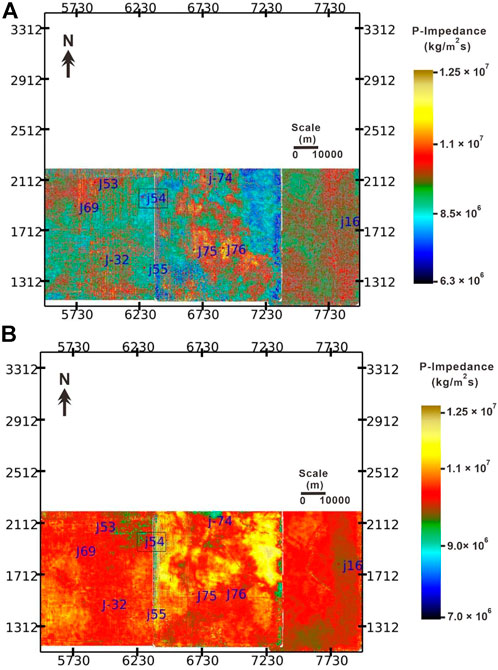
FIGURE 8. Impedance maps of (A) T9c horizon and (B) T9d horizon. The highlighted well J54 is utilized in the study to assess the vertical distribution of lithofacies.
5.2 Reservoir sand-ratio distribution
We exported the lithofacies and depth columns of well-logging data of the ZOI. It was determined how thick each lithology was by noting the top and bottom depths of each lithology and then calculating the thickness of each lithology. After that, the thicknesses of the tight sandstone intervals were put together to get the overall thickness of the tight sand. In addition to this, the whole thickness of the targeted formation intervals was computed. The sand-ratio was determined by utilizing the ratio of sandstone-thickness and formation-thickness (Ashraf et al., 2020).
After the calculation of formation thickness and cumulative tight sandstone thickness within the ZOI, following steps were undertaken to measure the sand-ratio.
1. Initially, horizon attribute extraction was conducted between the T9c and T9d impedance map. By utilizing the horizon-to-horizon attribute map between T9c-T9d, we noted the impedance values at each well location.
2. By employing the formula of sand-ratio = sandstone thickness/formation thickness, we have the calculated the sand-ratio of each well.
3. A table was constructed using the above mentioned points for further analysis (Table 2). After plotting the results with p-impedances along the x-axis and sand-ratio along the y-axis, a linear connection (trend-line) and an equation was obtained (Figure 9). Since the tight sandstone showed highest impedance as compare to mudstone and coal facies, therefore a positive slope was obtained due to the unconventional characteristics of tight sandstone in the Hangjinqi area. The trendline with a positive slope also suggest that the sand-ratio is increasing with increasing p-impedance value. Cross plot of AI and sand-ratio with a correlation coefficient showed an excellent R2 = 0.91 value.
4. The acquired equation was entered into the FunctionMod Jason program, where it was utilized to generate the framework (statistics) by using the inverted AI model. The final result, which was also produced, was then presented on the map for the results (Figure 10).
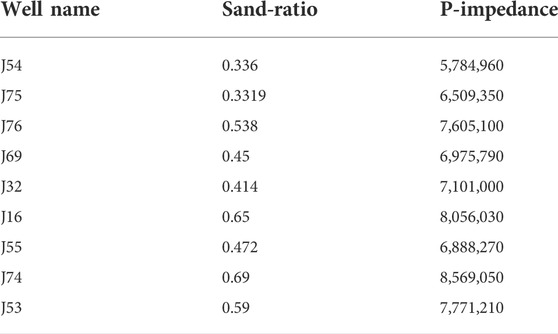
TABLE 2. Statistics for T9c-T9d sand-ratio and p-Impedance of nine studied wells.
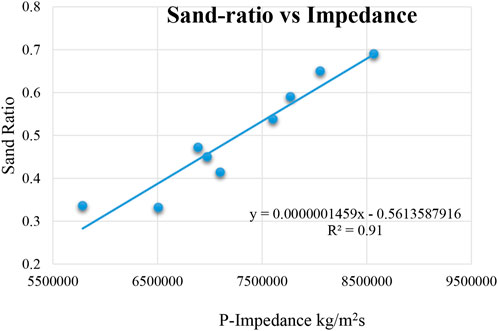
FIGURE 9. Cross-plot between the AI and sand-ratio with a good correlation coefficient value. The relationship shows a linear relationship with a positive slope. The nine points shows the AI and sand-ratio values of nine studied wells that lie within the targeted T9c-T9d horizons.
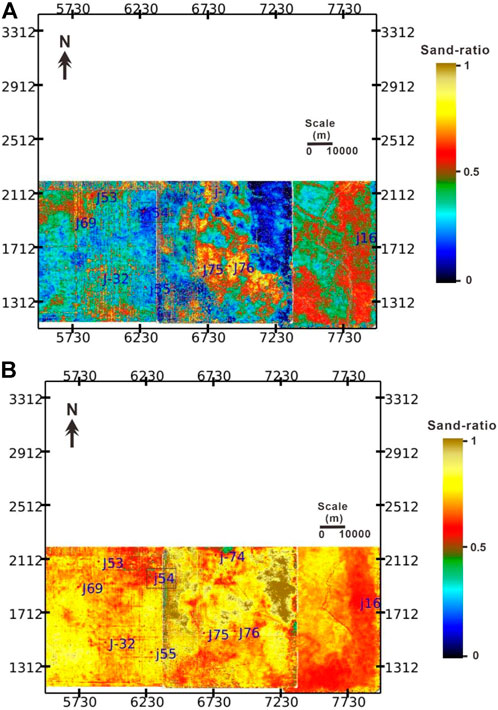
FIGURE 10. Sand-ratio maps of (A) T9c horizon & (B) T9d horizon. The highlighted well J54 is utilized in the study to assess the vertical distribution of lithofacies.
The sand-ratio map of T9c and T9d (Taiyuan and Shanxi Formations) was generated to measure the facies distribution of the targeted area. The sand-ratio thickness map supports the results of the impedance maps. The results show that T9d is the reservoir horizon that has the maximum distribution of tight sandstone as compared to T9c. The sand-ratio distribution is less than 25% in the majority of the area on T9c map due to the presence of excessive mudstone and coal facies (Figure 10A), whereas it is more than 80% in majority of the area on the T9d map due to mainly tight sandstone facies (Figure 10B). The T9d map gives the indication of thick braided channels and braided bars where the tight sand facies were deposited, and mudstone facies were deposited in the inter-distributary channels. On the other hand, the T9c map displays multi-characteristics of sedimentary facies distribution where coal facies were deposited in the swamp region. The tight sand and mud facies were deposited in the deltaic and inter-distributary channels. Corollary, our research indicates that the T9d horizon that lies at the interface of Shanxi and Shihezi-1 Formations has the best potential for exploring gas reservoirs due to the presence of maximum sand-ratio distribution.
Conclusion
We have utilized regional 3D seismic and nine well logs by employing the advanced CSSI to evaluate the spatial distribution of lithofacies within the T9c and T9d horizons that covers the Shanxi and Taiyuan Formations of the Hangjinqi area.
The conclusions of the study are as follows;
1. The formation evaluation of well J54 shows the vertical distribution of lithofacies. The coal facies are composed of thin and thick layers towards the bottom of the zone of interest. Mudstone facies are distributed mainly in Taiyuan Formation, whereas the tight sandstone facies are present in the middle and top regions. The thick zone of coal is present at 2,957–2,978 m, whereas the four tight sandstone porous zones lie between 2,905–2,950 m.
2. The CSSI provided the reliable horizontal and spatial distribution of various lithofacies through broadband and bandlimited inverted models. Results of CSSI also supported the results of well logging which showed that the coal facies were accumulated at the bottom and displayed low-impedance values that range between 4.5 × 10⁶–6.5 × 10⁶ kg/m2s, mudstone facies had moderate AI values of about 6.0 × 10⁶–1.5 × 10⁷ kg/m2s, and reservoir tight sandstone facies lie between 8.5 × 10⁶ kg/m2s to 1.20 × 10⁷ kg/m2s at J54 well location.
3. The sand-ratio and AI relationship yielded a strong association of R2 = 0.91. The sand-ratio of T9c lies between 0 and 0.5 and 0.65-0.95 for the T9d horizon map. The T9d horizon suggested the presence of thick fluvial braided channels and braided bars where tight sandstone is accumulated. The mudstone facies are present in the inter-distributary channels in the Hangjinqi. The coal facies are mostly present in the T9c map that suggest the swamp settings. Overall, the T9d has good quality reservoir characteristics and should be targeted for future gas explorations.
Data availability statement
The data analyzed in this study is subject to the following licenses/restrictions: The data is confidential. Requests to access these datasets should be directed to dW1hcmFzaDIwMTBAaG90bWFpbC5jb20=.
Author contributions
AA, WS, and UA conceived this study. WS supervised this project. RW undertook the responsibility of arranging the data for this project. AA and UA wrote the manuscript. AR, HT, GA, JU, II, and NA helped in validation and software. XZ discussed the data. ST and HZ reviewed the manuscript and provided the necessary funding. All authors have read and agreed to the published version of the manuscript.
Funding
This research was supported by the National Natural Science Foundation of China (Grant Nos 4162134 and 41820104008), the National Key R and D program of China (2017YFE0106300), the 13th Five year Plan of the Ministry of Science and Technology of China (2016ZX05034-002003), the Fundamental Research Funds for the Central Universities, China University of Geosciences (Wuhan) (CUGCJ1712), and the Open Fund of the Key Laboratory of Tectonics and Petroleum Resources (China University of Geosciences in Wuhan) (TPR-2018-18), and Yunnan Provincial Government Leading Scientist Program, No. 2015HA024.
Acknowledgments
AA is grateful to my former supervisor Prof. Shi Wanzhong for providing the necessary data, guidance, support, software, and technical help to accomplish this research. I am also thankful for my labmates at the China University of Geosciences. I also acknowledge the China University of Geosciences, Wuhan, and Yunnan University for funding this project.
Conflict of interest
The authors declare that the research was conducted in the absence of any commercial or financial relationships that could be construed as a potential conflict of interest.
The reviewer YY declared a shared affiliation with the author II to the handling editor at the time of review.
The reviewer FR declared a shared affiliation with the author GR to the handling editor at the time of review.
Publisher’s note
All claims expressed in this article are solely those of the authors and do not necessarily represent those of their affiliated organizations, or those of the publisher, the editors and the reviewers. Any product that may be evaluated in this article, or claim that may be made by its manufacturer, is not guaranteed or endorsed by the publisher.
References
Abbas, A., Zhu, H., Anees, A., Ashraf, U., and Akhtar, N. (2019). Integrated seismic interpretation, 2D modeling along with petrophysical and seismic attribute analysis to decipher the hydrocarbon potential of Missakeswal area. Pak. J. Geol. Geophys 7, 1–12. doi:10.4172/2381-8719.1000455
Abdulaziz, A. M., Mahdi, H. A., and Sayyouh, M. H. (2019). Prediction of reservoir quality using well logs and seismic attributes analysis with an artificial neural network: A case study from farrud reservoir, Al-ghani field, Libya. J. Appl. Geophys. 161, 239–254. doi:10.1016/j.jappgeo.2018.09.013
Anees, A., Shi, W., Ashraf, U., and Xu, Q. (2019). Channel identification using 3D seismic attributes and well logging in lower Shihezi Formation of Hangjinqi area, northern Ordos Basin, China. J. Appl. Geophys. 163, 139–150. doi:10.1016/j.jappgeo.2019.02.015
Anees, A., Zhang, H., Ashraf, U., Wang, R., Liu, K., Abbas, A., et al. (2022a). Sedimentary facies controls for reservoir quality prediction of lower shihezi member-1 of the Hangjinqi area, Ordos Basin. Minerals 12, 126. doi:10.3390/min12020126
Anees, A., Zhang, H., Ashraf, U., Wang, R., Liu, K., Mangi, H., et al. (2022b). Identification of favorable zones of gas accumulation via fault distribution and sedimentary facies: Insights from Hangjinqi area, northern Ordos Basin. Front. Earth Sci. (Lausanne). 9, 822670. doi:10.3389/feart.2021.822670
Anees, A., Zhong, S. W., Ashraf, U., and Abbas, A. (2017). Development of a computer program for zoeppritz energy partition equations and their various approximations to affirm presence of hydrocarbon in missakeswal area. Geosciences 7, 55–67. doi:10.5923/j.geo.20170702.02
Ashraf, U., Zhang, H., Anees, A., Ali, M., Zhang, X., Shakeel Abbasi, S., et al. (2020). Controls on reservoir heterogeneity of a shallow-marine reservoir in Sawan Gas Field, SE Pakistan: Implications for reservoir quality prediction using acoustic impedance inversion. Water 12, 2972. doi:10.3390/w12112972
Ashraf, U., Zhang, H., Anees, A., Mangi, H. N., Ali, M., Zhang, X., et al. (2021). A core logging, machine learning and geostatistical modeling interactive approach for subsurface imaging of lenticular geobodies in a clastic depositional system, SE Pakistan. Nat. Resour. Res. 30, 2807–2830. doi:10.1007/s11053-021-09849-x
Ashraf, U., Zhu, P., Anees, A., Abbas, A., and Talib, A. (2016). Analysis of Balkassar area using velocity modeling and interpolation to affirm seismic interpretation, Upper Indus Basin. Geosciences 6, 78–91. doi:10.5923/j.geo.20160603.02
Ashraf, U., Zhu, P., Yasin, Q., Anees, A., Imraz, M., Mangi, H. N., et al. (2019). Classification of reservoir facies using well log and 3D seismic attributes for prospect evaluation and field development: A case study of sawan gas field, Pakistan. J. Petroleum Sci. Eng. 175, 338–351. doi:10.1016/j.petrol.2018.12.060
Avadhani, V., Anandan, M., Thattacherry, B., Murthy, K., Gariya, B., and Dwivedi, A. (2006). Acoustic impedance as a lithological and hydrocarbon indicator—A case study from cauvery basin. Lead. Edge 25, 854–858. doi:10.1190/1.2221363
Cooke, D. A., and Schneider, W. A. (1983). Generalized linear inversion of reflection seismic data. Geophysics 48, 665–676. doi:10.1190/1.1441497
Cooke, D., and Cant, J. (2010). Model-based seismic inversion: Comparing deterministic and probabilistic approaches. CSEG Rec. 35, 29–39.
Dai, J., Ni, Y., and Wu, X. (2012). Tight gas in China and its significance in exploration and exploitation. Petroleum Explor. Dev. 39, 277–284. doi:10.1016/s1876-3804(12)60043-3
Dar, Q. U., Pu, R., Baiyegunhi, C., Shabeer, G., Ali, R. I., Ashraf, U., et al. (2022). The impact of diagenesis on the reservoir quality of the early Cretaceous Lower Goru sandstones in the Lower Indus Basin, Pakistan. J. Pet. Explor. Prod. Technol. 12, 1437–1452. doi:10.1007/s13202-021-01415-8
Duan, Y., Wang, C., Zheng, C., Wu, B., and Zheng, G. (2008). Geochemical study of crude oils from the Xifeng oilfield of the Ordos basin, China. J. Asian Earth Sci. 31, 341–356. doi:10.1016/j.jseaes.2007.05.003
Ehsan, M., Gu, H., Ahmad, Z., Akhtar, M. M., and Abbasi, S. S. (2019). A modified approach for volumetric evaluation of shaly sand formations from conventional well logs: A case study from the talhar shale, Pakistan. Arab. J. Sci. Eng. 44, 417–428. doi:10.1007/s13369-018-3476-8
Ehsan, M., Gu, H., Akhtar, M. M., Abbasi, S. S., and Ullah, Z. (2018). Identification of hydrocarbon potential of Talhar shale: Member of lower Goru Formation using well logs derived parameters, southern lower Indus basin, Pakistan. J. Earth Sci. 29, 587–593. doi:10.1007/s12583-016-0910-2
Ehsan, M., and Gu, H. (2020). An integrated approach for the identification of lithofacies and clay mineralogy through Neuro-Fuzzy, cross plot, and statistical analyses, from well log data. J. Earth Syst. Sci. 129, 101–113. doi:10.1007/s12040-020-1365-5
Ferguson, R. J., and Margrave, G. F. (1996). A simple algorithm for band-limited impedance inversion. CREWES Res. Rep. 8, 1–10.
Gaoyuan, Y., Junjian, Z., Guanwen, L., and Fangkai, Q. (2021). Fractal characteristics of shale pores from Taiyuan Formation to Shanxi Formation in qinshui basin. Xinjiang Pet. Geol. 42, 548. doi:10.7657/XJPG20210505
Gardner, G., Gardner, L., and Gregory, A. (1974). Formation velocity and density—the diagnostic basics for stratigraphic traps. Geophysics 39, 770–780. doi:10.1190/1.1440465
Ibrahim, M. (2007). “Seismic inversion data, a tool for reservoir characterization/modeling, sawan gas field—a case study,” in Proceedings of the Annual Technical Conference, Islamabad, Pakistan, 27-28 March 2007.
Jiang, R., Zhao, L., Xu, A., Ashraf, U., Yin, J., Song, H., et al. (2022). Sweet spots prediction through fracture Genesis using multi-scale geological and geophysical data in the karst reservoirs of Cambrian Longwangmiao Carbonate Formation, Moxi-Gaoshiti area in Sichuan Basin, South China. J. Pet. Explor. Prod. Technol. 12, 1313–1328. doi:10.1007/s13202-021-01390-0
Ju, W., Shen, J., Qin, Y., Meng, S., Wu, C., Shen, Y., et al. (2017). In-situ stress state in the linxing region, eastern Ordos Basin, China: Implications for unconventional gas exploration and production. Mar. Petroleum Geol. 86, 66–78. doi:10.1016/j.marpetgeo.2017.05.026
Kassem, A. A., Hussein, W. S., Radwan, A. E., Anani, N., Abioui, M., Jain, S., et al. (2021). Petrographic and diagenetic study of siliciclastic Jurassic sediments from the Northeastern Margin of Africa: Implication for reservoir quality. J. Petroleum Sci. Eng. 200, 108340. doi:10.1016/j.petrol.2020.108340
Latimer, R. B., Davidson, R., and Van Riel, P. (2000). An interpreter's guide to understanding and working with seismic-derived acoustic impedance data. Lead. edge 19, 242–256. doi:10.1190/1.1438580
Li, P., Zhang, J., Tang, X., Huo, Z., Li, Z., Luo, K., et al. (2021). Assessment of shale gas potential of the lower Permian transitional Shanxi-Taiyuan shales in the southern North China Basin. Aust. J. Earth Sci. 68, 262–284. doi:10.1080/08120099.2020.1762737
Liu, B., Chang, S., Zhang, S., Chen, Q., Zhang, J., Li, Y., et al. (2022). Coalbed methane gas content and its geological controls: Research based on seismic-geological integrated method. J. Nat. Gas Sci. Eng. 101, 104510. doi:10.1016/j.jngse.2022.104510
Liu, K., Wang, R., Shi, W., Zhang, W., Qi, R., Qin, S., et al. (2020). Tectonic controls on Permian tight gas accumulation: Constrains from fluid inclusion and paleo-structure reconstruction in the Hangjinqi area, northern Ordos Basin, China. J. Nat. Gas Sci. Eng. 83, 103616. doi:10.1016/j.jngse.2020.103616
Mangi, H. N., Chi, R., Detian, Y., Sindhu, L., He, D., Ashraf, U., et al. (2022). The ungrind and grinded effects on the pore geometry and adsorption mechanism of the coal particles. J. Nat. Gas Sci. Eng. 100, 104463. doi:10.1016/j.jngse.2022.104463
Mangi, H. N., Detian, Y., Hameed, N., Ashraf, U., and Rajper, R. H. (2020). Pore structure characteristics and fractal dimension analysis of low rank coal in the Lower Indus Basin, SE Pakistan. J. Nat. Gas Sci. Eng. 77, 103231. doi:10.1016/j.jngse.2020.103231
Pan, H., Yin, X., Li, K., and Pei, S. (2022). An improved matching pursuit method for coal seam identification driven by seismic inversion. Chin. J. Geophys. 65, 2276–2293. doi:10.6038/cjg2022P0211
Pendrel, J. (2006). Seismic inversion-a critical tool in reservoir characterization. Scand. oil-gas Mag. 34.
Qiang, Z., Yasin, Q., Golsanami, N., and Du, Q. (2020). Prediction of reservoir quality from log-core and seismic inversion analysis with an artificial neural network: A case study from the sawan gas field, Pakistan. Energies 13, 486. doi:10.3390/en13020486
Radwan, A. E. (2020). Hydrocarbon type estimation using the synthetic logs: A case study in baba member. Gulf of Suez, Egypt: AAPG/datapages search and discovery. Article 20475.
Radwan, A. E. (2021). Modeling the depositional environment of the sandstone reservoir in the middle miocene sidri member, badri field, gulf of Suez basin, Egypt: Integration of gamma-ray log patterns and petrographic characteristics of lithology. Nat. Resour. Res. 30, 431–449. doi:10.1007/s11053-020-09757-6
Radwan, A. E., Trippetta, F., Kassem, A. A., and Kania, M. (2021). Multi-scale characterization of unconventional tight carbonate reservoir: Insights from October oil filed, Gulf of Suez rift basin, Egypt. J. Petroleum Sci. Eng. 197, 107968. doi:10.1016/j.petrol.2020.107968
Riedel, M., Lee, W., and Bellefleur, G. (2010). 7. Inversion of Seismic Data for Elastic Parameters: A Tool for Gas-Hydrate Characterization. Geophys. Dev. Ser., 109–120. doi:10.1190/1.9781560802197.ch7
Saussus, D., and Sams, M. (2012). Facies as the key to using seismic inversion for modelling reservoir properties. First Break 30, 45–52. doi:10.3997/1365-2397.2012009
Simm, R., Bacon, M., and Bacon, M. (2014). Seismic amplitude: An interpreter's handbook. United Kingdom: Cambridge University Press.
Ullah, J., Luo, M., Ashraf, U., Pan, H., Anees, A., Li, D., et al. (2022). Evaluation of the geothermal parameters to decipher the thermal structure of the upper crust of the Longmenshan fault zone derived from borehole data. Geothermics 98, 102268. doi:10.1016/j.geothermics.2021.102268
Veeken, P., and Da Silva, M. (2004). Seismic inversion methods and some of their constraints. First break 22. doi:10.3997/1365-2397.2004011
Vo Thanh, H., and Lee, K.-K. (2022). 3D geo-cellular modeling for oligocene reservoirs: A marginal field in offshore vietnam. J. Pet. Explor. Prod. Technol. 12, 1–19. doi:10.1007/s13202-021-01300-4
Vo Thanh, H., Sugai, Y., and Sasaki, K. (2020). Impact of a new geological modelling method on the enhancement of the CO2 storage assessment of E sequence of Nam Vang field, offshore Vietnam. Energy Sources, Part A Recovery, Util. Environ. Eff. 42, 1499–1512. doi:10.1080/15567036.2019.1604865
Wang, H., Zhang, L., Zhao, Q., Qiu, Z., Liu, D., Zhang, Q., et al. (2021). Reservoir characteristics of the lower permian marine-continental transitional shales: Example from the Shanxi Formation and Taiyuan Formation in the Ordos Basin. Geofluids, 1–17. doi:10.1155/2021/9373948
Wang, J., and Guo, S. (2019). The whole-aperture pore-structure characteristics of marine-continental transitional shale facies of the Taiyuan and Shanxi Formations in the Qinshui Basin, North China. Interpretation 7, T547–T563. doi:10.1190/int-2018-0157.1
Wang, Q., and Guo, K. (2008). Constrained sparse spike inversion applied in the reservoir prediction. Well Logging Technol. 32, 35–37. doi:10.16489/j.issn.1004-1338.2008.01.02
Wood, D. A., and Cai, J. (2022). “Coal-bed methane reservoir characterization using well-log data,” in Sustainable geoscience for natural gas subsurface systems (Oxford, United Kingdom: Elsevier), 243–274.
Wu, X., Ni, C., Liu, Q., Liu, G., Zhu, J., and Chen, Y. (2017). Genetic types and source of the upper paleozoic tight gas in the Hangjinqi area, northern Ordos Basin, China. Geofluids 2017, 1–14. doi:10.1155/2017/4596273
Xu, H., Tang, D., Tang, S., Zhang, W., Meng, Y., Gao, L., et al. (2015). Geologic and hydrological controls on coal reservoir water production in marine coal-bearing strata: A case study of the carboniferous Taiyuan Formation in the liulin area, eastern Ordos Basin, China. Mar. Petroleum Geol. 59, 517–526. doi:10.1016/j.marpetgeo.2014.10.005
Xu, Q., Shi, W., Xie, X., Busbey, A. B., Xu, L., Wu, R., et al. (2018). Inversion and propagation of the late paleozoic Porjianghaizi Fault (north Ordos Basin, China): Controls on sedimentation and gas accumulations. Mar. Petroleum Geol. 91, 706–722. doi:10.1016/j.marpetgeo.2018.02.003
Xue, H., Wang, Y., Mao, X., Xu, P., Nie, H., Yin, Y., et al. (2009). The timing of gas pooling in the upper paleozoic in the northern Ordos Basin: A case study of the Hangjinqi Block. Nat. Gas. Ind. 29, 9–12. doi:10.3787/j.issn.1000-0976.2009.12.003
Yang, M., Li, L., Zhou, J., Jia, H., Sun, X., Qu, X., et al. (2015). Mesozoic structural evolution of the Hangjinqi area in the northern Ordos Basin, north China. Mar. Petroleum Geol. 66, 695–710. doi:10.1016/j.marpetgeo.2015.07.014
Yang, Y., Li, W., and Ma, L. (2005). Tectonic and stratigraphic controls of hydrocarbon systems in the Ordos Basin: A multicycle cratonic basin in central China. Am. Assoc. Pet. Geol. Bull. 89, 255–269. doi:10.1306/10070404027
Zhang, L., Bai, G., Luo, X., Ma, X., Chen, M., Wu, M., et al. (2009). Diagenetic history of tight sandstones and gas entrapment in the Yulin Gas Field in the central area of the Ordos Basin, China. Mar. Petroleum Geol. 26, 974–989. doi:10.1016/j.marpetgeo.2008.05.003
Zhang, X., Fu, J., Hou, F., Zheng, X., Zhang, Y., Wang, R., et al. (2022). Sand-mudstone modeling of fluvial fan sedimentary facies: A case study of Shanxi Formation reservoir in Ordos Basin. J. Pet. Explor. Prod. Technol., 1–14. doi:10.1007/s13202-022-01496-z
Keywords: acoustic impedance inversion, sand-ratio, shanxi and taiyuan formations, tight sandstone, reservoir characterization, Hangjinqi area
Citation: Anees A, Zhang H, Ashraf U, Wang R, Thanh HV, Radwan AE, Ullah J, Abbasi GR, Iqbal I, Ali N, Zhang X, Tan S and Shi W (2022) Sand-ratio distribution in an unconventional tight sandstone reservoir of Hangjinqi area, Ordos Basin: Acoustic impedance inversion-based reservoir quality prediction. Front. Earth Sci. 10:1018105. doi: 10.3389/feart.2022.1018105
Received: 15 August 2022; Accepted: 06 September 2022;
Published: 23 September 2022.
Edited by:
Ahmed M. Eldosouky, Suez University, EgyptReviewed by:
Sadegh Karimpouli, University of Zanjan, IranYang Yang, Guilin University of Technology, China
Faisal Ur Rahman Awan, Edith Cowan University, Australia
Copyright © 2022 Anees, Zhang, Ashraf, Wang, Thanh, Radwan, Ullah, Abbasi, Iqbal, Ali, Zhang, Tan and Shi. This is an open-access article distributed under the terms of the Creative Commons Attribution License (CC BY). The use, distribution or reproduction in other forums is permitted, provided the original author(s) and the copyright owner(s) are credited and that the original publication in this journal is cited, in accordance with accepted academic practice. No use, distribution or reproduction is permitted which does not comply with these terms.
*Correspondence: Wanzhong Shi, c2hpd3pAY3VnLmVkdS5jbg==; Shucheng Tan, c2hjaHRhbkB5bnUuZWR1LmNu
†These authors have contributed equally to this work and share first authorship