 Chengyu Liu
 Fangbin Liu
 Yin Cai1
 Ran Ni
 Weiduo Hao
- 1Shandong Earthquake Agency, Ji’nan, China
- 2Key Laboratory of Western China’s Environmental Systems, Ministry of Education, College of Earth and Environmental Sciences, Lanzhou University, Lanzhou, China
- 3Qilu Normal College, Ji’nan, China
- 4Department of Earth and Atmospheric Sciences, University of Alberta, Edmonton, AB, Canada
- 5Shandong Provincial Key Laboratory of Marine Environmental and Geology Engineering, Ocean University of China, Qingdao, China
The present-day stress field in the northwest Pacific Wadati-Benioff Zone (WBZ) has been investigated on the basis of earthquake focal mechanism catalog covering the period from 2012 to 2021. Our catalog contains 201 focal mechanism solutions (Mw 4.0–5.9) compiled from the F-net network along three profiles (southern Kurile trench, central Japan trench and northern Izu-Bonin trench). According to the spatial variations in the stress regimes, we outlined 12 subvolumes for three profiles. Our results present that the maximum compressive stress is, slab-normal in trench-outer rise regions and nearly strike-normal and sub-horizontal in the depth range 0–70 km. At intermediate depths, a two-planar stress pattern is observed (70–200 km) in southern Kurile and central Japan trench WBZ, with the maximum compressive stress closely parallel to the slab in upper plane and slab-normal in lower plane, respectively. However, the southern Kurile trench WBZ exposes an extension stress regime in 200–300 km depth range. At depths below 300 km, northern Izu-Bonin trench WBZ shows a stress regime of pure compression. We infer the dominant forces may be the slab blending in the shallow trench-outer rise regions, slab pull and ridge push at shallow depths, and the slab resistance provided by the mantle to the penetration of the slab at deep depths. Whereas the two-planar stress pattern may be caused by the unbending of the slab, and the unusual stress state along the junction of the trench WBZ at intermediate depths may be influenced by lateral deformation due to increasing slab’s dip.
Introduction
Subduction zones are home to the most seismically active faults on Earth (Hayes et al., 2018). The Northwest Pacific subduction zone, located at the eastern edge of the Eurasian continent, is one of the most typical subduction zones in the world (Figure 1A) Schellart et al., 2007; Sandiford et al., 2020). At the Northwest Pacific margin, the Pacific plate is subducting west-northwestward the North American plate from the Kuril and Japan trenches at a rate of ∼8.2–9.2 cm/yr, and meanwhile subducting beneath the Philippine Sea plate at ∼5.5 cm/yr (Figure 1A) (Seno et al., 1993; DeMets et al., 1994; Schellart et al., 2007; Wei et al., 2015; Gong et al., 2021). As a product of the mutual subduction collision between different plates, numerous earthquakes (Figure 1B) occurred on the subducting Pacific slab and formed a clear Wadati-Benioff Zone (WBZ) that extends down to the mantle transition zone. Besides, the Northwest Pacific subduction zone has a typical “trench-arc-basin” system with magmatic activities and regional metamorphism (Forsyth and Uyedaf, 1975; Schellart et al., 2007; Liu et al., 2017; Yang et al., 2018; Liu et al., 2022). Such complex and intense tectonics has characterized this region with a complicated stress state.
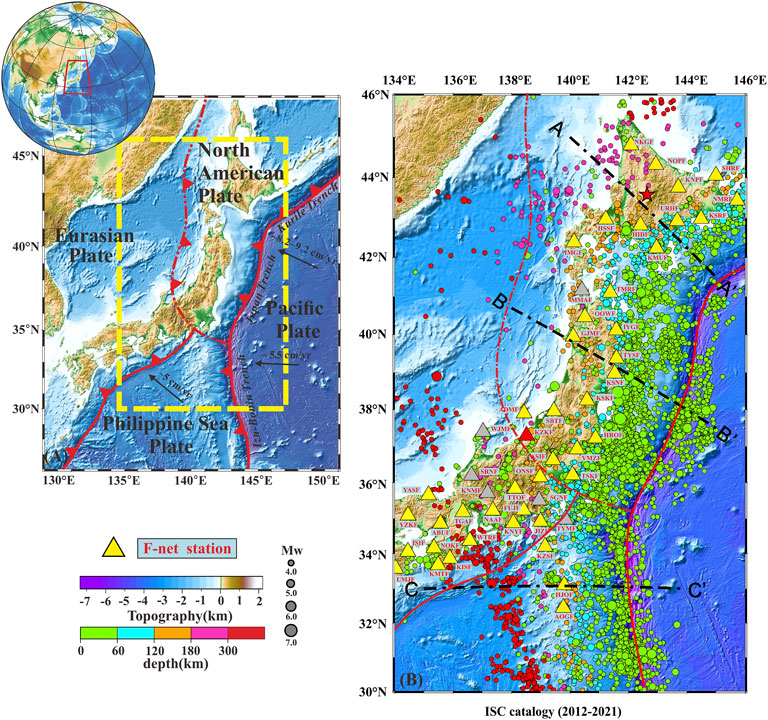
FIGURE 1. (A) Topography of the Northwestern Pacific Ocean; The black arrows show an estimate of the motion (cm/year) of the Pacific Plate relative to the North American Plate and Philippine Sea Plate. The red solid (dash) line and represents the boundary (presumed boundary) of the plates, with red triangles on it indicating the direction of movement of the plates. The names of the three trenches are described in orange italic letters. (B) The seismicity with the Mw ≥4.0 of the study area (2012–2021). The seismicity from the ISC catalogue is denoted by the dots. The depth and magnitude of earthquakes are shown by the color bar and sizes of the dots, respectively. The location of the study area is denoted by the yellow box in (A). The black solid lines illustrate the trench-normal profiles (LINE A-A’, B-B’, and C-C’). The triangles represent the stations of F-NET. The yellow ones represent the stations used for moment tensor inversion in this paper, while the other stations of F-NET are in grey. The red star in the northeast of the figure represents the location of a reverse faulting event as an example of earthquake waveform fitting using the Mttime technology.
Knowledge of the crustal stress field is a prerequisite for understanding the kinematics and distribution of continental deformation (Konstantinou et al., 2017; Liu et al., 2021). Focal mechanism solutions (FMS) of earthquakes and their spatial distributions play a key role in evaluating tectonic/local stress fields (Townend and Zoback, 2006; Terakawa and Matsu’ura, 2010; Saito et al., 2018; Song et al., 2022). Many scholars have carried out a series of stress field analyses in the Pacific WBZ based on the spatial variation of the stress regimes. The stress models have been proposed in previous studies such as 1) the stress state within the subducting plate varies with the geotectonic position and thrust depth (e.g., Yoshida et al., 2015; Maeda et al., 2020; Gong et al., 2021); 2) the stress pattern in Kurile trench WBZ and Japan trench WBZ with the down-dip compression in the upper plane and down-dip tension in the lower plane at intermediate-depth (e.g., Hasegawa et al., 1979; Kita et al., 2010; Reynard et al., 2010; Florez and Prieto, 2019) and 3) the non-parallel directional stress states to slab subduction in some shallow and deep depth (e.g., Christova, 2015; Li and Chen, et al., 2019). These efforts enriched our recognition of the shape and dynamics processes of subducting plate. The present-day stress field, however, remains highly controversial along the Northwest Pacific WBZ (especially double seismic zone), which may be attributable to the different time periods of data collection, the various FMS datasets, and different evaluation methods used. In addition, it remains enigmatic whether the stress field characteristics are consistent between different trenches (e.g., Kuril, Japan, and Izu-Bonin) within the Northwest Pacific subduction system.
To address the above questions, we accurately inverted the Centroid Moment Tensor of moderate earthquakes (Mw 4.0–5.9) and established a new high-quality dataset of FMS to investigate the stress field along the Northwest Pacific WBZ. Combined with previous geological and geophysical analysis, we aim to provide a more robust comparative analysis of the stress field at the different depths of trench WBZ and tectonic position. Our findings provide new insight into stress states and intrinsic dynamical mechanisms along the WBZ in southern Kuril, central Japan, and northern Izu-Bonin trenches.
Data and method
Dataset
For this study, we used seismic waveform data that have been recorded by the regional broadband stations of F-net (Okada et al., 2004; Kimura et al., 2015; NIED, 2019) in the time span between 2012 and 2021 (Figure 1A). A total of 201 earthquakes with 4.0 ≤ Mw < 6.0 were collected along the southern Kurile arc, the central Japan arc, and the northern Izu-Bonin arc (Figure 3A; Table 1). Accordingly, we eliminated all the earthquakes above Mw 6.0, since large earthquakes can have important effects on the short-term stress field and cause stress field deviation (Huang et al., 2011; Yoshida et al., 2012; Yoshida et al., 2016a, 2016b; Hardebeck and Okada, 2018; Sheng and Meng, 2020). Meanwhile, indicated by the distribution of the epicenters from ISC earthquake catalogue (http://ds.iris.edu), seismic profiles with widths of 60–100 km were firstly selected with Mw greater than 4.0 for a period between 1 January2017 and 31 December 2021. Due to the lack of seismic events at depth range 70–180 km in profile A-A’ and profile B-B’, we then expanded the geographic width of the profile and extended the time interval (Table 1). In addition, the principles of seismic profile selection are to cover as many intermediate to deep source earthquakes as possible, and we excluded seismic events that were clearly far from the subduction zone based on their epicenter distribution. Afterwards, we inverted the FMS via these data and the following method.
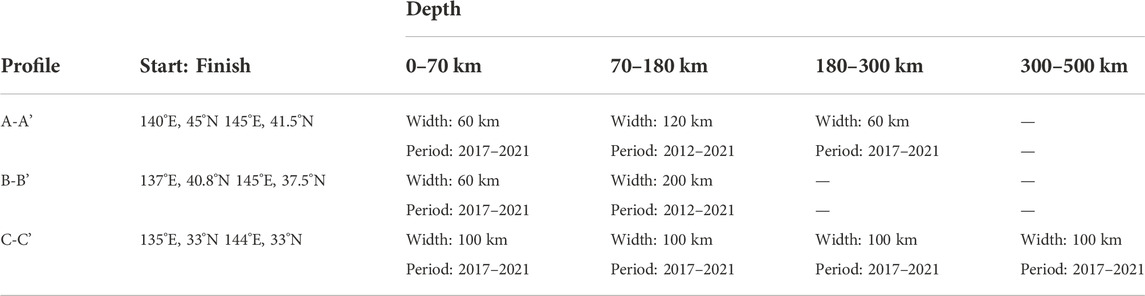
TABLE 1. The information of each profile.
Focal mechanism calculation
We utilize the Mttime software to determine FMS of selected earthquakes (Chiang, 2019). Mttime is a procedure developed for time domain inversion of full seismic waveform data to obtain the Centroid Moment Tensor. This technique employs a time-domain, generalized least squares inversion method (Minson and Dreger, 2008), and the details of the procedure are described in previous work (e.g., Dreger,2003; Chiang et al., 2016). The waveforms were firstly instrument corrected to ground displacement, rotated to the great-circle path, decimated to one sample per second and filtered between 0.05 and 0.2 Hz. Then, after constructing the velocity model, synthetic seismograms were generated using the frequency-wavenumber integration method through the “Computer Programs in Seismology” software package proposed by Herrmann (2013). The same filtering and down-sampling parameters are applied to the synthetic seismograms. Finally, the FMS were estimated according to the maximum variance reduction (VR) percentage between the observed waveforms and synthetic data. In the step of generating synthetic seismograms, we adopted a one-dimensional (1-D) velocity structure model (Table 2) derived from NIED (https://www.fnet.bosai.go.jp/faq/) and Kubo et al. (2002). We set searching step to 5–10 km firstly when conduct moment tensor inversion, and then we perform the inversion again around optimal solution of the initial inversion and set searching step to 1 km. The inversion method also allows for small time shifts between the data and synthetic seismograms to compensate for uncertainties in origin time, location, and velocity structure (Pasyanos and Chiang, 2020). The depth with the optimum fit is taken as an estimate for focal depth, and the corresponding source mechanism provides an estimate for the moment tensor. The results are demonstrated in the form of the double couple component with the scalar moment (Mo), FMS depth, strike, dip, and rake.
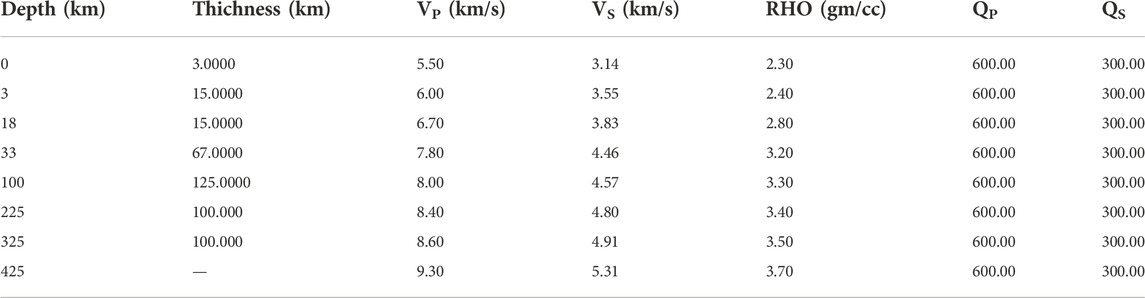
TABLE 2. Velocity structure for the used Green Function (Kubo et al., 2002).
Stress field inversion
One of the challenges in stress field determination from FMS is the ambiguous choice of a fault plane from the two nodal planes. Compared with previous stress field inversion (Gephart and Forsyth, 1984; Michael, 1984, 1987; Zoback, 1992; Delvaux and Barth, 2010), we used an updated iterative stress inversion method based on the Mohr-Coulomb failure criterion, for identifying the fault plane based on evaluating the fault instability (Michael, 1984, 1987; Vavryčuk, 2011, 2014). The iterative joint stress inversion can be run using the open STRESSINVERSE code written in Python available at http://www.ig.cas.cz/stress-inverse. Random bootstrap uncertainty assessments using 2,000 re-samplings of the original input are performed to calculate uncertainties with 95% confidence level. The stress inversion allows us to estimate the orientation of the principal stress axes and the shape ratio
Results
We obtained a total of 201 FMS in our study area, among them, the number of solutions in profiles A-A’, B-B’, and C-C’ are 42, 96, and 63 respectively (Figure 4; Table 3). The depths of all events range from 5 to 450 km (Table 3; Supplementary Table S1). In the waveform inversion, we conducted the inversion quality by the number of stations used, the percentage of double-couple (DC) and VR between the observed waveforms and synthetic data. We excluded the data that the number of stations used for inversion less than 3 and the VR< 0.5. Figure 2 shows an example of earthquake waveform fitting using the Mttime technology. This earthquake event occurred on 20 June 2021 in profile A-A’ (Figure 1B). The upper panel shows the waveforms fitting between vertical, radial and tangential components of waves. The robust and reliable results show high VR and DC% value, with the number of stations used for inversion more than 3. The lower panel shows that the FMS depth is constrained at 160 km, while the magnitude is Mw 5.45. The same procedure is used to obtain FMS for the remaining earthquakes in the three profiles. All FMS we conducted are available in Supplementary Material (Supplementary Table S1). The distribution of the FMS in this study area is projected into Figure 3.

TABLE 3. Results of the stress inversion.
FIGURE 2. A reverse faulting event in the Profile A-A’. The location of this event is indicated by a red star in Figure 1B. Top panel shows the best solution and waveform fits (the black observed and green synthetic waveforms) at selected stations. Green triangles around the beach ball indicate station azimuth, and the numbers below the radial and vertical component seismograms are, from left to right: distance, azimuth, time shift in samples, and station-specific VR. Bottom panel shows the solution, in terms of waveform fits (variance reduction; VR) and Mw, with respect to FMS depth.
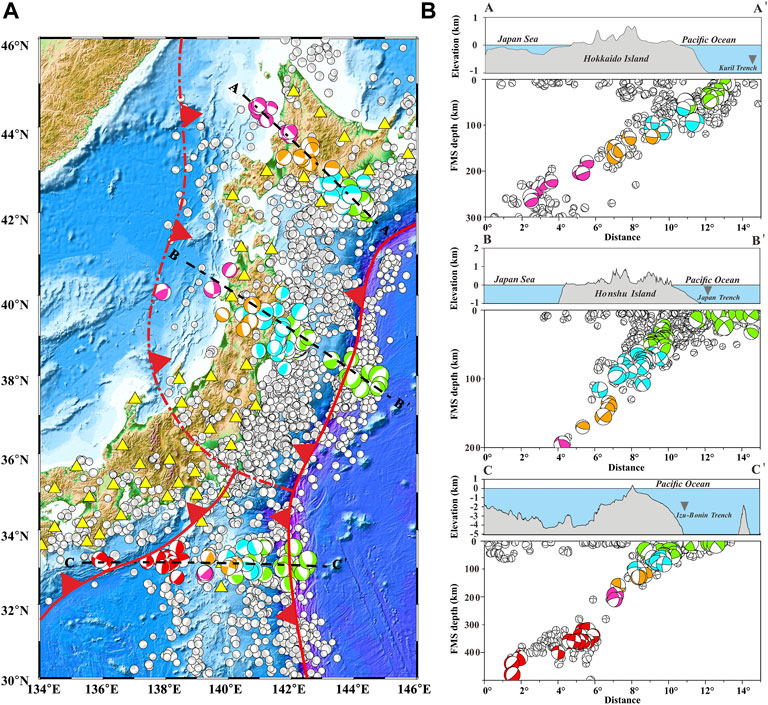
FIGURE 3. Focal mechanism solutions (FMS) in study area with the lower hemisphere projected onto the plane. The red solid (dash) line and represents the boundary (presumed boundary) of the plates, with red triangles on it indicating the direction of movement of the plates. Three tectonic segments (Profile A-A’ and B-B’ and C-C’) are plotted with black dotted lines. The boundaries of the plates are indicated by the red lines and stations are shown in yellow triangles. Beach balls with color-filled compressional quadrants were calculated in this study. The solutions with gray-filled compressional quadrants are from Japan Meteorological Agency (JMA) with time period 2012–2021. Compressional quadrants of all shallow (≤60 km) FMS are green in color. FMS with FMS depth ranges 60–120 km, 120–180 km, 180–300 km are cyan, orange, and pink in color, respectively. Compressional quadrants of all deep (300–500 km) of FMS are red in color. The Mechanisms are magnitude-wise size scaled (the colored beach balls have twice the radius of gray ones). (B) Depth-wise distribution of faulting mechanism solutions (the hemisphere behind the vertical plane is projected onto the plane) across the profiles are shown in (B). Corresponding topography, along the same profile lines are plotted above with the sea level below filled with light blue. Labeled inverted grey triangles represent the location of the trench. Topographic data is from Tozer et al. (2019). The color of the FMS compressional quadrants is the same as that in (A).
According to the spatial variations in the stress regimes, we divided them into 12 WBZ subvolumes for three profiles (Figure 4; Supplementary Table S1). The principles of classification are as follows.
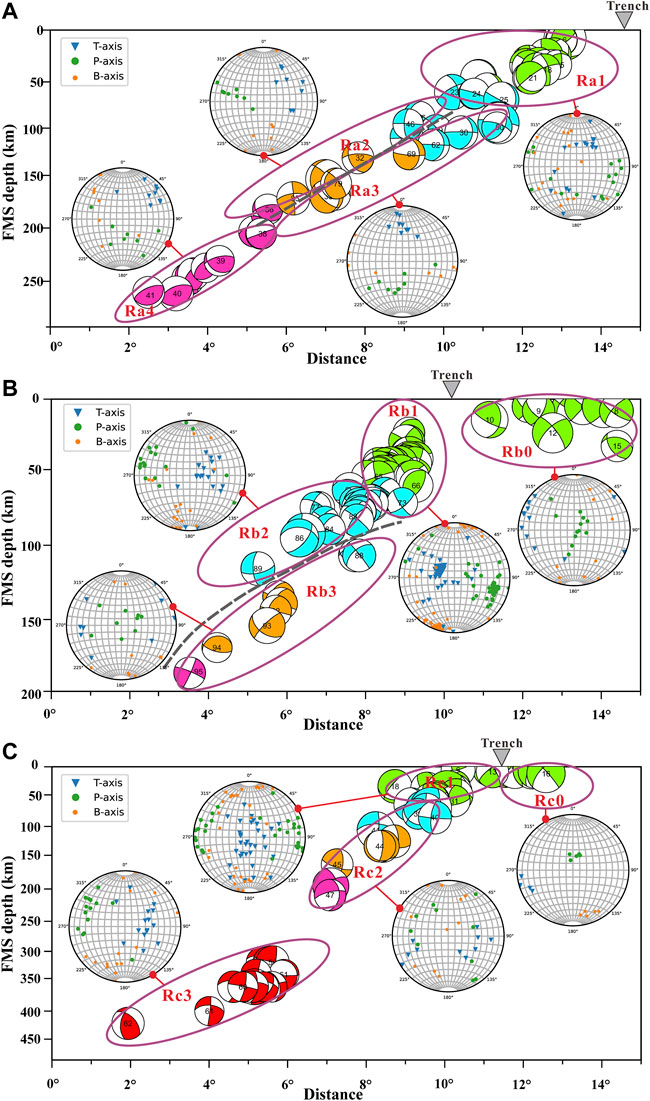
FIGURE 4. The outlining of WBZ subvolumes of homogeneous stress field, based on a detailed analysis of the orientation spatial distribution of the P and T axes in Profile A-A’ (A) and B-B’ (B) and C-C’ (C), respectively. Stereographic projection of the P (green dots) and T (blue inverted triangles) and B axes (yellow polygons) of the focal mechanisms are plotted next to the subvolumes and linked by a red solid line. Stereographic projection diagrams were produced using an open-source python package named mplstereonet (version 0.6.2). The gray dashed lines in (A,B) show the interface of WBZ upper and lower plane. The number in the center of focal mechanisms corresponds to the events number in Supplementary Table S1.
Firstly, Rb0 and Rc0 were outlined separately since they are located in the region of trench-outer rise, where a subducting oceanic plate begins to flex and descends into the trench (Lefeldt and revemeyer, 2008; Moscoso and Grevemeyer, 2015; Hatakeyama et al., 2017). Secondly, according to Gutenberg & Richter (1954), shallow, intermediate and deep earthquakes have traditionally been defined as those in the approximately 0–70 km, 70–300 km, and above 300 km. Meanwhile, indicated by the distribution of the epicenters (Figure 5), the dips of the WBZ are not the same in different depth intervals. We can clearly see that along profile A-A’ (Figure 5A), the dip of the WBZ is about 15°at shallow depths and then turns to steeper approximately 30° at intermediate depths. Figure 5B shows that the dip of the WBZ along profile B-B’ is about 30° at shallow depth, while turn to about 60°at intermediate depths. Along profile C-C’ (Figure 5C), corresponding to the shallow, intermediate and deep depths, the dips of the WBZ are characterized by a complex change from 30° to 60°–45°. Therefore, Ra1 and Rb1 and Rc1 were defined as the shallow portion of the WBZ with depths between 0 and 70 km. However, the outline of subvolumes at intermediate depths is complex, since the possible existence of a double seismic zone at intermediate depths (e.g., Brudzinski et al., 2007; Hasegawa and Nakajima, 2017; Florez and Prieto, 2019). The outlining of WBZ subvolumes here is carried out manually, based on a detailed analysis of the orientation spatial distribution of the P and T axes of the individual earthquake FMS. Then we outlined 6 subvolumes at intermediate depths namely Ra2, Ra3, Ra4, Rb2, Rb3, Rc2. Finally, Rc3 was outlined as the deep portion (300–500 km) of the WBZ. In order to further analyze the faulting types and distribution of FMS in the study area, we categorized the data using a ternary visualization (Kaverina diagram) of the relative proportion of variations in normal, thrust, and strike-slip faulting components for the respective profiles (Figure 6).
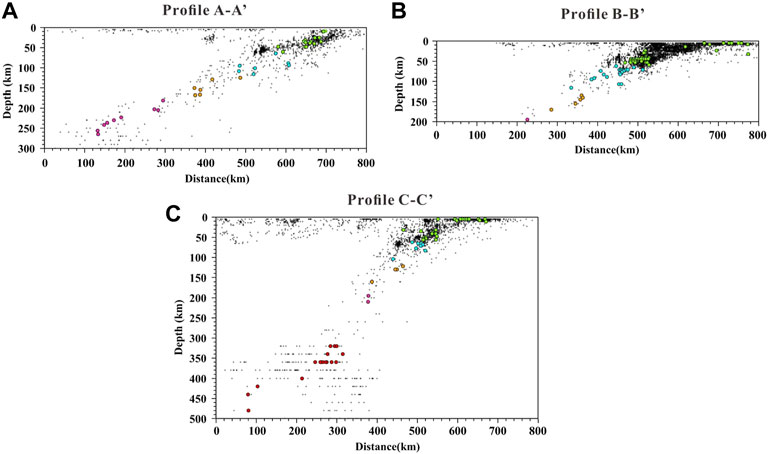
FIGURE 5. The distribution of earthquakes on Profile A-A’ (A), B-B’ (B) and C-C’(C). The seismicity from the Japan Meteorological Agency (JMA) catalogue is denoted by the small black dots for a period from 2012–2021. The larger dots represent the events that we selected for the focal mechanism calculation in this study. The color of these dots indicates the source depth which is consistent with Figure 1B.
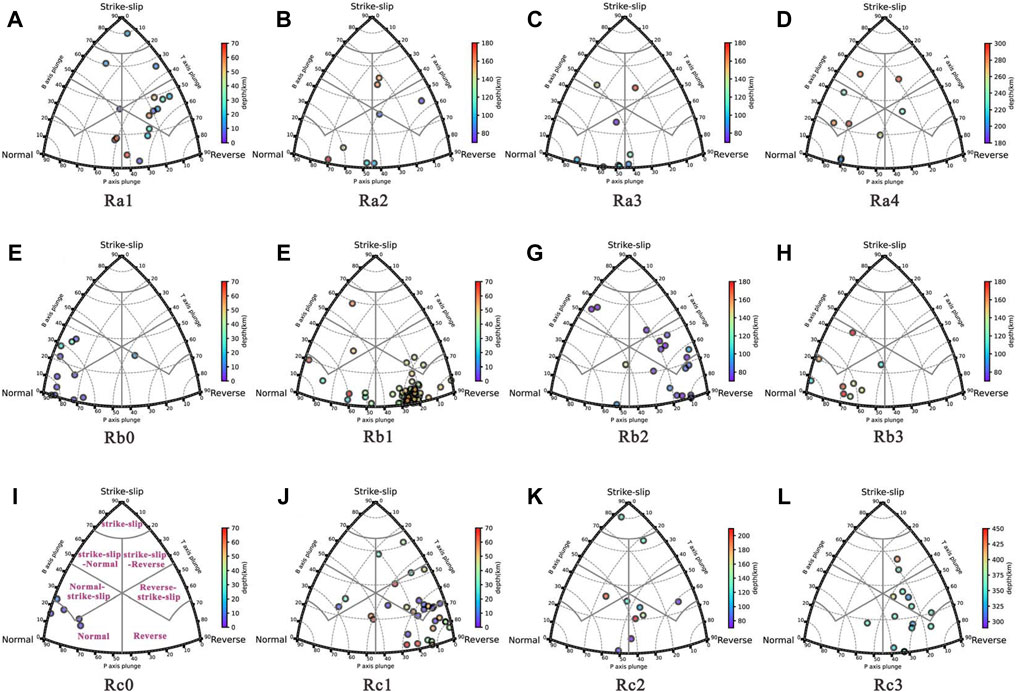
FIGURE 6. (A–L): A ternary diagram representing the distribution of earthquake faulting characteristics at various profiles. Ternary diagrams representing the distribution of earthquake faulting characteristics at various profiles. It is plotted as a function of the orientation of the P, T, and B-axes for the thrust, normal, and strike-slip faulting earthquakes. The ternary classification is based on Frohlich (1992) and visualized using Álvarez-Gómez (2019). The reader may refer the panel I for a general distribution of the faulting regimes in a ternary classification. Events are represented by color filled circles based on depth (scale on the right).
In the trench-outer rise regions (Rb0 and Rc0), the P axes for a depth range of 5–35 km cluster around the slab normal, but the T axes, while lying in the slab plane, show a greater range of directions (Figure 4). The results are consistent with the stress inversions, showing slab normal σ1 and slab horizontal σ3 within its 95% confidence ranges (Figure 7; Table 3). Such stress inversions indicate that the slab plane is under a pure extensional stress regime dominated by the normal earthquakes type (Figures 6E,I).
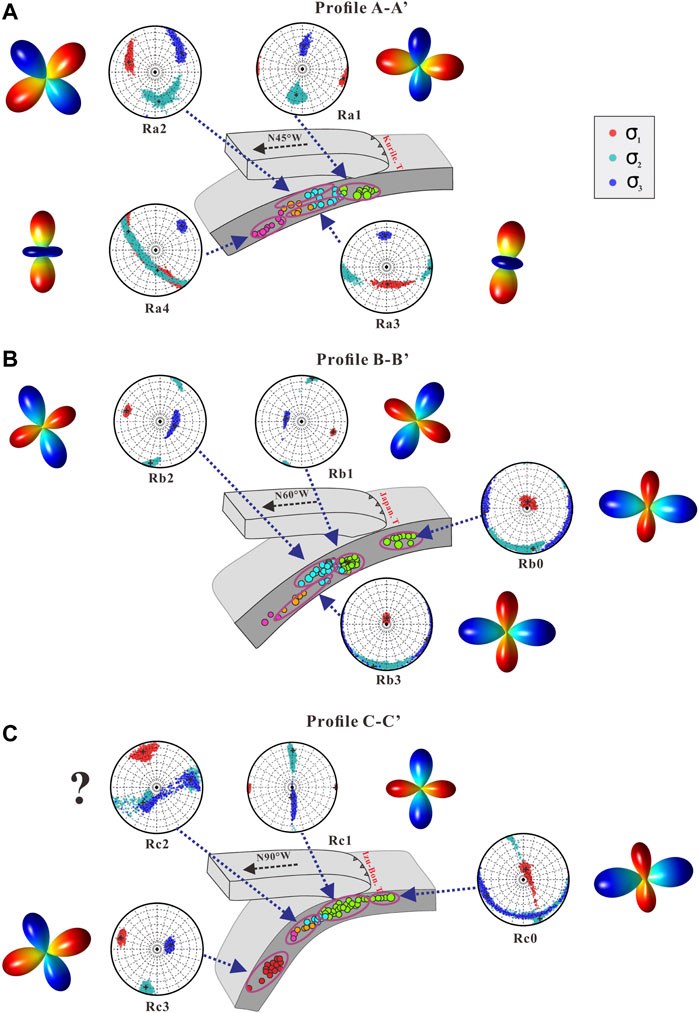
FIGURE 7. Tectonic cross-sections (not in scale) of all the three profiles discussed in this paper (Profile A-A’ (A), B-B’ (B) and C-C’(C)). The dashed black arrows represent the orientation of the sections, as well as the direction of plate subduction. The earthquakes we used in this paper is denoted by the dots. The depth of earthquakes is shown by the color bar in Figure 1. Respective region-wise principal stress axes with their 95% confidence limits are plotted on lower hemisphere stereonets, where red: the maximum compressive stress (σ1), cyan: intermediate principal axis (σ2) and blue: minimum compressive stress (σ3). 3D figures of spatial distribution for principal stress regime (Wan et al., 2011) are plotted around the stereographic projection, where the warm color represents the compressional stress state, while cold color corresponds to the tensional stress state.
In a shallow portion of the WBZ (Ra1 and Rb1 and Rc1), we can clearly see that the dominant faulting style is characterized by a considerable number of reverse faulting earthquakes (Figures 6A,F,J) which have steeply plunging T and gently plunging P axes.
In addition, the distribution of P and T axes at intermediate depths (70–300 km) are more complex, as well as faulting types. Notably, Double Seismic Zones existed in the shallow portion of intermediate-depth (70–180 km) of profiles A-A’ and B-B’ (Figures 4A,B). There are distinct interfaces, in which the distribution of P and T axes varies significantly. Subvolumes in the upper WBZ plane (UP), i.e., above the interfaces, were named Ra2 and Rb2, while lower WBZ plane (LP), i.e., below the interfaces, were named Ra3 and Rb3, respectively. A notable feature of Double Seismic Zones in profile A-A’ is that the Ra2 (UP) favors oblique strike-slip with a reverse component faulting, while the dominant faulting style in Ra3 (LP) is normal with a strike-slip component (Figures 6B,C). In profile B-B’, the Double Seismic Zone is characterized by reverse faulting with steeply plunging T axes in Rb2 (UP) and normal faulting with steeply plunging P axes in Rb3 (LP) (Figures 6G,H). Ra4 belongs to the deep portion of intermediate depths (200–300 km). This subvolume is dominated by the normal fault with a strike-slip component, in which the T axes cluster within the NE quadrant, and P axes scatter within the SW quadrant (Figures 4A, 6D). At deep depths (300–500 km), Rc3 is dominated by the reverse fault with the P axes clustered in NW quadrant and the T axes scattered in SE quadrant (Figures 4C, 6L).
Discussion
Table 3 lists the number of the input data, and the best-fit stress models obtained for the considered WBZ subvolumes: the directions of σ1, σ2, σ3, the R-value estimate, the average misfit angle β, and depth. Obviously, most WBZ subvolumes can reflect the homogeneous stress field characteristics. However, in Rc2, the value of β exceeds the threshold reflecting the inhomogeneous stress field. Therefore, it is not meaningful to study its stress state. In the following, we analyze and discuss the stress field in four parts.
The stress field in trench-outer rise regions
As described in the above section, the Rb0 and Rc0 represent trench-outer rise regions in the Northwest Pacific plate subduction system (Figure 4). We clearly observe that most of FMS are normal-faulting type in these regions (Figures 6E,I). The stress tensors in both subvolumes are almost similar (Figure 7; Table 3), showing the slab-normal σ1 and sub-horizontal σ3. The shape ratios (R values) in Rb0 and Rc0 are 0.77 and 0.82, respectively, indicating a stable σ1.
The above analysis shows that the region of shallow trench-outer rise is most likely under a pure tension regime, which is consistent with the previous studies (Emry and Wiens, 2015; Uchida et al., 2016; Gong et al., 2021). The force driving the normal-faulting in these regions is attributed to slab pull prior to subduction, which causes the elastic lithosphere bending (Hatakeyama et al., 2017; Obana et al., 2019; Contreras-Reyes et al., 2021). The shallow extensional stress regime also explains bending-related normal faults that are widely observed in such regions (e.g., Obana et al., 2019), which may play an important role in promoting water circulation in subduction zones. According to Ranero et al. (2003), a large normal fault event that ruptures the surface may provide a pathway for sea water to penetrate the mantle. The amount of water brought into the mantle is related to the maximum depth of tension fault cut into the lithosphere which is directly linked to the maximum FMS depths (Lefeldt and Grevemeyer, 2008). As a consequence, the hydrated oceanic lithosphere produces a reduction of crustal and upper mantle velocities, supporting serpentinization of the upper mantle (Lefeldt and Grevemeyer, 2008; Moscoso and Grevemeyer, 2015; Hatakeyama et al., 2017).
The stress field in double seismic zones
Double Seismic Zones are ubiquitous features of subduction zones (Brudzinski et al., 2007; Reynard et al., 2010; Florez and Prieto, 2019). Earthquakes within the subducted lithosphere cluster into two distinct layers, that eventually merge at depth (Green II et al., 2010; Hasegawa and Nakajima, 2017; Wei et al., 2017).
In Ra2 (UP), σ1 is closely parallel to the slab, while σ3 is NE trending with a gentle plunging (37.2°), i.e., close to in-slab all along the arc. The R value is 0.6, implying a relatively stable σ1. In Ra3 (LP), the best-fit stress models obtained show close to slab-normal σ1 with a steeply plunging (59.1°) and close to slab-parallel σ3 (N2.7°E) with a gentle plunging (29.9°). The R value is 0.16, implying a very stable σ3. Compared with the stress state in Ra2 and Ra3, the azimuth of σ1 is rotated counter-clockwise by 90° from NWW (288.7°) in Ra2 to the SSW (198.1°) in Ra3. Our model indicates that the dominant stress regime in Ra2 and Ra3 shifts from general compression to general extension (Guiraud et al., 1989).
In Rb2 (UP), the best-fit stress models show close to slab-parallel σ1 (286.9°), the σ3 is close to slab-normal. The intermediate compression σ2 is almost horizontal trending NE close to in-slab all along the arc. In Rb3 (LP), the best-fit stress models show close to slab normal σ1 and close to slab-parallel σ3. The intermediate compressive stress σ2 is close to in-slab. The R value in Rb2 is 0.71 while in Rb3 is 0.69, both implying relatively stable σ1. Our model indicates that the dominant stress regime in Ra2 is pure compression while in Ra3 is pure extension (Guiraud et al., 1989).
Overall, we find that the UP and LP have almost opposite stress states. The stress regime in UP is dominantly down-dip compression type while in LP is dominantly down-dip tension type. The findings are consistent with the typical stress model of Double Seismic Zones, which is described in the previous studies (Hasegawa et al., 1979, 1994; Christova, 2015; Li & Chen, 2019).
In the last century, several mechanisms have been proposed to explain the coexistence of parallel compression and tension of the slabs observed at Double Seismic Zones, including sagging of the plate (Sleep, 1979; Yoshii, 1979), thermoelastic stress (Fujita and Kanamori, 1981; Goto et al., 1985), and unbending of the slab (Engdahl and Scholz, 1977; Kawakatsu, 1986). However, the recent dehydration-related embrittlement of different hydrate minerals in subducted slabs is widely considered as a promising hypothesis for events of Double Seismic Zones (Reynard et al., 2010; Chernak and Hirth, 2011; Proctor and Hirth, 2015; Okazaki and Hirth, 2016). According to Faccenda et al. (2012), the Double Seismic Zones observed in many subduction zones can be explained by the formation of the Double Hydrated Zone during plate dehydration. The redistribution of fluids caused by the unbending of the plate at intermediate depths is responsible for the formation of the Double Hydrated Zone. Reynard et al. (2010) argued that the driving force that keeps slab unbending comes from the mantle flow which sustaining the slab pushes the tip of the slab forward. Our results also support the conclusion of numerical models (Reynard et al., 2010; Faccenda et al., 2012) that down-dip compression is enhanced by mantle flow opposing the dip of the slab, whereas overall downdip extension is favored by mantle flow in the same direction of the slab dip. Thus, we believe that the unbending of the slab is more likely to be the kinetic explanation for the stress state of Double Seismic Zones.
The stress field in shallow and deep portions of the Wadati-Benioff zone
The Ra1, Rb1, and Rc1 represent the shallow regions of the WBZ in Northwest Pacific plate subduction system. Overall, the reverse faults account for the majority of earthquake types (Figures 6A,F,J). The best-fit stress models show that σ1 is sub-horizontal and strike-normal, while σ3 is close to slab-normal, and σ2 is close to in-slab all along the arc (Figure 7; Table 3). All the R values are higher than 0.5 (Ra1: 0.55; Ra2: 0.72; Ra3: 0.71) implying a relatively stable σ1. A combination of the best-fit stress model and the R values indicates a stress regime of pure compression. Since the parallelism of the stress axes with the plunge of the subducted slab is the primary evidence that the earthquakes occur in the subducted slab in response to stresses within the plate (Isacks and Molnar, 1971), our results reveal that the present-day stress state of the shallow WBZ is nearly uniform across the three selected profiles. The orientation of the maximum compressive σ1 have geomorphological expression and points to the axes of the trench, which is interpreted as the relative motion of two converging plates of lithosphere. The dominant forces acting within the shallow WBZ are related to negative buoyancy of the plate and convergence between the plates, consistent with plate pull or ridge push mechanics (Isacks and Molnar, 1971; Christova et al., 2004, 2015; Doglioni et al., 2007).
The Rc3 represents the deep portion of the slab in our study area with the depth of 320–420 km. The reverse faults also account for the majority of earthquake types (Figure 6L) which is similar to the shallow regions of the WBZ. The best-fit stress model and the R value (0.52) indicates a stress regime of pure compression with close to slab-parallel σ1, nearly horizontal σ2 close to in-slab and close to slab-normal σ3 with a steeply plunge of 64.1° (Guiraud et al., 1989). Our results are consistent with the hypothesis that predominance of compression below about 300 km in several arcs, i.e., the most striking regularity in the mechanisms of deep earthquakes is the tendency of the compressional axis to parallel the local dip of the seismic zone (Isacks et al., 1968; Stauder and Mualchin, 1976; Christova, 2015). A reasonable interpretation is that there are forces on the lower portions of the slab that resist its motion. The compressive stress inside the slab will be the result of a downward-directed force applied to the upper portions of the slab and the upward-directed resisting force applied to the lower part of the slab. The cause of this resistance might be either an increase in strength in the surrounding mantle or a buoyant effect if the density of the slab were lower than that in the surrounding mantle. Our speculation agrees with the numerical models conducted by Carminati and Petricca (2010). They suggested the mantle flow drives the plate downward suffering resistance offered by the mantle to the penetration of the slab.
The stress field along the junction of the trench Wadati-Benioff zone
The junction of the Kurile and Japan arcs is expressed as a cuspate feature at the trench with a complex lithospheric structure, is known as the Hokkaido corner (Miller et al., 2006). Since the profile A-A’ (southern Kurile trench WBZ) is located here, it can be served as a window to understanding the stress characteristics of intermediate-depth earthquakes and investigating deformation of the oceanic lithosphere beneath the arc junction in this paper.
A closer look through the FMS data of Double Seismic Zones in profile A-A’, we find that more than half of them have considerate strike-slip component (Figures 6B,C) in contrast to the central Japan trench WBZ (Figures 6G,H), although the best-fit stress models are characterized with down-dip compression or down-dip tension in both the UP and LP (Figure 7A; Table 3). Going forward to the deeper at intermediate-depth, in Ra4, the best-fit stress model shows close to in-slab σ3 and slab-normal σ1. The R value is 0.15, indicating a general extension stress regime (Guiraud et al., 1989). However, this extensional feature revealed by best-fit stress model is inconsistent with the present-day overall stress field in northeast Japan, which is characterized by a reverse-faulting regime (Zoback, 1992; Kubo et al., 2002; Townend and Zoback, 2006).
The above two unusual stress states imply the additional forces acting at intermediate depths. The lateral deformation at intermediate depths is considered to be the more likely hypothesis (Isacks and Molnar, 1971; DeMets, 1992). Tomography imaging revealed by Miller et al. (2006) shows that a region of low-velocity depth and a distorted, buckled lower slab boundary exists at approximately 50–150 km depth beneath the Hokkaido corner, which are likely to be related to lateral deformation of the subducted Pacific plate at the arc-arc junction. The possible causes of lateral stretching are local hinge folding of the slab plate, which resulting from the increase of the slab’s dip, as well as the different subduction rate between the two trench WBZs (Katsumata, 2003). Unfortunately, the lack of enough FMS from that particular segment hurdles us to look for more finer variations in spatial stress.
Conclusion
A new subset of 201 earthquakes with high-quality FMS was inverted to investigate the stress field along the Northwest Pacific WBZ. Combined with previous geological and geophysical studies, our results shed light on new constraints as follows:
(1) The shallow trench-outer rise region is most likely under a pure tension regime. The geodynamic force in the region is attributed to slab pull, which priors to subduction and causes the elastic lithosphere bending.
(2) Double Seismic Zones exist at the intermediate depths of southern Kurile trench and central Japan trench WBZ. The stress regimes in UP are dominantly down-dip compression type while in LP are dominantly down-dip tension type. Slab unbending is more likely to be the kinetic explanation for the coexistence of parallel compression and tension of the slabs.
(3) The present-day stress state in shallow WBZ segment shows pure compression. The dominant geodynamic forces are related to negative buoyancy of the plate and convergence between the plates, which is consistent with plate pull or ridge push mechanics. The deep segment of northern Izu-Bonin trench WBZ shows a stress regime of pure compression, perhaps casing by the resistance offered by the mantle to the penetration of the slab.
(4) The unusual stress states were found at intermediate depths along the junction of the trench WBZ manifested by a considerable strike-slip component in Double Seismic Zones (70–200 km) and a general extension stress regime at deeper (200–300 km) depths. We suspect that these might be influenced by lateral deformation due to increasing slab’s dip.
Data availability statement
The original contributions presented in the study are included in the article/Supplementary material, further inquiries can be directed to the corresponding author.
Author contributions
CL and FL are responsible for the original content and initial manuscript of this work. All authors collected and analyzed the data; CL and FL participated discussion; CL and YC drew the figures; CL and FL wrote the paper with the help of all authors.
Funding
This work was jointly supported by the Earthquake Science and Technology Spark of the China Earthquake Administration (XH20034Y), Information Building and Intelligent Service Team Fund of Shandong Earthquake Agency (ZD202201) and General Research Project of Shandong Earthquake Agency (YB 2005).
Acknowledgments
Most figures in this paper were generated using the Generic Mapping Tool (Wessel et al., 2019).
Conflict of interest
The authors declare that the research was conducted in the absence of any commercial or financial relationships that could be construed as a potential conflict of interest.
Publisher’s note
All claims expressed in this article are solely those of the authors and do not necessarily represent those of their affiliated organizations, or those of the publisher, the editors and the reviewers. Any product that may be evaluated in this article, or claim that may be made by its manufacturer, is not guaranteed or endorsed by the publisher.
Supplementary material
The Supplementary Material for this article can be found online at: https://www.frontiersin.org/articles/10.3389/feart.2022.1017632/full#supplementary-material
References
Álvarez-Gómez, J. A. (2019). FMC—earthquake focal mechanisms data management, cluster and classification. SoftwareX 9, 299–307. doi:10.1016/j.softx.2019.03.008
Benioff, H., Gutenberg, B., and Richter, C. F. (1954). Progress report, seismological laboratory, California Institute of technology, 1953. Trans. AGU. 35 (6), 979–987. doi:10.1029/TR035i006p00979
Brudzinski, M. R., Thurber, C. H., Hacker, B. R., and Engdahl, E. R. (2007). Global prevalence of double benioff zones. Science 316, 1472–1474. doi:10.1126/science.1139204
Carminati, E., and Petricca, P. (2010). State of stress in slabs as a function of large-scale plate kinematics. Geochem. Geophys. Geosyst. 11 (4). doi:10.1029/2009GC003003
Chernak, L. J., and Hirth, G. (2011). Syndeformational antigorite dehydration produces stable fault slip. Geology 39, 847–850. doi:10.1130/G31919.1
Chiang, A., Dreger, D. S., Ford, S. R., Walter, W. R., and Yoo, S. (2016). Moment tensor analysis of very shallow sources. Bull. Seismol. Soc. Am. 106, 2436–2449. doi:10.1785/0120150233
Chiang, Andrea, and USDOE National Nuclear Security Administration (2020). Time domain moment tensor inversion in Python. Computer softwareUSDOE National Nuclear Security Administration (NNSA). 11 Feb, 2020, Available At https://www.osti.gov//servlets/purl/1602708. Vers. 0.1.doi:10.11578/dc.20200303.3
Christova, C., Scholz, C. H., and Kao, H. (2004). Stress field in the Vanuatu (New Hebrides) Wadati–Benioff zone inferred by inversion of earthquake focal mechanisms. J. Geodyn. 37, 125–137. doi:10.1016/j.jog.2003.11.001
Christova, C. V. (2015). Spatial distribution of the contemporary stress field in the Kurile Wadati-Benioff zone by inversion of earthquake focal mechanisms. J. Geodyn. 83, 1–17. doi:10.1016/j.jog.2014.11.001
Contreras-Reyes, E., Cortés-Rivas, V., Manríquez, P., and Maksymowicz, A. (2021). The silent bending of the oceanic Nazca Plate at the Peruvian Trench. Tectonophysics 807, 228810. doi:10.1016/j.tecto.2021.228810
Cui, H., Wan, Y., Huang, J., Sheng, S., and Jin, Z. (2019). Inversion for the tectonic stress field and the characteristic of the stress shape factor of the detachment slab in the Pamir-Hindu Kush area. Chin. J. Geophys. 62 (5), 1633–1649. (in Chinese). doi:10.6038/cjg2019M0202
Delvaux, D., and Barth, A. (2010). African stress pattern from formal inversion of focal mechanism data. Tectonophysics 482, 105–128. doi:10.1016/j.tecto.2009.05.009
DeMets, C., Gordon, R. G., Argus, D. F., and Stein, S. (1994). Effect of recent revisions to the geomagnetic reversal time scale on estimates of current plate motions. Geophys. Res. Lett. 21, 2191–2194. doi:10.1029/94GL02118
DeMets, C. (1992). Oblique convergence and deformation along the Kuril and Japan trenches. J. Geophys. Res. 97, 17615. doi:10.1029/92JB01306
Doglioni, C., Carminati, E., Cuffaro, M., and Scrocca, D. (2007). Subduction kinematics and dynamic constraints. Earth. Sci. Rev. 83, 125–175. doi:10.1016/j.earscirev.2007.04.001
Dreger, D. S. (2003).TDMT_INV: Time domain seismic moment tensor inversion, Int. Geophys., 81. Academic Press, 1627. doi:10.1016/S0074-6142(03)80290-5
Emry, E. L., and Wiens, D. A. (2015). Incoming plate faulting in the Northern and Western Pacific and implications for subduction zone water budgets. Earth Planet. Sci. Lett. 414, 176–186. doi:10.1016/j.epsl.2014.12.042
Engdahl, E. R., and Scholz, C. H. (1977). A double Benioff Zone beneath the central Aleutians: An unbending of the lithosphere. Geophys. Res. Lett. 4, 473–476. doi:10.1029/GL004i010p00473
Faccenda, M., Gerya, T. V., Mancktelow, N. S., and Moresi, L. (2012). Fluid flow during slab unbending and dehydration: Implications for intermediate-depth seismicity, slab weakening and deep water recycling. Geochem. Geophys. Geosyst. 13 (1). doi:10.1029/2011GC003860
Florez, M. A., and Prieto, G. A. (2019). Controlling factors of seismicity and geometry in double seismic zones. Geophys. Res. Lett. 46, 4174–4181. doi:10.1029/2018GL081168
Forsyth, D., and Uyedaf†, S. (1975). On the relative importance of the driving forces of plate motion. Geophys. J. Int. 43 (1), 163–200. doi:10.1111/j.1365-246X.1975.tb00631.x
Frohlich, C. (1992). Triangle diagrams: Ternary graphs to display similarity and diversity of earthquake focal mechanisms. Phys. Earth Planet. Interiors 75, 193–198. doi:10.1016/0031-9201(92)90130-N
Fujita, K., and Kanamori, H. (1981). Double seismic zones and stresses of intermediate depth earthquakes. Geophys. J. Int. 66, 131–156. doi:10.1111/j.1365-246X.1981.tb05950.x
Gephart, J. W., and Forsyth, D. W. (1984). An improved method for determining the regional stress tensor using earthquake focal mechanism data: Application to the San Fernando Earthquake Sequence. J. Geophys. Res. 89, 9305–9320. doi:10.1029/JB089iB11p09305
Gong, W., Jiang, X., Xing, J., Xu, C., Zhang, H., An, L., et al. (2021). Heterogeneous outer-rise seismicity within the Izu–Bonin subduction zone and its tectonic implications. Geol. J. 56, 4699–4718. doi:10.1002/gj.4206
Goto, K., Hamaguchi, H., and Suzuki, Z. (1985). Earthquake generating stresses in a descending slab. Tectonophysics 112, 111–128. doi:10.1016/0040-1951(85)90175-1
Green, H. W., Chen, W.-P., and Brudzinski, M. R. (2010). Seismic evidence of negligible water carried below 400-km depth in subducting lithosphere. Nature 467, 828–831. doi:10.1038/nature09401
Guiraud, M., Laborde, O., and Philip, H. (1989). Characterization of various types of deformation and their corresponding deviatoric stress tensors using microfault analysis. Tectonophysics 170, 289–316. doi:10.1016/0040-1951(89)90277-1
Hardebeck, J. L., and Okada, T. (2018). Temporal stress changes caused by earthquakes: A review. J. Geophys. Res. Solid Earth 123, 1350–1365. doi:10.1002/2017JB014617
Hasegawa, A., Horiuchi, S., and Umino, N. (1994). Seismic structure of the northeastern Japan convergent margin: A synthesis. J. Geophys. Res. 99, 22295–22311. doi:10.1029/93JB02797
Hasegawa, A., and Nakajima, J. (2017). Seismic imaging of slab metamorphism and Genesis of intermediate-depth intraslab earthquakes. Prog. Earth Planet. Sci. 4, 12–31. doi:10.1186/s40645-017-0126-9
Hasegawa, A., Umino, N., Takagi, A., and Suzuki, Z. (1979). Double-planed deep seismic zone and anomalous structure in the upper mantle beneath northeastern Honshu (Japan). Tectonophysics 57 (1), 1–6. doi:10.1016/0040-1951(79)90098-2
Hatakeyama, K., Katayama, I., Hirauchi, K., and Michibayashi, K. (2017). Mantle hydration along outer-rise faults inferred from serpentinite permeability. Sci. Rep. 7, 13870. doi:10.1038/s41598-017-14309-9
Hayes, G. P., Moore, G. L., Portner, D. E., Hearne, M., Flamme, H., Furtney, M., et al. (2018). Slab2, a comprehensive subduction zone geometry model. Science 362, 58–61. doi:10.1126/science.aat4723
Herrmann, R. B. (2013). Computer Programs in Seismology: An evolving Tool for instruction and research. Seismol. Res. Lett. 84, 1081–1088. doi:10.1785/0220110096
Huang, Z., Zhao, D., and Wang, L. (2011). Stress field in the 2008 Iwate-Miyagi earthquake (M7.2) area. Geochem. Geophys. Geosyst. 12 (6). doi:10.1029/2011GC003626
Isacks, B., and Molnar, P. (1971). Distribution of stresses in the descending lithosphere from a global survey of focal-mechanism solutions of mantle earthquakes. Rev. Geophys. 9, 103. doi:10.1029/RG009i001p00103
Isacks, B., Oliver, J., and Sykes, L. R. (1968). Seismology and the new global tectonics. J. Geophys. Res. 73, 5855–5899. doi:10.1029/JB073i018p05855
Katsumata, K. (2003). Newly imaged shape of the deep seismic zone within the subducting Pacific plate beneath the Hokkaido corner, Japan-Kurile arc-arc junction. J. Geophys. Res. 108, 2565. doi:10.1029/2002JB002175
Kawakatsu, H. (1986). Double seismic zones: Kinematics. J. Geophys. Res. 91, 4811. doi:10.1029/JB091iB05p04811
Kimura, T., Murakami, H., and Matsumoto, T. (2015). Systematic monitoring of instrumentation health in high-density broadband seismic networks. Earth Planets Space 67 (1), 55–15. doi:10.1186/s40623-015-0226-y
Kita, S., Okada, T., Hasegawa, A., Nakajima, J., and Matsuzawa, T. (2010). Existence of interplane earthquakes and neutral stress boundary between the upper and lower planes of the double seismic zone beneath Tohoku and Hokkaido, northeastern Japan. Tectonophysics 496, 68–82. doi:10.1016/j.tecto.2010.10.010
Konstantinou, K. I., Mouslopoulou, V., Liang, W.-T., Heidbach, O., Oncken, O., and Suppe, J. (2017). Present-day crustal stress field in Greece inferred from regional-scale damped inversion of earthquake focal mechanisms. J. Geophys. Res. Solid Earth 122, 506–523. doi:10.1002/2016JB013272
Kubo, A., Fukuyama, E., Kawai, H., and Nonomura, K. (2002). NIED seismic moment tensor catalogue for regional earthquakes around Japan: Quality test and application. Tectonophysics 356, 23–48. doi:10.1016/S0040-1951(02)00375-X
Lefeldt, M., and Grevemeyer, I. (2008). Centroid depth and mechanism of trench-outer rise earthquakes. Geophys. J. Int. 172, 240–251. doi:10.1111/j.1365-246X.2007.03616.x
Li, T., and Chen, Q. (2019). Stress regime inversion in the Northwest Pacific subduction zone, the segment from northern Honshu, Japan to Northeast China. Chin. J. Geophys. 62 (2), 520–533. (in Chinese). doi:10.6038/cjg2019M0044
Liu, C., Li, G., and Liu, F. (2022). Early cretaceous-cenozoic exhumation history of luxi terrane and adjacent areas, eastern North China craton. Geol. J. 57, 2735–2748. doi:10.1002/gj.4445
Liu, F., Miao, Q., and Qu, J. (2021). Multi-method study on seismogenic structure of rushan earthquake sequence in Shandong province, China. Izv. Phys. Solid Earth 57, 965–979. doi:10.1134/S106935132106015X
Liu, X., Zhao, D., Li, S., and Wei, W. (2017). Age of the subducting Pacific slab beneath East Asia and its geodynamic implications. Earth Planet. Sci. Lett. 464, 166–174. doi:10.1016/j.epsl.2017.02.024
Maeda, S., Matsuzawa, T., Okada, T., Katao, H., Yoshida, T., Kosuga, M., et al. (2020). Spatiotemporal variations in the stress field in the northeasternmost part of the NE Japan arc: Constraints from microearthquakes. Earth Planets Space 72, 117. doi:10.1186/s40623-020-01245-8
Michael, A. J. (1984). Determination of stress from slip data: Faults and folds. J. Geophys. Res. 89, 11517–11526. doi:10.1029/JB089iB13p11517
Michael, A. J. (1987). Use of focal mechanisms to determine stress: A control study. J. Geophys. Res. 92, 357–368. doi:10.1029/JB092iB01p00357
Michael, A.J., Ellsworth, W.L., and Oppenheimer, D.H. (1990). Coseismic stress changes induced by the 1989 Loma Prieta, California Earthquake. Res. Lett. 17, 1441–1444. doi:10.1029/GL017i009p01441
Michael, A.J. (1991). Spatial variations in stress within the 1987 Whittier Narrows, California, aftershock sequence: New techniques and results. J. Geophys. Res. Solid Earth 96, 6303–6319. doi:10.1029/91JB00195
Miller, M. S., Kennett, B. L. N., and Gorbatov, A. (2006). Morphology of the distorted subducted Pacific slab beneath the Hokkaido corner, Japan. Phys. Earth Planet. Interiors 156, 1–11. doi:10.1016/j.pepi.2006.01.007
Minson, S. E., and Dreger, D. S. (2008). Stable inversions for complete moment tensors. Geophys. J. Int. 174, 585–592. doi:10.1111/j.1365-246X.2008.03797.x
Moscoso, E., and Grevemeyer, I. (2015). Bending-related faulting of the incoming oceanic plate and its effect on lithospheric hydration and seismicity: A passive and active seismological study offshore maule, Chile. J. Geodyn. 90, 58–70. doi:10.1016/j.jog.2015.06.007
NIED (2019). NIED F-net. Tsukuba: National Research Institute for Earth Science and Disaster Resilience. doi:10.17598/nied.0005
Obana, K., Fujie, G., Takahashi, T., Yamamoto, Y., Tonegawa, T., Miura, S., et al. (2019). Seismic velocity structure and its implications for oceanic mantle hydration in the trench–outer rise of the Japan Trench. Geophys. J. Int. 217, 1629–1642. doi:10.1093/gji/ggz099
Okada, Y., Kasahara, K., Hori, S., Obara, K., Sekiguchi, S., Fujiwara, H., et al. (2004). Recent progress of seismic observation networks in Japan—hi-net, F-net, K-net and KiK-net. Earth Planets Space 56 (8). doi:10.1186/BF03353076
Okazaki, K., and Hirth, G. (2016). Dehydration of lawsonite could directly trigger earthquakes in subducting oceanic crust. Nature 530, 81–84. doi:10.1038/nature16501
Pasyanos, M. E., and Chiang, A. (2020). Report for department of state (DoS) V-fund Project “tying moment tensor solutions to explosive yield” (No. LLNL-TR-812313). Livermore, CA (United States): Lawrence Livermore National Lab. (LLNL). doi:10.2172/1638008
Proctor, B., and Hirth, G. (2015). Role of pore fluid pressure on transient strength changes and fabric development during serpentine dehydration at mantle conditions: Implications for subduction-zone seismicity. Earth Planet. Sci. Lett. 421, 1–12. doi:10.1016/j.epsl.2015.03.040
Ranero, C. R., Phipps Morgan, J., McIntosh, K., and Reichert, C. (2003). Bending-related faulting and mantle serpentinization at the Middle America trench. Nature 425, 367–373. doi:10.1038/nature01961
Reynard, B., Nakajima, J., and Kawakatsu, H. (2010). Earthquakes and plastic deformation of anhydrous slab mantle in double Wadati-Benioff zones. Geophys. Res. Lett. 37 (24). doi:10.1029/2010GL045494
Saito, T., Noda, A., Yoshida, K., and Tanaka, S. (2018). Shear strain energy change caused by the interplate coupling along the nankai trough: An integration analysis using stress tensor inversion and slip-deficit inversion. J. Geophys. Res. Solid Earth 123, 5975–5986. doi:10.1029/2018JB015839
Sandiford, D., Moresi, L. M., Sandiford, M., Farrington, R., and Yang, T. (2020). The fingerprints of flexure in slab seismicity. Tectonics 39 (8). doi:10.1029/2019TC005894
Schellart, W. P., Freeman, J., Stegman, D. R., Moresi, L., and May, D. (2007). Evolution and diversity of subduction zones controlled by slab width. Nature 446, 308–311. doi:10.1038/nature05615
Seno, T., Stein, S., and Gripp, A. E. (1993). A model for the motion of the Philippine Sea Plate consistent with NUVEL-1 and geological data. J. Geophys. Res. 98 (17), 17941–17948. doi:10.1029/93jb00782
Sheng, S., and Meng, L. (2020). Stress field variation during the 2019 ridgecrest earthquake sequence. Geophys. Res. Lett. 47 (15). doi:10.1029/2020GL087722
Sleep, N. H. (1979). The double seismic zone in downgoing slabs and the viscosity of the mesosphere. J. Geophys. Res. 84, 4565–4571. doi:10.1029/JB084iB09p04565
Song, C.-H., Lu, C.-P., Zhang, X.-F., Wang, C., Xie, H.-D., Yan, X.-Y., et al. (2022). Moment tensor inversion and stress evolution of coal pillar failure mechanism. Rock Mech. Rock Eng. 55, 2371–2383. doi:10.1007/s00603-022-02783-1
Stauder, W., and Mualchin, L. (1976). Fault motion in the larger earthquakes of the Kurile-Kamchatka Arc and of the Kurile-Hokkaido corner. J. Geophys. Res. 81, 297–308. doi:10.1029/JB081i002p00297
Terakawa, T., and Matsu’ura, M. (2010). The 3-D tectonic stress fields in and around Japan inverted from centroid moment tensor data of seismic events. Tectonics 29 (6). doi:10.1029/2009TC002626
Townend, J., and Zoback, M. D. (2006). Stress, strain, and mountain building in central Japan. J. Geophys. Res. 111. doi:10.1029/2005JB003759
Tozer, B., Sandwell, D. T., Smith, W. H., Olson, C., Beale, J. R., and Wessel, P. (2019). Global bathymetry and topography at 15 arc sec: SRTM15+. Earth Space Sci. 6 (10), 1847–1864. doi:10.1029/2019EA000658
Uchida, N., Kirby, S. H., Umino, N., Hino, R., and Kazakami, T. (2016). The great 1933 sanriku-oki earthquake: Reappraisal of the main shock and its aftershocks and implications for its tsunami using regional tsunami and seismic data. Geophys. J. Int. 206, 1619–1633. doi:10.1093/gji/ggw234
Vavryčuk, V. (2014). Iterative joint inversion for stress and fault orientations from focal mechanisms. Geophys. J. Int. 199, 69–77. doi:10.1093/gji/ggu224
Vavryčuk, V. (2011). Principal earthquakes: Theory and observations from the 2008 west bohemia swarm. Earth Planet. Sci. Lett. 305, 290–296. doi:10.1016/j.epsl.2011.03.002
Wan, Y., Sheng, S., Xu, R., and Wu, Y. (2011). Effect of stress ratio and friction coefficient on composite P wave radiation patterns. Chin. J. Geophys. (in Chin. 54 (4), 994–1001. doi:10.3969/j.issn.0001-5733.2011.04.014
Wei, S. S., Wiens, D. A., van Keken, P. E., and Cai, C. (2017). Slab temperature controls on the Tonga double seismic zone and slab mantle dehydration. Sci. Adv. 3 (1), e1601755. doi:10.1126/sciadv.1601755
Wei, W., Zhao, D., Xu, J., Wei, F., and Liu, G. (2015). P and S wave tomography and anisotropy in Northwest Pacific and East Asia: Constraints on stagnant slab and intraplate volcanism. J. Geophys. Res. Solid Earth 120 (3), 1642–1666. doi:10.1002/2014JB011254
Wessel, P., Luis, J. F., Uieda, L., Scharroo, R., Wobbe, F., Smith, W. H. F., et al. (2019). The generic mapping tools version 6. Geochem. Geophys. Geosyst. 20, 5556–5564. doi:10.1029/2019GC008515
Yang, F., Santosh, M., and Kim, S. W. (2018). Mesozoic magmatism in the eastern North China Craton: Insights on tectonic cycles associated with progressive craton destruction. Gondwana Res. 60, 153–178. doi:10.1016/j.gr.2018.04.003
Yoshida, K., Hasegawa, A., and Okada, T. (2015). Spatial variation of stress orientations in NE Japan revealed by dense seismic observations. Tectonophysics 647, 63–72. doi:10.1016/j.tecto.2015.02.013
Yoshida, K., Hasegawa, A., and Okada, T. (2016a). Heterogeneous stress field in the source area of the 2003 M6.4 Northern Miyagi Prefecture, NE Japan, earthquake. Geophys. J. Int. 206, 408–419. doi:10.1093/gji/ggw160
Yoshida, K., Hasegawa, A., Okada, T., Iinuma, T., Ito, Y., and Asano, Y. (2012). Stress before and after the 2011 great Tohoku-oki earthquake and induced earthquakes in inland areas of eastern Japan. Geophys. Res. Lett. 39 (3). doi:10.1029/2011GL049729
Yoshida, K., Hasegawa, A., Saito, T., Asano, Y., Tanaka, S., Sawazaki, K., et al. (2016b). Stress rotations due to the M 6.5 foreshock and M 7.3 main shock in the 2016 Kumamoto, SW Japan, earthquake sequence. Geophys. Res. Lett. 43. doi:10.1002/2016GL070581
Yoshii, T. (1979). A detailed cross-section of the deep seismic zone beneath northeastern Honshu, Japan. Tectonophysics 55, 349–360. doi:10.1016/0040-1951(79)90183-5
Keywords: focal mechanisms, Wadati-Benioff zone, stress field, Northwest Pacific plate, F-net
Citation: Liu C, Liu F, Cai Y, Ni R, Xu X, Li G, Hao W and Tian Z (2023) The present-day stress field along the Northwest Pacific Wadati-Benioff zone constrained by focal mechanisms of moderate earthquakes. Front. Earth Sci. 10:1017632. doi: 10.3389/feart.2022.1017632
Received: 12 August 2022; Accepted: 24 October 2022;
Published: 12 January 2023.
Edited by:
Fei Xue, Hohai University, ChinaReviewed by:
Yunjian Li, Hohai University, ChinaChunhui Song, China University of Mining and Technology, China
Guangwei Zhang, National Institute of Natural Hazards, China
Copyright © 2023 Liu, Liu, Cai, Ni, Xu, Li, Hao and Tian. This is an open-access article distributed under the terms of the Creative Commons Attribution License (CC BY). The use, distribution or reproduction in other forums is permitted, provided the original author(s) and the copyright owner(s) are credited and that the original publication in this journal is cited, in accordance with accepted academic practice. No use, distribution or reproduction is permitted which does not comply with these terms.
*Correspondence: Fangbin Liu, bGl1ZmFuZ2Jpbjg5MDhAMTYzLmNvbQ==