Commentary: Reply to commentary by Noormets and Kirchner on “Glacial history and depositional environments in little Storfjorden and Hambergbukta of Arctic Svalbard since the younger dryas” [Frontiers in Earth Science, (2022), 2211]
 Young Jin Joe1,2
 Kwangchul Jang1
 Matthias Forwick3Jan Sverre Laberg3Gee Soo Kong4Moo-Hee Kang4
 Seok-Hoon Yoon2Seung-Il Nam1*
- 1Division of Glacial Environment Research, Korea Polar Research Institute, Incheon, South Korea
- 2Department of Earth and Marine Sciences, Jeju National, Jeju, South Korea
- 3Department of Geosciences, UiT The Arctic University of Norway, Tromsø, Norway
- 4Marine Geology & Geophysical Exploration Research Center, Korea Institute of Geoscience and Mineral Resources, Daejeon, South Korea
Geophysical and lithological data provide crucial information for the understanding of glacial history in Arctic Svalbard. In this study, we reconstructed the glacier-induced depositional environments of Little Storfjorden and its tributary, Hambergbukta, over the last 13 ka to better understand the glacial history of southeastern Svalbard. The combined uses of swath-bathymetry, high-resolution seismic stratigraphy, and multiple-proxy measurements of sediment cores allowed us to define five steps of glacier-induced depositional environments: 1) deposition of massive, semi-consolidated gravelly sandy mud (Facies 1) during re-advance or still-stand of the marine-based glaciers/ice streams in Little Storfjorden during Younger Dryas (13–12 ka); 2) deposition of massive mud to gravelly sandy mud (Facies 2A and B) during glacial retreat until the earliest Holocene (12–10.1 ka); 3) sediment winnowing by enhanced bottom currents during the early to middle Holocene (10.1–3.7 ka); 4) deposition of bioturbated sandy mud (Facies 3) with high productivity under seasonal sea ice conditions during the late Holocene (3.7–0.7 ka); and 5) deposition of (slightly) bioturbated sandy to gravelly mud (Facies 4) affected by glacier surges since Little Ice Age (LIA) (Facies 4). In addition to seismic stratigraphy, depositional patterns of IRD in Little Storfjorden indicate that the glacier surges in Hambergbukta occurred only after ∼0.7 ka. This suggests that the terminal moraine complex (TMC) represents the maximum extent of the LIA surges, which argues against the recent inference for the TMC formation during pre-LIA. This study shows the importance of multiple parameters to better understand the current behavior of tidewater glaciers in the Svalbard fjords in response to rapid climate change.
1 Introduction
During the Last Glacial Maximum (LGM), the Svalbard-Barents Seas Ice Sheet (SBIS) reached its maximum extent, covering the Svalbard archipelago and the Barents Sea shelf (Figure 1) (Svendsen et al., 2004; Dowdeswell et al., 2010; Hughes et al., 2016; Wiberg et al., 2022). After the LGM, atmospheric warming and the increased inflow of warm Atlantic Water, associated with sea-level rise, triggered the collapse and rapid retreat of the marine-based SBIS (Hughes et al., 2016). As a result, glaciers extending beyond the Svalbard archipelago rapidly retreated into the fjords (Svendsen et al., 1996; Landvik et al., 2005; Jessen et al., 2010; Hughes et al., 2016; Rasmussen and Thomsen, 2021). The retreat was interrupted by several cooling episodes, and regional differences in glacial response among the fjords were observed (Svendsen et al., 1996; Forwick and Vorren, 2009; Rasmussen and Thomsen, 2015; Bartels et al., 2017; Nielsen and Rasmussen, 2018; Allaart et al., 2020; Jang et al., 2021; Rasmussen and Thomsen, 2021). Notably, several cooling episodes in southern Svalbard were characterized by one or two re-advance(s) of an outlet glacier of Storfjorden and the Storfjorden Trough (Nielsen and Rasmussen, 2018; Rasmussen and Thomsen, 2021).
FIGURE 1
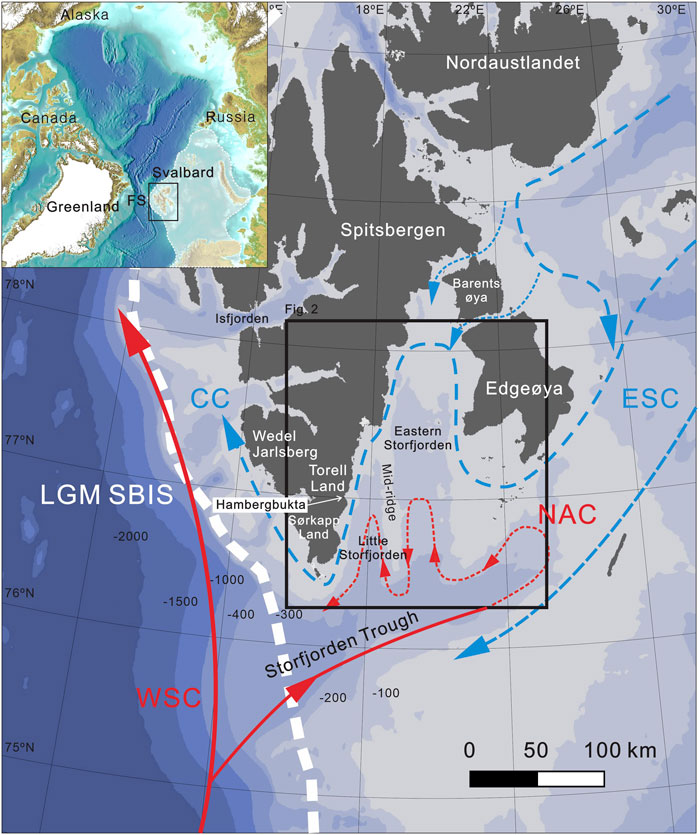
FIGURE 1. Physiographic map of the Arctic Ocean (upper left panel) and Svalbard located east of the Fram Strait (FS). The ocean circulation patterns of the East Spitsbergen Current (ESC)/Coastal Current (CC) and West Spitsbergen Current (WSC)/Norwegian Atlantic Current (NAC) were based on Skogseth et al. (2005). Coinciding with a semi-transparent area in the upper left panel, the white dashed line indicates the Last Glacial Maximum (LGM) extent of the Svalbard-Barents Seas Ice Sheet (SBIS) referred from Hughes et al. (2016).
At the grounding zone of marine-terminating ice sheets or glaciers, ice-proximal submarine landforms, such as grounding zone wedges, ice-proximal fans, and recessional moraines, are deposited during still-stands or re-advances of the ice margin (Powell and Alley, 1997; Lønne, 2001; Batchelor and Dowdeswell, 2015). Hence, identifying these glaciogenic submarine landforms and their formation provides essential information about the behavior of past marine-based glaciers. Several investigations have focused on understanding the glacial dynamics and history during the last deglaciation in the eastern part of Storfjorden (Jessen et al., 2010; Lucchi et al., 2013; Łącka et al., 2015; Nielsen and Rasmussen, 2018; Rasmussen and Thomsen, 2021). Storfjorden is divided by the N–S trending central ridge (Mid-ridge) into western, i.e., Little Storfjorden, and eastern parts, as well as the Storfjorden trough offshore southeastern Svalbard (Figure 1). In eastern Storfjorden, the three NE–SW-oriented grounding zone wedges (G1–G3) indicate that the ice front had larger re-advances or relatively long-lasting still-stands between 15.3 and 11.7 ka, or both (Figure 2A) (Nielsen and Rasmussen, 2018). The integration of geophysical survey data and sediment core records with a robust chronological framework (Rasmussen and Thomsen, 2014; Nielsen and Rasmussen, 2018) suggested that the ice stream/marine-based glacier in eastern Storfjorden advanced southwards at least 20 km during Younger Dryas (YD, 13–12 ka) and retreated rapidly during the YD-Holocene transition (12–11.7 ka). In contrast to the precisely reconstructed glacial history in eastern Storfjorden, the glacial history in Little Storfjorden is still poorly known.
FIGURE 2
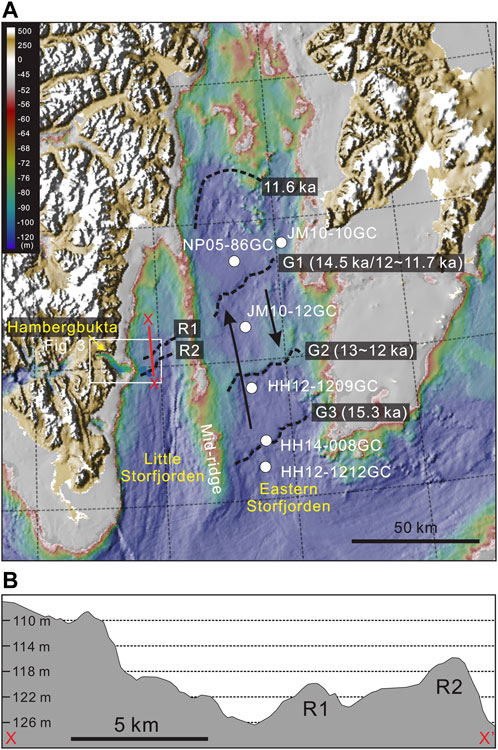
FIGURE 2. (A) Zoom-in on southern Svalbard, including Storfjorden and Hambergbukta. (B) A surface profile extracted from the Arctic Ocean bathymetric map (IBCAO v.4). For the location of the profile, see a red line (X-X′) in panel (A). In panel (A), white circles indicate reference cores from Nielsen and Rasmussen (2018). In Little Storfjorden, two NE-SW-oriented ridges subparallel to each other (R1 and R2) are observed. In the lower panel, the extracted surface profile shows the asymmetric morphology of two ridges.
Little Storfjorden consists of several tributary fjords and bays, including Hambergbukta, located between Torell Land and Sørkapp Land (Figure 1). Hambergbukta has experienced repeated surges of a tidewater glacier (Hambergbreen) since the Little Ice Age (LIA) (Lefauconnier and Hagen, 1991; Pälli et al., 2003; Martín-Moreno et al., 2017). In Hambergbukta, the fjord mouth is characterized by a large submarine morainic ridge (Figure 2). There are two different inferences for the formation of the morainic ridge. Lefauconnier and Hagen (1991) inferred that the morainic ridge at the fjord mouth of Hambergbukta represents the LIA maximum glacier extent. While, Noormets et al. (2021) recently interpreted the morainic ridge as the terminal moraine complex (TMC) based on its morphological feature, which was probably formed by at least two separate surges during the Late Glacial or Holocene. However, no lithological and chronological evidence has been presented to elucidate the precise timing of the formation of the TMC.
To better understand the glacial history of southeastern Svalbard, we aimed to reconstruct the glacier-induced depositional environments in Little Storfjorden and its tributary, Hambergbukta, based on multiple proxy data from sediment cores integrated with swath-bathymetry and high-resolution seismic stratigraphy. In particular, additional use of chronological lithostratigraphy at Little Storfjorden provided the geological evidence to constrain the timing of the deposition of the TMC at the Hambergbukta fjord mouth, more precisely, i.e. Hambergbukta LIA surges, including its maximum extent.
2 Physiography
Storfjorden is an N–S-oriented, funnel-shaped fjord system, located offshore southeastern Spitsbergen, the largest island of the Svalbard archipelago (Figure 1). At the fjord mouth, Storfjorden is connected to the NE–SW-oriented Storfjorden Trough that extends to the shelf break off southwestern Spitsbergen. The fjord is approximately 130 km long, divided by the N–S-oriented ridge called “Mid-ridge” (Nielsen and Rasmussen, 2018) into a wider and longer eastern Storfjorden, as well as a narrower and shorter Little Storfjorden in the west. The crest of the Mid-ridge is deeper than ∼65 m water depth.
Storfjorden’s hydrographic conditions and surface ocean currents are characterized by a wind-driven circulation pattern (Skogseth et al., 2007). Cold and relatively fresh Arctic water enters Storfjorden as the East Spitsbergen Current, and continues as a coastal current along the inner shelf offshore west Spitsbergen (Skogseth et al., 2005; Skogseth et al., 2007) (Figure 1). Warm and relatively saline surface water (Atlantic Water), a branch of the Norwegian Atlantic Current/West Spitsbergen Current, enters the southern Storfjorden Trough (Schauer, 1995). This Atlantic water branch presently flows anticlockwise through eastern Storfjorden into Little Storfjorden and eventually flows out the mouth of the Storfjorden Trough (Figure 1) (Skogseth et al., 2005). Storfjorden is generally covered by sea ice during winter and spring. During sea-ice freezing, resulting from strong north-easterly winds, the salinity of the surface water became denser and saltier, consequently leading to brine rejection to the seafloor. The sinking of dense, brine-enriched surface water entrains ambient water and fills the Storfjorden basin (Skogseth et al., 2013). As the newly produced sea ice drifted away, a coastal polynya in the northern fjord persisted until late winter (Anderson et al., 2004).
The seafloor of Little Storfjorden deepens southward from 40 to 200 m (Figure 2A). In the middle part of Little Storfjorden, two NE–SW-oriented ridges (R1 and R2) are observed (Figure 2B). The height of the northern ridge R1 ranges from 7 to 14 m. R2 is located 3 km south of R1. R2 is also 15 m high and subparallel to R1. In particular, the western part of R2 shows an asymmetric geometry with a gentle inner (stoss) side and a relatively steep outer (lee) side.
Hambergbukta is a curved and west-east-oriented tributary fjord to Little Storfjorden (Figure 2A). It is ∼17 km long and narrows from ∼8 km width at the fjord mouth to ∼1.1 km at the head. Water depth is shallower than 100 m and is bordered by a ∼50 m-high large terminal moraine at the fjord mouth (Figure 3A). The moraine was termed TMC by Noormets et al. (2021). A ∼15 m-high small terminal moraine (T1) (Figure 3C) that coincides with the ice front in 1970 AD divides the fjord basin into an inner and outer part. Various glaciogenic submarine landforms were identified in both basins, indicating repeated surge-type glacier advances and retreats, including crevasse fill ridges on the proximal sides of end moraines (Noormets et al., 2021). In the innermost part of Hambergbukta, the current termini of Hambergbreen and Sykorabreen occur in a combined ice front. Small glaciers, including Kambreen, Bevanbreen, Coryellbreen, and Kanebreen, terminate on land along the southern coast (Figure 3A). The mountains surrounding Hambergbukta are up to 500 m high and are composed of Cretaceous shales, siltstones, and sandstones of the Helvetiafjellet and Carolinefjellet Formations from the Adventalen Group, overlain by Paleocene shales, mudstones, and siltstones of the van Mijenfjorden Group (Figure 3A) (Dallman, 2014).
FIGURE 3
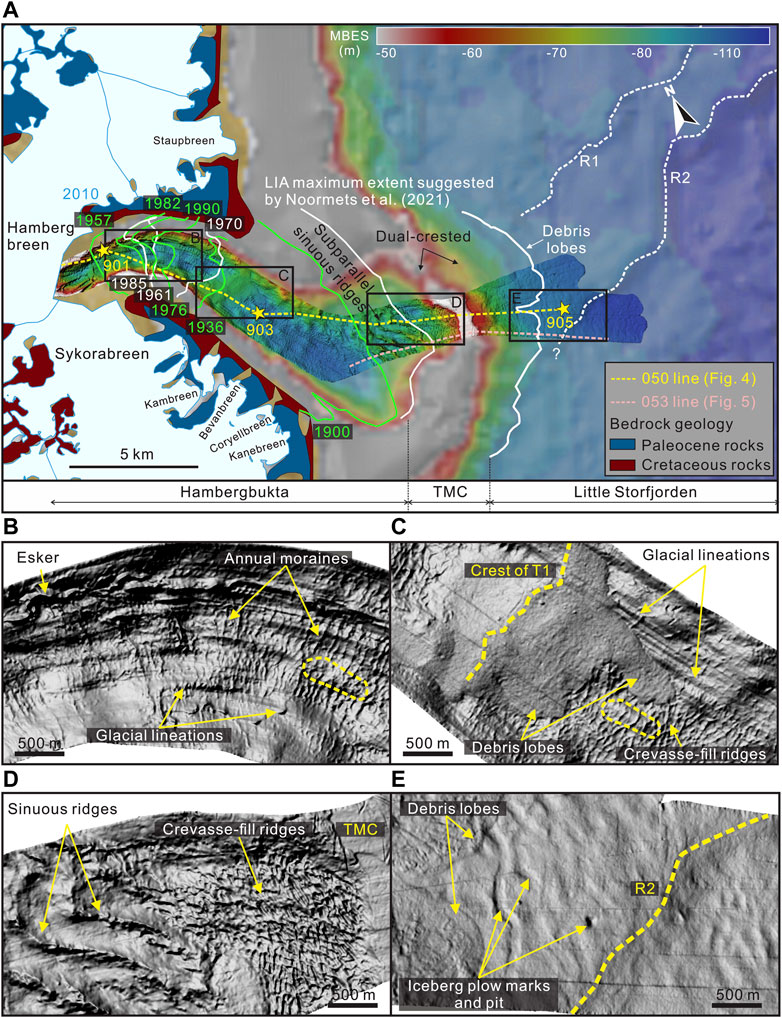
FIGURE 3. (A) Swath-bathymetry of Hambergbukta and its downslope area (Little Storfjorden). Three yellow stars indicate the locations of the studied cores. Yellow and pink dotted lines are sub-bottom profiling (SBP) track lines. For the glacier extent in 2010, we used a shapefile of the 2001–2010 glacier area (König et al., 2013). The glacier fronts between 1900 and 1990 are based on Lefauconnier and Hagen (1991) and Noormets et al. (2021). On the distal side of the terminal moraine complex (TMC), the white solid indicates the extent of debris lobes (referred to Noormets et al., 2021), whereas the dotted lines mark the locations of the NE-SW-oriented ridges (R1 and R2). Bedrock geology surrounding Hambergbukta was referred to Dallmann (2014). Panels (B) to (E) show high-resolution seafloor morphologies. (B) Annual moraine subparallel to the former glacier front. (C) A tongue of the debris lobe extending from the terminal moraine (T1), partly covering former crevasse-fill ridges and glacial lineations. The crest of T1 was referred to Noormets et al. (2021). In panels (B) and (C), yellow dashed circles indicate drumlins. (D) Sinuous ridges and crevasse-fill ridges on the proximal flank of TMC. (E) The downslope area (Little Storfjorden) from the TMC shows the outer part of R2 and iceberg plow marks and pit.
3 Materials and methods
3.1 Bathymetric mapping and seismic profiling
Bathymetric mapping and high-resolution CHIRP sub-bottom profiling (SBP) were performed during the third Korea–Norway joint cruise to Svalbard fjords with RV Helmer Hanssen in the summer of 2019 (HH19). Swath-bathymetry data was acquired with a hull-mounted Kongsberg Maritime EM 302 multi-beam echo sounder (MBES). The MBES data was processed using the Caris HIPS and SIPS 11.0 software at the Korea Institute of Geoscience and Mineral Resources. The processed data were gridded to a resolution of 5 m using the Generic Mapping Tools at Korea Polar Research Institute (KOPRI). They were complemented by the regional bathymetry of the Arctic Ocean (IBCAO v.4; Jakobsson et al., 2020) (Figure 3A). SBP profiles were acquired using a hull-mounted EdgeTech 3300-HM sub-bottom profiler with a 2–12 kHz frequency range during the cruise. The seafloor water depth was determined using SBP, based on a p-wave velocity of 1,500 m/s in the water column.
3.2 Core measurements
Three sediment gravity cores, HH19-901-GC, HH19-903-GC, and HH19-905-GC (hereafter 901, 903, and 905, respectively), were obtained from Hambergbukta and Little Storfjorden using a gravity corer with an inner diameter of 10 cm. Two cores, 901 and 903, were collected from the inner basin (77° 03.151′ N, 17° 03.954′ E in a water depth of 77 m) and outer basin (77° 00.979′ N, 17° 15.813′ E in water depth of 97 m) of Hambergbukta, respectively (Figure 3A). Core 905 was collected from Little Storfjorden, eastward of the mouth of Hambergbukta (76° 59.131′ N, 17° 44.873′ E in a water depth of 112 m).
The wet bulk density (WBD) and magnetic susceptibility (MS) of the sediments were measured at 1 cm steps on the whole core using a Geotek Multi-Sensor Core Logger at UiT The Arctic University of Norway in Tromsø. Line-scan images were acquired on split-half cores using the Avaatech X-ray fluorescence (XRF) core scanner with a Jai L-107CC 3CCD RGB line-scan camera. Sediment elemental composition was measured at 1 cm intervals with an Avaatech XRF core scanner using the following settings: 1) 10 kV, 1,000 μA, 10 s counting time, no filter, and 2) 30 kV, 1,000 uA, 10 s counting time, Pd-thick filter. In this study, we used Zr/Rb and Ca/Sr ratios to present continuous records reflecting changes in grain size (Dypvik and Harris, 2001; Rothwell, 2015; Zuchuat et al., 2020) and to determine detrital carbonate (Hodell et al., 2008), respectively. X-radiographs were acquired on split cores using a Geotek Standard X-ray CT System at UiT.
The grain size was analyzed using about 130 mg of freeze-dried bulk sediments. Before the analysis, all samples were treated with 35% H2O2 for 24 h to decompose organic matter. After subsequent rinsing with deionized water, the sediment samples were treated with an ultrasonic vibrator to facilitate particle disaggregation before analysis. The measurements were conducted with a Malvern Mastersizer 3000 laser diffraction particle size analyzer at KOPRI. The content of coarse particles (>63 µm) was additionally measured by wet sieving using 1–2 g of bulk sediments from the same sampling depths.
Measurements of the total organic carbon (TOC) content and carbon isotope of organic matter (δ13Corg) were performed on powdered samples treated with hydrochloric acid for 24 h to remove inorganic carbonate. The analytical precision of the organic carbon data was within 0.2‰. Organic nitrogen (Norg) was measured on powdered bulk sediments treated with a KOBr-KOH solution to separate inorganic and organic nitrogen fractions (Silva and Bremner, 1966). The content of Norg was calculated by subtracting inorganic nitrogen (Ninorg) from total nitrogen determined using bulk sediments. TOC, δ13Corg, and Ninorg were measured with a Thermo Delta V Isotope Ratio Mass Spectrometer connected to a Thermo Flash 2000 CHNS/OH Elemental Analyzer at KOPRI. The measurement process was conducted based on Joo et al. (2019).
For 14C dating, we collected both intact and fragmented marine mollusk shells (Table 1). The accelerator mass spectroscopy (AMS) 14C analyses were performed at the Beta Analytic Laboratory in Miami, Florida, the United States, and the MICADAS laboratory, Marine Geochemistry, Alfred Wegener Institute, Helmholtz Centre for Polar and Marine Research, Bremerhaven, Germany. To calibrate all 14C dates, we used the Calib 8.1.0 program (Stuiver and Reimer, 1993) with the Marine 20 calibration curve (Heaton et al., 2020). Age data were converted to calendar years, applying a regional reservoir age difference (ΔR) of −61 ± 37 after Pieńkowski et al. (2021). Median values of the calibrated ages (±2σ) were used to determine the age-depth model of the HH19 cores (Table 1). The age-depth relationship was constrained by Bayesian modeling in the BACON program (v. 2.2; Blaauw and Christen, 2011). We applied the same parameter settings in Jang et al. (2021) for the BACON modeling. The age model between ours and other cores in the eastern Storfjorden was compared (see Figure 2 for core locations; Rasmussen and Thomsen, 2014; Nielsen and Rasmussen, 2018). The updated calibration curve and new reservoir age were applied to all cores no substantial differences were observed (Supplementary Figure S1).
TABLE 1
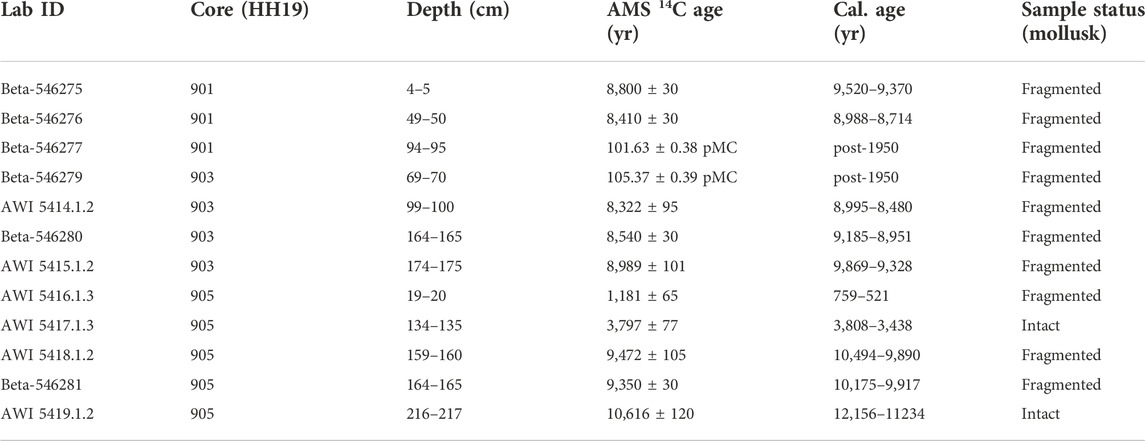
TABLE 1. AMS 14C dates and calibrated dates for the studied cores.
4 Results
4.1 Glaciogenic submarine landforms
4.1.1 Geomorphology
Most of the geophysical survey area (especially the Hambergbukta fjord basin) investigated in this study overlaps with Noormets et al. (2021). In Hambergbukta, a detailed description and interpretation of submarine landforms, including the terminal moraine complex (TMC), were conducted by Noormets et al. (2021). This study provides new morphological data on the downslope area (Little Storfjorden) from the TMC and associated debris lobes at the fjord mouth of Hambergbukta (Figures 3A,E). Therefore, in this section, we briefly describe the glaciogenic submarine landforms in Hambergbukta and then introduce the new morphological features in the downslope area of the TMC.
4.1.1.1 Submarine landforms in the Hambergbukta
A small terminal moraine (T1) was observed in the middle part of the fjord basin (Figure 3C), which corresponds to the maximum extent of a tidewater glacier during the last surge (1961–1970 AD). T1, interpreted as a mid-fjord end moraine (Noormets et al., 2021), divides the fjord into the inner and outer basins. Streamlined glacial lineations and drumlins, oriented parallel to former ice flow, are recognized in parts of both sub-basins (Figures 3B,C). Rhombohedral small ridges (Figures 3C,D), interpreted as crevasse-fill or -squeeze ridges in Noormets et al. (2021), are abundant in the outer basin, overlying the glacial lineations and drumlins (Figure 3C). Towards the fjord head in the inner basin, the small ridges become more sub-parallel and perpendicular to the fjord axis (Figure 3B). They were interpreted as annual (push) moraines by Noormets et al. (2021). On the distal slope of T1, debris lobes were identified, which partly cover the former crevasse-fill ridges in the outer basin (Figure 3C). Towards the fjord mouth, sinuous submarine ridges up to approximately 25 m in height were observed (Figures 3A,D). Most of these ridges are subparallel and show symmetrical cross-sections with very sharp crests (Figure 4). In the southern part, crevasse-fill ridges are also recognized among the subparallel sinuous ridges (see Figure 7 in Noormets et al., 2021).
FIGURE 4
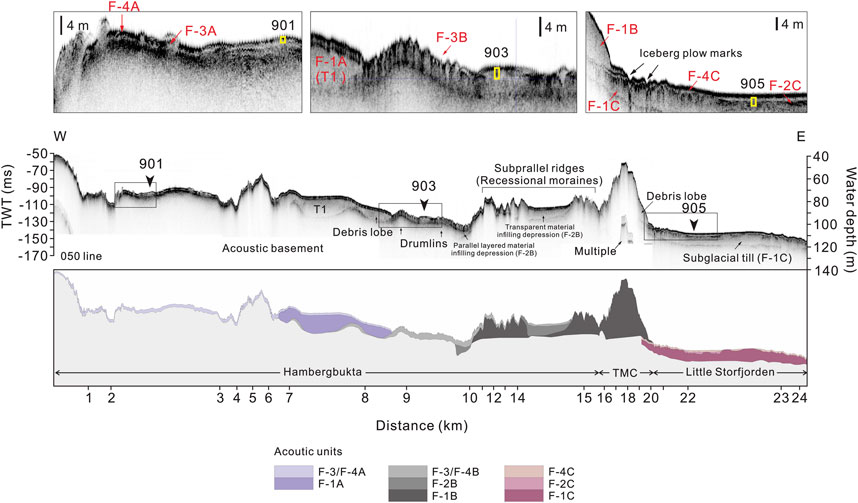
FIGURE 4. Acoustic units (F-1 to F-4) defined in an SBP 050 line. Yellow boxes in panel (A) show the penetration depths for the studied cores. For the locations of gravity cores, see Figure 3A.
4.1.1.2 Terminal moraine complex
A large terminal moraine with a height of up to 50 m is located at the mouth of Hambergbukta (Figures 3, 5). The northern part of the moraine partly shows a dual-crested morphology with a patch of crevasse-fill or -squeeze ridges (Figure 3A) (see Figure 3 in Noormets et al., 2021). Considering this morphological complexity, Noormets et al. (2021) termed it a terminal moraine complex (TMC), a term we adapt here. The distal slope of the TMC is characterized by multiple debris lobes showing hummocky surface topography (Figure 3E). However, reflections potentially identifying slip planes between the TMC and associated debris lobes are absent from SBP data (Figure 5).
FIGURE 5
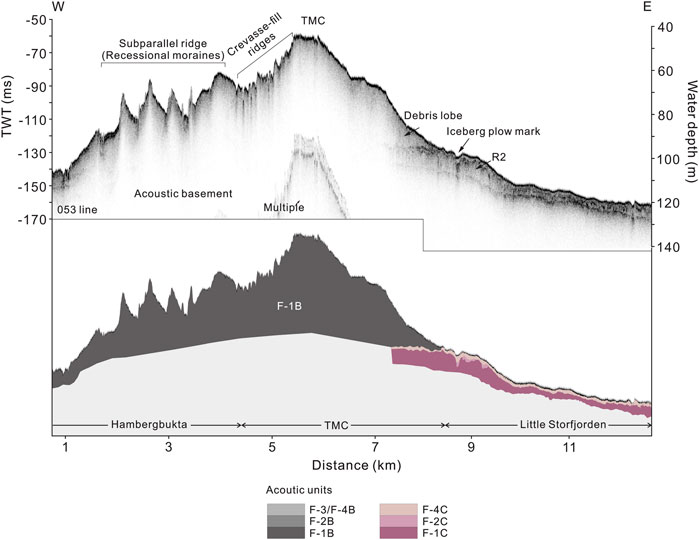
FIGURE 5. SBP profile (053 line) at the mouth of Hambergbukta showing a grounding zone wedge below the TMC and the associated debris lobe.
4.1.1.3 Submarine landforms in Little Storfjorden
A NE–SW striking ridge R2 in Little Storfjorden was identified on our swath-bathymetry (Figure 3E) and SBP (053 line) data (Figure 5). The southernmost part of R2 is located 3–5 km east of the crest of the TMC (Figure 3A). In the downslope area from the TMC and associated debris lobes, the outer part of R2 was recognized as a 12 m-thick acoustically semi-transparent sediment wedge, with a slope of 0.7° dipping eastward (Figure 5). Between the TMC and R2 at about 100 m water depth, the seafloor is relatively smooth without crevasse-fill ridges but is partially scarred by iceberg plow marks and pits about 2 m deep and 100 m wide (Figure 3E). Including these iceberg scours, the sediment wedge (R2) is covered by an acoustically uniform sediment layer of 1–2 m in thickness (Figure 5). Similar to the distal flank of the T1, several debris lobes extending outwards were also observed on the distal slope of the TMC (Figure 3E).
4.1.2 Seismic stratigraphy
High-resolution sub-bottom profiler data from the Hambergbukta fjord head to Little Storfjorden showed variable acoustic characteristics (Figures 4, 5). Previously, Noormets et al. (2021) defined the sub-bottom data in Hambergbukta as five acoustic units (F-1A, F-1 to F-4) primarily based on their acoustic structure. In Little Storfjorden, we found similar acoustic structures, including a new subglacial till located below the previously defined till units (F-1A and F-1). In this study, acoustic units were reorganized into A, B, and C groups in chronological order to identify each subglacial till unit as the different ice-grounding events. (Table 2).
TABLE 2
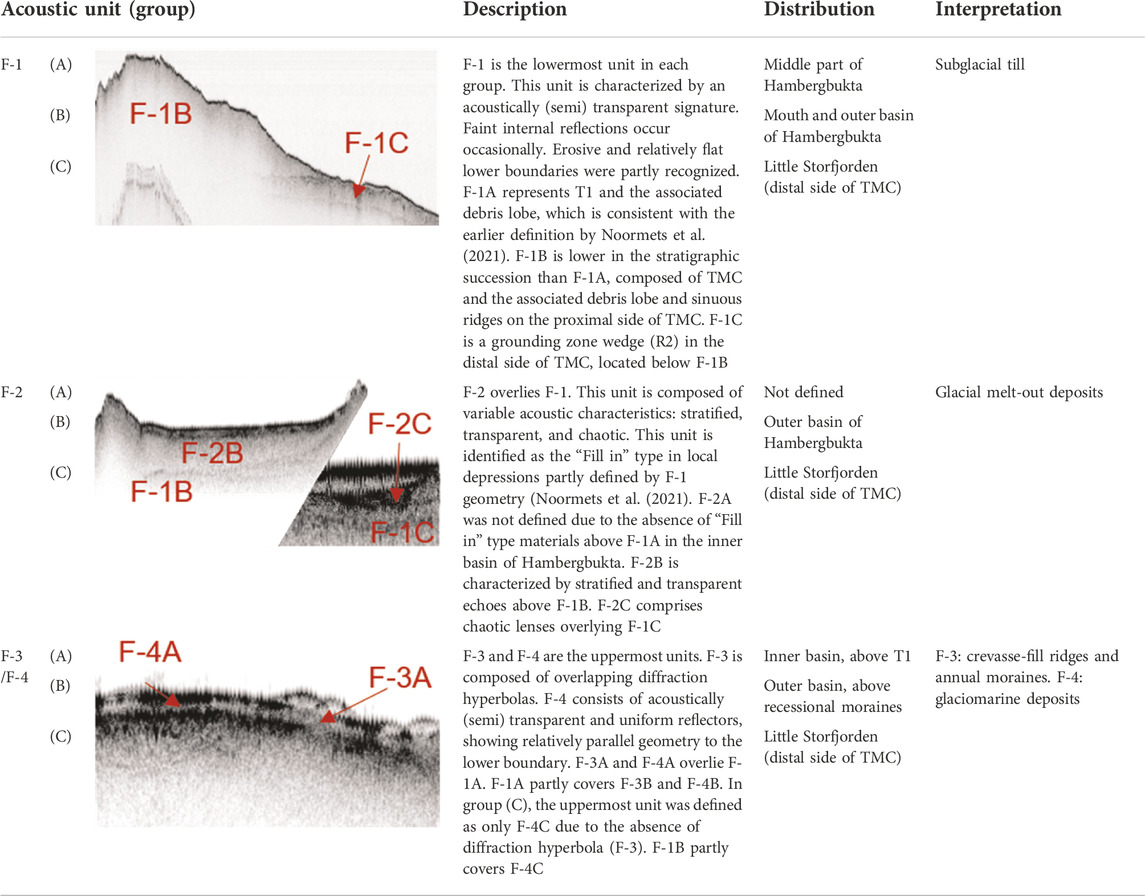
TABLE 2. Acoustic units categorized into three groups (A–C). See Figures 4, 5 for the regional distribution of the units.
4.1.2.1 Group (A)
The acoustic units of Group (A) were distributed in the inner basin of Hambergbukta (Figure 4). In Group (A), the lowermost unit (F-1A) was composed of the terminal moraine T1 and associated debris lobes (Figure 4), which is consistent with the earlier definition by Noormets et al. (2021). Above F-1A, a sediment layer was composed of F-3A and F-4A. F-3A is characterized by acoustic hyperbolas coinciding with crevasse-fill ridges and annual moraines (Figure 4). F-4A consists of a semi-transparent acoustic unit deposited parallel to its lower boundary, interpreted as glaciomarine deposits by Noormets et al. (2021).
4.1.2.2 Group (B)
At the proximal slope of T1, a debris lobe (F-1A) partly covers crevasse-fill ridges in the outer basin (Figure 4). The acoustic units below F-1A are assigned to Group (B) based on this stratigraphic relation. F-1B is composed of the TMC, associated debris lobes, and sub-parallel sinuous ridges in the distal side of TMC (Figures 4, 5), defined as “F-1” in Noormets et al. (2021). In this study, between the sinuous ridges and T1, hummocky morphologies, interpreted as drumlins (Noormets et al., 2021), were defined as the acoustic basement (Figure 4). F-2B is identified as the “Fill in” type in local depressions partly observed by F-1B geometry (Figure 4). The unit is characterized by acoustically stratified and transparent reflection patterns in the outer basin, interpreted as melt-out deposits of older, pre-surge, glaciomarine, and/or marine sediments (Noormets et al., 2021). As the uppermost unit of Group (B), F-3B, featuring the crevasse-fill ridges, prevails in the outer basin, whereas F-4B is mainly observed in the seafloor of local depressions between sinuous ridges in the proximal side of TMC.
4.1.2.3 Group (C)
This group is distributed on the distal side of TMC (Little Storfjorden) and stratigraphically below Group (B). Group (C) is composed of F-1C, F-2C, and F-4C. F-1C is a buried sediment wedge or subglacial till deposit corresponding to a NE-SW striking ridge R2 in Little Storfjorden (Figures 3, 5). F-2C is characterized by chaotic lenses (Table 2) between F-1C and F-4C (Figure 5). In this region, the uppermost unit is defined as only F-4C due to the absence of diffraction hyperbolas coinciding with crevasse-fill ridges or annual moraines.
4.2 Sediment cores
The sediment gravity cores 901 and 903 from Hambergbukta contain parts of the uppermost acoustic units (F-4A and F-4B, respectively) (Figure 4). They comprise olive-colored, stratified sediments with dark mottles (Figures 6A,B). In Little Storfjorden, on the other hand, 905 contains the top of a buried subglacial till deposit (F-1C) (Figure 4). It revealed distinct lithological changes in the overlying sediments (Figure 7). We defined five lithofacies based on sediment texture, structure, physical properties, and Zr/Rb and Ca/Sr ratios (For a summary of lithofacies, see Table 3). Whereas Facies 1–4 were identified in the core from Little Storfjorden, the cores from Hambergbukta are entirely composed of facies 5.
FIGURE 6
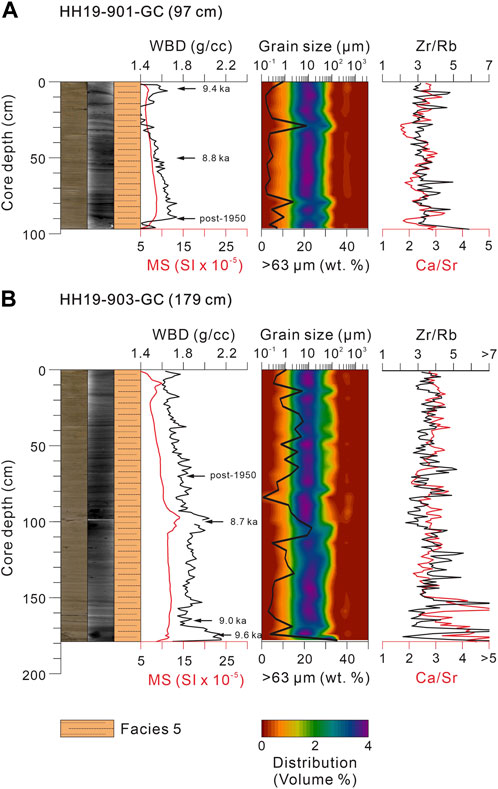
FIGURE 6. Lithological characteristics of two cores 901 (A) and 903 (B) from the fjord basin of Hambergbukta: Split surface and X-radiography images, lithofacies, wet bulk density (WBD), magnetic susceptibility (MS), calibrated 14C ages, grain size distributions, coarse particle contents (>63 μm), and XRF elemental geochemistry (Zr/Rb and Ca/Sr ratios).
FIGURE 7
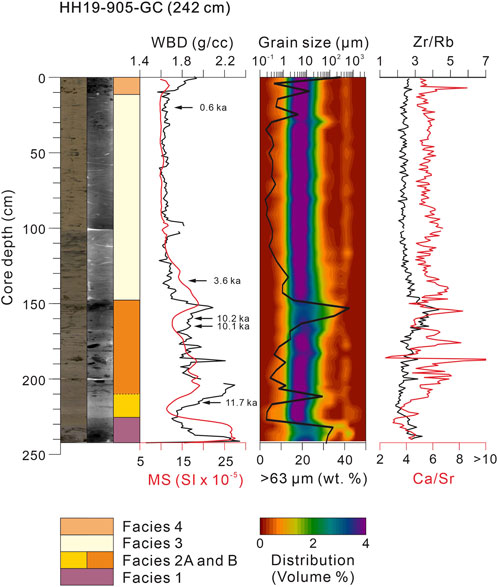
FIGURE 7. Lithological characteristics of core 905 from Little Storfjorden.
TABLE 3
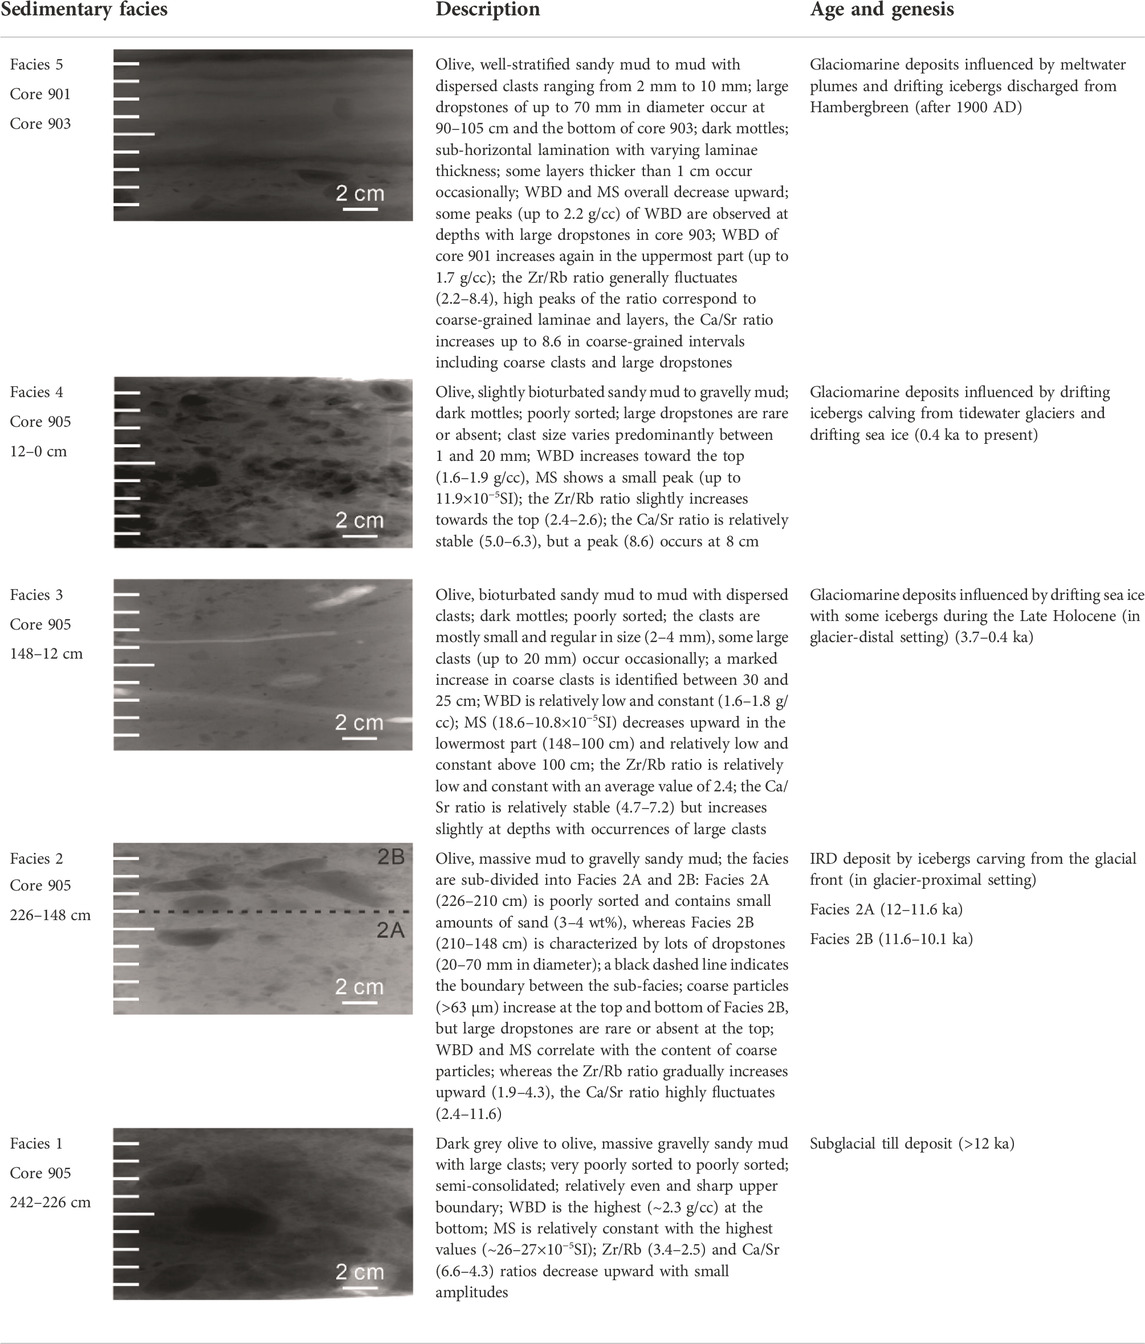
TABLE 3. Lithofacies defined in the studied sediment cores. The darker intervals in X-radiographs reflect denser materials. See Figures 6, 7 for the stratigraphic distribution of lithofacies.
Facies 1 occurs below 226 cm in core 905 (Figure 7). It consists of a dark grey olive to olive massive gravelly sandy mud with a high content (∼30 wt%) of coarse particles (>63 μm). Its upper boundary is sharp and relatively even, with a striking lithological change. In this facies, the wet bulk density (WBD) is the highest (∼2.3 g/cc) at the bottom, decreasing abruptly above 237 cm core depth. On the other hand, the magnetic susceptibility (MS) is relatively constant with the highest values (∼26–27×10–5 SI) and drops abruptly at the upper boundary. Zr/Rb and Ca/Sr ratios decrease upward with small amplitudes (Figure 7). The massive diamicton Facies 1 is similar to the lowermost unit (till) of the previously investigated sediment cores in Hambergbukta (HH13-23 and HH13-21; Noormets et al., 2021), which is interpreted as a subglacial till (Forwick and Vorren, 2009; Nielsen and Rasmussen, 2018).
Facies 2 is olive-colored and massive, subdivided into Facies 2A (226–210 cm) and 2B (210–148 cm). Facies 2A comprises mainly fine-grained mud with small amounts of sand (3–4 wt%), whereas numerous dropstones (20–70 mm in diameter) characterize Facies 2B (Figure 7). The high content of coarse particles (>63 μm) occurs at the bottom and top of Facies 2B. However, large dropstones are rare or absent at the top. The upper boundary is uneven, identified by a significant lithological change. WBD and MS increase at the transition from Facies 2A to 2B. In Facies 2B, WBD and MS fluctuate, generally decreasing upcore but increasing again at the top. The Zr/Rb ratio gradually increases toward the top, whereas the Ca/Sr ratio highly fluctuates. Above the subglacial till, the deposition of a massive, finer-grained Facies 2A might reflect a slow retreat, a relatively stagnant ice front, or a setting in which iceberg drifting was suppressed due to perennial sea ice cover (Łącka et al., 2015). Also, it may reflect the cold sea water condition where drifting icebergs did not melt and released their debris (Forwick and Vorren, 2009). In Facies 2B, the occurrences of numerous dropstones suggest the enhanced deposition of iceberg-rafted debris (IRD) (Gilbert, 1990). Corresponding to the prominent deposit of dropstones, strong fluctuations of Ca/Sr reflect depositional variability of detrital carbonates transported by drifting icebergs. A gradual increase of Zr/Rb indicates an increase in coarse-grained siliciclastic sediments due to enhanced sediment winnowing by strong bottom currents (Gilbert et al., 1998).
Facies 3 consists of olive-colored, bioturbated mud to sandy mud (148–12 cm). With some large clasts (up to 20 mm in diameter), relatively smaller clasts (2–4 mm) are dispersed. The content of coarse particles (>63 μm) increased around the facies boundaries (Figure 6). In particular, the high peak of coarse particles in the upper part corresponds to the notable increase in IRD at 30–25 cm (Figure 7). At the boundary between Facies 2 and 3, WBD decreases abruptly, while the MS gradually decreases upcore (148–100 cm). In Facies 3, WBD and MS are generally low and constant, but a small peak of WBD was observed around 100 cm core depth. The Zr/Rb ratio is relatively stable, around an average value of 2.4. The Ca/Sr ratio is relatively stable but slightly increases with occurrences of the large clasts. Abundant bioturbation in Facies 3 represents a glacier-distal glaciomarine environment with favorable living conditions for benthic organisms (Forwick and Vorren, 2009; Lucchi et al., 2013; Nielsen and Rasmussen, 2018). In Facies 3, regular and small clasts can reflect the influence of sea ice-rafted debris (Gilbert, 1990). Also, the occurrence of some large clasts might indicate iceberg-rafted debris originated from the tidewater glaciers in the tributary fjords of Little Storfjorden.
Facies 4 (12–0 cm) is olive-colored, slightly bioturbated sandy to gravelly mud with a high content (up to 39%) of coarse particles (>63 μm). Large dropstones are rare or absent. However, the facies is characterized by many clasts varying in size (1–20 mm). WBD increases towards the core top, whereas MS shows a small peak. At the core top, a decrease in MS may be related to the amount of air resulting from the measurements with a loop sensor. The values of Zr/Rb slightly increase towards the top. The Ca/Sr ratio is relatively stable, but a high ratio peak is observed at 8 cm. In Facies 4, the increase in various-sized clasts indicates that Little Storfjorden has been continuously influenced by drifting icebergs and sea ice (Gilbert, 1990).
Facies 5 is characterized by olive-colored, well-stratified sandy mud to mud with dispersed clasts, observed in two cores, 901 and 903 (Figures 6A,B). Large dropstones of up to 7 cm in diameter are identified at 90–105 cm, and the bottom of core 903 (Figure 6B). The content of coarse particles (>63 μm) ranges from 2 to 35 wt%. Stratification occurs predominantly in the form of sub-horizontal lamination with irregular laminae thickness. However, some layers thicker than 1 cm occur occasionally. In core 901, WBD and MS decrease upward but increase in the uppermost part (15–0 cm). In core 903, WBD and MS show similar trends with core 901. However, WBD increases corresponding to the occurrences of large dropstones in core 903. The Zr/Rb ratio strongly fluctuates in Facies 5. In particular, high peaks of Zr/Rb are well-matched with coarse-grained laminae and/or layers (Figures 6A,B). In core 901, the Ca/Sr ratio increases in coarse-grained intervals in which coarse clasts are deposited. However, the ratio in core 903 highly fluctuates in the lowermost part. Composed of Facies 5, cores 901 and 903 correspond to the upper unit that comprises mud with occasional outsized clasts and sandy layers of the Hambergbukta cores defined by Noormets et al. (2021). In particular, well-pronounced stratification and some clasts in Facies 5 are suggested to reflect recent glacial fluctuations, including the LIA surge in Hambergbukta (Lefauconnier and Hagen, 1991; Ziaja and Ostafin, 2015; Noormets et al., 2021). The difference in Zr/Rb and Ca/Sr variations indicates different transport mechanisms. Many peaks of the Zr/Rb ratio coincide with coarse-grained laminae and layers, reflecting the deposition of siliciclastic sediments by meltwater plumes discharged repeatedly from the tidewater glacier (Hambergbreen) during the recent glacial fluctuations in Hambergbukta. On the other hand, an increase of the Ca/Sr ratio, related to the occurrences of coarse clasts, including dropstones, would be caused mainly by detrital carbonate deposition by drifting ices calved from Hambergbreen.
4.3 Chronostratigraphy and sedimentation rates
For the studied cores, AMS 14C dates and converted calendar ages are summarized in Table 1. To constrain the age-depth modeling in a BACON program, we used four ages in core 905. An age point of 160–159 cm, showing a slight reversal, was excluded from the modeling.
Based on the weighted mean values extracted by the BACON modeling, the bottom age of core 905 was calculated to be 12.4 ka (Figure 8). Changes in the overall sedimentation rates of core 905 are similar to those of core HH12-1209 from a nearby site in eastern Storfjorden (Rasmussen and Thomsen, 2014) (Figure 8). According to the age model, the massive diamicton Facies 1 was deposited before 12.0 ka. Facies 2A was constrained to 12.0–11.6 ka. Except for the very low sedimentation zone (∼5.5 cm/kyr) between 10.1 ka and 3.7 ka, Facies 2B can be constrained to 11.6–10.1 ka. Between 12.0 ka and 10.1 ka, an average sedimentation rate is ∼32.6 cm/kyr. Facies 3 was deposited after 3.7 ka with an average sedimentation rate of 37.5 cm/kyr. In Facies 3, an abrupt increase in large clasts is identified in the interval from 0.9 ka to 0.7 ka (at 30–25 cm core depth). Facies 4 was deposited after 0.4 ka with an average sedimentation rate of 31.6 cm/kyr.
FIGURE 8
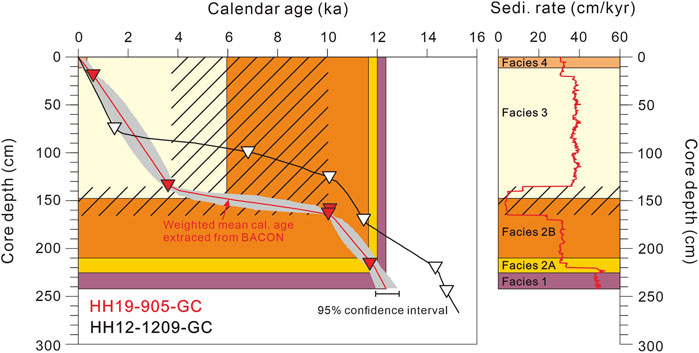
FIGURE 8. Comparison of sedimentation rates between Little Storfjorden (core 905) and eastern Storfjorden (HH12-1209-GC) based on the age model applying to the Marine 20 dataset (Heaton et al., 2020) and a regional reservoir age difference (ΔR) of −61 ± 37 (Pieńkowski et al., 2021). The age-depth relationship was calculated using a BACON program. A dashed area indicates a zone of very low sedimentation rates in core 905.
Based on the occurrences of the materials younger than 1950 AD (Figures 7A,B), two cores, 901 and 903, are at least younger than 1950 AD. Although significantly old materials were identified in both cores, these were interpreted as reworked materials by sediment mixing and re-deposition after the LIA in Hambergbukta (Noormets et al., 2021). Assuming that the bottom age of core 901 is 1950 AD or younger, the minimum sedimentation rate in the Hambergbukta fjord basin can be calculated as higher than 1 cm per year, which is considerably higher than in core 905.
4.4 Organic geochemistry
In cores 901 and 903 (Hambergbukta), the total organic carbon (TOC) slightly fluctuates around average values of 1.28% and 1.24%, respectively (Figure 9). The carbon isotope of organic matter (δ13Corg) is relatively constant with an average value of approximately −24.9‰ in both cores. Organic nitrogen (Norg) is relatively low, ranging from 0.01 to 0.03%. Overall, the TOC/Norg ratio is higher than 20. The ratio significantly increases below 50 cm core depth in both cores due to deficient organic nitrogen of 0.01%.
FIGURE 9
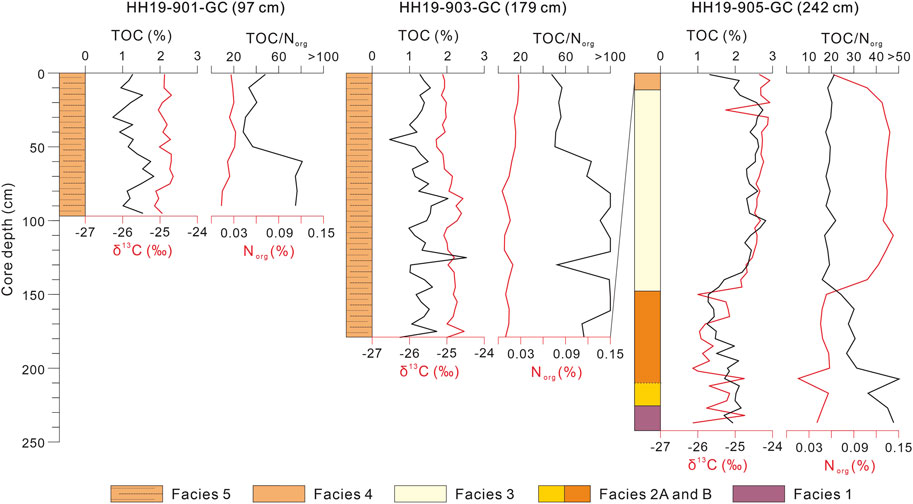
FIGURE 9. Downcore distribution of organic carbon isotope values (δ13C), TOC, TOC/Norg, and Norg.
In core 905 (Little Storfjorden), variations in TOC and δ13Corg correspond to lithofacies changes (Figure 9). As lithofacies changes from Facies 1–2A, TOC values slightly increase. Then, TOC decreases (up to 1.27%) toward the top of Facies 2B. Whereas δ13Corg values abruptly decrease in the lower part of Facies 2B and increase in the upper part (Figure 9). An increase in the two parameters characterizes a transition between Facies 2B and 3. The TOC remains high in Facies 3 but decreases to 1.32% in Facies 4. Overall, δ13Corg values are higher than -25% in Facies 3 and 4. However, an abrupt decrease in δ13Corg is observed in the interval where large clasts increase. The content of Norg in core 905 ranges from 0.04 to 0.14%. From Facies 1 to 2, the TOC/Norg ratio generally decreases (47.64–24.18). However, the ratio is significantly increased up to 109.03 at the boundary between Facies 2A to 2B (Figure 9). Above Facies 2, the decreased TOC/Norg ratio remains constant, with an average value of 19.23.
5 Discussion
5.1 Age constraints of the seismostratigraphy
The seismic character correlates well with lithological changes in core 905 (Figure 10). The massive diamicton Facies 1 corresponds to the top of F-1C. Considering the maximum age (∼12 ka) of Facies 1, F-1C was probably deposited from the Younger Dryas (YD). Therefore, the NE–SW-oriented ridge R2 possibly indicates the maximum extent of the marine-based glacier in the Little Storfjorden during YD, which is closely related to the deposition (13–12 ka) of the middle grounding zone wedge G2 in eastern Storfjorden (Nielsen and Rasmussen, 2018). Corresponding to Facies 2A and 2B, deposited mainly by icebergs, F-2C is constrained to the YD-Holocene transition (12–11.7 ka) and parts of the early Holocene (11.7–10.1 ka). The surface reflector of F-2C also includes the middle Holocene following the late phase of the early Holocene (10.1–3.7 ka), characterized by very low sedimentation rates (Figure 8). The acoustically uniform and transparent unit F-4C reflects relatively fine-grained and bioturbated Facies 3 with dispersed clasts, representing the late Holocene. The strong surficial reflector of F-4C presumably includes the Facies 4 and uppermost parts of Facies 3, which might have been deposited since approximately 1 ka.
FIGURE 10
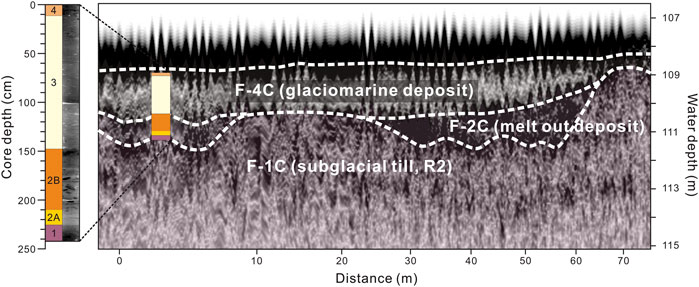
FIGURE 10. Correlation of the acoustic units with lithofacies of core 905 from Little Storfjorden.
Figure 5 shows that the debris lobe extending from the TMC (F-1B) overlies F-4C. This stratigraphic relation indicates that the TMC and the associated debris lobe were formed during the latest Holocene, possibly related to a glacial advance (or surge) during the LIA. Alternatively, F-1B might also correlate with the upper part of F-4C, implying that the TMC formed older than the LIA. The former case is consistent with the suggestion by Lefauconnier and Hagen (1991). The latter case can be related to the recent estimation by Noormets et al. (2021). The timing of the TMC formation will be discussed further in chapter 5.3. F-2B, F-3B, and F-4B in the proximal side of TMC are defined as deglacial sediments deposited after 1900 AD, corresponding to the 1970 glacier front (Figure 3A). The development of T1 and associated debris lobes (F-1A) indicates that F-3A and F-4A have been deposited after the last surge event (1961–1970 AD).
5.2 Glacial history and depositional environments
5.2.1 Younger Dryas cold period
The NE–SW-oriented ridge R2 represents the position of the YD glacier front in Little Storfjorden (Figure 11A), which corresponds to the massive diamicton (Facies 1) in core 905 (Figure 7). In particular, the asymmetric cross section (Figure 2B) of R2 is similar to the ramp-like morphology of the grounding zone wedges (G1–G3) formed during larger glacier re-advances and/or relatively long-lasting still-stands between 15.3 and 11.7 ka in eastern Storfjorden (Nielsen and Rasmussen, 2018). Based on these morphological features and sediment core records, we interpret R2 as a grounding zone wedge.
FIGURE 11
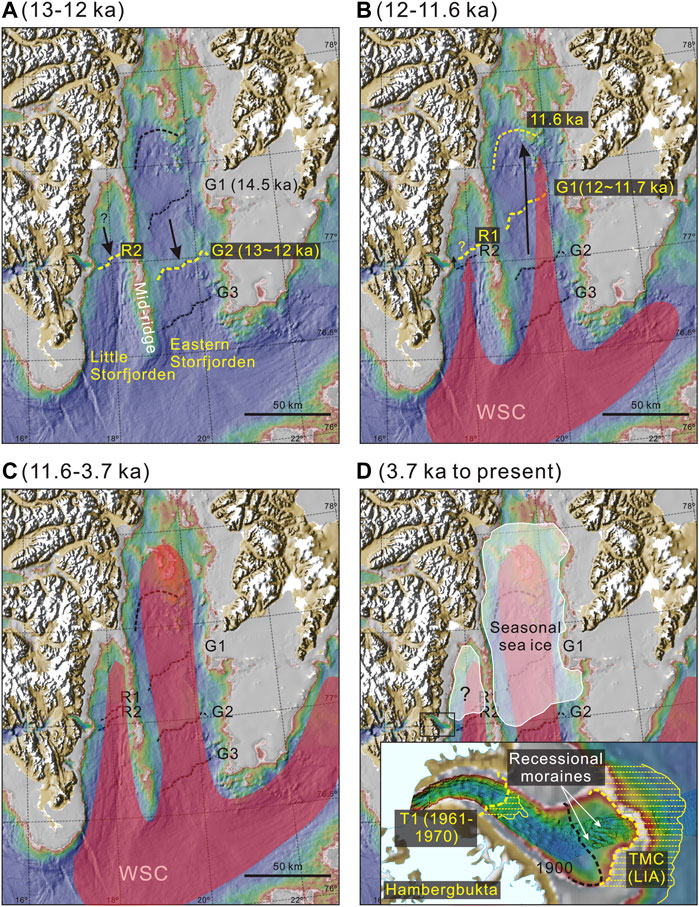
FIGURE 11. Reconstruction of glacial history in the Hambergbukta and Little Storfjoden since the Younger Dryas: (A) Younger Dryas stadial period (13–12 ka), (B) Younger Dryas to Holocene transition (12–11.6 ka), (C) the early to middle Holocene (11.6–3.7 ka), and (D) the late Holocene including the Little Ice Age glaciation in Hambergbukta. The extent of seasonal sea ice in panel (D) was inferred based on sediment core records from Rasmussen and Thomsen (2015). Black dotted lines indicate grounding zone wedges including G1–G3. With the black arrows indicating ice flow directions, yellow dotted lines indicate temporal variations in the front of the marine-based glaciers in Storfjorden combined with the previous reconstruction (Nielsen and Rasmussen, 2018).
The YD cold period is characterized by dramatic cooling based on Greenland ice core δ18O-temperature reconstructions (Liu et al., 2012). This cooling event was recognized by the advances of ice streams in the northwestern, western, and southwestern portions of the Laurentide Ice Sheet (e.g., Margold et al., 2018) and local glaciers in north Greenland (Larsen et al., 2016). In several fjords of northwestern Svalbard, evidence of significant advances by marine-based and/or tidewater glaciers remains absent (Bartels et al., 2017). However, the possibility of glacier re-advance has been suggested (Allaart et al., 2020; Jang et al., 2021). In western Svalbard, the previous reconstruction and the compiled data sets in Isfjorden may indicate a re-advance of tidewater glaciers during this period (Svendsen et al., 1996; Forwick and Vorren, 2009). Compared to northwestern and western Svalbard, a prominent re-advance of a marine-based glacier was identified in eastern Storfjorden in southeastern Svalbard during the YD period (Nielsen and Rasmussen, 2018; Rasmussen and Thomsen, 2021). Nielsen and Rasmussen (2018) inferred that the ice-proximal fan buried beneath G1 (Figure 11A) was possibly deposited during the Allerød interstadial (14.5 ka), and an ice stream/marine-based glacier that advanced southerly during YD (13–12 ka) led to the formation of G2. This scenario could explain the high sedimentation rates of coarse material in this period observed in two cores (HH12-1209 GC and HH12-1212 GC) from the distal side of G2 (Figure 2A). Formation of R2 and G2 suggests that the marine-based glaciers in both western and eastern parts of Storfjorden expanded southwards to around 77°N during YD (Figure 11A) although we cannot determine how far the ice stream of Little Storfjorden had retreated during the Allerød interstadial due to the limited survey area to the vicinity of Hambergbukta.
5.2.2 Younger Dryas-Holocene transition and earliest holocene
In core 905, lithological change from Facies 1 to Facies 2 suggests sediment deposition in an ice-proximal setting after YD (Figure 7; Table 3). Compared with Facies 2B, the fine-grained Facies 2A deposited during the YD-Holocene transition (12–11.6 ka), indicates that the glacier likely retreated slowly, or the iceberg drifting was suppressed due to perennial sea ice cover (Łącka et al., 2015). Whereas, in eastern Storfjorden, a massive intrusion of warm Atlantic Water caused rapid glacier retreat of 20 km during this period (Rasmussen and Thomsen, 2014; Nielsen and Rasmussen, 2018), characterized by an increase in IRD and the formation of the inner grounding zone wedge G1 (Figure 11B). Based on the different lithological characters between Little Storfjorden and eastern Storfjorden, we infer that the glacier retreat in Little Storfjorden was significantly slower in contrast to the glacier retreated rapidly in eastern Storfjorden (Figure 11B). This retreat pattern is consistent with a previous interpretation (Nielsen and Rasmussen, 2018). The Mid-ridge dividing Storfjorden into western (Little) and eastern parts would have played an essential role in the slow retreat of the Little Storfjorden glacier (Nielsen and Rasmussen, 2018). As the glacier retreat of eastern Storfjorden progressed, the intrusion of Atlantic Water might have gradually expanded to Little Storfjorden, resulting in a relatively weak melting of marine-based glaciers and/or drifting icebergs in Little Storfjorden. Based on this, we infer that the inner ridge (R1) might locate the position of the Little Storfjorden glacier during the YD-Holocene transition (Figure 11B). Further investigations in the inner (northern) part of Little Storfjorden are needed to verify the retreat pattern. At a boundary between Facies 2A and 2B (Figure 9), an abrupt increase of the TOC/Norg ratio indicates a significant terrestrial input to Little Storfjorden (Knies and Martinez, 2009) at the onset of the Holocene. During the earliest Holocene (11.6–10.1 ka), deposition of the dropstone-rich Facies 2B suggests the collapse and substantial melting of the ice stream/marine-based glacier in Little Storfjorden near Hambergbukta.
5.2.3 Early to late Holocene
In Little Storfjorden, the middle Holocene following the late phase of the early Holocene (10.1–3.7 ka) is characterized by a remarkable increase in sand content (>63 μm; Figure 7) and very low sedimentation rates (∼5.5 cm/kyr). The prominent decrease in sedimentation rates is the consistent depositional pattern (Figure 8) in eastern Storfjorden and Storfjorden Trough (Rasmussen and Thomsen, 2014; Rasmussen and Thomsen, 2015; Łącka et al., 2015; Nielsen and Rasmussen, 2018; Rasmussen and Thomsen, 2021). Furthermore, lake sediment records in Svalbard suggested that most glaciers retreated to their minimum extent during the beginning of the middle Holocene (Farnsworth et al., 2020 and references therein). With a change in lithofacies from Facies 2 to 3 (Figure 9), a remarkable decrease in the TOC/Norg ratio and an increase in δ13Corg indicate a reduction in terrestrial input as the marine-based glacier retreated from Little Storfjorden. The notable increase in sand content associated with low sedimentation rates resulted from sediment winnowing from the enhanced bottom currents (Figure 11C). This interpretation is supported by the increase of Cibicides lobatulus in several cores from eastern Storfjorden reflecting the enhanced bottom currents during the early to middle Holocene (Rasmussen and Thomsen, 2015).
The late Holocene sediments in Little Storfjorden are composed of bioturbated sandy mud (Facies 3). In Facies 3, some large clasts possibly indicate the occurrence of the marine-terminating glaciers in the coastal areas of Little Storfjorden during the late Holocene, as also recorded in other Svalbard fjords (Hald et al., 2004; Forwick and Vorren, 2009; Skirbekk et al., 2010; Rasmussen and Thomsen, 2014; Nielsen and Rasmussen, 2018; Jang et al., 2021). However, in Little Storfjorden, marked deposition of IRD only occurs in the uppermost sediments deposited after ∼1 ka. In bioturbated Facies 3, high TOC and relatively heavy δ13Corg (Figure 9) suggest that Little Storfjorden prevailed in the glacier-distal setting and oceanographic conditions favorable to productivity (Forwick and Vorren, 2009; Lucchi et al., 2013; Rasmussen and Thomsen, 2014; Nielsen and Rasmussen, 2018). In the Arctic Ocean, the primary production increases at the sea ice edge and the marginal ice zone (Johannessen, 1987; van Aken et al., 1991; Wollenburg and Kuhnt, 2000). In Storfjorden, high primary productivity is correlated with the duration of seasonal sea ice cover and polynya formation (Winkelmann and Knies, 2005; Arrigo et al., 2008). Therefore, Little Storfjorden during the late Holocene would have experienced extensive seasonal sea ice covers (Figure 11D), consistent with eastern Storfjorden (Rasmussen and Thomsen, 2014).
5.3 Terminal moraine complex (TMC) formed during the Little Ice Age
In the Hambergbukta fjord mouth, the most visible morphological features are the TMC and the associated debris lobes (Figure 3A). The crevasse-fill ridges (Figure 3D) at the proximal flank of the TMC indicate that the tidewater glacier in Hambergbukta was surge-type (Solheim et al., 1991; Ottesen and Dowdeswell, 2006; Dowdeswell et al., 2016; Noormets et al., 2021). Lefauconnier and Hagen (1991) suggested that the TMC represents the maximum extent of the surging tidewater glacier in Hambergbukta during the LIA. However, Noormets et al. (2021) recently argued, based on the high-resolution swath-bathymetry, that the occurrence of crevasse-fill ridges between dual crests of the TMC was formed by at least two separate glacial surge events before LIA, probably during the Late-glacial or in the Holocene. Furthermore, they suggested that the LIA surge was related to the sinuous and subparallel ridges (Figure 3D) on the proximal side of the TMC as the end-moraine zone.
Different estimations for the timing of the TMC formation could result from insufficient chronological data (Lefauconnier and Hagen, 1991; Noormets et al., 2021). In this regard, sediment records in Little Storfjorden provide crucial evidence for the TMC formation because enhanced tidewater glacier influence can be exhibited as an increasing IRD flux in Svalbard fjords (Ślubowska-Woldengen et al., 2007; Rasmussen et al., 2014; Flink et al., 2017; Bartels et al., 2018). For example, in core 905, prominent IRD events were observed in Facies 2B, the upper part of Facies 3, and Facies 4 (Figure 7). Facies 2B was related to the glacier retreat after YD, corresponding to deposition of the acoustic unit F-2C overlying F-1C (Figure 10). The TMC and the associated debris lobes (F-1B) overlie the acoustic units (F-1C to F-4C) of Group C (Figure 5) in Little Storfjorden, showing that IRD deposition in Facies 2B is independent of TMC formation. Therefore, the lithological feature indicating the TMC formation can be constrained to the upper part (30–25 cm) of Facies 3 and 4. In Facies 3, large clasts were deposited during 0.9–0.7 ka, which belongs to the Medieval Warm Period (Rasmussen and Thomsen, 2015). Hence, this IRD event would indicate the retreat of former tidewater glaciers in the fjords and bays near Little Storfjorden. Based on this, we inferred that the TMC formed at least after ∼0.7 ka, possibly during the Little Ice Age (LIA) (Figure 11D). The depositional patterns of IRD suggest that surges have formed TMC during LIA. The dual-crested feature of the TMC possibly indicates the two-step advances during LIA, perhaps corresponding to glacier behaviors that occurred during 0.7–0.6 ka and 0.35–0.15 ka in the northern Spitsbergen (Werner, 1993; Røthe et al., 2015; Røthe et al., 2018).
sed on the foregoing, we consider the subparallel and sinuous ridges (Figure 3D) in the proximal side of the TMC as recessional moraines deposited after the LIA surges until 1900 AD (Figure 11D), but not formed by surges that occurred just before 1900 AD (Noormets et al., 2021). Morphologically, glacial surges have formed terminal moraines and associated debris lobes (Boulton et al., 1996; Plassen et al., 2004; Ottesen and Dowdeswell, 2006; Dowdeswell et al., 2016). In Hambergbukta, a glacial surge event in 1961–1970 also resulted in the formation of T1 and associated debris lobes that partly covers the former crevasse-fill ridges (Noormets et al., 2021) (Figure 3C). If the subparallel sinuous ridges were formed by glacier surges (Noormets et al., 2021), the associated debris lobes would have partly covered the previously formed crevasse-fill ridges on the proximal flank of the TMC. However, this region could not identify these features in bathymetry and seismic data.
6 Conclusion
This study reconstructed glacier-induced depositional environments in Little Storfjorden and Hambergbukta using multi-proxy data from sediment cores integrating swath-bathymetry and high-resolution seismic stratigraphy. Based on our reconstruction, we propose the detailed glacial history in Little Storfjorden and Hambergbukta over the last 13 ka (Figure 11) as follows:
1) During Younger Dryas (YD; 13–12 ka), the marine-based glaciers/ice streams in Little Storfjorden expanded southward to around 77°N in front of which a NE-SW-oriented grounding zone wedge (R2) probably formed.
2) After YD, Little Storfjorden experienced two phases of a glacier retreat. During the YD-Holocene transition (12–11.6 ka), the retreat was temporarily halted and/or significantly slow, in contrast to a rapid glacier retreat in eastern Storfjorden. During the earliest Holocene (11.6–10.1 ka), the marine-based glaciers/ice streams in Little Storfjorden retreated rapidly.
3) During the early to middle Holocene (10.1–3.7 ka), Little Storfjorden was affected by strong bottom currents under open marine conditions, resulting in a noticeable increase in sand content associated with significantly reduced sedimentation rates (∼5.5 cm/kyr).
4) During the late Holocene, Little Storfjorden was influenced by seasonal sea ice covers and tidewater glaciers in the coastal areas of Little Storfjorden.
5) Sediment records indicating noticeable advances (or surges) and retreats of a tidewater glacier in Hambergbukta were identified after 1 ka.
This reconstruction allows us to better understand the glacial history in southeastern Svalbard. Furthermore, sediment records in Little Storfjorden provide more precise depositional periods of glaciogenic submarine landforms near the Hambergbukta fjord mouth, in contrast to the age recently proposed by Noormets et al. (2021). Due to the absence of sufficient chronology from high-resolution lithostratigraphy, we cannot constrain the exact timing of the glacial maximum during Little Ice Age (LIA). However, litho- and seismostratigraphy in Little Storfjorden provide more precise age constraints for the formation of glaciogenic submarine landforms near the Hambergbukta fjord mouth. Based on multiple parameters, the glacier surges forming the terminal moraine complex (TMC) at the fjord mouth of Hambergbukta were identified as deposition of prominent IRD at least after ∼0.7 ka. This suggests that the TMC represents the maximum extent of a surging tidewater glacier in Hambergbukta during LIA and concludes that the sinuous ridges in the proximal side of the TMC as recessional moraines rather than end moraines formed by glacier surges.
Data availability statement
The original contributions presented in the study are included in the article/Supplementary Material, further inquiries can be directed to the corresponding author.
Author contributions
S-IN designed this research. YJJ carried out some laboratory analyses (e.g., grain size analysis, collecting X-radiographs, scanning core surface images, XRF and etc.) and wrote the first draft. KJ, MF, JSL, and S-IN edited the manuscript. MF, JSL, S-IN, GSK, and M-HK collected the data and material during the RV Helmer Hanssen cruise, providing the basis for this study. S-HY advised sedimentological interpretation.
Funding
This research was supported by a National Research Foundation of Korea Grant from the Korean Government (MSIT; the Ministry of Science and ICT) (NRF-2015M1A5A1037243 and 2021M1A5A1075512).
Acknowledgments
We thank Bjørn Runar Olsen and Truls Holm for their support during onboard data collection, and Trine Dahl, Ingvild Hald, and Karina Monsen for supporting the laboratory analyses at UiT. For helping recover sediment cores onboard, supporting some laboratory analyses, and processing swath-bathymetry at KOPRI, we also thank other KOPRI members, Dr. Young Ji Joo, Yeong Ju Son, Dahae Kim, as well as Ju Hyeon Lee (POSTEC) and Sookwan Kim (KIOST). We highly appreciate comments and suggestions by two reviewers to improve the quality of the manuscript. The captain and crew of RV Helmer Hanssen supported collecting sediment cores and geophysical data during the cruise in 2019.
Conflict of interest
The authors declare that the research was conducted in the absence of any commercial or financial relationships that could be construed as a potential conflict of interest.
Publisher’s note
All claims expressed in this article are solely those of the authors and do not necessarily represent those of their affiliated organizations, or those of the publisher, the editors and the reviewers. Any product that may be evaluated in this article, or claim that may be made by its manufacturer, is not guaranteed or endorsed by the publisher.
Supplementary material
The Supplementary Material for this article can be found online at: https://www.frontiersin.org/articles/10.3389/feart.2022.1017594/full#supplementary-material
References
Allaart, L., Müller, J., Schomacker, A., Rydningen, T. A., Håkansson, L., Kjellman, S. E., et al. (2020). Late Quaternary glacier and sea-ice history of northern Wijdefjorden, Svalbard. Boreas 49 (3), 417–437. doi:10.1111/bor.12435
Anderson, L. G., Falck, E., Jones, E. P., Jutterström, S., and Swift, J. H. (2004). Enhanced uptake of atmospheric CO2 during freezing of seawater: A field study in storfjorden, svalbard. J. Geophys. Res. 109 (C6), C06004. doi:10.1029/2003jc002120
Arrigo, K. R., van Dijken, G., and Long, M. (2008). Coastal southern ocean: A strong anthropogenic CO2 sink. Geophys. Res. Lett. 35 (21), L21602. doi:10.1029/2008gl035624
Bartels, M., Titschack, J., Fahl, K., Stein, R., and Hebbeln, D. (2018). Wahlenbergfjord, eastern svalbard: a glacier-surrounded fjord reflecting regional hydrographic variability during the Holocene? Boreas 47 (4), 1003–1021. doi:10.1111/bor.12325
Bartels, M., Titschack, J., Fahl, K., Stein, R., Seidenkrantz, M.-S., Hillaire-Marcel, C., et al. (2017). Atlantic Water advection vs. glacier dynamics in northern Spitsbergen since early deglaciation. Clim. Past. 13 (12), 1717–1749. doi:10.5194/cp-13-1717-2017
Batchelor, C., and Dowdeswell, J. (2015). Ice-sheet grounding-zone wedges (GZWs) on high-latitude continental margins. Mar. Geol. 363, 65–92. doi:10.1016/j.margeo.2015.02.001
Blaauw, M., and Christen, J. A. (2011). Flexible paleoclimate age-depth models using an autoregressive gamma process. Bayesian Anal. 6 (3), 457–474. doi:10.1214/11-ba618
Boulton, G., Van der Meer, J., Hart, J., Beets, D., Ruegg, G., Van der Wateren, F., et al. (1996). Till and moraine emplacement in a deforming bed surge—An example from a marine environment. Quat. Sci. Rev. 15 (10), 961–987. doi:10.1016/0277-3791(95)00091-7
Dallmann, W. K. (2014). Data from: Geological amp of Svalbard (1:750000) [Data set]. Norwegian Polar Institute. doi:10.21334/npolar.2014.09dbe7b2
Dowdeswell, J. A., Hogan, K., Evans, J., Noormets, R., Ó Cofaigh, C., and Ottesen, D. (2010). Past ice-sheet flow east of Svalbard inferred from streamlined subglacial landforms. Geology 38 (2), 163–166. doi:10.1130/g30621.1
Dowdeswell, J., Canals, M., Jakobsson, M., Todd, B., Dowdeswell, E., and Hogan, K. (2016). The variety and distribution of submarine glacial landforms and implications for ice-sheet reconstruction. Memoirs 46 (1), 519–552. doi:10.1144/m46.183
Dypvik, H., and Harris, N. B. (2001). Geochemical facies analysis of fine-grained siliciclastics using Th/U, Zr/Rb and (Zr+ Rb)/Sr ratios. Chem. Geol. 181 (1-4), 131–146. doi:10.1016/s0009-2541(01)00278-9
Farnsworth, W. R., Ingólfsson, Ó., Alexanderson, H., Allaart, L., Forwick, M., Noormets, R., et al. (2020). Holocene glacial history of Svalbard: Status, perspectives and challenges. Earth-Science Rev. 208, 103249. doi:10.1016/j.earscirev.2020.103249
Flink, A. E., Noormets, R., Fransner, O., Hogan, K. A., Óregan, M., and Jakobsson, M. (2017). Past ice flow in Wahlenbergfjorden and its implications for late Quaternary ice sheet dynamics in northeastern Svalbard. Quat. Sci. Rev. 163, 162–179. doi:10.1016/j.quascirev.2017.03.021
Forwick, M., and Vorren, T. O. (2009). Late weichselian and Holocene sedimentary environments and ice rafting in isfjorden, spitsbergen. Palaeogeogr. Palaeoclimatol. Palaeoecol. 280 (1-2), 258–274. doi:10.1016/j.palaeo.2009.06.026
Gilbert, I. M., Pudsey, C. J., and Murray, J. W. (1998). A sediment record of cyclic bottom-current variability from the northwest Weddell Sea. Sediment. Geol. 115 (1-4), 185–214. doi:10.1016/s0037-0738(97)00093-6
Gilbert, R. (1990). Rafting in glacimarine environments. Geol. Soc. Lond. Spec. Publ. 53 (1), 105–120. doi:10.1144/gsl.sp.1990.053.01.06
Hald, M., Ebbesen, H., Forwick, M., Godtliebsen, F., Khomenko, L., Korsun, S., et al. (2004). Holocene paleoceanography and glacial history of the West Spitsbergen area, Euro-Arctic margin. Quat. Sci. Rev. 23 (20-22), 2075–2088. doi:10.1016/j.quascirev.2004.08.006
Heaton, T. J., Köhler, P., Butzin, M., Bard, E., Reimer, R. W., Austin, W. E., et al. (2020). Marine20—The marine radiocarbon age calibration curve (0–55, 000 cal BP). Radiocarbon 62 (4), 779–820. doi:10.1017/rdc.2020.68
Hodell, D. A., Channell, J. E., Curtis, J. H., Romero, O. E., and Röhl, U. (2008). Onset of “hudson strait” heinrich events in the eastern north atlantic at the end of the middle pleistocene transition (640 ka)? Paleoceanography 23 (4), PA4218. doi:10.1029/2008pa001591
Hughes, A. L., Gyllencreutz, R., Lohne, Ø. S., Mangerud, J., and Svendsen, J. I. (2016). The last Eurasian ice sheets–a chronological database and time-slice reconstruction, DATED-1. Boreas 45 (1), 1–45. doi:10.1111/bor.12142
Jakobsson, M., Mayer, L. A., Bringensparr, C., Castro, C. F., Mohammad, R., Johnson, P., et al. (2020). The international bathymetric chart of the Arctic Ocean version 4.0. Sci. Data 7 (1), 176–214. doi:10.1038/s41597-020-0520-9
Jang, K., Ahn, Y., Joe, Y. J., Braun, C. A., Joo, Y. J., Kim, J.-H., et al. (2021). Glacial and environmental changes in northern Svalbard over the last 16.3 ka inferred from neodymium isotopes. Glob. Planet. Change 201, 103483. doi:10.1016/j.gloplacha.2021.103483
Jessen, S. P., Rasmussen, T. L., Nielsen, T., and Solheim, A. (2010). A new Late Weichselian and Holocene marine chronology for the Western Svalbard slope 30, 000–0 cal years BP. Quat. Sci. Rev. 29 (9-10), 1301–1312. doi:10.1016/j.quascirev.2010.02.020
Johannessen, O. (1987). Introduction: Summer marginal ice zone experiments during 1983 and 1984 in Fram Strait and the Greenland sea. New York, United States: Wiley Online Library.
Joo, Y. J., Forwick, M., Park, K., Joe, Y., Son, Y. J., and Nam, S.-I. (2019). Holocene environmental changes in dicksonfjorden, West Spitsbergen, svalbard. Polar Res. 38, 3426. doi:10.33265/polar.v38.3426
Knies, J., and Martinez, P. (2009). Organic matter sedimentation in the Western Barents Sea region: Terrestrial and marine contribution based on isotopic composition and organic nitrogen content. Nor. J. Geology/Norsk Geol. Forening 89 (1–2), 79–89.
König, M., Kohler, J., and Nuth, C. (2013). Data from: Glacier area outlines-svalbard [Data set]. Norwegian Polar Institute. doi:10.21334/npolar.2013.89f430f8
Łącka, M., Zajączkowski, M., Forwick, M., and Szczuciński, W. (2015). Late weichselian and Holocene palaeoceanography of storfjordrenna, southern svalbard. Clim. Past. 11 (3), 587–603. doi:10.5194/cp-11-587-2015
Landvik, J. Y., Ingolfsson, O., Mienert, J., Lehman, S. J., Solheim, A., Elverhøi, A., et al. (2005). Rethinking Late Weichselian ice-sheet dynamics in coastal NW Svalbard. Boreas 34 (1), 7–24. doi:10.1111/j.1502-3885.2005.tb01001.x
Larsen, N. K., Funder, S., Linge, H., Möller, P., Schomacker, A., Fabel, D., et al. (2016). A Younger Dryas re-advance of local glaciers in north Greenland. Quat. Sci. Rev. 147, 47–58. doi:10.1016/j.quascirev.2015.10.036
Lefauconnier, B., and Hagen, J. O. (1991). Surging and calving glaciers in eastern Svalbard. Nor. Polarinst. 116, 1–130.
Liu, Z., Carlson, A. E., He, F., Brady, E. C., Otto-Bliesner, B. L., Briegleb, B. P., et al. (2012). Younger Dryas cooling and the Greenland climate response to CO2. Proc. Natl. Acad. Sci. U. S. A. 109 (28), 11101–11104. doi:10.1073/pnas.1202183109
Lønne, I. (2001). Dynamics of marine glacier termini read from moraine architecture. Geol. 29 (3), 199–202. doi:10.1130/0091-7613(2001)029<0199:domgtr>2.0.co;2
Lucchi, R., Camerlenghi, A., Rebesco, M., Colmenero-Hidalgo, E., Sierro, F., Sagnotti, L., et al. (2013). Postglacial sedimentary processes on the Storfjorden and Kveithola trough mouth fans: Significance of extreme glacimarine sedimentation. Glob. Planet. change 111, 309–326. doi:10.1016/j.gloplacha.2013.10.008
Margold, M., Stokes, C. R., and Clark, C. D. (2018). Reconciling records of ice streaming and ice margin retreat to produce a palaeogeographic reconstruction of the deglaciation of the Laurentide Ice Sheet. Quat. Sci. Rev. 189, 1–30. doi:10.1016/j.quascirev.2018.03.013
Martín-Moreno, R., Allende Álvarez, F., and Hagen, J. O. (2017). ‘Little Ice Age’glacier extent and subsequent retreat in Svalbard archipelago. Holocene 27 (9), 1379–1390. doi:10.1177/0959683617693904
Nielsen, T., and Rasmussen, T. L. (2018). Reconstruction of ice sheet retreat after the Last Glacial maximum in Storfjorden, southern Svalbard. Mar. Geol. 402, 228–243. doi:10.1016/j.margeo.2017.12.003
Noormets, R., Flink, A., and Kirchner, N. (2021). Glacial dynamics and deglaciation history of Hambergbukta reconstructed from submarine landforms and sediment cores, SE Spitsbergen, Svalbard. Boreas 50 (1), 29–50. doi:10.1111/bor.12488
Ottesen, D., and Dowdeswell, J. (2006). Assemblages of submarine landforms produced by tidewater glaciers in Svalbard. J. Geophys. Res. 111 (F1), F01016. doi:10.1029/2005jf000330
Pälli, A., Moore, J. C., Jania, J., and Glowacki, P. (2003). Glacier changes in southern spitsbergen, svalbard, 1901–2000. Ann. Glaciol. 37, 219–225. doi:10.3189/172756403781815573
Pieńkowski, A. J., Husum, K., Furze, M. F., Missana, A. F., Irvalı, N., Divine, D. V., et al. (2021). Revised ΔR values for the Barents Sea and its archipelagos as a pre-requisite for accurate and robust marine-based 14C chronologies. Quat. Geochronol. 68, 101244. doi:10.1016/j.quageo.2021.101244
Plassen, L., Vorren, T. O., and Forwick, M. (2004). Integrated acoustic and coring investigation of glacigenic deposits in Spitsbergen fjords. Polar Res. 23 (1), 89–110. doi:10.3402/polar.v23i1.6269
Powell, R. D., and Alley, R. B. (1997). Grounding-line systems: Processes, glaciological inferences and the stratigraphic record. Geol. seismic Stratigr. Antarct. Margin 2 71, 169–187.
Rasmussen, T. L., and Thomsen, E. (2014). Brine formation in relation to climate changes and ice retreat during the last 15, 000 years in Storfjorden, Svalbard, 76–78 N. Paleoceanography 29 (10), 911–929. doi:10.1002/2014pa002643
Rasmussen, T. L., and Thomsen, E. (2021). Climate and ocean forcing of ice-sheet dynamics along the Svalbard-Barents Sea ice sheet during the deglaciation∼ 20, 000–10, 000 years BP. Quat. Sci. Adv. 3, 100019. doi:10.1016/j.qsa.2020.100019
Rasmussen, T. L., and Thomsen, E. (2015). Palaeoceanographic development in S torfjorden, S valbard, during the deglaciation and H olocene: Evidence from benthic foraminiferal records. Boreas 44 (1), 24–44. doi:10.1111/bor.12098
Rasmussen, T. L., Thomsen, E., Skirbekk, K., Ślubowska-Woldengen, M., Kristensen, D. K., and Koç, N. (2014). Spatial and temporal distribution of Holocene temperature maxima in the northern nordic seas: Interplay of atlantic-arctic-and polar water masses. Quat. Sci. Rev. 92, 280–291. doi:10.1016/j.quascirev.2013.10.034
Røthe, T. O., Bakke, J., Støren, E. W., and Bradley, R. S. (2018). Reconstructing Holocene glacier and climate fluctuations from lake sediments in Vårfluesjøen, Northern Spitsbergen. Front. Earth Sci. (Lausanne). 6, 91. doi:10.3389/feart.2018.00091
Røthe, T. O., Bakke, J., Vasskog, K., Gjerde, M., D'Andrea, W. J., and Bradley, R. S. (2015). Arctic Holocene glacier fluctuations reconstructed from lake sediments at Mitrahalvøya, Spitsbergen. Quat. Sci. Rev. 109, 111–125. doi:10.1016/j.quascirev.2014.11.017
Rothwell, R. G. (2015). “Twenty years of XRF core scanning marine sediments: What do geochemical proxies tell us?,” in Micro-XRF studies of sediment cores (Charm: Springer), 25–102.
Schauer, U. (1995). The release of brine-enriched shelf water from Storfjord into the Norwegian Sea. J. Geophys. Res. 100 (C8), 16015–16028. doi:10.1029/95jc01184
Skirbekk, K., Kristensen, D. K., Rasmussen, T. L., Koç, N., and Forwick, M. (2010). Holocene climate variations at the entrance to a warm arctic fjord: Evidence from kongsfjorden trough, svalbard. Geol. Soc. Lond. Spec. Publ. 344 (1), 289–304. doi:10.1144/sp344.20
Skogseth, R., Haugan, P., and Jakobsson, M. (2005). Watermass transformations in storfjorden. Cont. Shelf Res. 25 (5-6), 667–695. doi:10.1016/j.csr.2004.10.005
Skogseth, R., McPhee, M. G., Nilsen, F., and Smedsrud, L. H. (2013). Creation and tidal advection of a cold salinity front in storfjorden: 1. Polynya dynamics. J. Geophys. Res. Oceans 118 (7), 3278–3291. doi:10.1002/jgrc.20231
Skogseth, R., Sandvik, A., and Asplin, L. (2007). Wind and tidal forcing on the meso-scale circulation in Storfjorden, Svalbard. Cont. Shelf Res. 27 (2), 208–227. doi:10.1016/j.csr.2006.10.001
Silva, J., and Bremner, J. (1966). Determination and isotope-ratio analysis of different forms of nitrogen in soils: 5. Fixed ammonium. Soil Science Society of America Journal 30 (5), 587–594.
Ślubowska-Woldengen, M., Rasmussen, T. L., Koç, N., Klitgaard-Kristensen, D., Nilsen, F., and Solheim, A. (2007). Advection of atlantic water to the Western and northern svalbard shelf since 17, 500 cal yr BP. Quat. Sci. Rev. 26 (3-4), 463–478. doi:10.1016/j.quascirev.2006.09.009
Solheim, A., Elverhøi, A., Andersen, E. S., and Jahre, H. (1991). Marine geological/geophysical cruise on the western svalbard margin 1990: Cruise report.
Stuiver, M., and Reimer, P. J. (1993). Extended 14C data base and revised CALIB 3.0 14C age calibration program. Radiocarbon 35 (1), 215–230. doi:10.1017/s0033822200013904
Svendsen, J. I., Alexanderson, H., Astakhov, V. I., Demidov, I., Dowdeswell, J. A., Funder, S., et al. (2004). Late Quaternary ice sheet history of northern Eurasia. Quat. Sci. Rev. 23 (11-13), 1229–1271. doi:10.1016/j.quascirev.2003.12.008
Svendsen, J. I., Elverhmi, A., and Mangerud, J. (1996). The retreat of the Barents Sea ice sheet on the Western svalbard margin. Boreas 25 (4), 244–256. doi:10.1111/j.1502-3885.1996.tb00640.x
van Aken, H. M., Quadfasel, D., and Warpakowski, A. (1991). The arctic front in the Greenland sea during february 1989: Hydrographic and biological observations. J. Geophys. Res. 96 (C3), 4739–4750. doi:10.1029/90jc02271
Werner, A. (1993). Holocene moraine chronology, spitsbergen, svalbard: Lichenometric evidence for multiple neoglacial advances in the arctic. Holocene 3 (2), 128–137. doi:10.1177/095968369300300204
Wiberg, D. H., Haflidason, H., and Laberg, J. S. (2022). An updated Weichselian chronostratigraphic framework of the Kongsfjorden Trough Mouth Fan and its implications for the glacial history of Svalbard. Boreas 51, 667–683. doi:10.1111/bor.12581
Winkelmann, D., and Knies, J. (2005). Recent distribution and accumulation of organic carbon on the continental margin west off Spitsbergen. Geochem. Geophys. Geosyst. 6 (9), 1–22. doi:10.1029/2005gc000916
Wollenburg, J. E., and Kuhnt, W. (2000). The response of benthic foraminifers to carbon flux and primary production in the Arctic Ocean. Mar. Micropaleontol. 40 (3), 189–231. doi:10.1016/s0377-8398(00)00039-6
Ziaja, W., and Ostafin, K. (2015). Landscape–seascape dynamics in the isthmus between Sørkapp Land and the rest of Spitsbergen: Will a new big Arctic island form? Ambio 44 (4), 332–342. doi:10.1007/s13280-014-0572-1
Zuchuat, V., Sleveland, A., Twitchett, R., Svensen, H., Turner, H., Augland, L. E., et al. (2020). A new high-resolution stratigraphic and palaeoenvironmental record spanning the End-Permian Mass Extinction and its aftermath in central Spitsbergen, Svalbard. Palaeogeogr. Palaeoclimatol. Palaeoecol. 554, 109732. doi:10.1016/j.palaeo.2020.109732
Keywords: Little Storfjorden, Hambergbukta, Younger Dryas, Little Ice Age, grounding zone wedge, terminal moraine
Citation: Joe YJ, Jang K, Forwick M, Laberg JS, Kong GS, Kang M-H, Yoon S-H and Nam S-I (2022) Glacial history and depositional environments in little Storfjorden and Hambergbukta of Arctic Svalbard since the younger dryas. Front. Earth Sci. 10:1017594. doi: 10.3389/feart.2022.1017594
Received: 12 August 2022; Accepted: 03 November 2022;
Published: 21 November 2022.
Edited by:
Benedict Reinardy, Royal Institute of Technology, SwedenReviewed by:
Zhongkang Yang, Institute of Polar Environment & Anhui Key Laboratory of Polar Environment and Global Change, ChinaDag Ottesen, Geological Survey of Norway, Norway
Copyright © 2022 Joe, Jang, Forwick, Laberg, Kong, Kang, Yoon and Nam. This is an open-access article distributed under the terms of the Creative Commons Attribution License (CC BY). The use, distribution or reproduction in other forums is permitted, provided the original author(s) and the copyright owner(s) are credited and that the original publication in this journal is cited, in accordance with accepted academic practice. No use, distribution or reproduction is permitted which does not comply with these terms.
*Correspondence: Seung-Il Nam, c2luYW1Aa29wcmkucmUua3I=