 Qian Wang
 Xianbo Su
 Yi Jin
 Peihong Chen6*
95% of researchers rate our articles as excellent or good
Learn more about the work of our research integrity team to safeguard the quality of each article we publish.
Find out more
ORIGINAL RESEARCH article
Front. Earth Sci. , 23 September 2022
Sec. Economic Geology
Volume 10 - 2022 | https://doi.org/10.3389/feart.2022.1017429
This article is part of the Research Topic Exploration, Exploitation, and Utilization of Coal-Measure Gas into the Future View all 16 articles
To characterize the coal measure shale pore structure of the Xiashihezi Formation in the Sunan Syncline block, a series of experiments were conducted. Results show that the main components of the shales are clay minerals and quartz, and organic matter, fluid escaping, interlayer, intercrystalline and interparticle pores are well-developed. The shale pore specific surface area (SSA) is concentrated in the pores with the size of <50 nm and is significantly higher in the pores with the size of < 5 nm, indicating that these pores have an important effect on gas adsorption. The shale pore volume is mainly concentrated near the pore size of 10 nm, followed by 10,000–100,000 nm, indicating that in addition to the fractures, the matrix pores with a size of about 10 nm contribute the most to pore volume and free gas accumulation. The volume and SSA of the micropore, small pore, and mesopore increase with the TOC content when it is lower than 6%, leading to higher porosity and total pore SSA of the shales. However, this positive correlation disappears under the compaction effect when the TOC content is higher than 6%. The clay mineral content has negative correlations with the volume and SSA of the mesopore and macropore under the compaction and pore blockage effects, but it correlates poorly with those of the micropore and small pore, causing a decrease in the shale porosity as it increases, while the brittle mineral can promote mesopore and macropore development and is conducive to micropore and small pore maintenance when its content is higher than 45%. As a result, the shale porosity tends to increase with the brittle mineral content. This study is helpful in clarifying the coal measure shale gas enrichment law in the block and in providing fundamental support for coal measure gas efficient development.
Coal measure shales are fine-grained sedimentary rocks that have genetic relationships with coal seams in coal-bearing formation and are characterized by lamellae or laminated structures, as well as complicated composition and pore structure (Cao et al., 2014; Cao et al., 2015; Zuo et al., 2017). Based on the color and mixture composition, it can be divided into siltstone, silty mudstone, and mudstone that include carbonaceous, calcareous, siliceous, ferruginous mudstones etc. Previous studies show that coal measure shales generally possess low porosity, permeability, and gas content but high resource abundance because of high thickness, and its pore structure characteristics have a significant effect on gas enrichment and development conditions (Wang et al., 2016a).
Shales have a pore–fracture system, and the matrix pores determine the shale gas occurrence, desorption, and diffusion, while the fractures determine the conduit for fluid seepage flow. Related research studies have been focused on the pore volume and specific surface area (SSA) distributions, genetic types, and influencing factors of the pore structure (Schmitt et al., 2013; Zhang et al., 2017a; Middleton et al., 2017; Wang et al., 2021). There are two types of methods that have been widely adopted to analyze pore structure. One is morphological observations, including optical microscopy (Wang et al., 2017), scanning electron microscopy (SEM) (Wang et al., 2016b), transmission electron microscopy (TEM) (Wei et al., 2018), and atomic force microscopy (AFM) (Zhao et al., 2019), and the other is physical measurements, including mercury injection (Li et al., 2018a), low-temperature N2 and CO2 adsorption (Liu et al., 2017; Song et al., 2017), nuclear magnetic resonance (NMR) (Zhang et al., 2019a), computed tomography (micro- and nano-CT) (Josh et al., 2012) and small-angle neutron scattering/ultra-small-angle scattering (SANS/USAS) (Clarkson et al., 2013). In addition, two methods have been widely adopted for pore classification according to the pore size distribution. One is the method that was proposed by the International Union of Pure and Applied Chemistry (IUPAC), who classified the pores into micropore (<2 nm), mesopore (2–50 nm), and macropore (>50 nm). The other was proposed by B. B. XOДOT, and the pores are classified into micropores, small pores, mesopores, and macropores by the boundaries of 10, 100, and 1,000 nm (Cao and Guo, 2020).
In terms of the genetic types and major composition, shale pores can be classified as OM pores, interparticle pores, intercrystalline pores, dissolved pores, fluid escaping pores etc. Among them, the OM pores and the intercrystalline and interparticle pores in clay minerals are the main types (Li et al., 2018b; Chen et al., 2016; Slatt and O'Brien, 2011; Ko et al., 2018). Most shale pores are slit-shaped with a pore size of less than 100 nm. The pore volume and SSA are mainly provided by the pores with the size of < 50 nm, and the pores with the size of < 10 nm contribute well to the total SSA (Fishman et al., 2012; Zhang et al., 2016a; Zhang et al., 2016b; Chen et al., 2017; Zuo et al., 2017). Previous studies show that the coal measure shale pore structure is affected by multiple factors. Pan et al. studied the coal measure shale pore structure of the Taiyuan Formation in Huainan Coalfield and found that the OM and clay mineral can promote nanoscale pore development, while the quartz content correlates poorly with the pore structure (Pan et al., 2017; Ge et al., 2020). Zhang et al. (2019b) and Yuan et al. (2021) studied the shale pore structure of Shanxi and Taiyuan formations in the central Qinshui basin. They found that the OM has a significant promotion effect on the development of pores with a size of < 50 nm, followed by the clay mineral content; however, quartz is not conducive to pore development (Zhang et al., 2019b; Yuan et al., 2021). Zhang et al. (2017b) demonstrated that all the contents of OM, clay, and brittle minerals correlate poorly with the porosity and total pore SSA when they studied the coal measure shales of the Yan’an and Taiyuan formations in the northeastern margin of the Ordos Basin and thought that the effect of a single factor on the pore structure is not significant. Some other researchers found that both the OM and brittle mineral have a promotion effect on shale pore development, and the support effect provided by the brittle mineral is important for pore maintenance, especially for the transitional shale that possesses relatively higher clay mineral content. Also, the increase of clay mineral content may aggravate pore collapse, leading to the decrease in pore volume and SSA (Pan et al., 2017; Zhao et al., 2017). According to the abovementioned research studies, there are certain differences in the coal measure shale pore structure and its control effect in different regions. To date, most shale pore studies have focused on marine and terrestrial shales, while the research of coal measure shale pore structure is still lacking comparatively and needs to be further performed.
The coal seams of the Xiashihezi Formation, Middle Permian, in the Sunan Syncline block are the main target for coalbed methane (CBM) development in the area. However, affected by geological and technical factors, the CBM wells generally face the problem of low gas production. Previous tests and theoretical analyses show that the coal measure shales in the Xiashihezi Formation have abundant gas resources, and engineering tests indicate that the combined development of CBM and the shale gas (i.e., coal measure gas development) can effectively increase the gas production of the low-yield CBM wells, indicating that gas resources in the coal measure shales possess important development value (Su et al., 2018a). However, previous studies of the Permian coal-bearing formation are mainly focused on coal seams, while there is still a lack of research on the coal measure shales in the formation, which hinders efficient development of coal measure gas in the block (Wei et al., 2007; Gui and Chen, 2016; Liu et al., 2016). Therefore, this study aims to study the pore structure characteristics of these coal measure shales and to provide fundamental supports for clarifying the shale gas enrichment law and the efficient development of coal measure gas in the block.
Sunan Syncline block is located in the southern part of the North China basin, and the Sunan Syncline is a south–north distributed open-branched syncline. The formations in the southern block are continuous, while some formations in the northeast are interrupted by a northwest-trending overthrust fault (Figure 1). The syncline was infilled with sediments of the Xiashihezi Formation that were deposited under a regression delta plain environment during the late Paleozoic and with a burial depth of 447–2,000 m. The Xiashihezi Formation is about 127–386 m thick and is generally thicker in the north and center than in the south and two flanks of the block (Wang et al., 2020). The lithology of this formation includes a series of shallow gray fine sandstones, siltstones, gray to dark, and gray to grayish black silty mudstones, carbonaceous mudstones, and No. 4–No. 9 coal seams. Also, the Xiashihezi Formation can be divided into two parts separated by a sandstone on the top of the No. 6 coal seam. The lithologies of the lower part are mainly gray, dark gray, and grayish black mudstone that contains some oolitic structures and siderite, sandy mudstones, and gray and grayish black fine sandstones that are interbedded with a gray and greyish white fine sandstone. The lower part also contains No. 6–No. 9 coal seams that are the main target of CBM development (Figure 2) and is the study section of this article.
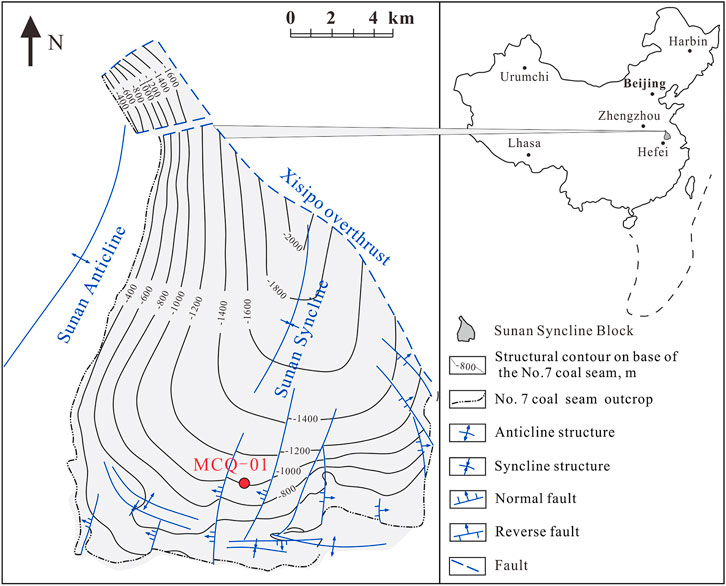
FIGURE 1. Location of the Sunan Syncline block and the structural contour map of the No. 71 coal seam floor.
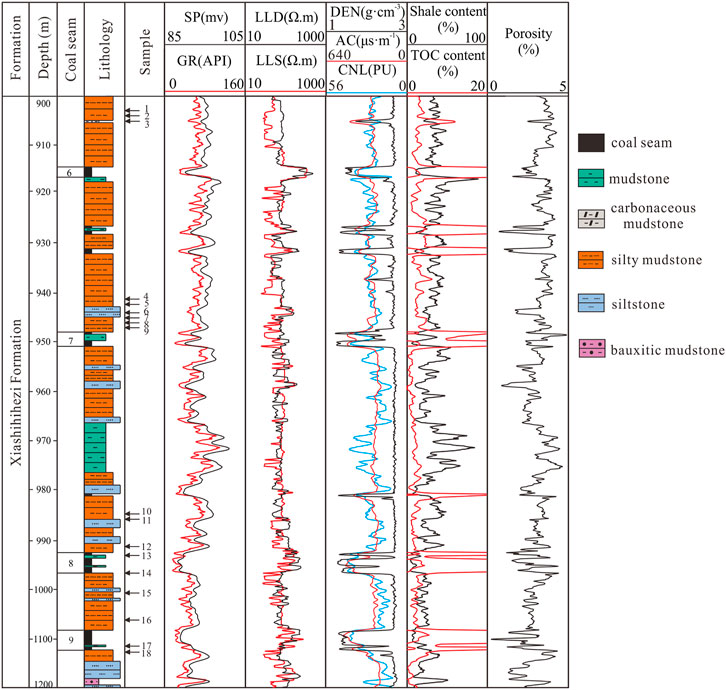
FIGURE 2. Lithology, logging, and sample acquisition at the Well MCQ-01.
A total of 18 coal measure shale samples were collected from the Xiashihezi Formation of the Well MCQ-01 (see Figure 2 for the locations). X-ray diffraction (XRD) analysis was conducted on the shale powder samples with a D/max2500 type diffractometer according to the Chinese standard SY/T 5163-2010 to obtain the mineral composition (The Chinese Standard of Petroleum and Natural Gas Industry, 2010). An FE-SEM test was conducted on the shale samples using a QUANTA-FEG 250 ESEM following the standard SY/T 5162–2014 to observe the micromorphology of the pore and fractures, as well as the mineral composition (The Chinese Standard of Petroleum and Natural Gas Industry, 2014). Also, the total organic carbon (TOC) content of the samples was measured by a LECOCS-200 carbon and sulfur analyzer in accordance with the Chinese standard GB/T 19145-2003 (The National Standard of the People’s Republic of China, 2003).
To characterize the shale pore structure at the micrometer scale to the nanometer scale, mercury injection and low-temperature N2 and CO2 adsorption tests were adopted. The mercury injection test employed a PoreMaster-33 mercury porosimetry apparatus and follows the Chinese standard GB/T 21650.1-2008 (The National Standard of the People’s Republic of China, 2008a). The low-temperature N2 and CO2 adsorption tests employed a V-Sorb 2800TP pore surface analyzer and follow the Chinese standards GB/T 21650.2-2008 and GB/T 21650.3-2011 (The National Standard of the People’s Republic of China, 2008b; The National Standard of the People’s Republic of China, 2011; Zhang et al., 2020).
In addition, considering that the main object of coal measure gas development in this area is the CBM, the pore classification method proposed by B. B. XOДOT that has been widely used for coal pore characterization was adopted to classify the shale pores for facilitating the comprehensive evaluation of coal and shale reservoirs.
The coal measure shales are mainly composed of quartz with a content of 22.78%–55.87%, clay minerals with a content of 28.90%–76.27%, and little plagioclase and siderite. Also, calcite and pyrite were observed in individual samples. The clay minerals are mainly composed of illite–smectite mixed-layer (I/S) and kaolinite, which account for more than 95% of the mineral content, as well as little illite and chlorite. In addition, the TOC content of the shales ranges from 0.18% to 14.30% (Table 1). Based on the mineral composition, structural, and logging characteristics, the coal measure shales of the Xiashihezi Formation are classified into four types (Figure 3).
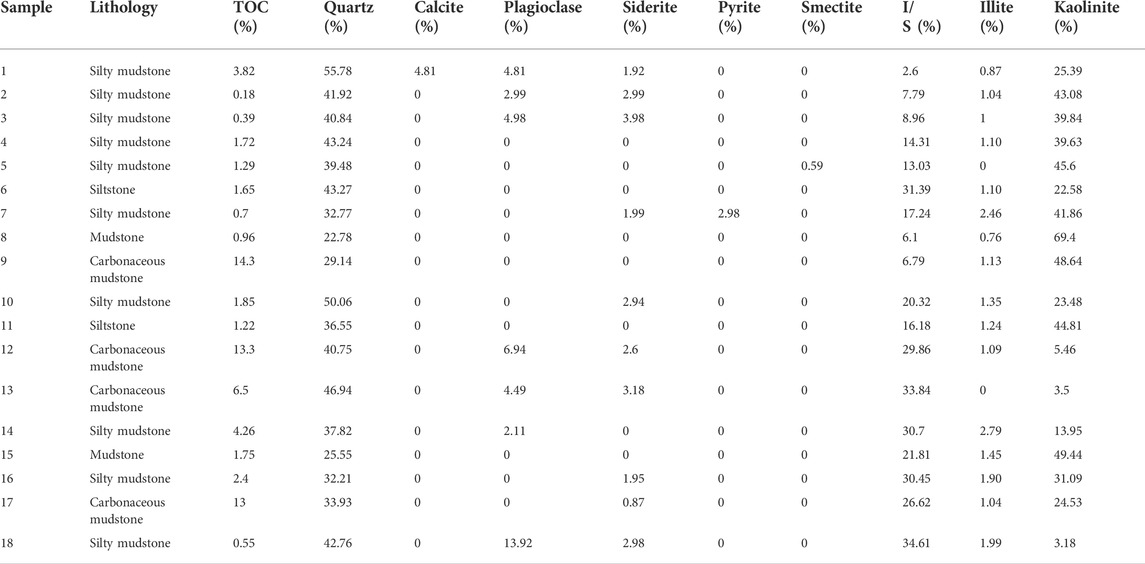
TABLE 1. TOC content and mineral composition of the coal measure shale samples of the Xiashihezi Formation.
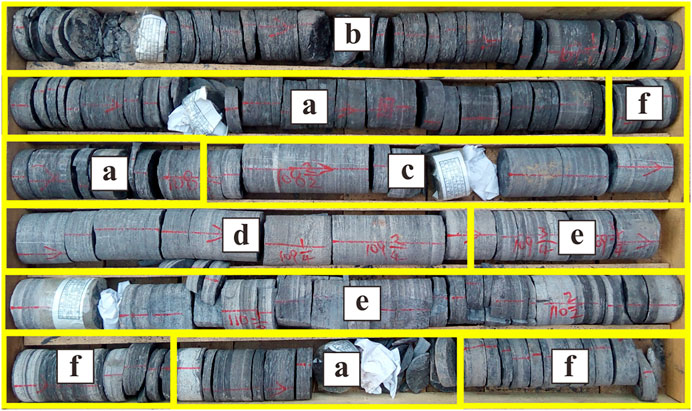
FIGURE 3. Core image of different coal measure shales from the Well MCQ-01. (A) Mudstones; (B) carbonaceous sediments; (C) silty mudstone; (D) siltstone; (E) mudstone and siltstone alternating layers; and (F) mudstone and silty mudstone alternating layers.
The mudstones in the formation are mainly dark gray and grayish black in color with mostly horizontal beddings and slab and schistose structures (Figure 3A). Some mudstones are interbedded with light-colored siltstones and silty mudstones, and both directionally aligned muscovite and plant detritus on bedding planes (Figures 3E,F). The mudstones mainly comprise clay minerals (accounting for more than 70%), clastic quartz (accounting for 20%–25%), and little OM, calcite, plagioclase, siderite, and mica (accounting for lower than 5% in total). The clay minerals are mainly composed of kaolinite and I/S, of which the kaolinite content accounts for more than 50% (Table 1). Compared with other shales, the mudstones possess relatively high clay mineral content and are characterized by the logging responses of high natural gamma ray (GR), high spontaneous potential (SP), high bulk density (DEN), high compensated neutron log (CNL), low sonic slowness (AC), and low resistivity (Rt). Data from the Well MCQ-01 indicate that the GR values of the mudstones are greater than 100 API, while the SP values are greater than 97 mV. The logging interpretations indicate that the mudstones generally possess high shale content (Vsh) and porosity and low TOC content (Figure 2).
The carbonaceous mudstones are mainly grayish black and black in color and contain textures that include both slab and schistose structures caused by the horizontal beddings (Figure 3B). The rock composition is complicated and includes clay minerals, quartz, siderite, and plagioclase. The content of clay minerals and quartz is generally higher than 80%. Also, this shale is mainly distributed adjacent to coal seams or developed independently as thin beds and contains lots of fossil fragments. The TOC contents of the carbonaceous mudstone samples are 6.5%–14.3% (avg. 11.27%), which are obviously higher than those of other shales (0.18%–4.26%, avg. 2.4%), indicating that these shales may possess better gas accumulation condition and high development value (Table 1), while its logging responses are basically similar to the mudstones (Figure 2).
The silty mudstones in the formation are mainly gray and dark gray in color and developed with horizontal and wavy beddings. Also, it generally presents as thin beds and is interbedded with other rocks (Figures 3C,F). The minerals in this shale are mainly clay minerals with a content of 30%–70%, as well as silt clasts composed of quartz, calcite, plagioclase, and siderite (Table 1). The clay mineral and TOC contents of the silty mudstones are relatively lower than those of the mudstones and carbonaceous mudstones, respectively, while its brittle mineral content is relatively higher, indicating that it may possess higher fracability and is more favorable for hydrofracturing (Su et al., 2018b). Also, compared with the mudstones and siltstones, the GR, DEN, CNL, AC, and RT of the silty mudstones show a “median value”. In particular, the GR, SP, and CNL values of the silty mudstones are 70–100 API, 93–97 mV, and 18–28 PU, respectively, and the logging interpretations show that it generally possesses medium Vsh and TOC and low porosity (Figure 2).
The siltstones in the formation are generally gray or grayish white in color and contain well-developed horizontal and wavy beddings and also present the form of thin bed interbedded with other rocks (Figures 3D,E). The thickness of this shale can be up to 3–5 m, and it is mainly composed of fine and pulverous sand clasts with the content of more than 70% in total, as well as few clay minerals. The mineral composition of this shale is generally similar with that of the silty mudstone (Table 1), and it is characterized by low GR, low SP, low CNL, low AC, high DEN, and high RT values, and the logging interpretations indicate that it has low Vsh and TOC but high porosity.
The results of the FS-SEM test show that the coal measure shales are not only mainly composed of quartz and clay minerals but also contain small amounts of feldspar, gypsum, pyrite, and OM clasts. In particular, quartz can be subdivided into clastic and authigenic forms according to the genesis (Figures 4A–C), of which authigenic quartz is shown as secondary enlargements and contains inclusions (Figure 4B). Also, the feldspar cleavage is present in the samples (Figure 4C), and the gypsum presents typical columnar crystals and characteristics of hydrothermal genesis (Figure 4E). The strawberry-shaped pyrite crystals are developed inside the desmocollinite of the samples, indicating it was formed under a strongly reducing environment (Figure 4F). The kaolinite and I/S are the dominant clay minerals (Figures 4K,L), and the kaolinite can be classified into feldspar alternation and depositional types according to the differences in genesis. The feldspar alternation type retains the cleavage texture of feldspar (Figure 4D), while the depositional type has a wormy texture (Figure 4C). The maceral of OM includes telinite (Figures 4D,G), desmocollinite (Figure 4H), telocollinite (Figures 4I,J), and sporinite (Figure 4A), of which the desmocollinite contains quartz grains at the nanometer-scale (Figure 4H), while cleats are developed in the telocollinite (Figure 4I).
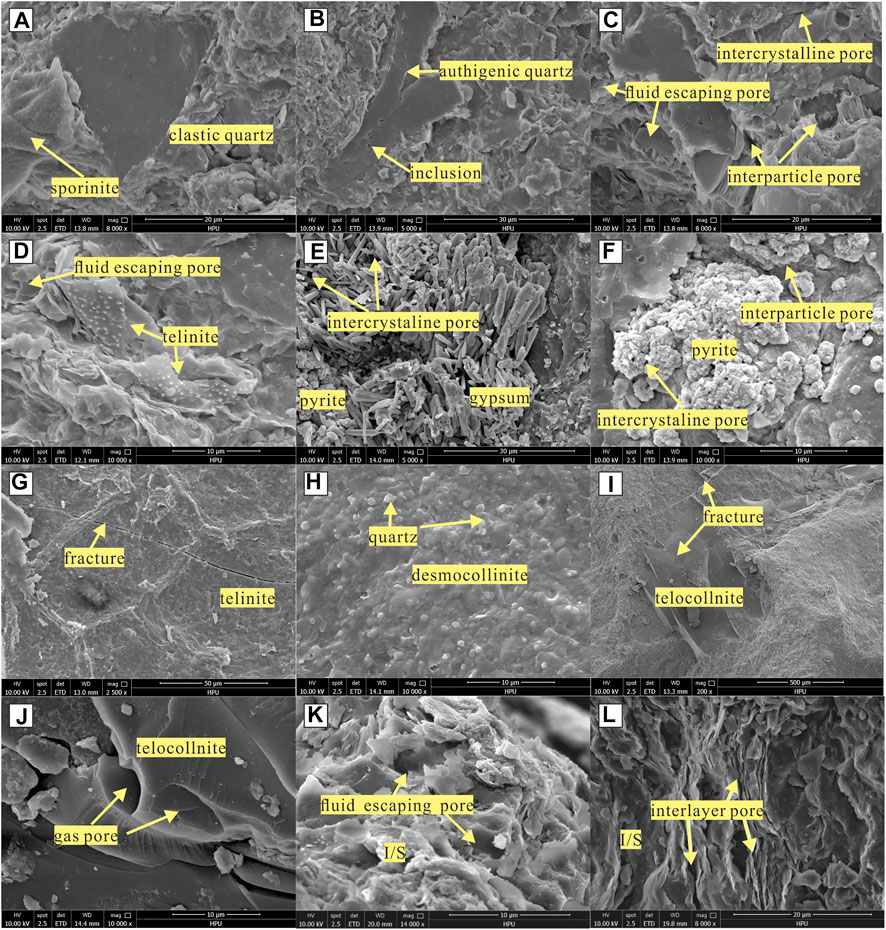
FIGURE 4. Field emission scanning electron microscope (FE-SEM) images of the coal measure shale samples.
Different types of pores were observed in the samples at the nanometer-scale to micrometer-scale, which are well-developed in the OM and clay minerals. The observations show that the OM pore is mostly globose, ellipsoid, and honeycomb-shaped between 5 and 2,000 nm in size (Figure 4I), and the natural fractures in the samples act as channels connecting the matrix pores (Figures 4G,I). Numerous fluid escaping, interlayer, intercrystalline, and interparticle pores are also developed in the clay minerals, and these pores, presenting mostly ellipsoid, band, and triangular shapes, are between about 5 and 1,000 nm in size and possess good connectivity. Fluid escaping, intercrystalline, and interparticle pores were observed in the kaolinite (Figures 4C,D), while fluid escaping and interlayer pores also commonly exist in the I/S (Figures 4K,L). Interparticle pores are well-developed between the clastic mineral grains, including quartz and feldspar, and have the size between 0.2 and 3 μm (Figure 4C). Meanwhile, the observations also show that the pyrite and gypsum contain intercrystalline pores (Figures 4E,F).
Mercury injection can measure the pores ranging from nanometer- to millimeter-scales which is conducive to explore the overall distribution characteristics of pores. The results show that the porosity of the coal measure shale samples ranges from 2.04% to 6.31% (avg. 3.38%), while the total pore volume ranges from 0.008 to 0.0249 cm3/g (avg. 0.0140 cm3/g), and the total SSA ranges from 0.9531 to 6.2959 m2/g (avg. 2.1897 m2/g) (Tables 2, 3).
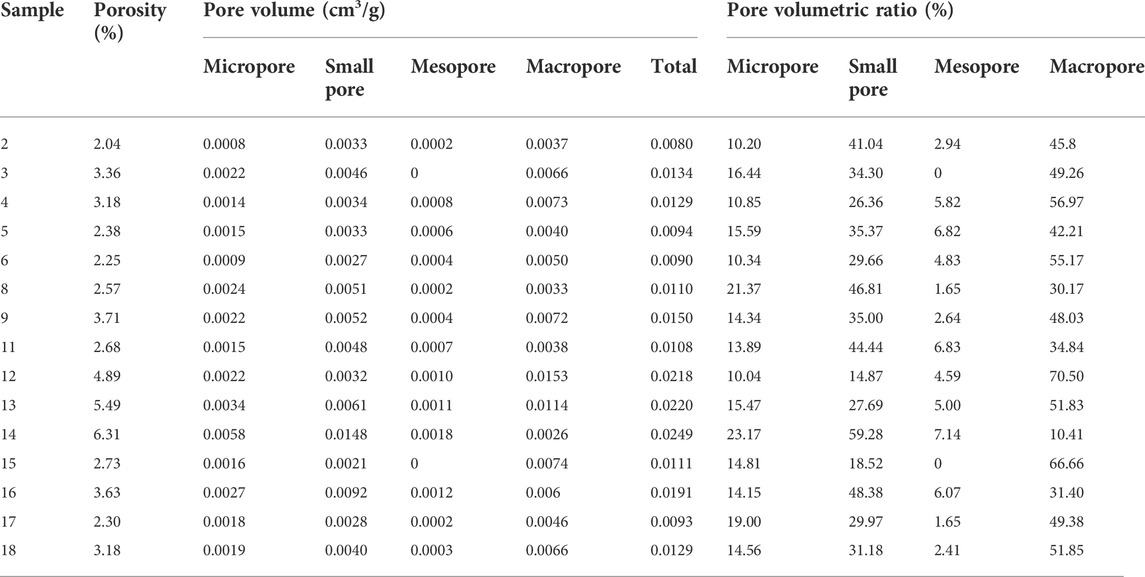
TABLE 2. Results of the porosity and pore volume distribution of the coal measure shale samples by the mercury injection test.
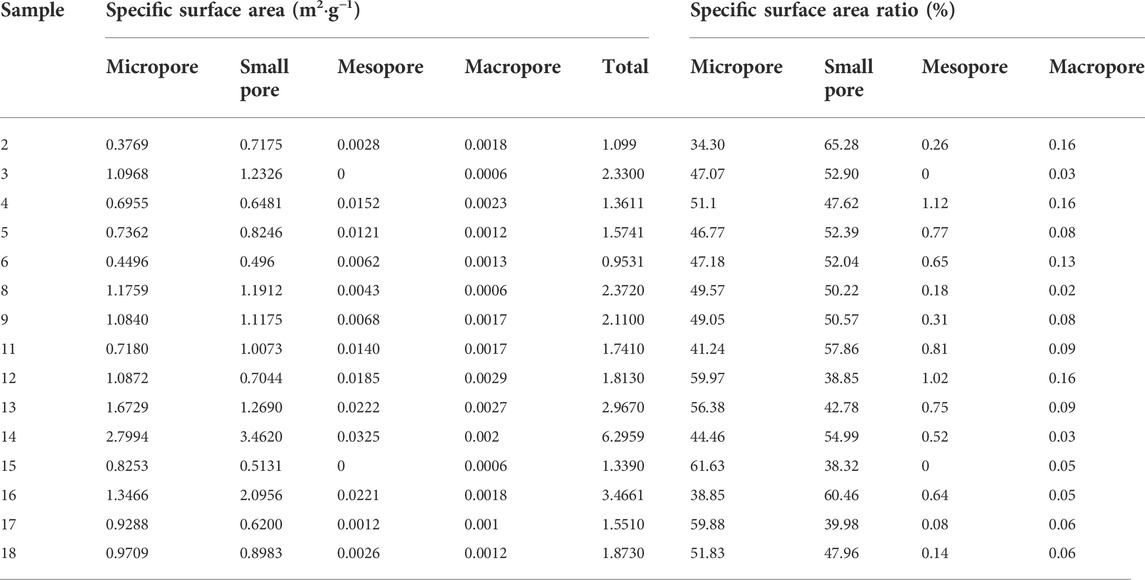
TABLE 3. Results of the specific surface area distribution of the coal measure shale samples by the mercury injection test.
The volumetric ratios of the micropores, small pores, mesopores, and macropores are 10.04%–21.37% (avg. 14.95%), 14.87%–59.28% (avg. 34.86%), 0%–7.14% (avg. 3.98%), and 10.41%–70.50% (avg. 46.30%), respectively, indicating that the macropores and small pores are the main contributors to the pore volume and provide the main spaces for the free gas (Table 2). Additionally, the SSA ratios of the micropores, small pores, mesopores, and macropores are 34.30%–61.63% (avg. 49.29%), 38.32%–65.28% (avg. 50.15%), 0%–1.12% (avg. 0.48%), and 0.02%–1.16% (avg. 0.08%), respectively, showing that the micropores and small pores are the main contributors of the SSA and impose more impact on shale gas adsorption (Table 3).
Also, the pore volume distributions can be classified into unimodal, bimodal, and multimodal types. In particular, the unimodal type only exists in individual silty mudstones, and the pore volume is mainly provided by the micropores and small pores. The mercury injection curve of the unimodal type increases quickly in the micropore and small pore regions, and the pore volume peak appears at about 10 nm diameter (Figure 5A). The bimodal type is observed in mudstones and partial silty mudstones and is mainly characterized by two peaks of pore volume, i.e., one at about 10 nm diameter and the other at the region of 10,000–100,000 nm diameter. Moreover, fewer pores exist within the 100–10,000 nm diameter range, where the mercury injection curve presents an increasing segment, and the pore volumetric ratio is lower than 5% (Figure 5B). The multimodal type is only observed in individual silty mudstones and shares similar features with the bimodal type, although the mesopore volume increases slightly in this type (Figure 5C). In addition, the SSA of the samples is mainly concentrated within the micropores and the small pores with the size of < 50 nm and presents unimodal characteristics (Figure 5).
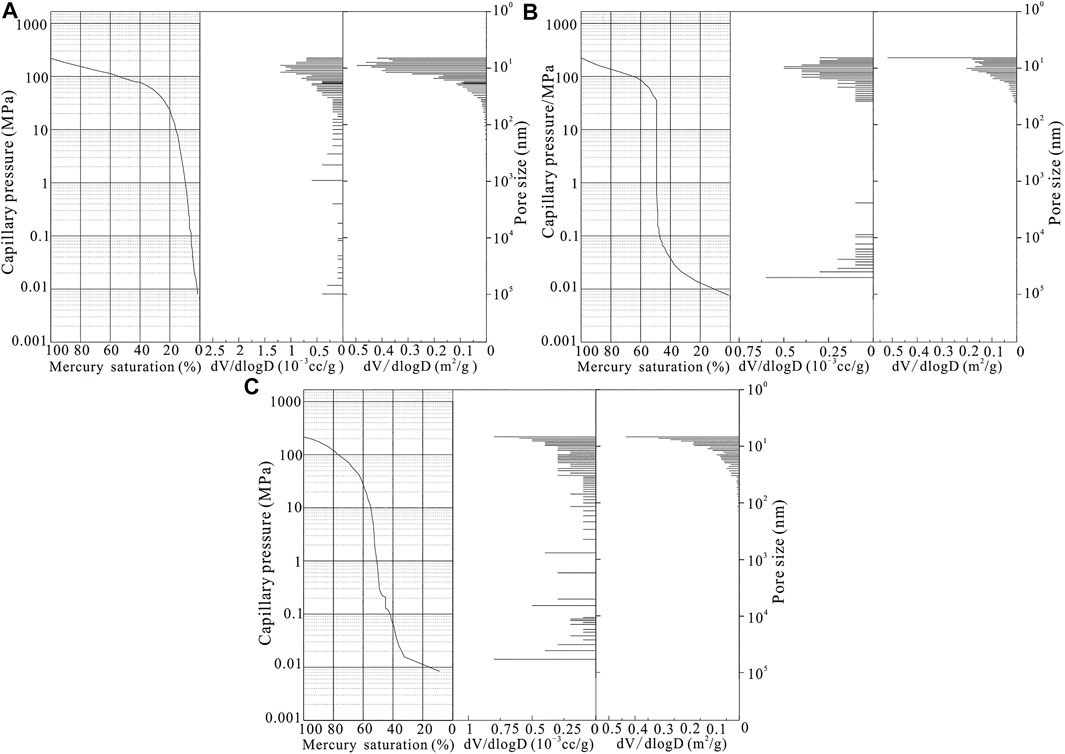
FIGURE 5. Mercury injection curves of the coal measure shale samples. (A) sample 14; (B) sample 3; (C) sample 13. V, pore volume; S, specific surface area; and D, pore size.
The low-temperature N2 adsorption test can quantitatively determine pore structural characteristics between 2 and 50 nm. It should be noted that the pores with the size of < 50 nm are the main contributor to the SSA according to the mercury injection test, and it would be helpful for clarifying the gas occurrence characteristics by conducting a more detailed study on these pores separately.
The Barrett–Joyner–Halenda (BJH) and Brunauer–Emmett–Teller (BET) methods were adopted to obtain the pore volume and SSA parameters, respectively (Gregg and Sing, 1982; Ross and Bustin, 2008). The results show that there are significant differences in the pore volume and SSA distributions of the pores with the size of lower or higher than 5 nm. Particularly, for pores with the size of 2–5 nm, the total pore volume is 0.0004–0.0061 cm3/g (avg. 0.0029 cm3/g), and the pore volumetric ratio is relatively low, i.e., 14.29%–36.22% (avg. 21.72%). Also, the total SSA of these pores is 0.5653–7.9056 m2/g (avg. 3.7765 m2/g), and the SSA ratio is 46.10%–67.63% (avg. 57.04%). For the pores with the size of 5–50 nm, the total pore volume and volumetric ratio are 0.0027–0.0131 cm3/g (avg. 0.0099 cm3/g) and 63.78%–85.71% (avg. 78.28%), respectively. The total SSA and SSA ratio of these pores are 0.6609–3.9798 m2/g (avg. 2.6612 m2/g) and 32.37%–53.90% (avg. 42.97%), respectively (Table 4). The aforementioned results indicate that as the pore size decreases, the complexity of the shale pore surface increases, resulting in more spaces for shale gas adsorption.
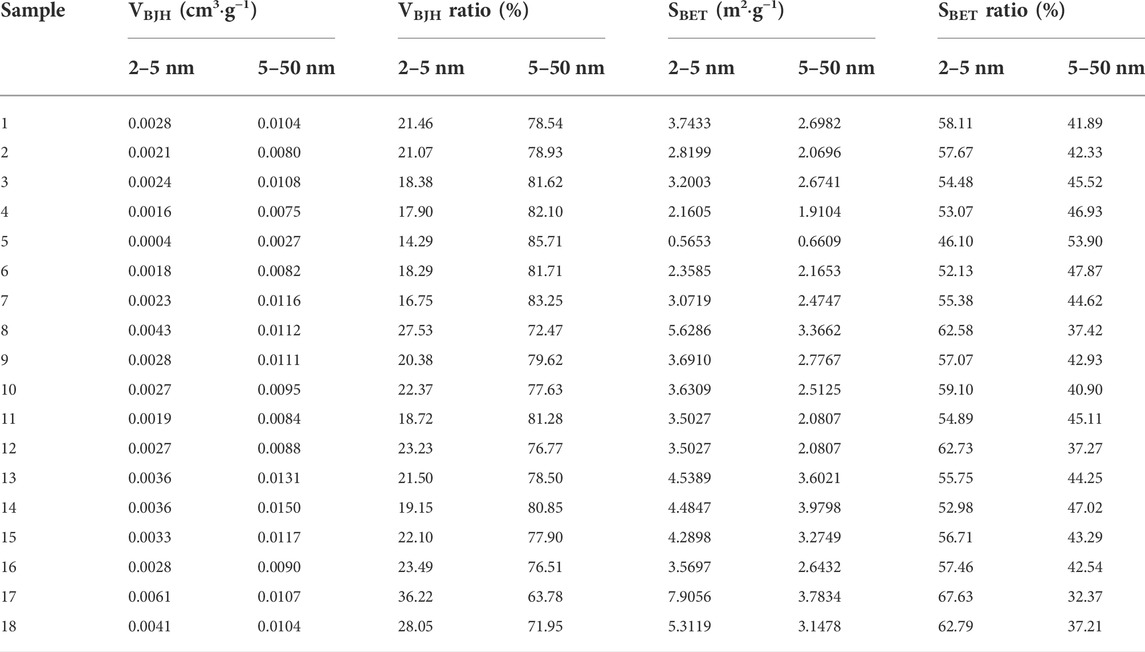
TABLE 4. Results of the pore volume, specific surface area, and their ratios of the coal measure shale samples by the low-temperature N2 adsorption test.
In addition, the pore structure characteristics of the coal measure shale exhibit universal regularity. Particularly, the pore volume increases slowly between the sizes of 2 and 5 nm and then rapidly increases between 5 and 50 nm (Figure 6A). A peak of the SSA appears at the pore size of about 3 nm, and the SSA decreases between the sizes of 3 and 5 nm and then slowly increases as the pore size increase until it reaches a peak at about 30 nm. After that, the SSA slowly decreases (Figure 6B).
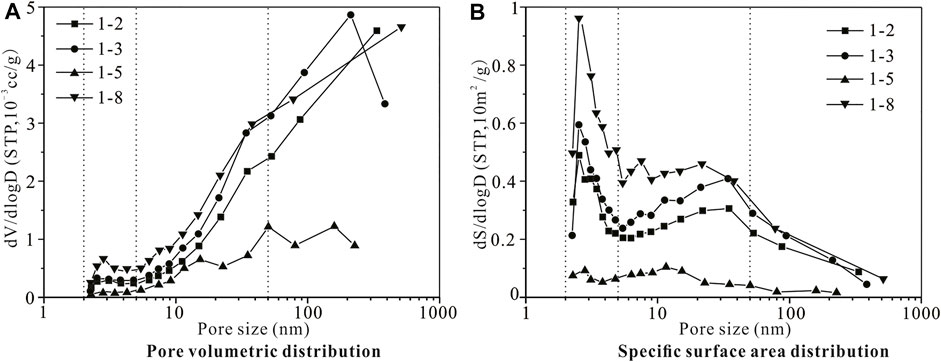
FIGURE 6. Pore volume and SSA distributions of the coal measure shale samples by the BJH and BET methods. (A) pore volumetric distribution; (B) pore SSA distribution. V—pore volume; S—SSA; D—pore size; and STP—standard temperature and pressure.
The N2 adsorption test can also provide a reference for characterization of the micropores with the size of < 2 nm, and the Saito–Foley (SF) theory is generally adopted to obtain the pore volume distributions. The results show that the lower limit of the pore size that can be detected is 0.7 nm, and the pore volume increases with the decrease of pore size in the range of 0.7–2 nm (Figure 7A). Given that the pore surface complexity tends to increase with the decrease of pore size, the SSA ratio of the pores might be higher as the pore size decreases.
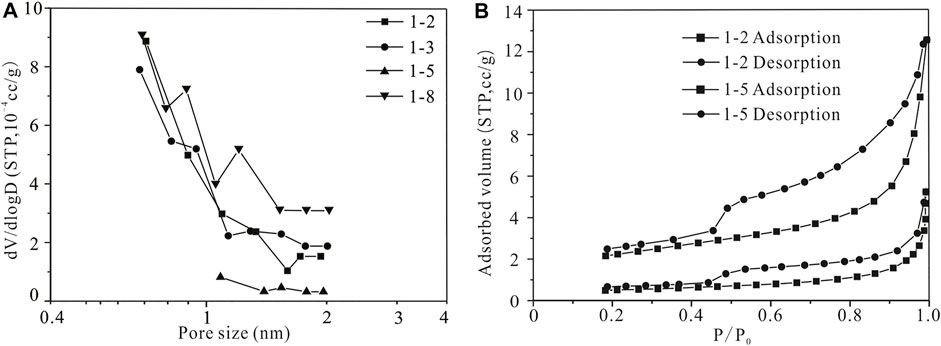
FIGURE 7. Pore volume distributions of micropore volume by N2 adsorption (A) and the N2 adsorption and desorption isotherm (B) of the shales. V—pore volume; D—pore size; and STP—standard temperature and pressure.
In addition, the International Union of Pure and Applied Chemistry (IUPAC) classified the gas adsorption isotherms into six types (i.e., Ӏ–VI) and the hysteresis loop into four types (i.e., H1–H4) (Ji et al., 2014). Accordingly, the adsorption and desorption isotherms of the coal measure shales can be classified as type II and H3, indicating that the slit-shaped pores are well-developed in the shales (Figure 7B). This is consistent with the observations by FE-SEM, of which the clay minerals in the shale samples develop numerous intercrystalline pores that belong to the slit-shaped pores.
The low-temperature CO2 adsorption test has been widely applied to evaluate the micropore structure characteristics when the pore size is lower than 2 nm. The Horvath–Kawazoe (HK) theory was employed to calculate the volume of micropores, and the Dubinin–Radushkevich (DR) and Dubinin–Astakhov (DA) equations were employed to calculate the SSA of micropores. The results show that under the test range of lower than 2 nm, the median value of the pore size is 0.8180–1.7216 nm (avg. 1.3558 nm), and the total pore volume is 0.0021–0.0079 cm3/g (avg. 0.0055 cm3/g), and the total SSAs calculated by the DR and DA equations are 5.1167–19.6384 m2/g (avg. 13.6109 m2/g) and 6.5152–25.9762 m2/g (avg. 17.3002 m2/g), respectively (Table 5). Thus, the total SSA of the pores with the size of < 2 nm is higher than that of the other pores, indicating they are important places for shale gas adsorption. In addition, the results show that there are significant differences in the pore volume distribution among the samples under the pore size of lower than 2 nm. For example, the pore volume of some samples is concentrated at the pores with the size of 0.5–1 nm, and the total pore volume is relatively low (e.g., samples 3 and 5 in Figure 8), while that of some other samples is mainly distributed in the pores with the size of 0.7–1.7 nm (e.g., samples 2 and 8 in Figure 8). However, the pore volume of all samples shows a general trend of decrease with the increase of pore size, and given the pore surface complexity change, it is speculated that the pore SSA also tends to decrease as the pore size increases.
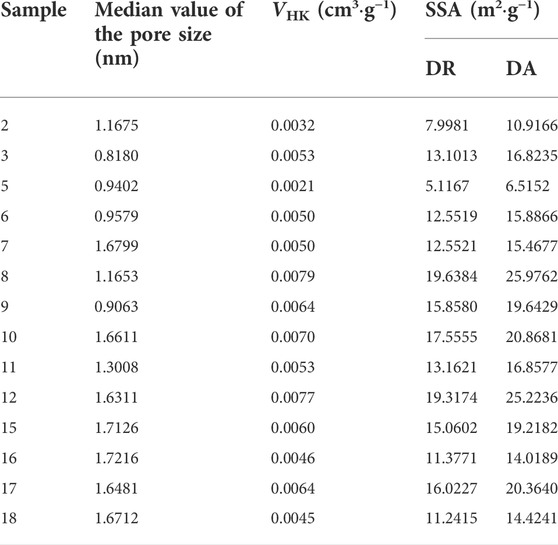
TABLE 5. Results of the pore volume and specific surface area of the coal measure shale samples by the low-temperature CO2 adsorption test.
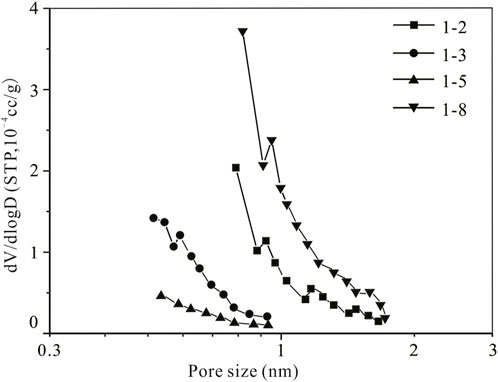
FIGURE 8. Pore volume distributions of the coal measure shale samples by the HF method. V—pore volume; D—pore size; STP—standard temperature and pressure.
Combining the aforementioned test results, the controlling factors of the shale pore structure are analyzed in this part. According to data statistics, the pore structure characteristics of different types of shales show certain differences. Among them, the porosity of carbonaceous mudstone is higher than that of others, while the volume and SSA of the mudstone and carbonaceous mudstone pores with the size of < 5 nm are higher than those of the siltstone and silty mudstone. This indicates that the shale composition has an important influence on pore structure characteristics, including organic matter, brittle, and clay minerals.
The results of correlation analysis between shale components and porosity and total SSA show that the TOC content is closely related to the porosity and total SSA. Particularly, when the TOC content is lower than 6%, both the porosity and total SSA possess a strong positive correlation with the TOC content, indicating that organic matter in shale plays an important role in shale pore development. However, when the TOC content is higher than 6%, this positive correlation disappears, and the porosity and total SSA show a decreasing trend with the increase of the TOC content. The reason is that the shale organic matter has plastic characteristics, and as the TOC content increases, the shale plasticity is enhanced, making the shale pores more susceptible to the compaction effect and more difficult to preserve. This has also been verified by Milliken et al. (2013), and the critical TOC content they found is 5.6%. In addition, the brittle and clay mineral contents have negative and positive correlations with the porosity, respectively, but poor correlation with the total SSA. The reason is that the brittle mineral, generally quartz in this area, constitutes the main rigid framework of shales, which can resist compaction stress and protect the pores (Zhao et al., 2017; Xi et al., 2019). However, the clay mineral has the characteristics of high plasticity and easy deformation and is easily squeezed into pores under the action of external force and reduces pore space. Also, when there is not enough brittle mineral to provide support, the increase of clay mineral content can lead to collapse of organic matter pores and interlayer pores of clay minerals, making the shale pores difficult to preserve (Figure 9) (Slatt and O’Brien, 2011).
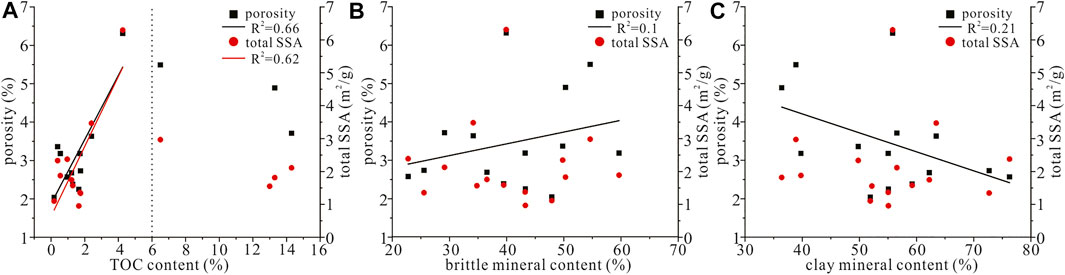
FIGURE 9. Plots showing the correlations of porosity and total SSA with TOC (A), brittle mineral, (B) and clay mineral (C) contents.
Furthermore, the relationships between the shale components and the pore structure at all levels are analyzed. The results show that when the TOC content is less than 6%, it has a positive correlation with the pore volume and SSA of the micropore, small pore, and mesopore measured by the mercury intrusion and the pores measured by the N2 and CO2 adsorptions, especially the pores of < 50 nm, indicating that the organic matter has a control effect on these pores, which is consistent with the previous research results (Pan et al., 2017; Zhang et al., 2019b; Ge et al., 2020; Yuan et al., 2021). However, under the influence of the compaction effect, the development of pores at all levels is limited when the TOC content is higher than 6%, and this effect tends to weaken as the pore size decreases (Figure 10).
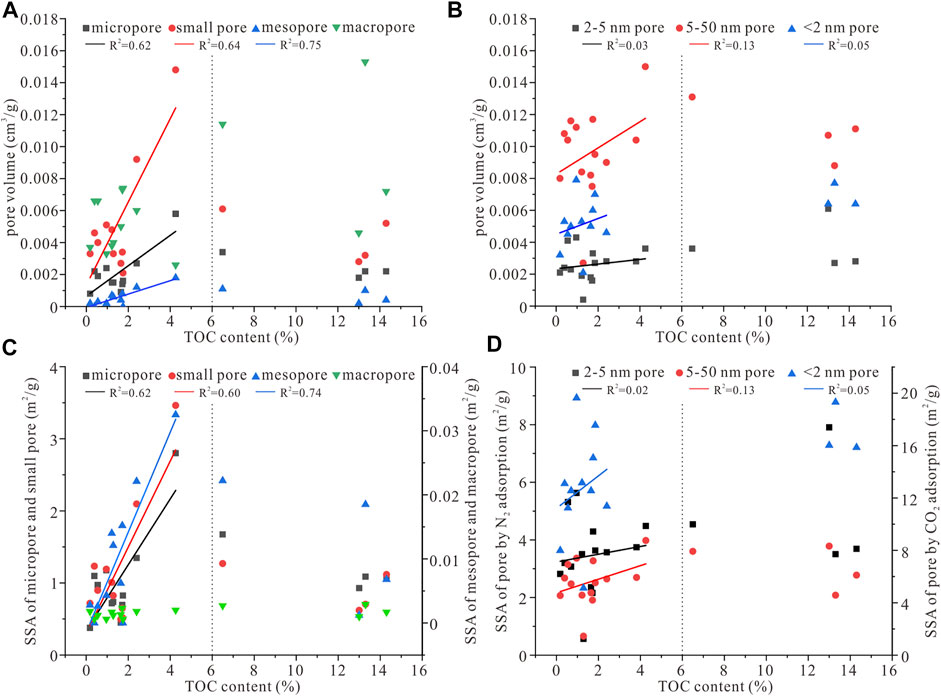
FIGURE 10. Plots showing the correlations of TOC content with pore volume and SSA by mercury injection (A,C) and N2 and CO2 adsorption (B,D).
The clay mineral content has a negative correlation with the pore volume and SSA of the mesopore and macropore, but it correlates poorly with those of the micropore and small pore. The reason is that the mesopore and macropore generally possess large apertures, and the clay mineral is more likely to enter and block these pores under the compaction effect, resulting in decrease of these pore spaces as there is an increase of clay mineral content. Also, the increase of clay mineral content can lead to a decrease of brittle mineral content, aggravating the compaction and pore blockage effects. However, the micropore and small pore are well-developed in clay minerals, and the volume and SSA of these pores tend to increase with the clay mineral content, which offsets some of the pore blockage effects. Additionally, the SSA of the micropore in organic matter is generally higher than that of the clay mineral (Xiong et al., 2017), weakening the correlations between the clay mineral content and the micropore SSA and the total SSA of the shale pore (Figure 11).
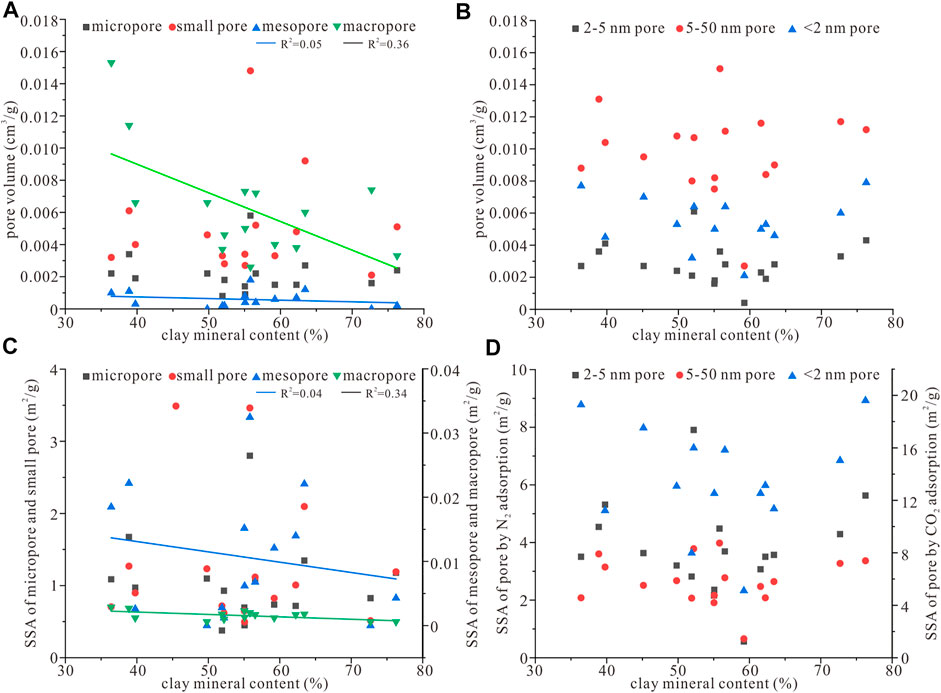
FIGURE 11. Plots showing the correlations of clay mineral content with pore volume and SSA by mercury injection (A,C) and N2 and CO2 adsorption (B,D).
In addition, the brittle mineral has a significant control effect on mesopore and macropore development, and the volume and SSA of these pores tend to increase with its content. For the micropore and small pore, when the brittle mineral content is lower than 45%, the pore volume and SSA tend to decrease with the increase of brittle mineral content. This is because an increase in the brittle mineral content will lead to a decrease in the total content of organic matter and clay minerals, which are the main providers of these pores. However, when the brittle mineral content is higher than 45%, the volume and SSA of the micropore and small pore tend to increase. The reason is that the support effect on the shale pores provided by the brittle mineral becomes significant for these pores, which is conducive to the maintenance of the pores in organic matter and clay minerals (Figure 12).
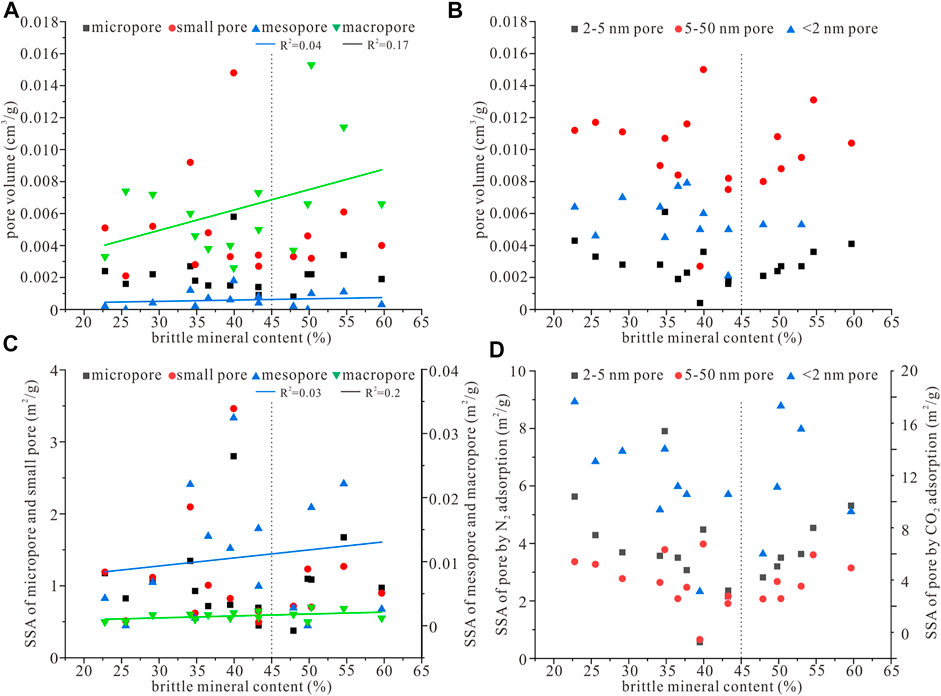
FIGURE 12. Plots showing the correlations of brittle mineral content with pore volume and SSA by mercury injection (A,C) and N2 and CO2 adsorption (B,D).
In this study, the coal measure shales of the Xiashihezi Formation in the Sunan Syncline block are taken as a research object, and its pore structure characteristics are systematically studied through experiments such as XRD, FE-SEM, mercury intrusion, and low-temperature N2 and CO2 adsorption. The main conclusions are as follows:
1. Four types of coal measure shales have been observed in the Xiashihezi Formation. Among them, the carbonaceous mudstone, characterized by high TOC content, has the highest porosity, and the pore volume and SSA of the mudstone and carbonaceous mudstone with the pore size of less than 5 nm are higher than those of the siltstone and silty mudstone.
2. The pore SSA of the coal measure shale is mainly concentrated in the micropores and small pores with the size of < 50 nm, and that of the micropores with the size of < 5 nm is significantly higher, indicating these pores have an important effect on gas adsorption. The matrix pores with the size of about 10 nm make significant contributions to pore volume and provide great spaces for free gas.
3. When the TOC content is lower than 6%, it has a strong positive correlation with the pore volume and total SSA of the shales. However, this positive correlation disappears when it is higher than 6% under the enhancement of the compaction effect, while the brittle and clay mineral contents have negative and positive correlations with the porosity, respectively, but poor correlation with the total SSA.
4. The organic matter has a control effect on the micropore, small pore, and mesopore of the shales and the volume as well as SSA of these pores increase with the TOC content (<6%). The clay mineral content has negative correlations with the volume and SSA of the mesopore and macropore under the compaction and pore blockage effects but correlates poorly with those of the micropore and small pore. In addition, the brittle mineral promotes the development of mesopore and macropore and is conducive to the micropore and small pore maintenance when the content is higher than 45%.
The original contributions presented in the study are included in the article/Supplementary Material; further inquiries can be directed to the corresponding authors.
QW: methodology, investigation, writing—original draft, and writing—review and editing. XS: conceptualization, project administration, funding acquisition, and supervision. YJ: data curation and writing—review and editing. PC: methodology and writing—original draft. WZ: methodology and investigation. SY: writing—review and editing.
This work was supported by the Science and Technology Major Project of Shanxi Province (20191102001), the National Natural Science Foundation of China (42202209), the Natural Science Foundation for Young Scientists of Henan Province, China (222300420173), the China Postdoctoral Science Foundation (2022M711055), and the State Key Laboratory Cultivation Base for Gas Geology and Gas Control (Henan Polytechnic University) (WS2021B13).
The authors declare that the research was conducted in the absence of any commercial or financial relationships that could be construed as a potential conflict of interest.
All claims expressed in this article are solely those of the authors and do not necessarily represent those of their affiliated organizations, or those of the publisher, the editors, and the reviewers. Any product that may be evaluated in this article, or claim that may be made by its manufacturer, is not guaranteed or endorsed by the publisher.
Cao, L., and Guo, Y. (2020). Study on pore structure characteristics of mud shale in Wuxiang Block of eastern Qinshui Basin. Coal Sci. Technol. 48 (4), 230–236. doi:10.13199/j.cnki.cst.2020.04.027
Cao, D., Yao, Z., and Li, J. (2014). Evaluation status and development trend of unconventional gas in coal measure. Coal Sci. Technol. 42, 89–92. doi:10.13199/j.cnki.cst.2014.01.021
Cao, Q., Zhou, W., Deng, H., and Chen, W. (2015). Classification and controlling factors of organic pores in continental shale gas reservoirs based on laboratory experimental results. J. Nat. Gas Sci. Eng. 27, 1381–1388. doi:10.1016/j.jngse.2015.10.001
Chen, Q., Zhang, J., Tang, X., Li, W., and Li, Z. (2016). Relationship between pore type and pore size of marine shale: An example from the Sinian–Cambrian formation, upper Yangtze region, South China. Int. J. Coal Geol. 158, 13–28. doi:10.1016/j.coal.2016.03.001
Chen, L., Jiang, Z., Liu, K., Tan, J., Gao, F., and Wang, P. (2017). Pore structure characterization for organic-rich lower silurian shale in the upper yangtze platform, south China: A possible mechanism for pore development. J. Nat. Gas Sci. Eng. 46, 1–15. doi:10.1016/j.jngse.2017.07.009
Clarkson, C. R., Solano, N., Bustin, R. M., Bustin, A., Chalmers, G., He, L., et al. (2013). Pore structure characterization of North American shale gas reservoirs using USANS/SANS, gas adsorption, and mercury intrusion. Fuel 103, 606–616. doi:10.1016/j.fuel.2012.06.119
Fishman, N. S., Hackley, P. C., Lowers, H. A., Hill, R. J., Egenhoff, S. O., Eberl, D. D., et al. (2012). The nature of porosity in organic-rich mudstones of the upper jurassic kimmeridge clay formation, north sea, offshore United Kingdom. Int. J. Coal Geol. 103, 32–50. doi:10.1016/j.coal.2012.07.012
Ge, T., Pan, J., Wang, K., Liu, W., Mou, P., and Wang, X. (2020). Heterogeneity of pore structure of late Paleozoic transitional facies coal-bearing shale in the Southern North China and its main controlling factors. Mar. Petroleum Geol. 122, 104710. doi:10.1016/j.marpetgeo.2020.104710
Gregg, S. J., and Sing, K. S. W. (1982). Adsorption, surface area and porosity. New York: American Academic Press.
Gui, H., and Chen, S. (2016). Isotopic geochemical characteristics of groundwater and its geological significance in Sunan mining area. Earth Sci. Front. 3, 133–139. doi:10.13745/j.esf.2016.03.017
Ji, W., Song, Y., Jiang, Z., Wang, X., Bai, Y., and Xing, J. (2014). Geological controls and estimation algorithms of lacustrine shale gas adsorption capacity: A case study of the triassic strata in the southeastern Ordos Basin, China. Int. J. Coal Geol. 134–135 (1), 61–73. doi:10.1016/j.coal.2014.09.005
Josh, M., Esteban, L., Delle Piane, C., Sarout, J., Dewhurst, D., and Clennell, M. (2012). Laboratory characterisation of shale properties. J. Petroleum Sci. Eng. 88, 107–124. doi:10.1016/j.petrol.2012.01.023
Ko, L. T., Ruppel, S. C., Loucks, R. G., Hackley, P. C., Zhang, T., and Shao, D. (2018). Pore-types and pore-network evolution in Upper Devonian-Lower Mississippian Woodford and Mississippian Barnett mudstones: Insights from laboratory thermal maturation and organic petrology. Int. J. Coal Geol. 190, 3–28. doi:10.1016/j.coal.2017.10.001
Li, X., Kang, Y., and Haghighi, M. (2018). Investigation of pore size distributions of coals with different structures by nuclear magnetic resonance (NMR) and mercury intrusion porosimetry (MIP). Measurement 116, 122–128. doi:10.1016/j.measurement.2017.10.059
Li, X., Zhang, J., Wang, Y., Guo, M., Wang, Z., and Wang, F. (2018). Accumulation condition and favorable area evaluation of shale gas from the Niutitang Formation in northern Guizhou, South China. J. Nat. Gas Geoscience 3, 1–10. doi:10.1016/j.jnggs.2018.03.001
Liu, H., Tong, L., and Yan, J., (2016). Controlling effect of geological structure on the thickness variation of 72 coal seam in Sunan mining area. Coal Geol. Explor. 44, 24–28. doi:10.3969/j.issn.1001-1986.2016.02.005
Liu, K., Ostadhassan, M., Zhou, J., Gentzis, T., and Rezaee, R. (2017). Nanoscale pore structure characterization of the Bakken shale in the USA. Fuel 209, 567–578. doi:10.1016/j.fuel.2017.08.034
Middleton, R. S., Gupta, R., Hyman, J. D., and Viswanathan, H. S. (2017). The shale gas revolution: Barriers, sustainability, and emerging opportunities. Appl. energy 199, 88–95. doi:10.1016/j.apenergy.2017.04.034
Milliken, K. L., Rudnicki, M., Awwiller, D. N., and Zhang, T. (2013). Organic matter-hosted pore system, marcellus formation (devonian), Pennsylvania. Am. Assoc. Pet. Geol. Bull. 97 (2), 177–200. doi:10.1306/07231212048
Pan, J., Peng, C., Wan, X., Zheng, D., Lv, R., and Wang, K. (2017). Pore structure characteristics of coal-bearing organic shale in Yuzhou coalfield, China using low pressure N2, adsorption and FESEM methods. J. Petroleum Sci. Eng. 153, 234–243. doi:10.1016/j.petrol.2017.03.043
Ross, D. J. K., and Bustin, R. M. (2008). Characterizing the shale gas resource potential of Devonian–Mississippian strata in the Western Canada sedimentary basin: Application of an integrated formation evaluation. Am. Assoc. Pet. Geol. Bull. 92 (1), 87–125. doi:10.1306/09040707048
Schmitt, M., Fernandes, C. P., da Cunha Neto, J. A. B., Wolf, F. G., and dos Santos, V. S. (2013). Characterization of pore systems in seal rocks using nitrogen gas adsorption combined with mercury injection capillary pressure techniques. Mar. Petroleum Geol. 39 (1), 138–149. doi:10.1016/j.marpetgeo.2012.09.001
Slatt, R. M., and O'Brien, N. R. (2011). Pore types in the Barnett and Woodford gas shales: Contribution to understanding gas storage and migration pathways in fine-grained rocks. Am. Assoc. Pet. Geol. Bull. 95 (12), 2017–2030. doi:10.1306/03301110145
Song, Y., Jiang, B., Li, F., and Jiegang, L. (2017). Structure and fractal characteristic of micro-and meso-pores in low, middle-rank tectonic deformed coals by CO2 and N2 adsorption. Microporous Mesoporous Mater. 253, 191–202. doi:10.1016/j.micromeso.2017.07.009
Su, X., Wang, Q., Lin, H., Song, J., and Guo, H. (2018). A combined stimulation technology for coalbed methane wells: Part 2. Application. Fuel 233, 539–551. doi:10.1016/j.fuel.2018.06.086
Su, X., Wang, Q., Lin, H., Song, J., and Guo, H. (2018). A combined stimulation technology for coalbed methane wells: Part 1. Theory and technology. Fuel 233, 592–603. doi:10.1016/j.fuel.2018.06.087
The Chinese Standard of Petroleum and Natural Gas Industry (2010). Analysis method for clay minerals. Beijing: The Chinese Standard of Petroleum and Natural Gas Industry. SY/T 5163-2010.
The Chinese Standard of Petroleum and Natural Gas Industry (2014). Analytical method of rock sample by scanning electron microscope. Beijing: The Chinese Standard of Petroleum and Natural Gas Industry. SY/T 5162–2014.
The National Standard of the People’s Republic of China (2003). Determination of total organic carbon in sedimentary rock. Beijing: The National Standard of the People’s Republic of China. GB/T 19145-2003.
The National Standard of the People’s Republic of China (2008a). Pore size distribution and porosity of solid materials by mercury porosimetry and gas adsorption—Part 1: Mercury porosimetry. Beijing: The National Standard of the People’s Republic of China. GB/T 21650.1-2008.
The National Standard of the People’s Republic of China (2008b). Pore size distribution and porosity of solid materials by mercury porosimetry and gas adsorption—Part 2: Analysis of mesopores and macropores by gas adsorption. Beijing: The National Standard of the People’s Republic of China. GB/T 21650.2-2008.
The National Standard of the People’s Republic of China (2011). Pore size distribution and porosity of solid materials by mercury porosimetry and gas adsorption—Part 3: Analysis of micropores by gas adsorption. Beijing: The National Standard of the People’s Republic of China. GB/T 21650.3-2011.
Wang, D., Shao, L., Li, Z., Li, M. p., Lv, D., and Liu, H. (2016). Hydrocarbon generation characteristics, reserving performance and preservation conditions of continental coal measure shale gas: A case study of mid-jurassic shale gas in the yan’an Formation, Ordos Basin. J. Petroleum Sci. Eng. 145, 609–628. doi:10.1016/j.petrol.2016.06.031
Wang, Y., Pu, J., Wang, L., Jiang, Z., Song, Y. F., Wang, C. C., et al. (2016). Characterization of typical 3D pore networks of Jiulaodong formation shale using nano-transmission X-ray microscopy. Fuel 170, 84–91. doi:10.1016/j.fuel.2015.11.086
Wang, Z., Wagner, J., Ghosal, S., Bedi, G., and Wall, S. (2017). SEM/EDS and optical microscopy analyses of microplastics in ocean trawl and fish guts. Sci. Total Environ. 603, 616–626. doi:10.1016/j.scitotenv.2017.06.047
Wang, Q., Su, X., Su, L., and Zhou, F. (2020). CBM geological characteristics and exploration potential in the Sunan Syncline block, southern north China basin. J. Petroleum Sci. Eng. 186, 106713. doi:10.1016/j.petrol.2019.106713
Wang, Y., Liu, L., and Cheng, H. (2021). Gas adsorption characterization of pore structure of organic-rich shale: Insights into contribution of organic matter to shale pore network. Nat. Resour. Res. 30 (3), 2377–2395. doi:10.1007/s11053-021-09817-5
Wei, C., Jiang, B., and Fu, X., (2007). Numerical simulation on geological evolution history of coalbed methane in Sunan Syncline area. Acta Pet. Sin. 28 (1), 54–57. doi:10.7623/syxb200701010
Wei, Z., Wang, Y., Wang, G., Sun, Z., and Xu, L. (2018). Pore characterization of organic-rich late permian da-long formation shale in the sichuan basin, southwestern China. Fuel 211, 507–516. doi:10.1016/j.fuel.2017.09.068
Xi, Z., Tang, S., Li, J., Zhang, Z., and Xiao, H. (2019). Pore characterization and the controls of organic matter and quartz on pore structure: Case study of the Niutitang Formation of northern Guizhou Province, South China. J. Nat. Gas Sci. Eng. 61, 18–31. doi:10.1016/j.jngse.2018.11.001
Xiong, F., Jiang, Z., Li, P., Wang, X., Bi, H., Li, Y., et al. (2017). Pore structure of transitional shales in the Ordos Basin, NW China: Effects of composition on gas storage capacity. Fuel 206, 504–515. doi:10.1016/j.fuel.2017.05.083
Yuan, Y., Li, Z., and Zhong, M., (2021). Pore structure characteristics of Taiyuan formation coal measures shale in south central Qinshui Basin. Coal Sci. Technol. 49 (9), 184–192. doi:10.13199/j.cnki.cst.2021.09.026
Zhang, Y., Shao, D., Yan, J., Jia, X., Li, Y., Yu, P., et al. (2016). The pore size distribution and its relationship with shale gas capacity in organic-rich mudstone of Wufeng-Longmaxi Formations, Sichuan Basin, China. J. Nat. Gas Geoscience 1 (3), 213–220. doi:10.1016/j.jnggs.2016.08.002
Zhang, X., Si, Q., and Zuo, Z., (2016). Characteristics and the main controlling factors of pore structure in the continental coal-shale gas reservoirs. Acta Geol. Sin. 90 (10), 2930–2938. doi:10.3969/j.issn.0001-5717.2016.10.028
Zhang, J., Li, X., Wei, Q., Gao, W., Liang, W., Wang, Z., et al. (2017). Quantitative characterization of pore-fracture system of organic-rich marine-continental shale reservoirs: A case study of the upper permian longtan formation, southern sichuan basin, China. Fuel (Lond). 200, 272–281. doi:10.1016/j.fuel.2017.03.080
Zhang, Y., Liu, J., and Xu, H., (2017). Comparison between pore structure and fractal characteristics of continental and transitional coal measures shale: A case study of yan’an and taiyuan formations at the northeastern margin of Ordos Basin. Acta Pet. Sin. 38 (9), 1036–1046. doi:10.7623/syxb201709005
Zhang, J., Wei, C., Ju, W., Yan, G., Lu, G., Hou, X., et al. (2019). Stress sensitivity characterization and heterogeneous variation of the pore-fracture system in middle-high rank coals reservoir based on NMR experiments. Fuel 238, 331–344. doi:10.1016/j.fuel.2018.10.127
Zhang, M., Fu, X., Zhang, Q., and Cheng, W. (2019). Research on the organic geochemical and mineral composition properties and its influence on pore structure of coal-measure shales in Yushe-Wuxiang Block, South Central Qinshui Basin, China. J. Petroleum Sci. Eng. 173, 1065–1079. doi:10.1016/j.petrol.2018.10.079
Zhang, J., Tang, Y., He, D., Sun, P., and Zou, X. (2020). Full-scale nanopore system and fractal characteristics of clay-rich lacustrine shale combining FE-SEM, nano-CT, gas adsorption and mercury intrusion porosimetry. Appl. Clay Sci. 196, 105758. doi:10.1016/j.clay.2020.105758
Zhao, J., Jin, Z., Jin, Z., Hu, Q., Hu, Z., Du, W., et al. (2017). Mineral types and organic matters of the Ordovician-Silurian Wufeng and Longmaxi Shale in the Sichuan Basin, China: Implications for pore systems, diagenetic pathways, and reservoir quality in fine-grained sedimentary rocks. Mar. Petroleum Geol. 86, 655–674. doi:10.1016/j.marpetgeo.2017.06.031
Zhao, S., Li, Y., Wang, Y., Ma, Z., and Huang, X. (2019). Quantitative study on coal and shale pore structure and surface roughness based on atomic force microscopy and image processing. Fuel 244, 78–90. doi:10.1016/j.fuel.2019.02.001
Keywords: Sunan Syncline Block, Xiashihezi formation, coal measure shale, pore structure, coal measure gas development
Citation: Wang Q, Su X, Jin Y, Chen P, Zhao W and Yu S (2022) Pore structure characterization for coal measure shales of the Xiashihezi Formation in the Sunan Syncline block, southern North China basin. Front. Earth Sci. 10:1017429. doi: 10.3389/feart.2022.1017429
Received: 12 August 2022; Accepted: 07 September 2022;
Published: 23 September 2022.
Edited by:
Junjian Zhang, Shandong University of Science and Technology, ChinaReviewed by:
Xuguang Dai, China University of Mining and Technology, ChinaCopyright © 2022 Wang, Su, Jin, Chen, Zhao and Yu. This is an open-access article distributed under the terms of the Creative Commons Attribution License (CC BY). The use, distribution or reproduction in other forums is permitted, provided the original author(s) and the copyright owner(s) are credited and that the original publication in this journal is cited, in accordance with accepted academic practice. No use, distribution or reproduction is permitted which does not comply with these terms.
*Correspondence: Xianbo Su, c3V4aWFuYm9AaHB1LmVkdS5jbg==; Peihong Chen, OTE2MjY5NzU1QHFxLmNvbQ==
Disclaimer: All claims expressed in this article are solely those of the authors and do not necessarily represent those of their affiliated organizations, or those of the publisher, the editors and the reviewers. Any product that may be evaluated in this article or claim that may be made by its manufacturer is not guaranteed or endorsed by the publisher.
Research integrity at Frontiers
Learn more about the work of our research integrity team to safeguard the quality of each article we publish.