 Pin Jia
 Hongxin Guo1,2
- 1State Key Laboratory of Petroleum Resources and Prospecting, China University of Petroleum, Beijing, China
- 2College of Petroleum Engineering, China University of Petroleum, Beijing, China
Carbonate reservoirs are rich in oil and gas reserves; thus, they have great exploitation potential. Therefore research on the microscopic mechanisms of carbonate reservoirs is of great significance. Based on the thin section images of core castings of typical Well 555 and its pore and fracture features in actual reservoirs, this study designed three kinds of images representing the pore and throat structure of real rocks by applying image stitching and binarization processing methods. A microscopic pore model of carbonate rocks was then established using COMSOL numerical simulation software. The microscopic water flooding characteristics and residual oil distributions of different schemes were observed by designing different fracture development forms. The fractures that developed in parallel main lines showed a more obvious influence on water flooding characteristics compared to fractures that developed in vertical main lines. The cluster residual oil was the main residual oil type in the early stage of water flooding in the pure matrix model. With the progress of water flooding, the continuous cluster residual oil gradually turned into mainly discontinuous porous and columnar residual oils. Vertical mainline fractures reduced the amount of residual oil in clusters and replaced it with columnar residual oil. In contrast, parallel main line fractures expanded the unswept area, with the residual oil appearing in contiguous clusters. This study microscopically analyzed the law and characteristics of water flooding in carbonate reservoirs to provide key theoretical support for enhancing oil recovery.
Introduction
Approximately 40% of the world’s total oil and gas reserves are carbonate reservoirs, with oil and gas production accounting for about 60% of the total production (Roehl and Choquette, 1985a; Roehl and Choquette, 1985b). By the end of 2013, 2P recoverable reserves of oil and gas in marine carbonate rocks accounted for approximately 37.3% of the global total recoverable reserves (Roehl and Choquette, 1985a; Roehl and Choquette, 1985b). Globally, carbonate reservoirs are mainly distributed in the northern hemisphere (Roehl and Choquette, 1985a; Roehl and Choquette, 1985b). Carbonate rocks are sedimentary rocks composed of carbonate minerals (calcite-calcium carbonate mineral, dolomite-calcium, and magnesium carbonate). Carbonate reservoirs are mainly composed of primary matrix pores and secondary fractures, pores, and caves including pore, karst cave, fracture, and pore types, as well as fracture-karst cave, pore-fracture, and fracture-pore types. Many scholars have studied the waterflooding development methods of carbonate rocks, including pressure retaining exploitation, steam huff and puff, combined top gas and edge water injection, bottom injection, and top production (buoyancy support), and well patterns with some strong areas and weak surfaces (Xue et al., 2016; Cui, 2018; Song and Li, 2018; Yuan et al., 2021). However, research is lacking on the microscopic mechanisms, which can guide understanding of the impact of pore structure changes on water flooding development to help inform the further development of residual oil.
Many experimental methods have been proposed to microscopically explore water flooding, including etching glass and other physical methods to characterize the microscopic pore structure. Some studies have applied the digital core method to scan the core, followed by numerical simulation to produce three-dimensional models of the cores to quantitatively analyze the water flooding process and draw corresponding conclusions.
The physical model of etched glass was first described in the 1950s to observe microscopic phenomena. In the early 1960s, Mattax and Kyte reported improved methods for observing microscopic displacement details and developed the first etched glass network model. Later, Davis and Jonesl improved the etched glass microscopic model by using photosensitive technology. In 1977, Bonnet and Lenormand reported a resin technique to control the network geometry. Mckellar and Wardlar then introduced the technique for making micro-models using glass mirrors. The 2D micro-model made by etching glass is the most common method reported in the literature. The pore structure of the micro-model prepared in this way is basically the same as that of the actual core; therefore, the experimental results are of more practical significance (Li, 1996). Using the simulation micro-model, Guo et al. (1990) reported that bound water mainly existed in three states in the hydrophilic: in the narrow throat; as a "dead end" with no exit, and as a film on the pore wall, especially on rough pore surfaces. In the oil-philic model, bound water mainly existed as granules or islands in large pores. In addition, Donalolson et al. used the etched glass model to analyze the distribution of residual oil. While it is not possible to measure production and other data or to analyze the characteristics of water flooding through physical experiments, microscopic numerical simulations may be able to overcome these challenges.
Regarding microscopic numerical simulation, previous studies have proposed the establishment of digital cores constructed using two general methods: physical experiments and numerical reconstruction (He). In the physical experiment method, the focused scanning method is used to inject stained epoxy resin into the pores of the core. A focusing scanner is then applied to scan the core section point by point, record the reflection of the light from the epoxy resin, and obtain the core image (Zhao, 2009). Although this approach can provide high-resolution images of two-dimensional cores, the experimental time is long and the pore structure of the cores is damaged (Zhang et al., 2012), which is not conducive for practical application. The CT scanning method can be used to distinguish the composition and spatial structure of core particles according to the different X-ray absorption characteristics of core components based on their densities, which allows the determination of the matrix and the pores of the core (Sheng et al., 2005). By constructing a digital pore network model, Zhao established a digital pore network model of asymmetric corrugated pore channels according to the actual core pore structure by considering the non-equidimensional characteristics of the pore-throat space. Du (2019) used micro-CT imaging and Avizo software to reconstruct the core in three dimensions, obtain the two-dimensional axial profile, and conduct numerical simulation analysis using COMSOL software.
In the study of microscopic water flooding law and residual oil, Mo et al. (2015) used CT imaging technology to analyze the microscopic pore structure and slow water flooding characteristics of low-permeability sandstone cores, and discussed the influence of limited water and flow rate on water-flooding characteristics of this material. Ouyang et al. (2019) analyzed the influence of factors such as permeability, pore-throat radius, structural seepage coefficient, and movable fluid saturation on oil displacement through the microscopic model of actual sandstone. Kang et al. (2019) also used a real sandstone model to study the microscopic water flooding characteristics of an actual reservoir and the residual oil occurrence under the two influencing factors of rock pore structure and clay wettability. However, quantitative analyses are limited regarding the types of residual oil and the reasons for the changes of microscopic residual oil in the process of water injection, which are critical for the re-development of residual oil.
The present study used COMSOL to establish a carbonate pore model. To explore the impact of fracture development patterns on water flooding characteristics and residual oil distribution of carbonate rocks, the design included pure matrix, vertical main line fracture, and parallel main line fracture models. The characteristics of water flooding under different schemes were analyzed from the perspectives of oil production, water production, injection pressure, and oil displacement efficiency. Finally, the formation mechanism of microscopic residual oil, residual oil types, and distribution rules of different schemes were analyzed and the effects of fracture morphology on residual oil distribution were studied.
Establishment and scheme design of the microscopic pore model
Scheme design and image processing
The carbonate reservoirs used in this study were based on the typical wells determined by casting thin sections, observing the casting thin sections, and selecting the appropriate test results of typical images (Figure 1). The image mosaicking and binarization processing method was used to design three representative rock pore-throat structure images (Figure 2); namely, the pure matrix type, vertical mainstream lines, and cracks parallel to the main line.
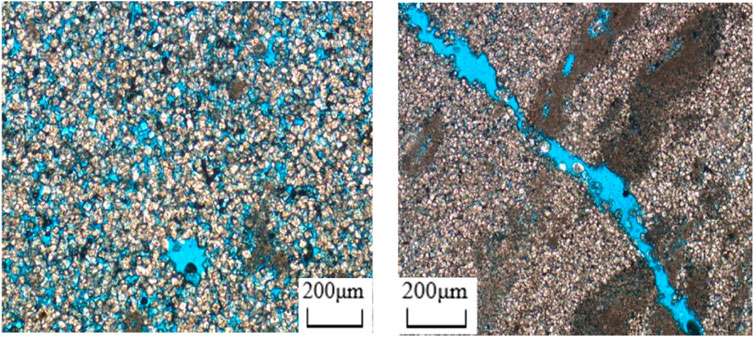
FIGURE 1. Thin section of the cast.
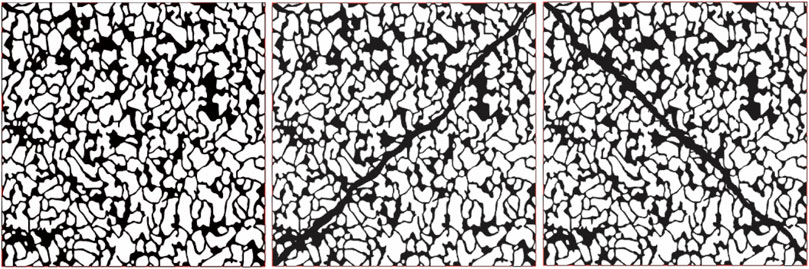
FIGURE 2. Binarization image.
In COMSOL, water flooding was designed to be injected from the lower right pore-throat of the model and extracted from the upper left pore-throat. The water flooding characteristics and residual oil distribution were then observed. To obtain vectorized graphics, Algolab Photo Vector software was used for image processing (Figure 2). After processing, the identified pore contour was more accurate and the original pore structure could be restored, which reduced the subsequent graphics processing in COMSOL.
Physical field selection
We generally assume that the micropore fluid flow in laminar flow relatively conforms to Darcy’s law. Considering that the object this study was two-phase oil-water, and the research scope was a two-dimensional plane flow, we selected a two-dimensional spatial dimension, two-phase flow as the physical field, and a laminar flow to meet the research purposes, reduce the calculation difficulty of the subsequent model, and improve the convergence of the model.
Model construction
The two-phase flow process of water flooding involves both oil and water. Thus, both oil and water parameters were added and re-determined as materials in COMSOL. The oil and water parameters are shown in Table 1. The names and specific values of density and viscosity were defined as possible in these parameters to facilitate data processing after the model calculation and the determination of the calculation formula. Table 2 shows the parameter names. Figure 3 shows the microscopic pore geometry model of the matrix carbonate rocks. The independent disconnected irregular shapes are rock skeletons and the interconnected channels are pores. The initial oil phase existed in the pore of the rock. The simulated water flooding process involved the injection and extraction of the water phase from the lower right and the upper left ends, respectively. Therefore, the initial water phase region was the lower right end. The interface between the water and oil phase areas was defined as the water inlet, with an outlet established at the upper left end.
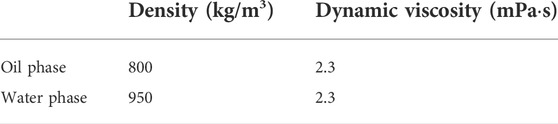
TABLE 1. Oil and water parameters.
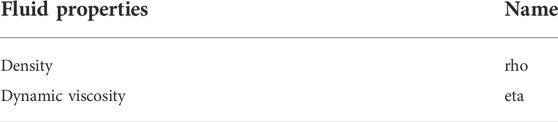
TABLE 2. Parameter names.
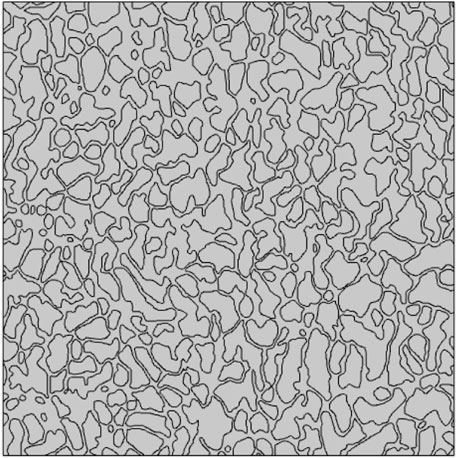
FIGURE 3. Matrix-type microscopic pore model.
Governing equations and boundary conditions of the oil and water two-phase
The four governing equations used by COMSOL for the study of two-phase flow problems are two fluid flow equations: the N-S equation (Naiver-Stokes equation, also known as momentum conservation equation) and a continuity equation (mass conservation equation), as well as two phase field-governing equations.
1) Momentum equation
The N-S equation (Yang, 2020) that controls the flow is expressed as Eqs 1, 2:
where
The viscous stress tensor
2) Phase field equation
The phase field method tracks the interface of the two-phase flow by introducing a phase field variable
where
3) Boundary conditions
The boundary conditions of the laminar flow phase field include inlet condition, outlet condition, wall wettability, initial condition, and surface tension. For the problem of water flooding, there exists an inlet of water phase and an outlet of oil-water two-phase. Oil and water flow from the inlet to the outlet due to a pressure difference. The model in this study adopted a constant flow inlet with an injection rate of 20 mm/s. The outlet condition was pressure, with a value of 0 Pa. In this study, as the glass in a real etching glass experiment is a water-biased wet material, the contact angle was set to
Grid construction
The meshes in COMSOL include structured, unstructured, and boundary meshes. Reasonable meshing can not only improve the calculation efficiency but also its accuracy. The calculation in this study used a two-dimensional model. Unstructured grid cells not only met the accuracy requirements for the calculations but also minimized the calculation time.
Finally, a total of 83678 cells was considered, including 14900 edge cells and 10263 vertex cells. The average cell mass was 0.7082 and the grid area was 343.1 square millimeters. Figure 4 shows a partial grid setup.
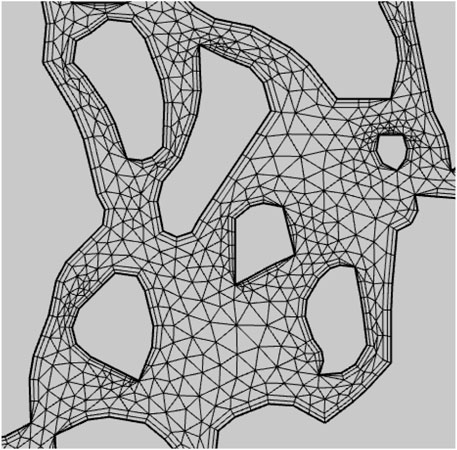
FIGURE 4. Local meshing.
Microscopic water flooding characteristics of carbonate reservoirs with different fracture forms
Pure matrix carbonate model
The size of the pure matrix model was 30 mm×30 mm, the initial pore pressure was 100 Pa, the porosity was approximately 38.14%, and the total transient solution step was 20 s. Because the model assessed two-dimensional plane flow, in consideration of the practical significance of the data, 1 mm thickness was added to the porous medium area during the calculation. Thus, the porous medium was near-cuboid (30 mm (X) ×30 mm (Y) ×1 mm (Z)), with an initial oil content of 343.05 mm3.
Figure 5 illustrates the initial oil-water distribution, where red, blue, and white indicate the oil phase, the water phase, and the rock matrix, respectively, and the transition zone between the red and blue is the oil-water zone. After the calculations, the data were post-processed. The parameters such as the oil-water volume fraction, pressure, and flow velocity at each calculation step were then obtained and the corresponding images were drawn. Figure 6 shows from left to right the characteristics of the water drive front for injected PVs of 0.05, 0.19, and 0.34, respectively. In the first half of the water drive front, the front shows a piston displacement state (Wang et al., 2018) and a relatively uniform displacement. Figure 7 shows from left to right the water drive front for injected PVs of 0.44, 0.52, and 0.68, respectively. The second half shows an obvious fingering phenomenon and water is injected into the outlet from the upper right. The fingering phenomenon is common in water flooding. After the injected water enters from the injection end, it always reaches the outlet end along the channel of least resistance and forms a dominant channel after connecting to the outlet end, which is known as the microscopic fingering phenomenon. With the continuous increase of injected PV value, the water drive front inrush also increases; in other words, with increasing injected PV value, the fluid flow in the fingered area becomes increasingly obvious while the flow in other areas is slow, generating a “concave” front shape.
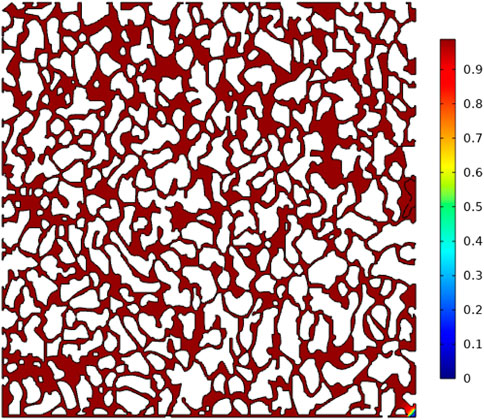
FIGURE 5. Initial oil-water distribution.
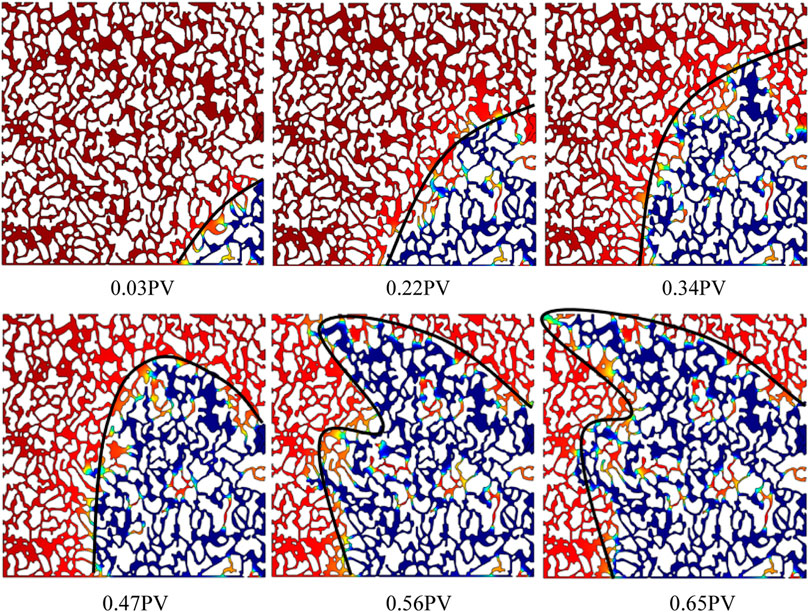
FIGURE 6. Water drive front of the matrix mode.

FIGURE 7. Water drive front of the parallel fracture mode.
Although the pure matrix model is relatively homogeneous as a whole, the fingering phenomenon still occurs in the water flooding process. The heterogeneity of the microscopic pore-throat structure, displacement velocity, and oil-water viscosity ratio are among the main explanations for microscopic fingering (Chen, 2017). In addition, displacement velocity and oil-water viscosity ratio are also important factors affecting the characteristics of the water drive front (Chen, 2017; Wang et al., 2018).
The output is calculated by integrating the output line at the outlet. The line integral is performed on the outlet line, and the expression required for integration is input. Formulas (7) and (8) are the expressions for oil and water production, respectively, with an assigned flowing fluid thickness of 1 mm. These calculations provide the oil and water production of the matrix model.
where spf.U is the fluid flow rate at the outlet, mm/s; t is time, s; Pf.Vf2 is the volume fraction of the oil phase; and Pf.Vf1 is the volume fraction of the aqueous phase.
Fracture vertical main line model
The pore volume of the vertical main fracture line model was 344.25 mm3 and the porosity was approximately 38.25%, close to that of the pure matrix type. The other boundary conditions were the same as those of the pure matrix type. Figure 8 shows from left to right the characteristics of the water drive front for injected PVs of 0.06, 0.18, 0.28, 0.37, 0.46, and 0.51, respectively. When the shape of the water drive front was not close to the fracture of the vertical main line, it showed a uniform piston displacement. However, as the water drive front gradually approached the fracture, the fingering phenomenon became increasingly active until the water drive front reached the fracture. When the water drive front reached the crack, it advanced first in the crack. When the pressure in the crack reached a certain level, the water in the crack continued to sweep forward through the crack. When the water drive front swept forward again, the water drive front again formed a uniform displacement shape. Figure 7 shows the morphology of the water drive front for injected PVs of 0.6, 0.65, and 0.7 respectively, showing the appearance of the fingering trend after a period of uniform displacement of the water drive front. At this time, while water expanded in the crack, it did not completely fill it due to the formation of the dominant channel.
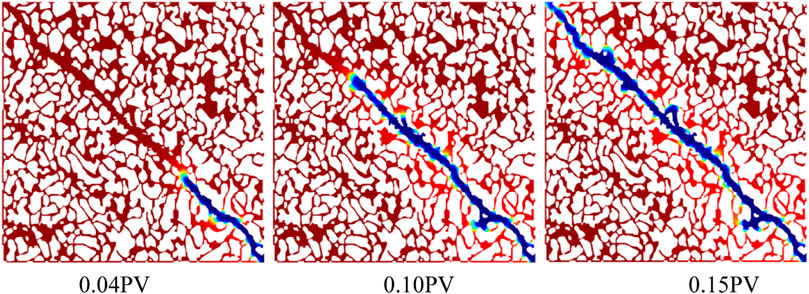
FIGURE 8. Water drive front of the vertical fracture mode.
Fracture parallel mainstream line model
The pore volume of the fracture parallel main line model was 341.23 mm3, and the porosity was approximately 38%. The water drive front of the fracture parallel mainstream line model showed an obvious trend of advancing along the fracture. Figure 8 shows the characteristics of the water drive front for injected PVs of 0.04, 0.1, and 0.15, respectively. The water drive front always advanced along the fracture and quickly connected the inlet and outlet to form a dominant channel, hardly affecting the pores on either side of the fracture.
Impact of fracture morphology on water flooding characteristics
Water emergence time
Figure 9 directly illustrates the impact of fractures on water emergence time. The water emergence time of the parallel fracture main line model was significantly shorter than those of the pure matrix and vertical fracture main line models. Water emergence occurred for injected PVs of <0.2. The water penetration time of the vertical main line model was slightly later than that of the pure matrix model. The cracks in the parallel main lines provided the channel with the least flow resistance for the potential difference between the inlet and outlet; thus, the injected water quickly reached the outlet along the cracks to form a flow advantage channel, resulting in a short water appearance time. Cracks perpendicular to the mainstream line model showed better breakthrough times compared to the pure matrix model of vertical water because the mainstream line delayed the micro means into the phenomenon of cracks. Therefore, the displacement front was rearranged and cracks in the time away from the cracks maintained a uniform displacement; thus, the micro situation was not as serious as in the pure matrix model.
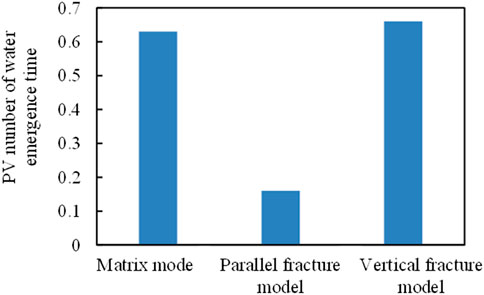
FIGURE 9. Water emergence time.
Oil displacement efficiency
The model water flooding was divided into two stages. The first stage was the stable growth stage of oil displacement efficiency, while the second stage was the no-growth stage of oil displacement efficiency. Figure 10 shows the comparison of oil displacement efficiencies of the three different fracture morphology schemes. The oil displacement efficiency curve trends of the pure matrix model and the vertical mainstream fracture model were basically parallel, indicating that the vertical mainstream fracture had almost no influence on the change trend of oil displacement efficiency. The total displacement efficiency of the vertical mainline fracture model was better than that of the pure matrix model. The oil displacement efficiency of the fracture parallel main line model was smaller than that of the other two models because the premature water emergence time caused a sudden decline in the growth rate of the oil displacement efficiency at a relatively stable stage. The final displacement efficiency of the vertical fracture main line and pure matrix models were 78.9% and 72.3%, respectively, while the minimum displacement efficiency of the parallel fracture main line model was 18.1%.
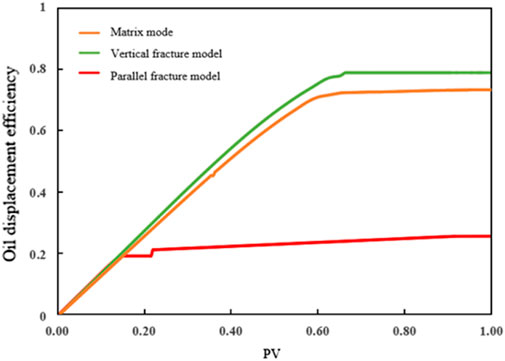
FIGURE 10. Oil displacement efficiency.
Water content
Figure 11 shows the comparison of the water content curves of the three models. The change of water content was divided into two stages. The first stage was the slow increase of water content, in which the water produced was mainly droplets dispersed in the oil and membrane water flowing along the pore wall. The second stage was the rapid increase of water content, during which the water drive front reached the outlet end and more water is produced from the outlet, with a significant increase in the water content. The pure matrix model and the fracture vertical curves of the moisture content of the mainstream line model showed that the difference in the vertical fracture water cut curve in the middle period of the mainstream line model depended on the right side. For the same injection PV, perpendicular cracks in the mainstream line model showed lower moisture content than that of the pure matrix model; however, in the end, at 100% moisture content, the injection PVs were basically the same. Compared to the other two models, the water content curve of the parallel main line model is significantly shifted to the left and the first stage is significantly shorter compared to those of the other two models, indicating that the water content of the parallel main line model increased rapidly and reached 100% when the injected PV was very small.
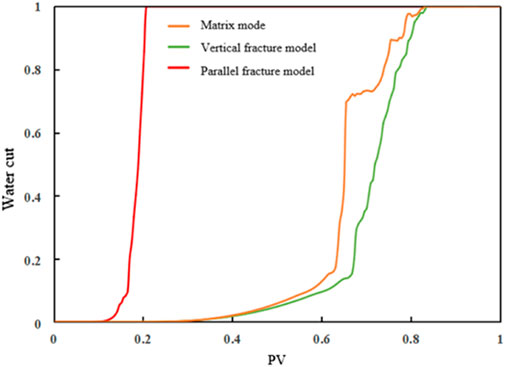
FIGURE 11. Moisture content.
Types and distributions of microscopic residual oil
When the water content in the pores increases, the residual oil in the pores still has a high exploitation value. However, at present, studies on residual oil have mostly focused on the macro static perspective (Jiang et al., 1999), with relatively few studies on micro dynamic residual oil. However, flowing residual oil is the main contributor to production (Yu et al., 2016).
Types and formation mechanism of residual oil
COMSOL identifies five main types of flow residual oil: clusters, porous, columnar (Figure 12), blockages trapped in “dead ends” (Wang et al., 2020), and contiguous clusters in areas untouched by injected water. Continuous clusters occur mainly because the injected water is not affected and remains in the corner of the model. Several oil-water interfaces and continuous-phase residual oil connect multiple pore throats in cluster residual oil, which is mainly caused by the flow of injected water around the pores and microscopic fingering. Porous residual oil has fewer than five oil-water interfaces and pore-throat residual oil in the discontinuous phase. Columnar residual oil shows two oil-water interfaces, mainly distributed in a single channel or, in the discontinuous phase, the “H" channel, with two oil-water interfaces (He and Zhang, 2006). The residual oil is trapped in a “dead end” with only one oil-water interface and only one connected pore throat.
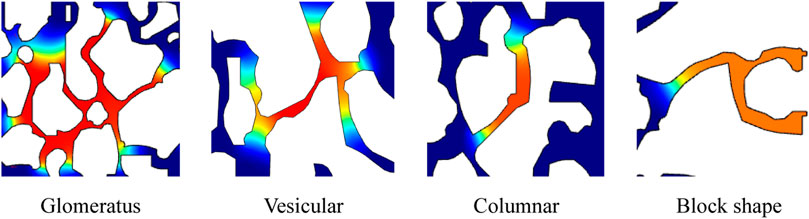
FIGURE 12. Residual oil types.
The two main forms of injected water flow in water flooding in hydrophilic reservoirs are the movement of injected water from the middle of large pores with low resistance or the slow movement along the surface of pore rocks. If the inrush speed is greater than the wetting speed along the pore wall, the oil in small pores is easily trapped by the water. If the wetting rate along the pore wall is greater than the inrush rate in the large pore, oil droplets form in the large pores, and residual oil forms in large pores surrounded by many small pores.
The mechanical mechanisms of underground seepage mainly act through capillary, viscous, inertial, shear, and other forces (Hou et al., 2015; Zhang and Li, 2020). The results of microscopic etching glass experiments have summarized the main mechanism of forming microscopic residual oil morphology and distribution characteristics, including capillary, viscous, inertial, and shear force actions. Microscopic fingering is caused by viscosity differences; wall adhesion (oil-philic), micro-heterogeneous water drive flow, and crude oil cutoff due to abrupt pore-roar resistance.
Residual oils under different fracture development
For the pure matrix model, injected PVs of <0.5 in the early stage of water flooding resulted in a limited distribution of residual oil and there were no obvious laws. The type of residual oil was mainly affected by the microscopic pore structure. When the injected PV reached approximately 0.5, distribution patterns were observed (Figure 13). Initially, cluster and porous residual oils were the main types. Later, the proportions of porous and columnar residual oil increased and the more continuous cluster residual oil changed to porous and columnar residual oil. The distribution of residual oil in the plugging condition was basically unchanged.
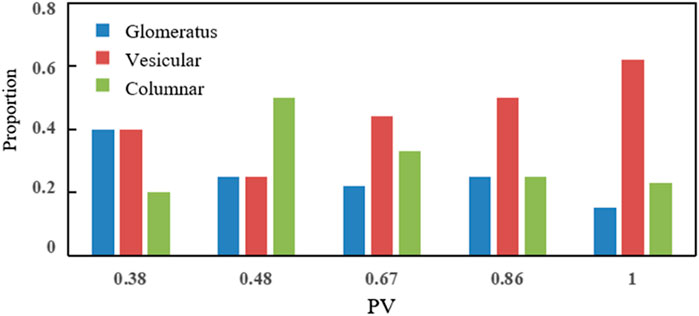
FIGURE 13. Residual oil distribution according to the matrix type.
The presence of vertical main line fractures reduced or eliminated the residual oil clusters in the early stage of water flooding (Figure 14). The residual oil was mainly column-like and clustered because the fractures inhibited the fingering phenomenon and reduced residual oil clusters. The clusters still appeared after a period of water flooding, although cracks delayed their emergence. Columnar residual oil was the main type throughout the whole process.
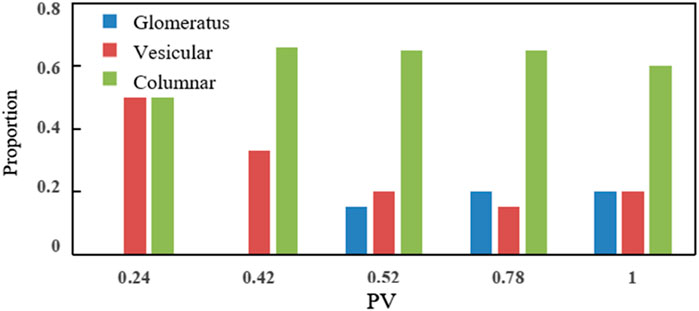
FIGURE 14. Distribution of residual oil types in the vertical fracture main line model.
The residual oil in the fracture parallel main line model was mainly contiguous clusters in the unaffected area, with almost no other residual oil types.
The vertical main line fracture somewhat reduced the flow around the injected water and also reduced the cluster of residual oil formed by the flow around the injected water. A more discontinuous column of residual oil was formed, especially in the area near the fracture. At the same time, the vertical main line fracture increased the sweep area and reduced the area of the residual oil clustered on both sides. The parallel main line fracture reduced all residual oil types to clusters of continuous residual oil on both sides of the fracture. Therefore, in water flooding, the mainstream line should be avoided along the fracture direction and should instead be perpendicular to the fracture when using the well distribution method. The quantitative analysis of the type of residual oil to identify the main type will allow the selection of potential countermeasures to effectively enhance oil recovery.
Conclusion
This study established a microscopic carbonate pore model in the COMSOL numerical simulation software. The influence of different fracture morphology on water flooding characteristics and residual oil distribution was studied, and the variation of residual oil types with the number of injected PV in the water flooding process of different schemes was quantitatively characterized. The following conclusions were drawn:
1) Comparison of the effects of micro water drive characteristics between the pure matrix and vertical mainstream line crack models mainly showed an approximately 10% higher oil displacement efficiency for the vertical model compared to the pure matrix model. The main line model showed a water drive front near the crack, and then a fingering phenomenon, which changed again after leaving the crack. After a period of homogeneous displacement, the fingering phenomenon appeared again due to the microscopic heterogeneity of the pore structure. Injected water flowed along the fracture after entering the fracture, increasing the sweep area and slightly delaying the water emergence time of the vertical main line model of the fracture.
2) Parallel main line fractures not only reduced the production but also affected the water flooding characteristics. The water flooding front formed a dominant channel directly along the fracture to the outlet end, which decreased the water appearance time and further reduced the oil displacement efficiency, and improved the water cut, resulting in a significantly decreased production.
3) Clusters of residual oil were observed in the pure matrix model, along with early water drive was mainly residual oil. The continuous clusters of residual oil gradually became predominantly discontinuous vesicular and columnar residual oil. At the same time, both sides of the mainstream line showed clusters of residual oil in the unswept marginal area. This residual oil is generally more difficult to use than liquid oil.
4) Vertical main line fractures reduced the amount of residual oil in clusters, while the presence of fractures increased the sweep area and reduced the fingering and flow around the injected water, replacing it with columnar residual oil. Parallel main line fractures expanded the unswept area, with the residual oil appearing in contiguous clusters.
Data availability statement
The original contributions presented in the study are included in the article/Supplementary material. further inquiries can be directed to the corresponding author.
Author contributions
PJ, framework development; HG, simulation; YW, analysis of results; CP, writing manuscript; LC, project conception; XK, verification.
Funding
This study was partially supported by the National Natural Science Foundation of China (No. 52004307) and the Science Foundation of China University of Petroleum, Beijing (No. 2462018YJRC015).
Acknowledgments
We also acknowledge financial support from the Science and Technology Project of CNPC—major project (No. ZLZX 2020-02-04).
Conflict of interest
The authors declare that the research was conducted in the absence of any commercial or financial relationships that could be construed as a potential conflict of interest.
Publisher’s note
All claims expressed in this article are solely those of the authors and do not necessarily represent those of their affiliated organizations, or those of the publisher, the editors, and the reviewers. Any product that may be evaluated in this article, or claim that may be made by its manufacturer, is not guaranteed or endorsed by the publisher.
References
Chen, M. (2017). Quantitative description of micro-seepage mechanism in water drive reservoir [D]. Chengdu China: Southwest Petroleum University.
Cui, H. (2018). Demonstration of steam huff-puff development in fracture-pore carbonate heavy oil reservoirs [J]. Inn. Mong. Petrochem. Ind. 44 (04), 98
Du, Y. (2019). Numerical simulation of tight reservoir water drive front. Daqing China: Northeast Petroleum University.
Guo, S., and Huang, Y. (1990). Simulation micromodel and its application in reservoir engineering [J]. Acta Pet. Sin. 11 (1), 49. doi:10.7623/syxb199001007
He, J., and Zhang, S. (2006). Study on micro-residual oil distribution in high water cut stage [J]. J. Oil Gas Technol. J. Jianghan Petroleum Inst. (04), 340.
He, L. Study on pore structure of core based on geometric modeling [D]. Beijing China: China University of Petroleum. (East China).
Hou, J., Zhang, F., Zhao, F., Song, W., Lu, Y., Guo, F., et al. (2015). Experimental study on micromechanism and system optimization of chemical flooding [J]. Sci. Technol. Eng. 15 (10), 72. doi:10.3969/j.issn.1671-1815.2015.10.014
Jiang, H., Gu, J., Chen, Y., Sun, M., and Ji, Z. (1999). Fine numerical simulation of residual oil distribution [J]. J. Univ. Petroleum Ed. Nat. Sci. (05), 31. doi:10.3321/j.issn:1000-5870.1999.05.009
Kang, Y., Wang, L., Fan, L., Huang, H., Yang, H., and Zhu, Y. (2019). Microscopic water flooding characteristics of Yan8 reservoir in B16 block of Yanwu Oilfield [J]. Liaoning Chem. Ind. 48 (12), 1234. doi:10.14029/j.cnki.issn1004-0935.2019.12.023
Li, K. (1996). Fabrication and application of two-dimensional glass microsimulation model [J]. Drilling and Production Technology.
Mo, S., He, S., Xie, Q., Luan, G., Gai, S., and Lei, G. (2015). Study on characteristics of low-velocity water flooding in low permeability sandstone by CT scanning [J]. Sci. Technol. Rev. 33 (05), 46. doi:10.3981/j.issn.1000-7857.2015.05.006
Ouyang, S., and Meng, Z. (2019). Analysis of micro-water flooding characteristics and influencing factors of ultra-low-ultra-low permeability reservoirs: A case study of chang 6 and chang 8 reservoirs in heshui area, ordos basin [J]. Petroleum Geol. Eng. 33 (03), 62. doi:10.3969/j.issn.1673-8217.2019.03.013
Roehl, P. O., and Choquette, P. W. (1985). Introduction: Carbonate petroleum reservoirs[M]. Berlin, Heidelberg, New York: Springer-Verlag, 1
Roehl, P. O., and Choquette, P. W. (1985). Perspectives on world—class carbonate petroleum reservoirs[C]. Tulsa: AAPG, 148. AAPG Memoir 69.
Sheng, Q., Shi, X., and Liu, W. (2005). Core CT three-dimensional imaging and multiphase displacement analysis system [J]. CT Theory Appl. Res. 14 (3), 8. CNKI:SUN:CTLL.0.2005-03-001
Song, X., and Li, Y. (2018). Ideas and countermeasures for waterflooding development of carbonate reservoirs in the Middle East [J]. Petroleum Explor. Dev. 45 (04), 679. doi:10.11698/PED.2018.04.13
Wang, C., Jiang, H., and Ma, M. (2020). Study on the variation of pore scale residual oil flow state based on microfluidic model [J]. Bull. Petroleum Sci., 376. doi:10.3969/j.issn.2096-1693.2020.03.032
Wang, C., Cai, M., and Yi, J. (2018). Numerical simulation of water flooding front of tight reservoir [J]. Chem. Eng. 32 (12), 15. CNKI:SUN:HXGC.0.2018-12-006
Wang, D., Lu, H., and Chen, X. (2016). Accumulation system and distribution characteristics of large and medium-sized Marine carbonate oil and gas fields [J]. Oil Gas Geol. 37 (03), 363–371. doi:10.11743/ogg20160308
Xue, J., Liu, Y., and Zhu, W. (2016). Study on waterflood development mode of carbonate reservoir [J]. J. Chongqing Univ. Sci. Technol. Nat. Sci. Ed. 18 (01), 43. CNKI:SUN:CQSG.0.2016-01-014
Yang, Li (2020). Study on Enhanced oil recovery by pore scale water flooding [D]. Tianjin China: Tianjin University of Commerce.
Yu, C., Mi, L., Wang, C., Zhao, Y., Jiang, H., and Tian, Y. (2016). Study on micro-residual oil flow characteristics in ultra-high water cut stage of water drive reservoir [J]. Fault-block Oil Gas Field 23 (05), 592. doi:10.6056/dkyqt201605010
Yuan, S., Liu, W., Jiang, H., Zhao, L., and Wang, J. (2021). Development of fracture-vug carbonate reservoirs based on reservoir characteristics [J]. Petroleum Geol. Recovery Effic. 28 (01), 80. doi:10.13673/j.cnki.cn37-1359/te.2021.01.010
Zhang, Jihong, and Li, Xin (2020). Micro-displacement mechanism of residual oil in weak base ternary flooding [J]. Coll. petroleum Eng. northeast petroleum Univ. Contemp. Chem. Eng. 49 (04), 645. CNKI:SUN:SYHH.0.2020-04-037
Zhang, Li, Sun, Jianmeng, and Sun, Zhiqiang (2012). Application of digital core modeling method [J]. J. Xi'an Shiyou Univ. Nat. Sci. Ed. 27 (3), 35. doi:10.3969/j.issn.1673-064X.2012.03.007
Zhang, N., He, D., and Sun, Y. (2014). Distribution characteristics and controlling factors of global large carbonate oil and gas fields [J]. China Pet. Explor. 19 (06), 54. doi:10.3969/j.issn.1672-7703.2014.06.007
Zhao, L. Study on quantitative description of microscopic residual oil after polymer flooding based on digital channel [D]. Daqing China: Northeast Petroleum University.
Keywords: carbonate reservoir, numerical simulation, microscopic water flooding characteristics, residual oil, flow performance
Citation: Jia P, Guo H, Wang Y, Peng C, Cheng L and Ke X (2022) COMSOL-based investigation of the characteristics of microscopic water flooding and residual oil distribution in carbonate reservoirs. Front. Earth Sci. 10:1016941. doi: 10.3389/feart.2022.1016941
Received: 11 August 2022; Accepted: 25 August 2022;
Published: 30 September 2022.
Edited by:
Qingbang Meng, China University of Geosciences Wuhan, ChinaReviewed by:
Hao Xiong, University of Oklahoma, United StatesKang Botao, China National Offshore Oil Corporation, China
Copyright © 2022 Jia, Guo, Wang, Peng, Cheng and Ke. This is an open-access article distributed under the terms of the Creative Commons Attribution License (CC BY). The use, distribution or reproduction in other forums is permitted, provided the original author(s) and the copyright owner(s) are credited and that the original publication in this journal is cited, in accordance with accepted academic practice. No use, distribution or reproduction is permitted which does not comply with these terms.
*Correspondence: Pin Jia, amlhcGluMTk5MEAxNjMuY29t