 Mingqiang Hao
 Xuewei Liu
94% of researchers rate our articles as excellent or good
Learn more about the work of our research integrity team to safeguard the quality of each article we publish.
Find out more
ORIGINAL RESEARCH article
Front. Earth Sci., 18 January 2023
Sec. Economic Geology
Volume 10 - 2022 | https://doi.org/10.3389/feart.2022.1015199
This article is part of the Research TopicAdvances in Reservoir Modeling and SimulationView all 12 articles
As efficient technologies boost oil yields and economic benefits, horizontal wells and hydraulic fracturing are widely used in low- permeability reservoirs. To better evaluate the reserve and improve recovery, it is essential to determine fluid flow patterns and transport mechanisms. Laboratory experiments, field operations, and analytical studies have identified nonlinear flow and microfracture networks during the fluid flow in a reservoir with fractured horizontal wells. However, the interactions between nonlinear flow and microfracture networks are still not fully understood. In this study, nonlinear flow experiments and triaxial compression tests were carried out to analyze nonlinear flow characteristics in the vicinity of microfracture networks. By analyzing the effects of microfracture networks on nonlinear flow, two-phase flow, rock stress sensitivity, and artificial fractures, we found that fluid capacity in capillaries with smaller dimensions decreased along with a drop in the pressure gradient, generating a nonlinear flow pattern. The area of nonlinear flow was diminished by the presence of microfractures, which improved flow efficiency and reservoir quality. Considering the size of fracture apertures, microfractures behave more like matrix pores than natural fractures. Also, microfractures significantly increase rock stress sensitivity and reduce the threshold permeability, which enhances fluid flow capacity. This study contributes to our understanding of flow behavior, predicting production and improving recovery in low-permeability reservoirs.
Low-permeability reservoirs have become one of the main targets in the oil and gas industry owing to the rapid development of horizontal well technology (Asadi et al., 2020; Yu et al., 2021; Zeinabady et al., 2022), drilling and steering technology, and fracturing processes (Bunger and Lecampion, 2017; Xu et al., 2019; Heider, 2021; Marsden et al., 2022). Because of the characteristics of low permeability and low porosity, fluid flow patterns and transport mechanisms in low-permeability reservoirs deviate from the traditional flow rules such as Darcy’s Law in conventional reservoirs. To better evaluate the reserve and improve recovery, there is a need to clarify fluid flow behaviors in a complex rock structure.
Numerous studies have shown that interactions at the solid–liquid interface have significant effects on flow patterns due to the small pores and narrow throats, as well as the existence of clay minerals in the complicated structures of tight, low-permeability reservoirs (Al-Yaseri et al., 2021; Fatah et al., 2021; Kim and Devegowda, 2022; Zhang et al., 2022). The fluid flow tends to become nonlinear and shows deviations from Darcy’s Law. This concept can be verified by a graph of the relationship between the pressure gradient and the flow rate, which can be divided into a pseudo-linear flow section, a nonlinear flow section, and a non-flow section. The two separate endpoints of the nonlinear flow section are the minimum threshold pressure gradient and the maximum threshold pressure gradient. Data from experiments, field operations, and analytical studies have identified nonlinear flow in a low-permeability, porous medium.
Displacement experiments are conventional tools for studying fluid flow properties and microfractures in low-permeability reservoirs. Wang et al. (2011) used a self-designed micro-flux measuring instrument to investigate the low-rate flow pattern in low-permeability samples from the Daqing oilfield. They discovered that low-velocity flow was nonlinear, and apparent fluid permeability depended on differences in the pressure gradient. Using 23 cores from ultralow-permeability reservoirs, Zeng et al. (2011) carried out displacement experiments to determine the flow curves of a single oil or water phase. They confirmed the existence of nonlinearity and pseudo-threshold pressure and declared that nonlinearity increased with lower permeability. Song et al. (2019) studied nonlinear flow characteristics in low-permeability reservoirs using cores with a permeability of 4–8 mD. They attributed their results to flow resistance and solid–liquid interactions. Yu et al. (2022) studied the permeability enhancement due to microfracture networks in hydraulic fracturing, and their results indicated that pore and throat radius were significantly increased due to the existence of microfracture networks.
Field observations are crucial for verifying experimental conclusions. Ji et al. (2008) proposed a method to calculate the oil production in low-permeability reservoirs with non-Darcy seepage flow. The model’s predictions were consistent with the field production data in 72 blocks of the Daqing oilfield. They further adapted the nonlinear model to design and evaluate development methods for other low-permeable reservoirs in the Daqing oilfield. Wang et al. (2006) designed and tested several non-Darcy flow models for low-permeability reservoirs with different well patterns in order to maximize oil production by optimizing design parameters such as well spacing. They declared that the oil production of 31 oilfields was significantly improved based on their proposed models.
Analytical analysis is another tool to evaluate the effects of nonlinear phenomena. Ren and Guo (2017) established a nonlinear flow model based on multiple fractured horizontal wells, and their results indicated that nonlinear effects increased the flow capacity and affected the flow pressure. Xu et al. (2017) and Xu et al. (2018) derived a nonlinear flow model based on Knudsen diffusion, slippage, and adsorption for pores and microfractures, and they claimed that the free gas ratio could enhance the nonlinear flow capacity. Bezyan et al. (2019) constructed a nonlinear flow model including adsorption, based on particle swarming optimization, and they showed that taking adsorption into account could lead to higher production. Xu et al. (2019a) and Wu et al. (2020) analyzed the apparent permeability of nanopores in tight sandstone, and discovered that different flow regimens existed at the nanopore scale. Li et al. (2020) calculated the apparent permeability for microfracture networks and concluded that slippage and desorption were beneficial because they led to a later apparent permeability increase. Li et al. (2021) analyzed the impacts of microfracture networks on rock permeability, and their study showed that the permeability was increased, and there was a smaller tortuosity.
Though many studies of nonlinear flow have been performed in the past, the interaction between nonlinear flow and microfracture networks was not focused on in an in-depth investigation. In this research, both nonlinear flow experiments and microfracture experiments were conducted to determine the interactions between nonlinear flow mechanisms and microfracture networks. The potential influencing factors on nonlinear flow such as pore structure were investigated, and the impacts of microfracture networks on nonlinear flow regimens were analyzed. From this analysis, the flow behaviors and mechanisms can be clarified, the production predictions made, and a working method devised for improving recovery in low-permeability reservoirs.
The experiments on nonlinear flow and microfractures were designed to elucidate their influence on nonlinear flow in low-permeability reservoirs. Table 1 shows the details of experiments using different low-permeability core samples.
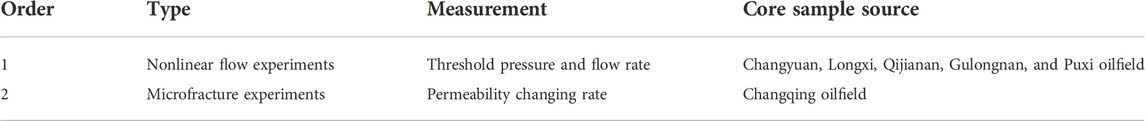
TABLE 1. Details of nonlinear flow and microfracture experiments.
Figure 1 illustrates how the nonlinear flow experiments were conducted, mainly involving measurements of pressure and flow rate. The constant pressure method was adopted for these experiments. To achieve a constant low pressure, a water column with a height ranging from 20 cm to 150 cm was maintained. The accuracy in this experiment was ±1 cm. For maintaining a constant high pressure of 0.01 MPa–0.7 MPa, pressurized gas was applied above the water. The required constant pressure conditions were satisfied by a combination of these two methods. At the same time, a photoelectric laser detection device was used to measure how long it took for water to flow through a certain pipe, based on which the average flow rate was obtained. The time and length accuracies were 0.1 s and 0.02 mm, respectively. After the readings were made, the nonlinear curve was drawn for the obtained flow rates under different pressures.
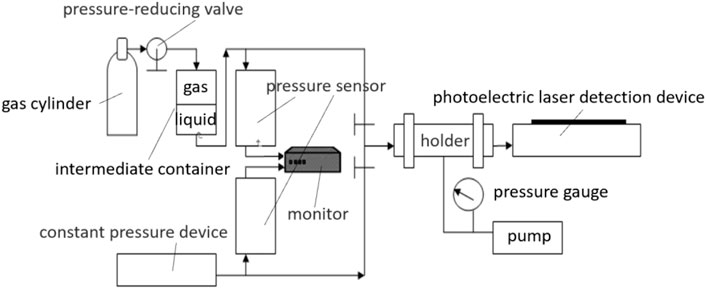
FIGURE 1. Nonlinear flow experiment.
As shown in Figure 2, there is a power law relationship between the threshold pressure gradient and reservoir permeability in all blocks. The smaller the permeability, the larger the threshold pressure gradient. The minimum threshold pressure gradient and the pseudo-threshold pressure gradient increased significantly for permeabilities < 1.0 mD. Solid–fluid interactions are the dominant mechanism for generating nonlinear flow in low-permeability reservoirs. According to the T2 spectrum of glycerin in a large space (Figure 3), the T2 relaxation fell within the range of 200–600 ms, with a peak at 400 ms. The peak amplitude was 14,000, and the average was around 7000. In glycerin-saturated cores, because of the solid–fluid interactions, the binding energy of glycerin hydrogen protons increased and thus generated a smaller T2 relaxation time (Figure 4). As a result, this led to a decline in T2 relaxation to 0–100 ms, with the peak being reduced to 2 ms. Because of the effect of the solid phase, the reservoir porosity varied, and the number of channels involved in the flow changed along with the pressure, thereby producing nonlinear single-phase flow.
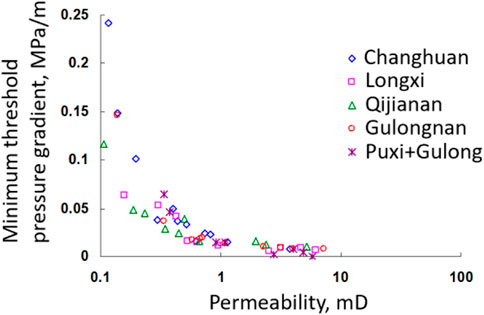
FIGURE 2. Comparisons of threshold pressure gradient of different blocks.
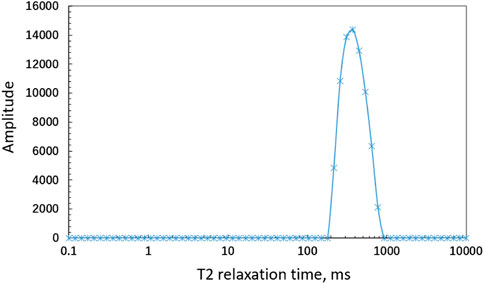
FIGURE 3. T2 spectrum of glycerin in a large space.
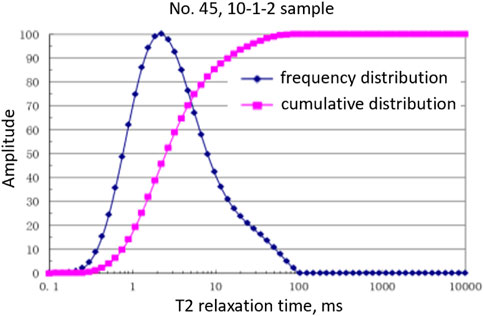
FIGURE 4. T2 spectrum of glycerin in a porous medium.
Nonlinear flow characteristics are dependent on the pore structure and follow a flow model. The most frequently used model is the one-dimensional capillary model, in which all the capillaries contribute to fluid flow under a certain displacement pressure. As the pressure drops, the fluid becomes unable to flow in a certain percentage of the capillaries due to solid–fluid interactions, thus causing the flow capacity to drop and nonlinear flow characteristics to appear. For this reason, the capillary sizes and the heterogeneity of the medium are the determining factors of nonlinear flow.
The dual-porosity model is another common flow model. It consists of two continua with different porosity. Pores with larger porosity provide the main flow area, while pores with smaller porosity only partially contribute to the flow. Once a balance is achieved between the two continua, the effects of the smaller pores on fluid flow are insignificant. As the nonlinear flow experiments are conducted during the balanced phase, the results of the nonlinear experiment primarily reflect the effects of the larger pores on the nonlinear flow characteristics. The capillary model is able to capture the flow features in conventional low-permeability reservoirs since most of the pores are relatively large enough to provide flow space. In terms of tight reservoirs, slit pores and intergranular fractures are the primary flow channels. By comparison, only a fraction of nanopores are accessible to fluid flow because of the small pore sizes and the tiny throats. The dual-porosity model is more suitable to describe such flow features.
For conventional low-permeability reservoirs, the relationship between the pressure gradient and the flow rate follows a quadratic polynomial, as shown in Figure 5. The fitting accuracy reached >99.9% when a quadratic polynomial was used for the nonlinear flow curves of a block in the Huabei oilfield. The dual-porosity model was used in the case of tight reservoirs, which were usually fitted by using a pseudo-linear flow equation with a threshold pressure gradient. Figure 6 shows that the coefficients of the quadratic term are small enough to be eliminated, leaving a first-order equation that can be used to express the flow features.
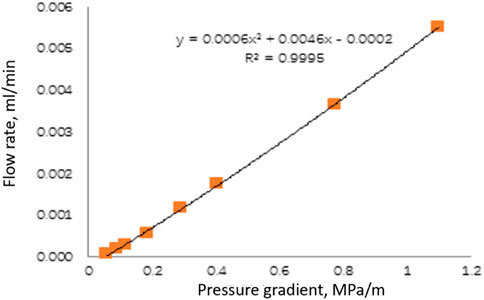
FIGURE 5. Nonlinear flow curves of a block in Huabei oilfield.
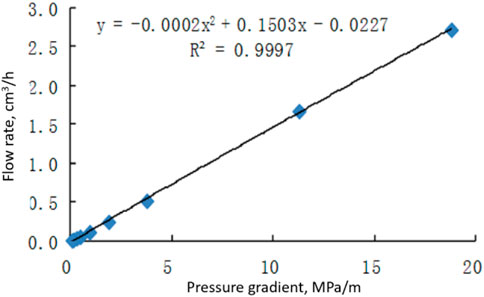
FIGURE 6. T2 nonlinear flow curves of a tight core in Jilin oilfield.
Microfractures are generated under stress that is comparable to the compressive strength or tensile strength of grains and matrix. As the stress increases further, the fractures are formed. Since microfractures are more widely distributed than fractures, it is necessary to understand how fractures are formed and determine the types of fractures and their relationships. The following experiments were focused on the generation of fractures and their influences on fluid flow.
The samples were cylindrical cores collected from the Chang 6 ultralow-permeability sandstone outcrops in the Changqing oilfield. The cores were 25 mm in diameter with a length of 60 mm. The triaxial compression test equipment consisted of a nitrogen cylinder, pressure regulator, triaxial core holder, confining pressure pump, axial pressure pump, and microflow meter (Figure 7). A compression pressure of 3 MPa was applied by means of the pressure pump to increase the axial pressure. The confining pressure of 3 MPa was chosen based on the difference between the in situ pressure and the formation pore pressure. In this way, the core shear stress was changed, and fractures were generated. Semi-quantitative monitoring of fractures is carried out by testing the alteration of permeability by nitrogen or water injection. The triaxial compression test equipment was used to create fractures in one-dimension cores under a confining pressure of 3 MPa. Gas permeability was measured at different axial pressures starting from 0 MPa, and the permeability changing rate was calculated (Figure 8).
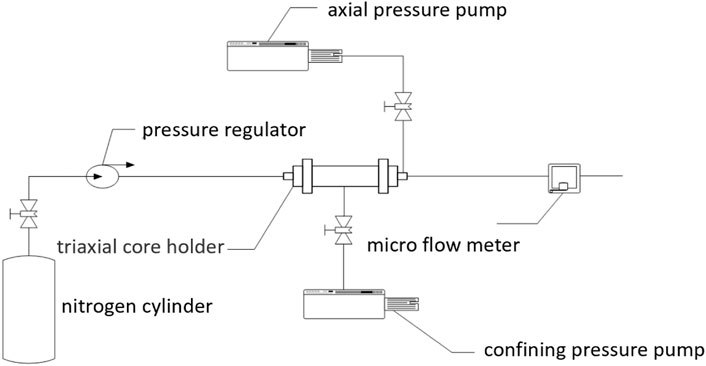
FIGURE 7. Triaxial compression test equipment.
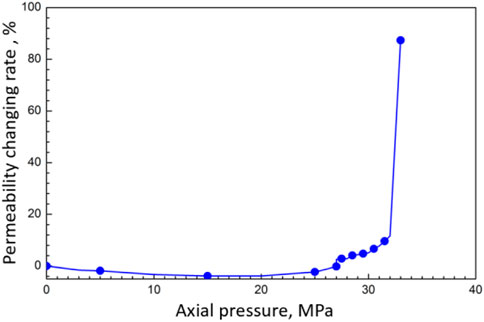
FIGURE 8. Relationship between axial pressure and permeability changing rate.
The curve showing how the permeability rate increased with axial pressure during parallel core experiments is shown in Figure 9. When axial pressure dropped below 20 MPa, the rock matrix was compressed under stress. Along with the increase in axial pressure, the area of gas flow channels was reduced, and the gas permeability decreased, which was a stress-sensitive stage. If the axial pressure was further increased above 20 MPa, rock failure was initiated, and fractures appeared under the external stress, generating more gas flow channels and correspondingly greater gas permeability. With an axial pressure higher than 30–32 MPa, the gas permeability rose sharply as connected fractures were created in cores. The fracture generation process in reservoirs can be divided into three sequential stages: the grain compression stage, the microfracture generation stage, and the fracturing stage. Only when pressure is high enough can microfractures and fractures appear; otherwise, only grain compression occurs. In other words, when fractures are detected, it means that microfractures have already been generated.
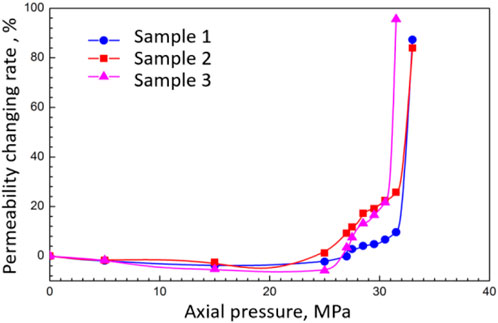
FIGURE 9. Triaxial compression test equipment.
Fracture generation curves in water-saturated cores are presented in Figure 10. Dry cores were converted to brine-saturated cores, and it can be seen that microfractures appeared at axial pressures >15 MPa, which is significantly lower than that for dry cores. The reason for the drop in axial pressure is the lower strength of the cement in cores when soaked in brine. Therefore, the fracture curves obtained with dry cores are quite different from the curves from real reservoirs. The experiment illustrates the effects of confining pressure on fracture generation. It shows the minimum principal stress when the confining pressure is smaller than the axial pressure. Figure 11 presents the experimental results at various confining pressures. The fact that the axial pressure required to generate microfractures increases with a larger confining pressure confirms that stress difference is the reason for fracture generation.
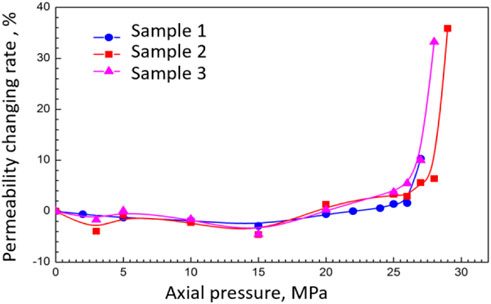
FIGURE 10. Fracture generation curves in water-saturated cores.
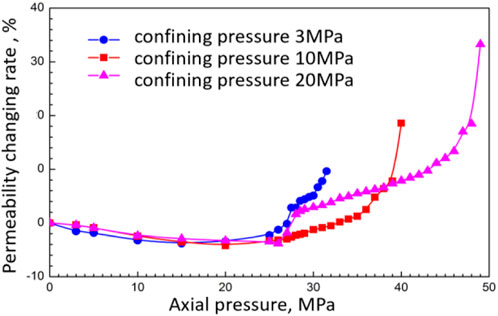
FIGURE 11. Fracture generation curves in dry cores.
Different kinds of fractures are generated in different reservoirs because of diverse stress conditions. Reservoirs can be classified according to the fractures generated under various stresses. Under a constant confining pressure, experiments were conducted to measure how permeability rates changed with different axial pressures. It can be concluded from Figure 12 that core permeability rises with time due to the microfractures generated under large axial stresses, while it remains almost constant at a lower axial pressure, implying that no microfractures were involved.
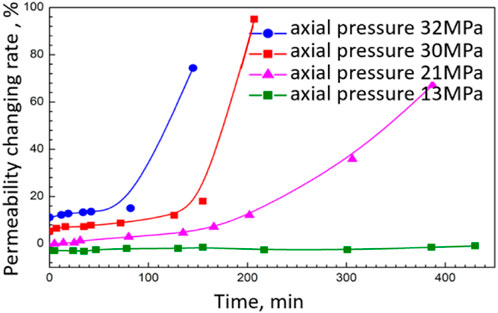
FIGURE 12. Fracture generation curves in slit cores.
Figure 12 shows that permeability remains almost unchanged at an axial pressure of 13 MPa over a period of 400 min, demonstrating that fractures were not present in the rocks. Increasing the axial pressure to 21 MPa results in a slowly rising permeability, which is attributed to the creation of a large number of microfractures. When the axial pressure reaches 30 MPa, the permeability growth rate undergoes a slow rise due to the presence of microfractures, and then rapidly increases with the help of fractures. If axial pressure is as high as 32 MPa, fractures are generated immediately without the development of microfractures. Therefore, reservoirs can be classified into four types based on the development of fractures under different stresses. The first type is reservoirs without fractures, the flow channels of which are mainly composed of pores and throats. Water injection is not efficient since interfacial resistance prevents fluid flow. Belonging to the matrix-dominant reservoirs, this type of reservoir is difficult to develop. The second type includes microfracture-developed reservoirs, in which microfractures are the main flow channels. Water injection can be applied due to the lower interfacial resistance even though it is also matrix dominant. Creating artificial fractures can further improve its recovery factor by improving reservoir connectivity. The third type includes reservoirs with abundant microfractures and fractures. Effective displacement is thus more liable to be achieved because the flow resistance is low and fracture connectivity is high. The fourth type includes fracture-developed reservoirs, in which fractures are dominantly developed. Since the fluid flow around the matrix in the reservoir is due to the high mobility in the fractures, the matrix is not available for exploration.
Nuclear magnetic resonance (NMR) methods have been adapted to measure the pore characteristics of rocks before and after being fractured. The results are shown in Table 2 and Figure 13. NMR was carried out after the stress was unloaded. In this case, the alteration in pore size reflects changes in pore scale after microfracture development. The NMR curves in Figure 13 have the following features. First, the total porosity makes little difference. Second, the rises and falls in amplitude of different intervals in the T2 spectra were captured. When the proportion of tiny pores is small, the proportion of larger pores increases. The generated microfractures are the outcome of cement failure around grains, which is conducive to connecting some tiny pores. Also, it is obvious that there are no changes in T2 relaxation time and spectral interval. The scale of the microfractures is still in the range of the original pore scale, and the generated microfractures can be regarded as matrix pores. The role of microfractures outweighs that of fractures in fluid flow since microfractures are created in large numbers.
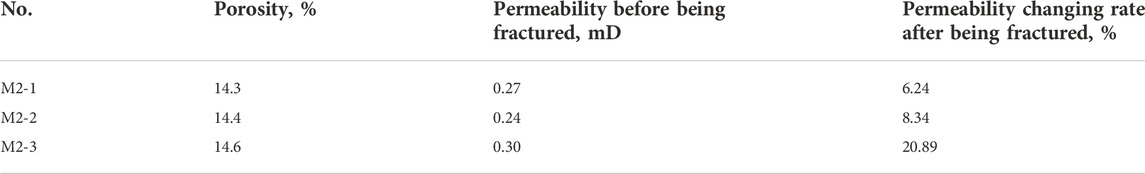
TABLE 2. Fracture generation curves in slit cores.
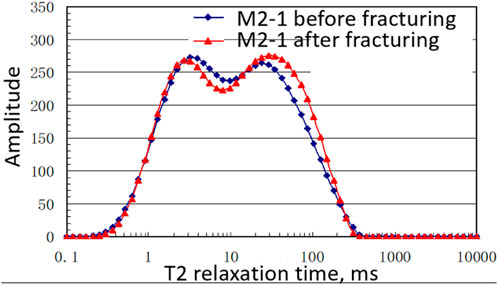
FIGURE 13. T2 spectral comparisons of slit cores before and after being fractured.
Microfractures have significant impacts on fluid flow, especially nonlinear flow, two-phase flow, and stress sensitivity. A group of cores was compared in experiments to evaluate these effects, which are shown in Table 3 and Figure 14. The results reveal that the nonlinear section shrinks and the nonlinearity decreases, further confirming that microfractures have modified the physical properties of the reservoir, reduced nonlinear flow, and improved fluid mobility.
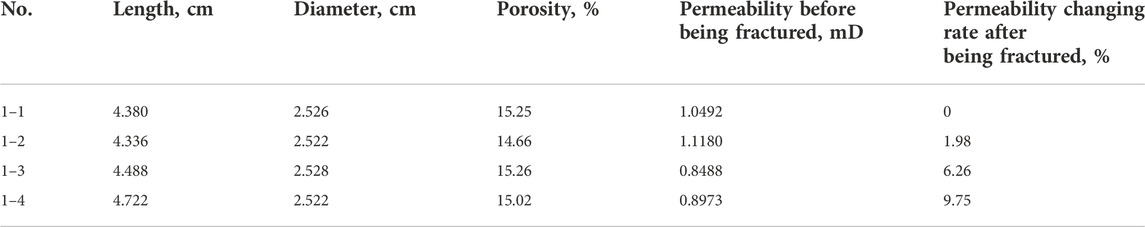
TABLE 3. Fracture generation curves in slit cores.
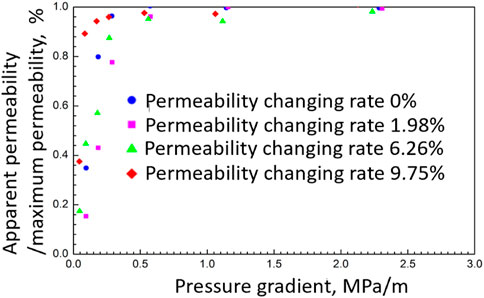
FIGURE 14. Nonlinear flow plot in fractures with different abundance.
Oil–water relative permeability curves are critical to making oilfield development plans and forecasts. It is generally acknowledged that the two-phase flow area is reduced, and relative permeability curves tend to be straight after fractures are developed. Determining the characteristics of relative permeability curves and fracture development is required to determine the impacts of microfractures on two-phase flow. With the unsteady method, four slit samples were fractured and measured to obtain oil–water relative permeability curves, as shown in Table 4. In comparison with Figure 15, it should be noted that residual water saturation became smaller concomitant with the development of microfractures. Also, with a more developed fracture structure, the two-phase flow region expanded, but it began to decrease when fracture development reached a critical value. Microfractures provide a large number of flow channels, which supplement fluid flow in a conventional porous medium, further improving displacement efficiency. However, if microfractures are overdeveloped, displacement efficiency tends to drop because of the greater heterogeneity. The water relative permeability curve differs in shape with different fracture development degrees. It appears convex before microfractures are initiated and becomes concave in synchrony with the growth of microfractures. It should also be noted that the maximum water relative permeability was improved. Microfractures are predicted to reduce the resistance from the capillary force and improve fluid flow capacity, thereby changing the shape of the curve. Even though their contribution to permeability is limited, microfractures can increase water flow ability and lower the permeability requirement for water-flooding.
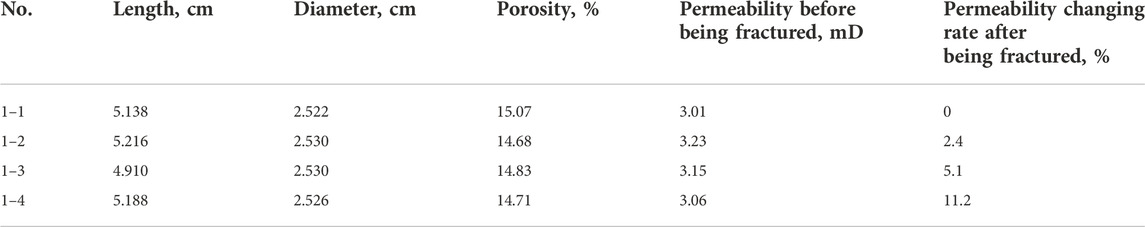
TABLE 4. Properties of cores before and after being fractured.
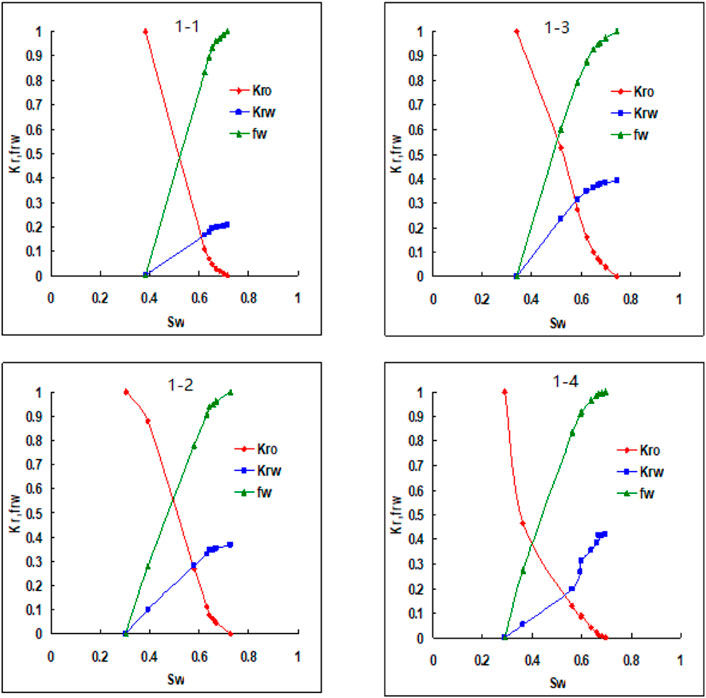
FIGURE 15. Oil–water relative permeability curves of cores before and after being fractured.
Analysis of the impacts of microfractures on rock stress sensitivity is necessary because fractures are one of the primary causes of stress sensitivity. To start the stress sensitivity experiments, one of two prepared outcrop slit cores is required to be fractured. A regular stress sensitivity test is applied under a changing back pressure, during which rock stress sensitivity is measured under modified solid and liquid stresses. Since stress sensitivity is mainly caused by changing fluid pressure, it is more reliable to measure it by changing fluid pressure. To reflect the real reservoir conditions, an axial pressure of 25 MPa is required to be loaded. Figure 16 illustrates the experimental flow graphs. The confining pressure pump and the axial pressure pump maintain stable confining pressure and axial pressure. Also, the back-pressure valve alters fluid pressure by changing the exit pressure; the displacement pump displaces fluid at a constant flow rate, allowing the core conductivity to be further tested. At fixed axial pressure, confining pressure, and flow rate, the fluid flow capacity can be measured under different fluid pressures if the back pressure changes, which then corresponds to stress sensitivity. A comparison between the parameters of the two samples in Table 5 confirms that stress sensitivity was much higher after the growth of fractures, which is thus an important parameter for quantitatively evaluating microfractures.

FIGURE 16. Rock stress sensitivity test flow graph of parallel cores.
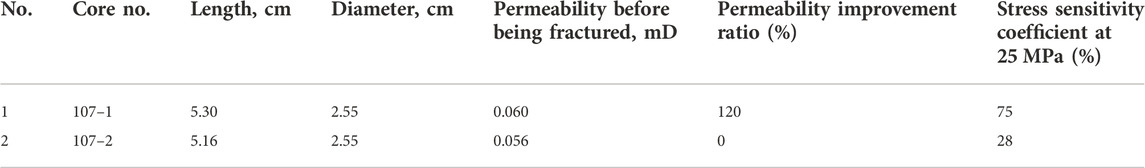
TABLE 5. Rock properties of the stress sensitivity test.
In Figure 17, it is obvious that the magnitude of rock stress sensitivity can be divided into two stages at critical pressure. Stress sensitivity is weak when pressure remains below the critical value. At this time, sensitivity comes from larger throats as fractures remain closed, leading to weak stress sensitivity due to low compressibility and expansibility of the low-permeability layers. Rock stress sensitivity increases sharply after pressure exceeds the critical value and microfractures start to open, providing extra flow channels and producing a larger permeability. The critical value is called reopening pressure. Through comparisons between permeabilities with and without microfractures, it can be concluded that microfractures are the primary cause of rock stress sensitivity.
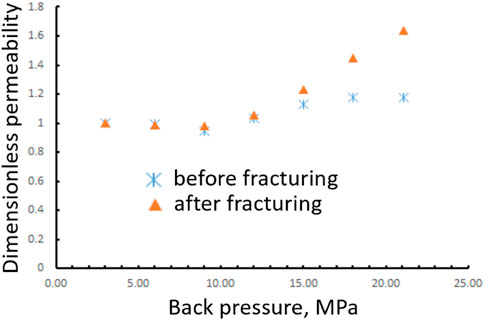
FIGURE 17. Rock stress sensitivity test curve.
Artificial fractures share common properties in terms of fluid flow, for example, directional flow capacity, directional flow rules, and stress sensitivity. But as artificial fractures are much larger than microfractures, the shared properties are even more obvious and the roles in fluid flow are different from those applying to microfractures. The outcrop planar model was introduced to analyze how artificial fractures perform during fluid flow. Figure 18 describes the five planar models to be used in detail. In each model, there is one injector and one producer. The direction from injector to producer is the main flow direction. One model has no fracture; two models have fractures parallel to the main flow direction; and the other two models have fractures that are at 45° to the main flow direction. The two fractures have different lengths. A brine of 20,000 PPM was injected and Figures 19 and 20 show the water flow rate of the various models and how the water was displaced.
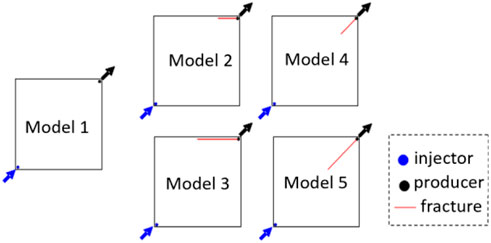
FIGURE 18. Models of artificial fracture experiments.
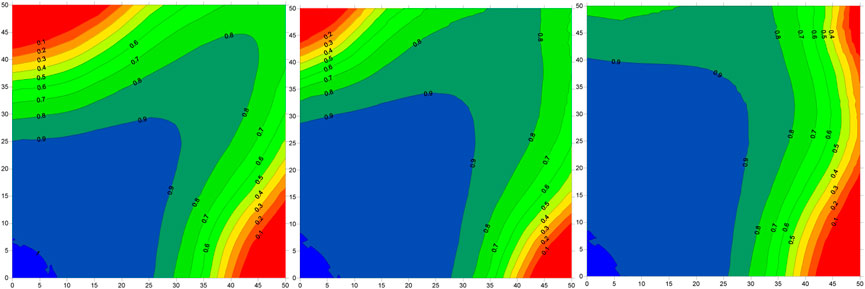
FIGURE 19. Water displacement in models 1, 2, and 3.
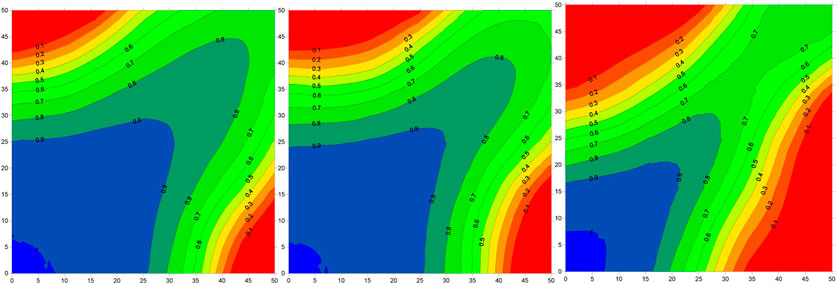
FIGURE 20. Water displacement in models 1, 4, and 5.
Figure 20 reveals that the swept area expanded when fractures extended at an angle of 45° to the main flow direction, while it decreased when the fractures ran parallel with the main flow direction. It was determined that fractures improved fluid conductivity and increased production area when they acted as extra water producers. By contrast, the swept area shrank when fractures were parallel to the main flow direction since parallel fractures only helped to add fluid conductivity, which intensified the heterogeneity along the flow direction and reduced the sweep efficiency. Accordingly, it was concluded that fractures contributed to higher conductivity; the smaller the angle between fractures and the main flow direction, the more contributions fractures provide for a certain fracture length.
To reduce the possibility of fracturing, horizontal wells are usually drilled vertically into natural fractures to obtain parallel fractures. If natural fractures are viewed as the main flow direction, the direction of the fracturing fractures is then consistent with that of the main flow, which promotes efficient displacement by reducing the pressure drop distance and increasing the local displacement pressure difference. Therefore, it is highly recommended to control horizontal well length during water-flooding.
Based on nonlinear flow experiments and triaxial compression tests, this paper revealed the interactions between nonlinear flow and the microfracture network. It also analyzed the impact of microfracture networks on nonlinear flow, two-phase flow, rock stress sensitivity, and artificial fractures. This paper basically contributes to the sum of knowledge by increasing our understanding of nonlinear flow in a complex fracture network. This paper also determined that the pore structure and stress environment play significant roles in the industrial practice of hydraulic fracturing. The key innovation point of this paper was to integrate the nonlinear flow mechanism with the complex pore-fracture system based on experiment and analysis. The following conclusions can be drawn from the study results:
1) The capillary sizes and medium heterogeneity are the determining factors of nonlinear flow. As the pressure drops, fluid is not able to flow in a portion of capillaries, the flow capacity drops, and its nonlinear flow characteristics appear.
2) Under the impact of microfractures, the nonlinear region shrinks, and the nonlinearity decreases. Microfractures yield better reservoir physical properties, reduce nonlinear flow, and improve fluid mobility.
3) Microfractures can be regarded as parts of matrix pores as their size is still at micro-scale. As the number of microfractures greatly increases, the role of microfractures in fluid flow is more important than that of natural fractures. Under a stress of 21 MPa, the permeability change increases from 10% to 70% in 200 min.
4) Microfractures significantly increase rock stress sensitivity and reduce the threshold of permeability to allow fluid flow. Fractures can be generated immediately if the stress reaches 32 MPa, as shown in this study.
The original contributions presented in the study are included in the article/Supplementary material; further inquiries can be directed to the corresponding author.
MH: results and discussions XL: nonlinear flow experiments JX: microfracture experiment YL: data analysis.
MH, XL, JX, and YL were employed by the company PetroChina.
All claims expressed in this article are solely those of the authors and do not necessarily represent those of their affiliated organizations, or those of the publisher, the editors, and the reviewers. Any product that may be evaluated in this article, or claim that may be made by its manufacturer, is not guaranteed or endorsed by the publisher.
Al-Yaseri, A., Abdulelah, H., Yekeen, N., Ali, M., Negash, B. M., and Zhang, Y. (2021). Assessment of CO2/shale interfacial tension. Colloids Surfaces A Physicochem. Eng. Aspects 627, 127118. doi:10.1016/j.colsurfa.2021.127118
Asadi, M. B., Dejam, M., and Zendehboudi, S. (2020). Semi-analytical solution for productivity evaluation of a multi-fractured horizontal well in a bounded dual-porosity reservoir. J. Hydrology 581, 124288. doi:10.1016/j.jhydrol.2019.124288
Bezyan, Y., Ebadi, M., Gerami, S., Rafati, R., Sharifi, M., and Koroteev, D. (2019). A novel approach for solving nonlinear flow equations: The next step towards an accurate assessment of shale gas resources. Fuel 236, 622–635. doi:10.1016/j.fuel.2018.08.157
Bunger, A. P., and Lecampion, B. (2017). Four critical issues for successful hydraulic fracturing applications. Rock Mech. Eng. 5, 551–593.
Fatah, A., Bennour, Z., Mahmud, H. B., Gholami, R., and Hossain, M. (2021). Surface wettability alteration of shales exposed to CO2: Implication for long-term integrity of geological storage sites. Int. J. Greenh. Gas Control 110, 103426. doi:10.1016/j.ijggc.2021.103426
Heider, Y. (2021). A review on phase-field modeling of hydraulic fracturing. Eng. Fract. Mech. 253, 107881. doi:10.1016/j.engfracmech.2021.107881
Ji, B., Li, L., and Wang, C. (2008). Oil production calculation for areal well pattern of low-permeability reservoir with non-Darcy seepage flow. Acta Pet. Sin. 29 (2), 256. doi:10.7623/syxb200802018
Kim, C., and Devegowda, D. (2022). Molecular dynamics study of fluid-fluid and solid-fluid interactions in mixed-wet shale pores. Fuel 319, 123587. doi:10.1016/j.fuel.2022.123587
Li, T., Li, Q., Hu, Y., XianPeng, X., Feng, X., Zhu, Z., et al. (2021). Quantitative characterization of irregular microfracture network and its effect on the permeability of porous media. Petroleum Explor. Dev. 48 (2), 430–441. doi:10.1016/s1876-3804(21)60034-4
Li, Y., Dong, P., and Zhou, D. (2020). “A new dynamic apparent permeability model for gas flow in microfractures of shale,” in Asia Pacific Unconventional Resources Technology Conference, Brisbane, Australia, 18-19 November, 2019, 1260–1277. doi:10.15530/AP-URTEC-2019-198302
Marsden, H., Basu, S., Striolo, A., and MacGregor, M. (2022). Advances of nanotechnologies for hydraulic fracturing of coal seam gas reservoirs: Potential applications and some limitations in Australia. Int. J. Coal Sci. Technol. 9 (1), 27–18. doi:10.1007/s40789-022-00497-x
Ren, J., and Guo, P. (2017). Nonlinear flow model of multiple fractured horizontal wells with stimulated reservoir volume including the quadratic gradient term. J. Hydrology 554, 155–172. doi:10.1016/j.jhydrol.2017.09.005
Song, F., Bo, L., Zhang, S., and Sun, Y. (2019). Nonlinear flow in low permeability reservoirs: Modelling and experimental verification. Adv. Geo-Energy Res. 3 (1), 76–81. doi:10.26804/ager.2019.01.06
Wang, X., Yang, Z., Sun, Y., and Liu, X. (2011). Experimental and theoretical investigation of nonlinear flow in low permeability reservoir. Procedia Environ. Sci. 11, 1392–1399. doi:10.1016/j.proenv.2011.12.209
Wang, Y., Ji, B., and Guo, W. (2006). Effective development technique for peripheral reservoirs with ultra-low permeability and ultra-low abundance in Daqing Oilfield. Acta Pet. Sin. 27 (6), 70–74. doi:10.3321/j.issn:0253-2697.2006.06.015
Wu, T., Pan, Z., Connell, L. D., Camilleri, M., and Fu, X. (2020). Apparent gas permeability behaviour in the near critical region for real gases. J. Nat. Gas Sci. Eng. 77, 103245. doi:10.1016/j.jngse.2020.103245
Xu, J., Chen, Z., Wu, K., Li, R., Liu, X., and Zhan, J. (2019). On the flow regime model for fast estimation of tight sandstone gas apparent permeability in high-pressure reservoirs. Energy Sources, Part A Recovery, Util. Environ. Eff. 2019, 1–12. doi:10.1080/15567036.2019.1687625
Xu, J., Wu, K., Li, R., Li, Z., Li, J., Xu, Q., et al. (2019a). Nanoscale pore size distribution effects on gas production from fractal shale rocks. Fractals 27 (08), 1950142. doi:10.1142/s0218348x19501421
Xu, J., Wu, K., Li, Z., Pan, Y., Li, R., Li, J., et al. (2018). A model for gas transport in dual-porosity shale rocks with fractal structures. Ind. Eng. Chem. Res. 57 (18), 6530–6537. doi:10.1021/acs.iecr.8b00021
Xu, J., Wu, K., Yang, S., Cao, J., and Chen, Z. (2017). “Nanoscale free gas transport in shale rocks: A hard-sphere based model,” in SPE Unconventional Resources Conference, Calgary, Alberta, Canada, 15-16 February, 2017 (OnePetro). doi:10.2118/185022-MS
Yu, K., Zhao, K., and Ju, Y. (2022). A comparative study of the permeability enhancement in coal and clay-rich shale by hydraulic fracturing using nano-CT and SEM image analysis. Appl. Clay Sci. 218, 106430. doi:10.1016/j.clay.2022.106430
Yu, P., Dempsey, D., and Archer, R. (2021). A three-dimensional coupled thermo-hydro-mechanical numerical model with partially bridging multi-stage contact fractures in horizontal-well enhanced geothermal system. Int. J. Rock Mech. Min. Sci. 143, 104787. doi:10.1016/j.ijrmms.2021.104787
Zeinabady, D., Clarkson, C. R., Zanganeh, B., and Shahamat, S. (2022). First-time implementation of multiple flowback DFITs (“DFIT-FBA”) along a horizontal well. J. Nat. Gas Sci. Eng. 102, 104601. doi:10.1016/j.jngse.2022.104601
Zeng, B., Cheng, L., and Li, C. (2011). Low velocity nonlinear flow in ultra-low permeability reservoir. J. Petroleum Sci. Eng. 80 (1), 1–6. doi:10.1016/j.petrol.2011.10.006
Keywords: nonlinear flow mechanisms, microfracture networks, low-permeability reservoirs, horizontal well, hydraulic fracturing technologies
Citation: Hao M, Liu X, Xia J and Liu Y (2023) Study of nonlinear flow mechanisms and microfracture networks in low-permeability reservoirs. Front. Earth Sci. 10:1015199. doi: 10.3389/feart.2022.1015199
Received: 09 August 2022; Accepted: 26 September 2022;
Published: 18 January 2023.
Edited by:
Jinze Xu, University of Calgary, CanadaReviewed by:
Gang Hui, China University of Petroleum, ChinaCopyright © 2023 Hao, Liu, Xia and Liu. This is an open-access article distributed under the terms of the Creative Commons Attribution License (CC BY). The use, distribution or reproduction in other forums is permitted, provided the original author(s) and the copyright owner(s) are credited and that the original publication in this journal is cited, in accordance with accepted academic practice. No use, distribution or reproduction is permitted which does not comply with these terms.
*Correspondence: Mingqiang Hao, aGFvbWluZ3FAcGV0cm9jaGluYS5jb20uY24=
Disclaimer: All claims expressed in this article are solely those of the authors and do not necessarily represent those of their affiliated organizations, or those of the publisher, the editors and the reviewers. Any product that may be evaluated in this article or claim that may be made by its manufacturer is not guaranteed or endorsed by the publisher.
Research integrity at Frontiers
Learn more about the work of our research integrity team to safeguard the quality of each article we publish.