 Na Chen
 Nanmeng Wang1
- 1School of Civil Engineering, Architecture and Environment, Hubei University of Technology, Wuhan, China
- 2Hubei Key Laboratory of Blasting Engineering of Jianghan University, Wuhan, China
- 3Department of Mining and Geological Engineering, University of Arizona, Tucson, AZ, United States
- 4Hubei University of Technology Engineering and Technology College, Wuhan, China
- 5Changjiang Engineering Group, Wuhan, China
Airborne lidar is a technology for mapping surface spatial information and has been widely used in many areas of geospatial information disciplines. The filtering process of removing non-ground points has always been the focus of research. PTD (Progressive Triangular Irregular Network Densification) filtering algorithm is a widely used filtering algorithm for airborne lidar data. However, this algorithm has shortcomings in retaining ground points in steep areas, leading to large type Ⅰ errors. Therefore, this paper proposes an improved PTD algorithm. The improvement is the addition of the seed points filtering. Specifically, after the potential seed points are obtained by the progressive morphological filter, the seed points filtering is performed on it to remove the non-ground points, so that the obtained seed points are more accurate. The benchmark dataset of ISPRS (International Society for Photogrammetry and Remote Sensing) Working Group III is used to assess the proposed method. Results show that the method is effective in decreasing type Ⅰ error in steep areas. Comparing with the classic PTD algorithm, the type Ⅰ error and total error are decreased by 8.46% and 5.06% respectively. In addition, the proposed method shows a great advantage in computational efficiency, that is eight times more efficient than the classic PTD algorithm.
1 Introduction
Airborne lidar shows great advantages in accurately acquiring 3D terrain information (Zhang et al., 2013), and has been utilized in many environmental applications (Zhang and Lin, 2013). For instance, reconstruction of DTM (Digital Terrain Model) (Mongus and Zalik, 2012; Polat and Uysal, 2015; Xiangyun et al., 2015), 3D building modeling (Rutzinger et al., 2009; Wang, 2013), hydrological modeling (Linde, 2010; Massimo et al., 2015), landslide assessments (Huang et al., 2021), highwall slopes surface measurement of open-pit mines (Nguyen et al., 2018), roof bolt classification (Singh et al., 2021), forest inventory and management (Koch et al., 2006; Liu et al., 2013). For these applications, the key processing step is the classification of the irregular point cloud (Shen et al., 2012).
However, how to accurately extract terrain information from irregular point clouds is the problem to be solved (Zhang, 2010), and one of the crucial processing steps is filtering. In short, it is to find out which is returned from the ground and which is returned from the objects on the ground in the disordered and discrete 3D point clouds (Meng et al., 2010). For example, in landslide susceptibility prediction (Huang et al., 2020) and reliability analysis (Jiang and Huang, 2018), most scholars use lidar. However, due to the influence of vegetation, it is difficult for lidar to collect landslide data, it is necessary to obtain high-precision DEM (Digital Elevation Model) through filtering to establish a landslide model.
Filtering algorithms can be classified according to the theoretical background. According to the concept of filtering, Sithole and Vosselman classify filters into four categories: slope-based (Susaki, 2012; Wu et al., 2016), block-minimum (Streutker and Glenn, 2006; Glenn et al., 2011), clustering/segmentation (Hu et al., 2013; Yang et al., 2013), and surface-based algorithms (Sithole and Vosselman, 2004). The principle of surface-based filtering algorithms is to create a surface that is closest to the bare ground surface (Nie et al., 2017). It is classified as morphology-based filters (Li et al., 2013; Pingel et al., 2013), iterative interpolation-based filters (Polat et al., 2015), and progressive-densification-based filters (Zhang and Lin, 2013; Nie et al., 2017). We briefly review morphological-based filters and progressive densification-based filters as they are related to our proposed method.
Morphology-based filters are based on morphology open and close operations (Zhang et al., 2003; Najman and Talbot, 2011). Zhang et al. (2003) processed point clouds by changing the window size. If the distance between raw gridded point clouds and gridded point clouds after opening operations was greater than thresholds, the grid is marked as a non-ground grid. Chen et al. (2007) used an increasing window size morphological opening operation to remove buildings. Li et al. (2013) propose a gradient-constrained morphology algorithm that decreases the object removal operation and improves the accuracy of the algorithm. Pingel et al. (2013) classified points by changing the elevation threshold.
The progressive densification-based filter first constructs an initial TIN (Triangular Irregular Network) with some ground seed points and performs iterative densification until no more points can be added to the TIN. Axelsson (2000) first divides irregular point clouds into grids, using the lowest point in each grid as the initial ground point. Then a TIN is used as the reference surface. In each iteration, the angles and distances of the remaining points to the triangle are judged by thresholds, and the points that satisfy the conditions are added to the TIN. Before the next iteration, add all currently classified ground points to the TIN until all points are classified. Nie et al. (2017) propose a revised PTD algorithm, which revised the existing TIN and iteration steps, decreasing the three types of errors.
Among these filtering algorithms, the PTD filtering algorithm is robust. This method has two key steps, selecting seed points and constructing the initial TIN, iterative densification of the TIN (Axelsson, 2000). However, the PTD algorithm directly defines the lowest point as the seed point that will lead to errors. And the algorithm cannot correctly detect potential ground points in steep areas (Nie et al., 2017). In addition, when the amount of points is particularly high, this method takes lots of memory space and a long computing time.
To solve the above problems, we propose an improved PTD filtering algorithm to optimize the selection of seed points and the computational efficiency. After acquiring potential ground seed points through the progressive morphological filtering algorithm, the seed point filtering is applied to them. The purpose is to remove the non-ground points in the potential ground seed points. These potential ground points are used as the seed points of TIN, and ground points acquired after iterative progressive densification are closer to the terrain, which can reduce the type Ⅰ error and the total error.
2 Methods
The classic PTD algorithm assumes potential ground points as seed points for subsequent filtering by default, resulting in large errors. To solve the limitations of the classic PTD algorithm, we proposed an improved PTD filtering algorithm combined with the progressive morphological filter, the flow chart is shown in Figure 1. The proposed method includes the following four steps.
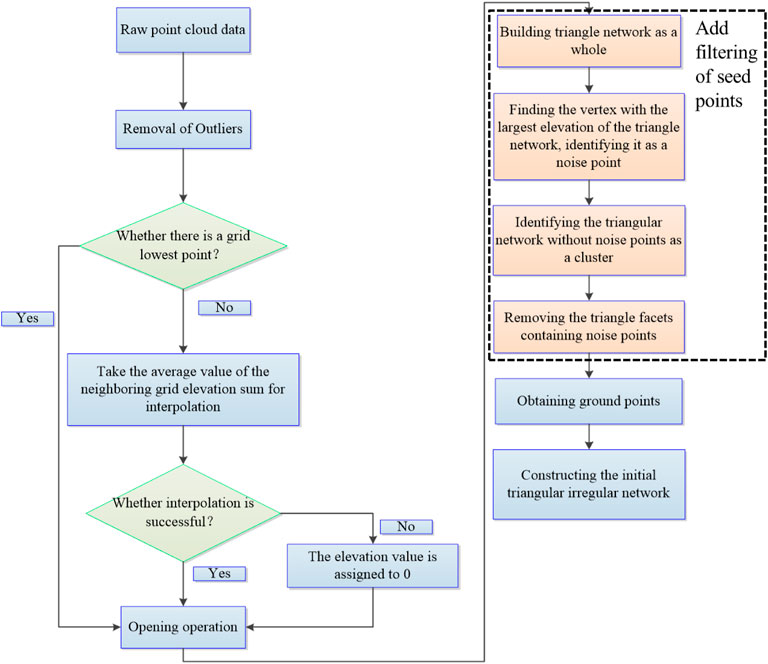
FIGURE 1. Flow chart of the improved filtering algorithm in this paper.
Firstly, the method of elevation histogram is built to remove outliers.
Secondly, the initial potential seed points close to the terrain are obtained by using the opening operation of the progressive morphological algorithm.
Thirdly, the potential seed points are filtered to obtain more accurate ground seed points.
Fourthly, the acquired seed points as the initial seed points to construct the initial TIN, and iterative progressive densification is started to obtain the final ground points.
2.1 Outliers removal
Many point clouds include noise and outliers (Ren et al., 2021) (as shown in Figure 2). Outliers are one of the situations that may cause filtering algorithms to fail (Sithole and Vosselman, 2004). Therefore, this paper introduces a method to remove outliers based on the histogram of point cloud elevation distribution. There are three key steps, including:
(a) The elevation histogram is built and examined by visualizing the distribution of elevation values, and then elevation thresholds were determined to eliminate the lowest and highest tails from the distribution
(b) The outliers missed in the previous step are searched by determining the minimum elevation difference between each point and the surrounding points.
(c) Manually correct errors during outliers’ removal.
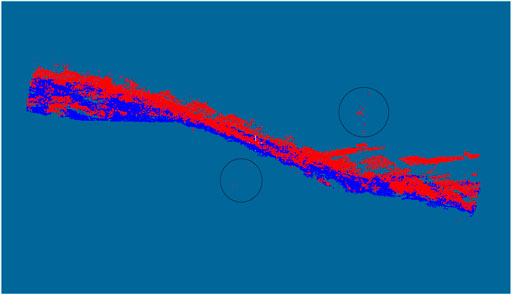
FIGURE 2. Outliers are present in sample11.
2.2 Selecting potential ground seed points
To select potential ground seed points, the irregular point cloud needs to be divided into regular grids. The lowest point elevation value is used as the grid value to form the minimum elevation surface, for which a progressive morphological filtering open operation is performed.
In each opening operation, points with angle and distance above thresholds are marked as non-ground points. Points that are not marked are considered as potential ground seeds. The specific steps are as follows:
A. The grid is divided as shown in Figure 3A. The raw point cloud is divided into uniform grids according to the basic window size. The lowest point in grids (blue point in grids) is selected, and the elevation value of the lowest point is used as the grid value. Since the grid data may have null values, it is necessary to interpolate the grid in eight neighborhoods (Figure 4, with point “P0” as the starting point, and interpolate to the surrounding eight grids). The minimum value of the elevation in the null grid is taken as the average of the elevation sum of the neighboring grids. If the interpolation fails, the elevation value of the grid is assigned to “0”, such as the red points in the grid in Figure 3B. The interpolation process avoids the missing point clouds in places with large slopes due to the lack of laser scanning, which affects the correct selection of subsequent seed points. The minimum elevation surface is obtained after the above operation, and it is used as the input for the subsequent progressive morphological opening operation.
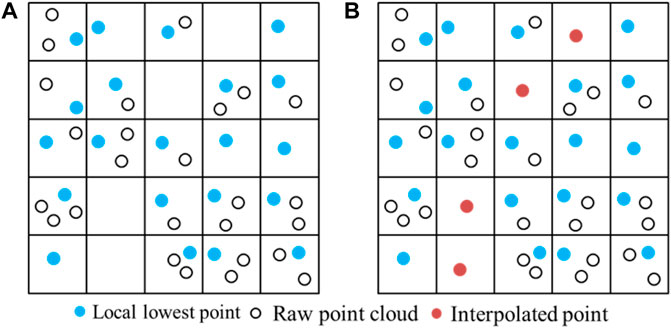
FIGURE 3. (A) Point cloud grid before interpolation; (B) Point cloud grid after interpolation.
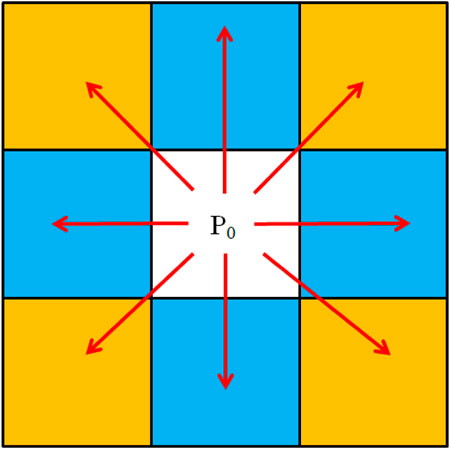
FIGURE 4. Eight-neighborhood interpolation.
B. Progressive morphological filtering. The minimum elevation surface obtained in the previous step is used to start the progressive morphological filtering, which uses a multi-scale progressive window to perform a progressive morphological opening operation on the ground seed points. In Figure 5, the initial filtering is performed at window size W1. When the height difference hp,1between point “P” and the filtering surface is less than or equal to the height difference threshold hT,1, the classification P is a ground point. hmax(t),1 is the maximum height difference between the ground before filtering and the filtering surface. If hmax(t),1 is less than hT,1, all ground points on the terrain surface are retained. In the second filtering, the window size is increased to W2. If the maximum height difference hmax(t),2 between the previous filtering surface and this filtering surface is smaller than the height difference threshold hT,2, all ground points whose height difference is less than hmax(t),2 from this filtering surface are retained. Similarly, if the minimum height difference hmin (t),2 of the building between the last filtering operation and the filtering operation is greater than hT,2, the building is removed.

FIGURE 5. Schematic diagram of the progressive morphological filter.
In the xth filtering, the window size is increased to Wk. If the height difference hp,k between a point “N” and the filtering surface is less than or equal to the height difference threshold hT,k, the classification P is a ground point. hT,k is usually the minimum height of buildings in the area.
In each of the above filtering processes, the window size Wk and the height difference threshold hT,k need to be determined. Wk is calculated in both Eqs. 1, 2.
In Eq. 1, k is the number of iterations, w0 is the initial window size, and the final add one is to ensure that wk is an odd number and the window is symmetrical. However, if a study area has very large buildings, Eq. 1 increases the window size too slowly and takes more time. Therefore, a second approach can be used to change the window size by exponential growth, calculated as follows:
The growth rate in this way is much faster than in Eq. 1. It is closely related to the slope of the terrain in the study area, which can be determined by Eq. 3.
In the equation, h0 is the initial height difference, s is the terrain slope, c is the grid size, hmax is the maximum height difference. The relationship between the terrain slope s and the window sizes Wk, Wk-1 and the maximum height difference hmax(t),k is shown in Eq. 4.
A new filter window size and a different elevation interpolation threshold are calculated until the window size is above the preset maximum window size, and points that are not marked are considered as potential ground seed points.
2.3 Seed points filtering
The potential ground seed points generally cannot be directly applied as initial seed points of the PTD algorithm, otherwise, it will lead to type Ⅰ error that cannot be well reduced. For example, Xiangguo and Jixian (2014) use the “Segmentation-Based Filtering algorithm” with type Ⅰ error of up to 62.22%. Nie et al. (2017) use the “Revised PTD filter algorithm” with type Ⅰ error of up to 52.026%.
In the actual processing of progressive morphological filtering, it is difficult to select the optimal parameters to remove these ground points at one time, as steep slopes or building roofs are often missed in the ground points due to the abrupt change of elevation. The analysis of the acquired potential ground seed points reveals that building roofs or high vegetation noise points usually float in clusters on the ground points with large height differences.
Therefore, this paper proposed a seed points filtering method to remove the non-ground points in the potential ground seed points. Considering non-ground points will form larger or narrow triangles, and the aggregated high noise points will form small, locally prominent elevation surfaces. The proposed seed points filtering process mainly has the following principles:
1. Finding the triangular network with the larger side length of the triangular surface piece, and then traversing the vertices, the vertex with the largest elevation is identified as a noise point.
2. The triangular network clusters formed by noise points generally contain narrow triangular facets (the triangular network formed by red noise points and blue ground points in Figure 6), the noise facets can be removed based on these features to obtain more accurate ground seed points. Performing Floodfill algorithm on the triangulation, finding the surrounding adjacent triangulation, and identifying the triangulation without noise points as a cluster (the triangle network formed by the blue ground in Figure 6) until all triangle networks clusters are found.
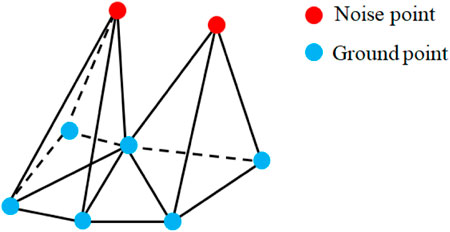
FIGURE 6. Schematic diagram of the triangular network.
The ground points obtained are closer to the actual terrain after the above filtering process, and these points are used as seed points of PTD algorithm for progressive densification. Then the next step is to get the ground points.
2.4 Obtaining ground points
When using the TIN model for topographic representation, narrow triangles should be prevented Figure 7A. Therefore, the method of constructing a buffer zone in the literature (Zhao et al., 2016) is introduced in this paper Figure 7B. Proceed in these steps: the seed point cloud is projected into the XY plane corresponding to the seed points, expanding the seed point cloud externally to form a buffer zone, and interpolating uniformly along the buffer zone. This can avoid the loss of the triangular network at the boundary, which causes the points at the boundary to be unavailable for iterative computation (Zhao et al., 2016). The next step is the iterative densification of the triangulation network.

FIGURE 7. (A) Raw triangle network without a buffer zone; (B) triangle network after adding a buffer zone.
The traditional iterative densification of triangulation networks are performed by stepwise insertion. After determining that the point is ground, insert it into the TIN constructed in the previous step.
However, the insertion of single points is less efficient, and this paper makes a small improvement here by iterating through all the non-ground points at each iteration. The points that satisfy the conditions are inserted into the constructed TIN as ground points at one time and continue to iterate the remaining non-ground points. Depending on the new TIN, calculating the iterator angle and iterator distance, and using the points that meet the conditions as new ground seed points. Repeating the above-mentioned network construction process and iterative process until the number of iterations exceeds the threshold or no new ground points are added to seed points so that obtained seed points contain all ground points. Since there are interpolated points in the first step of gridding and triangular networks iterative densification but these points do not belong to the actual ground, removing these points, the final obtained points are the actual ground points.
3 Experiments and results analysis
3.1 Experimental data
The airborne LIDAR sample data provided by the ISPRS Working Group III in 2003 were used for filtering tests.
The eight datasets (four from the urban and four from the village) were acquired by an OptechALTM scanner (Chen et al., 2020). Fifteen samples were extracted from these eight datasets for later quantitative analysis. These 15 samples represent different environments consisting of steep slopes, vegetation, dense buildings, railway stations, multi-story, bridges, tunnel entrances, and quarries (Sithole and Vosselman, 2004). These samples have been corrected by semi-automatic filtering and visual discrimination, and all points have been accurately classified. Each point was marked with a category (Figure 8), where blue points are real ground points and red points are real non-ground points.
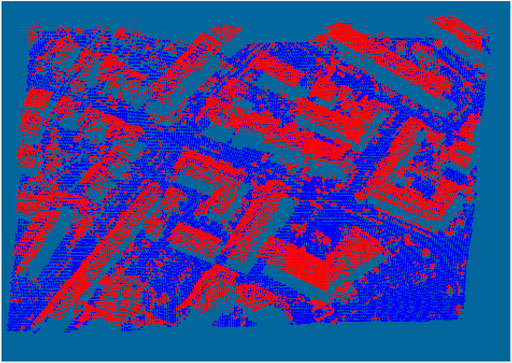
FIGURE 8. Point cloud of sample 12.
3.2 Parameters description
The proposed method requires presetting six parameters, including max building size, initial window size, max terrain angle, number of iterations, iterator angle, and iterator distance.
1) Max building size: The length threshold, which the algorithm can handle buildings not exceeding, is used to define the size of grid cells;
2) Initial window size: Input parameters for progressive morphological filtering, used to control local seed points;
3) Max terrain angle: Slope threshold that decides whether to judge unclassified points by mirroring;
4) Number of iterations: By increasing the number of iterations, some points of steep slope can be iterated to ground points;
5) Iterator angle and Iterator distance: Calculating whether a point is a ground point;
3.3 Results analysis
Three accuracy indexes proposed in the literature (Chen et al., 2007) are used to analyze the accuracy of the algorithm, which include type Ⅰ error, type Ⅱ error, and total error (Table 1).
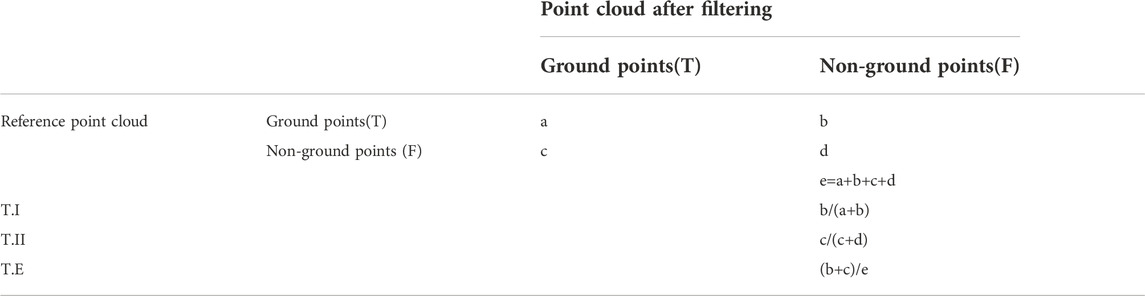
TABLE 1. Calculation equation for three types of errors.
Type Ⅰ error reflects the ability in retaining ground points. Type II error reflects the ability in removing non-ground points. Total error reflects the balance and practicability of the algorithm. The parameters in (Table 1), “a” and “d” are the number of correctly recognized ground points and non-ground points respectively, “b” and “c” are the numbers of misclassified ground points and non-ground points respectively. Table 2 lists the test results of three kinds of errors of 15 samples provided by ISPRS by this algorithm and the PTD algorithm.
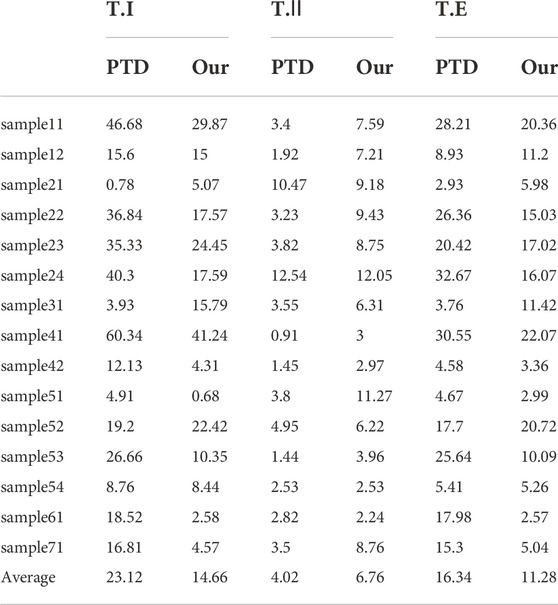
TABLE 2. Comparison results.
The total error of 15 samples for both filters in Table 2 is less than 32.67%. As shown in Figure 9, the type I error (T.I) and total error (T.E) of our method are significantly lower than the classic PTD algorithm. Specifically, among 15 samples, the T. I error of our method is lower than that of the classic PTD algorithm in 12 samples, and the T.E error is lower than that of the classic PTD algorithm in 10 samples (Figure 9, Figure 10). In average, the T. I error and T.E error of our method is decreased by 8.46% and 5.06%. Nevertheless, the T. II error of the classic PTD algorithm is higher than our method in four samples (Figure 11). The above disadvantages of our method are not fatal. Since correcting type II error is less than correcting type I error (Sithole and Vosselman, 2004).
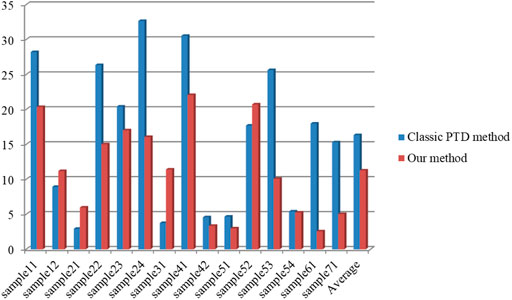
FIGURE 9. Total error comparison chart.
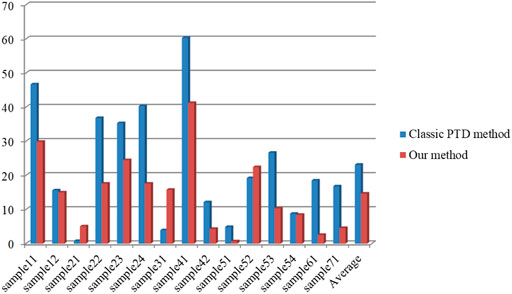
FIGURE 10. Type I error comparison chart.
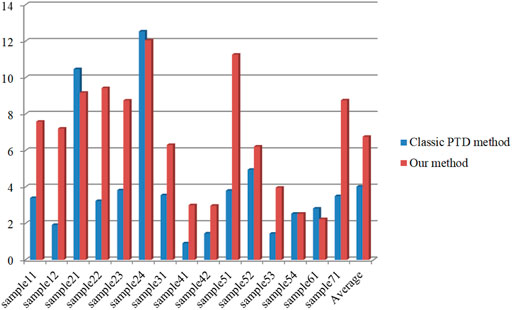
FIGURE 11. Type Ⅱ error comparison chart.
3.3.1 Filtering results analysis of four samples
In addition, this paper also lists the filtering result of four representative sample data to show the details of filtering, namely Sample11, Sample23, Sample42, and Sample53, and the specific experimental results and analysis are as follows.
The main data features of Sample11 are vegetation and structures located on steep terrain, this type of terrain is generally testable for the filtering algorithm, most filtering algorithms have a large error here. Our method reduces the type I error by 16.81% and the total error by 7.85% compared with the classic PTD algorithm, which reflects the accuracy of the algorithm. Figure 12A is the raw image of the sample, the red point in Figure 12B is the type Ⅰ error, and the blue point in Figure 12C is the type Ⅱ error. In Figure 12B, type Ⅰ error is mainly distributed in a small part of the building area in the marked circle, but in the steep areas (the rectangular part in Figure 12B), our method still accurately identifies ground points.
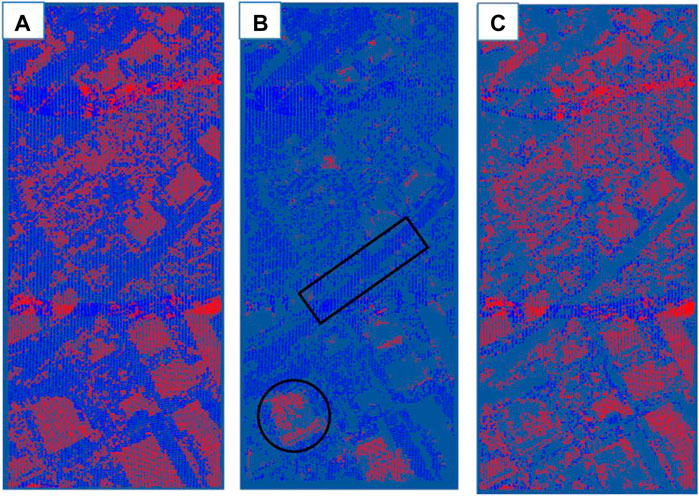
FIGURE 12. Filtering results for sample 11: (A) initial point cloud; (B) filtered point cloud (blue points), red points are the type Ⅰ error; (C) filtered point cloud (red points), blue points are the type Ⅱ error.
The main data features of sample 23 are buildings and a small amount of vegetation. There are special closed circular terrains in the buildings, the interiors are ground points, and the boundaries are buildings, which is a test of the algorithm’s ability to judge complex structures. Our method reduces the type Ⅰ error by 10.88% and the total error by 3.4%. As can be seen in the filtering results, the buildings are filtered out, the circular structure in the middle is excluded, and the type Ⅰ error is basically outside the circle. As seen in the rectangular part in Figure 13B, our method can extract most of the road information. Part of the discontinuity is due to the interference of different materials and noise points, but overall, better road information can be obtained.
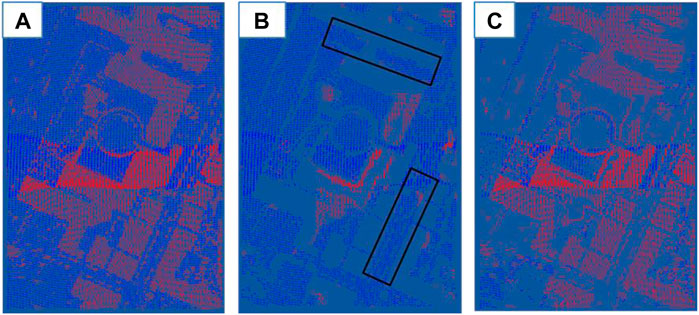
FIGURE 13. Filtering results for sample 23: (A) initial point cloud; (B) filtered point cloud (blue points), red points are the type Ⅰ error; (C) filtered point cloud (red points), blue points are the type Ⅱ error.
As the relatively regular topographic structure characteristics of sample 42, the data filtering results of both algorithms are more satisfactory. Our method reduces type Ⅰ error by 7.82% and the total error by 1.22%. As in Figure 14C, the basic feature blocks are distinguished, which provides a good basis for the subsequent filtering judgment, and the filtering effect is ideal.
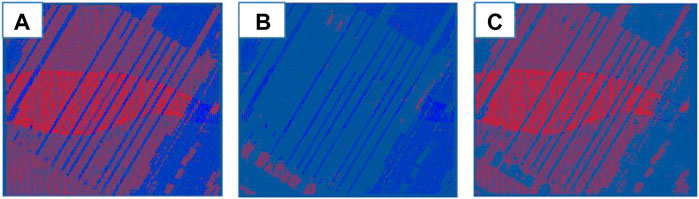
FIGURE 14. Filtering results for sample 42: (A) initial point cloud; (B) filtered point cloud (blue points), red points are the type Ⅰ error; (C) filtered point cloud (red points), blue points are the type Ⅱ error.
The data features of sample 53 are mainly discontinuous terrain and steep slopes. Although there are fewer buildings, the terrain structure is more complex, the steep slopes are disconnected, and the buildings are mainly distributed on different steep slopes. Our method reduces the type Ⅰ error by 16.31% and the total error by 15.55%. The filtering results are generally ideal. There are barely any non-ground points in Figure 15B, which is enough to prove that this algorithm has its advantages in retaining ground points in steep areas.
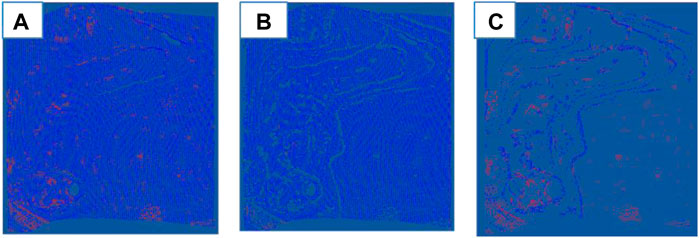
FIGURE 15. Filtering results for sample 53: (A) initial point cloud; (B) filtered point cloud (blue points), red points are the type Ⅰ error; (C) filtered point cloud (red points), blue points are the type Ⅱ error.
3.3.2 Filtering results analysis of eight filtering algorithms
In addition, the proposed method and eight filters proposed by (Sithole and Vosselman, 2004) are quantitatively evaluated in Figure 16. Figure 16A and Figure 16C show that out of these 15 samples, there are three samples where our method is second lowest and five samples where our method is second lowest. Moreover, our method has 11 samples below the type I error average value, and the total error also has nine samples below the average value.
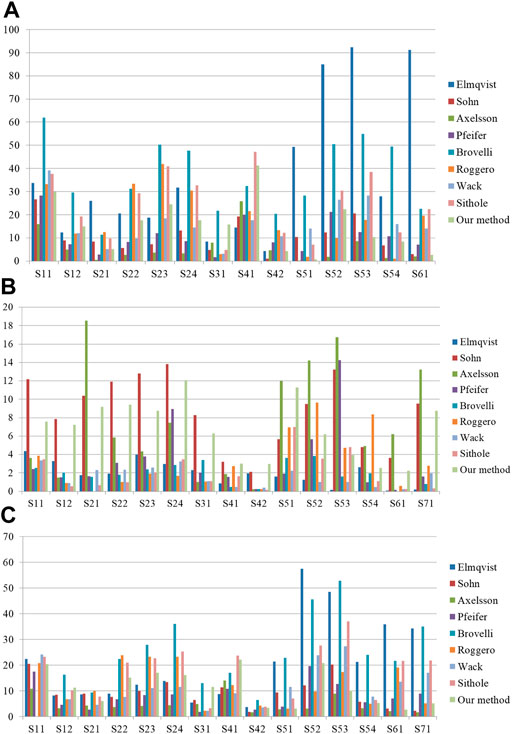
FIGURE 16. Results of the eight filters and the proposed method in three types errors: (A) type I errors; (B) type II errors; (C) total errors.
4 Discussions
Lidar provides a quick and precise solution for high-precision, large-area data acquisition (Kukko and Hyyppä, 2009), and is increasingly being used as a means of generating DEMs (Hill et al., 2000). DEM is an important terrain model and a basic requirement for many applications. Conventional methods of DEM generation are time-consuming (Polat et al., 2015). As research has advanced, lidar has become a main means for generating DEM. High-precision DEM and DTM play an important role in urban mapping (Lm et al., Zahdi and Nagai, 2021), forest management (Wang et al., 2016; Cai et al., 2019), landslide assessment and other fields (Han et al., 2014). Liu and Lim (2018) proposed a voxel-based morphological filtering algorithm to generate DEM in complex forest areas, and applied it in forest management, so as to make rational planning and utilization of forest and agriculture. Chen et al. (2012) proposed an upward-fusion filtering algorithm to establish an urban DTM, saving a lot of manual collection time. Huang et al. (2021) used DEM as a data source to assess landslides and performed better than hydrological methods in both accuracy and efficiency. However, the point cloud data obtained from LIDAR is discrete and irregular, which requires filtering the raw point cloud data to generate accurate DEM and DTM (Axelsson, 2000).
Therefore, the filtering algorithm proposed in this paper is compared with the widely used PTD filtering algorithm. Through the analysis of 15 samples, it is concluded that this paper has advantages in reducing the T. I error and T.E error. Comparing with the classic PTD algorithm, the DEM and DTM obtained are more accurate.
However, the proposed method contains six parameters that require manual debugging, which may affect the efficiency. The type II error of our method is higher than the classic PTD algorithm in 11 samples (Figure 11). Consequently, future research should aim at automating of the algorithm parameters and the reduction of type II error to make the algorithm more efficient.
5 Conclusion
Point cloud filtering is an important part of lidar data processing, and several filtering algorithms have been proposed. Among them, PTD is widely used, but it may not be able to retain ground points in areas with steep terrain. Therefore, this paper proposes an improved PTD filtering algorithm combined with the progressive morphological filter, after obtaining the potential ground seed points, seed points filtering is performed on it. The obtained seed points are closer to the actual terrain.
The experimental results demonstrate that the method performs effectively in reserving ground points in steep areas. Reducing the type Ⅰ error and total error by 8.46% and 5.06% respectively. At the same time, our method shows a great advantage in computational efficiency, the cost time of the classic PTD algorithm is 16.35s and the cost time of the algorithm proposed by Nie et al. (2017) is 102.14s, the cost time of our method is only 2.25s. Therefore, our improved PTD algorithm has a great improvement in accuracy and efficiency. In four representative samples, good filtering results were achieved. Improves the accuracy and efficiency of the PTD algorithm.
Data availability statement
The original contributions presented in the study are included in the article/supplementary material, further inquiries can be directed to the corresponding author.
Author contributions
Conceptualization, NC and JZ; data curation, NC, JK, and NW; funding acquisition, NC, YH, and XD; methodology, NC and NW; software, NC and JZ; project administration, NC and XD; supervision, JK and JZ; writing—original draft, NC and NW; writing—review and editing, NC, YH, and NW. All authors have read and agreed to the published version of the manuscript.
Funding
This work was supported by the National Natural Science Foundation of China (Grant No. 52009038) and the Foundation of Hubei Key Laboratory of Blasting Engineering (No. BL 2021-21).
Conflict of interest
The authors declare that the research was conducted in the absence of any commercial or financial relationships that could be construed as a potential conflict of interest.
Publisher’s note
All claims expressed in this article are solely those of the authors and do not necessarily represent those of their affiliated organizations, or those of the publisher, the editors and the reviewers. Any product that may be evaluated in this article, or claim that may be made by its manufacturer, is not guaranteed or endorsed by the publisher.
References
Axelsson, P. (2000). DEM generation from laser scanner data using adaptive TIN models. Int. archives photogrammetry remote Sens.
Cai, S., Zhang, W., Liang, X., Wan, P., Shao, J., Yu, S., et al. (2019). Filtering airborne LiDAR data through complementary cloth simulation and progressive TIN densification filters. Remote Sens. 11, 1037. doi:10.3390/rs11091037
Chen, C., Wang, M., Chang, B., and Li, Y. (2020). Multi-level interpolation-based filter for airborne LiDAR point clouds in forested areas. IEEE Access 8, 41000–41012. doi:10.1109/access.2020.2976848
Chen, Q., Gong, P., Baldocchi, D., and Xie, G. (2007). Filtering airborne laser scanning data with morphological methods. Photogramm. Eng. remote Sens. 73, 175–185. doi:10.14358/pers.73.2.175
Chen, Z., Devereux, B., Gao, B., and Amable, G. (2012). Upward-fusion urban DTM generating method using airborne Lidar data. ISPRS J. Photogramm. Remote Sens. 72, 121–130. doi:10.1016/j.isprsjprs.2012.07.001
Glenn, N. F., Spaete, L. P., Sankey, T. T., Derryberry, D. R., Hardegree, S. P., and Mitchell, J. J. (2011). Errors in LiDAR-derived shrub height and crown area on sloped terrain. J. Arid Environ. 75, 377–382. doi:10.1016/j.jaridenv.2010.11.005
Han, H., Ding, Y., Zhu, Q., Bo, W., Lin, H., Du, Z., et al. (2014). An adaptive surface filter for airborne laser scanning point clouds by means of regularization and bending energy. ISPRS J. Photogramm. Remote Sens. 92, 98–111. doi:10.1016/j.isprsjprs.2014.02.014
Hill, J. M., Graham, L. A., and Henry, R. J. (2000). Wide-area topographic mapping and applications using airborne light detection and ranging (LIDAR) technology. Photogrammetric Eng. Remote Sens. 66, 908–914.
Hu, X., Li, X., and Zhang, Y. (2013). Fast filtering of LiDAR point cloud in urban areas based on scan line segmentation and GPU acceleration. IEEE Geosci. Remote Sens. Lett. 10, 308–312. doi:10.1109/lgrs.2012.2205130
Huang, F., Cao, Z., Jiang, S. H., Zhou, C., and Guo, Z. (2020). Landslide susceptibility prediction based on a semi-supervised multiple-layer perceptron model. Landslides 17, 2919–2930. doi:10.1007/s10346-020-01473-9
Huang, F. M., Tao, S. Y., Chang, Z. L., Huang, J. S., Fan, X. M., Jiang, S. H., et al. (2021). Efficient and automatic extraction of slope units based on multi-scale segmentation method for landslide assessments. Landslides 18, 3715–3731. doi:10.1007/s10346-021-01756-9
Jiang, S. H., and Huang, J. (2018). Modeling of non-stationary random field of undrained shear strength of soil for slope reliability analysis. S0038080617301592: Soils & Foundations.
Koch, B., Heyder, U., and Weinacker, H. (2006). Detection of individual tree crowns in airborne lidar data. Photogramm. Eng. remote Sens. 72 (4), 357–363. doi:10.14358/pers.72.4.357
Kukko, A., and Hyyppä, J. (2009). Small-footprint laser scanning simulator for system validation, error assessment, and algorithm development. Photogramm. Eng. remote Sens. 75, 1177–1189. doi:10.14358/pers.75.10.1177
Li, Y., Wu, H., Xu, H., An, R., Xu, J., and He, Q. (2013). A gradient-constrained morphological filtering algorithm for airborne LiDAR. Opt. Laser Technol. 54, 288–296. doi:10.1016/j.optlastec.2013.06.007
Linde, H. (2010). Stream network modelling using lidar and photogrammetric digital elevation models: A comparison and field verification. Hydrol. Process. 22, 1747–1754.
Liu, J., Shen, J., Zhao, R., and Xu, S. (2013). Extraction of individual tree crowns from airborne LiDAR data in human settlements. Math. Comput. Model. 58, 524–535. doi:10.1016/j.mcm.2011.10.071
Liu, L., and Lim, S. (2018). A voxel-based multiscale morphological airborne lidar filtering algorithm for digital elevation models for forest regions. Measurement 123, 135–144. doi:10.1016/j.measurement.2018.03.020
Massimo, D., Carlo, G., and Martino, B. (2015). Comparative analysis of the differences between using LiDAR and contour-based DEMs for hydrological modeling of runoff generating debris flows in the Dolomites. Front. Earth Sci. (Lausanne). 3. doi:10.3389/feart.2015.00021
Meng, X., Currit, N., and Zhao, K. (2010). Ground filtering algorithms for airborne LiDAR data: A review of critical issues. Remote Sens. 2, 833–860. doi:10.3390/rs2030833
Mongus, D., and Zalik, B. (2012). Parameter-free ground filtering of LiDAR data for automatic DTM generation. ISPRS J. Photogrammetry Remote Sens. 67, 1–12. doi:10.1016/j.isprsjprs.2011.10.002
Najman, L., and Talbot, H. (2011). “Mathematical morphology: From theory to applications,” in Mathematical morphology : From theory to applications.
Nguyen, Q. L., Michal, B., Phu, L. A., and Sylwia, S. A. (2018). Accuracy assessment of mine walls' surface models derived from terrestrial laser scanning. Int. J. Coal Sci. Technol. 5 (3), 328–338. doi:10.1007/s40789-018-0218-1
Nie, S., Wang, C., Dong, P., XI, X., Luo, S., and Qin, H. (2017). A revised progressive TIN densification for filtering airborne LiDAR data. Measurement 104, 70–77. doi:10.1016/j.measurement.2017.03.007
Pingel, T. J., Clarke, K. C., and Mcbride, W. A. (2013). An improved simple morphological filter for the terrain classification of airborne LIDAR data. ISPRS J. Photogramm. Remote Sens. 77, 21–30. doi:10.1016/j.isprsjprs.2012.12.002
Polat, N., and Uysal, M. (2015). Investigating performance of Airborne LiDAR data filtering algorithms for DTM generation. Measurement 63, 61–68. doi:10.1016/j.measurement.2014.12.017
Polat, N., Uysal, M., and Toprak, A. S. (2015). An investigation of DEM generation process based on LiDAR data filtering, decimation, and interpolation methods for an urban area. Measurement 75, 50–56. doi:10.1016/j.measurement.2015.08.008
Ren, Y., Li, T., Xu, J., Hong, W., and Fu, B. (2021). 'Overall filtering algorithm for multiscale noise removal from point cloud data. IEEE Access 9, 110723–110734. doi:10.1109/access.2021.3097185
Rutzinger, M., Rottensteiner, F., and Pfeifer, N. (2009). A comparison of evaluation techniques for building extraction from airborne laser scanning. IEEE J. Sel. Top. Appl. Earth Obs. Remote Sens. 2, 11–20. doi:10.1109/jstars.2009.2012488
Shen, J., Liu, J., Lin, X., and Zhao, R. (2012). Object-based classification of airborne light detection and ranging point clouds in human settlements. Sens. Lett. 10, 221–229. doi:10.1166/sl.2012.1826
Singh, S. K., Raval, S., and Banerjee, B. P. (2021). A robust approach to identify roof bolts in 3D point cloud data captured from a mobile laser scanner. Int. J. Min. Sci. Technol. 31, 303–312. doi:10.1016/j.ijmst.2021.01.001
Sithole, G., and Vosselman, G. (2004). Experimental comparison of filter algorithms for bare-Earth extraction from airborne laser scanning point clouds. ISPRS J. Photogramm. Remote Sens. 59, 85–101. doi:10.1016/j.isprsjprs.2004.05.004
Streutker, D. R., and Glenn, N. F. (2006). LiDAR measurement of sagebrush steppe vegetation heights. Remote Sens. Environ. 102, 135–145. doi:10.1016/j.rse.2006.02.011
Susaki, J. (2012). Adaptive slope filtering of airborne LiDAR data in urban areas for digital terrain model (DTM) generation. Remote Sens. 4, 1804–1819. doi:10.3390/rs4061804
Wang, R. (2013). 3D building modeling using images and LiDAR: A review. Int. J. Image Data Fusion 4, 273–292. doi:10.1080/19479832.2013.811124
Wang, Y., Hyyppä, J., Liang, X., Kaartinen, H., Alho, P., Lindberg, E., et al. (2016). International benchmarking of the individual tree detection methods for modeling 3-D canopy structure for silviculture and forest ecology using airborne laser scanning. IEEE Trans. Geosci. Remote Sens. 54, 5011–5027. doi:10.1109/tgrs.2016.2543225
Wu, B., Yu, B., Huang, C., Wu, Q., and Wu, J. (2016). Automated extraction of ground surface along urban roads from mobile laser scanning point clouds. Remote Sens. Lett. 7, 170–179. doi:10.1080/2150704x.2015.1117156
Xiangguo, L., and Jixian, Z. (2014). Segmentation-based filtering of airborne LiDAR point clouds by progressive densification of terrain segments. Remote Sens. 6, 1294–1326. doi:10.3390/rs6021294
Xiangyun, H., Lizhi, Y., Shiyan, P., and Jie, S. (2015). Semi-global filtering of airborne LiDAR data for fast extraction of digital terrain models. Remote Sens. 7, 10996–11015. doi:10.3390/rs70810996
Yang, B., Wei, Z., Li, Q., and Li, J. (2013). Semiautomated building facade footprint extraction from mobile LiDAR point clouds. IEEE Geosci. Remote Sens. Lett. 10, 766–770. doi:10.1109/lgrs.2012.2222342
Zahdi, M. W., and Nagai, M. (2021). “An approach for the precise DEM generation in urban environments using multi-GNSS receivers mounted on a mobile platform,” in Measurement.
Zhang, J., and Lin, X. (2013). Filtering airborne LiDAR data by embedding smoothness-constrained segmentation in progressive TIN densification. ISPRS J. Photogramm. Remote Sens. 81, 44–59. doi:10.1016/j.isprsjprs.2013.04.001
Zhang, J., Lin, X., and Ning, X. (2013). SVM-based classification of segmented airborne LiDAR point clouds in urban areas. Remote Sens. 5, 3749–3775. doi:10.3390/rs5083749
Zhang, J. (2010). Multi-source remote sensing data fusion: Status and trends: International journal of image and data fusion: Vol 1, No 1. Int. J. Image Data Fusion.
Zhang, K., Chen, S. C., Whitman, D., Shyu, M. L., Yan, J., and Zhang, C. (2003). A progressive morphological filter for removing nonground measurements from airborne LIDAR data. IEEE Trans. Geosci. Remote Sens. 41, 872–882. doi:10.1109/tgrs.2003.810682
Keywords: airborne lidar, PTD, progressive morphological filter, seed points filtering, filtering algorithm
Citation: Chen N, Wang N, He Y, Ding X and Kong J (2023) An improved progressive triangular irregular network densification filtering algorithm for airborne LiDAR data. Front. Earth Sci. 10:1015153. doi: 10.3389/feart.2022.1015153
Received: 09 August 2022; Accepted: 08 September 2022;
Published: 06 January 2023.
Edited by:
Zizheng Guo, Hebei University of Technology, ChinaReviewed by:
Feng Xiong, China University of Geosciences Wuhan, ChinaMuhammad Usman Sheikh, Aalto University, Finland
Copyright © 2023 Chen, Wang, He, Ding and Kong. This is an open-access article distributed under the terms of the Creative Commons Attribution License (CC BY). The use, distribution or reproduction in other forums is permitted, provided the original author(s) and the copyright owner(s) are credited and that the original publication in this journal is cited, in accordance with accepted academic practice. No use, distribution or reproduction is permitted which does not comply with these terms.
*Correspondence: Xiang Ding, ZGluZ3hpYW5nQGhidXQuZWR1LmNu