
95% of researchers rate our articles as excellent or good
Learn more about the work of our research integrity team to safeguard the quality of each article we publish.
Find out more
ORIGINAL RESEARCH article
Front. Earth Sci. , 30 September 2022
Sec. Solid Earth Geophysics
Volume 10 - 2022 | https://doi.org/10.3389/feart.2022.1014052
This article is part of the Research Topic Unconventional Hydrocarbon Resources Evaluation Through Geological, Geophysical and AI View all 9 articles
 Umar Ashraf1†
 Aqsa Anees1†
 Wanzhong Shi2,3*Ren Wang2,3Muhammad Ali4Ren Jiang5
 Hung Vo Thanh6Ibrar Iqbal7
 Xiaonan Zhang1Hucai Zhang1*
Precision porosity and facies determinations are critical in reducing drilling uncertainty and increasing hydrocarbon recoveries from heterogeneous sources. The porosity and facies distribution of the Taiyuan-Shanxi Formations (T9c-T9d), and Shihezi-1 Formation (T9d-T9e) within the Hangjinqi area are uncertain and no studies have covered the spatial distribution on a regional scale. The heterogeneous nature of coal, mudstone, and sandstone makes it challenging to comprehend the distribution of porosity and lithofacies. Also, the seismic resolution is not able to resolve the reservoir heterogeneity. Therefore, we have employed regional 3D seismic and well logs by utilizing the advanced acoustic impedance inversion to accomplish our study. Results of petrophysical analysis conducted on the well J32 showed that Shihezi-1 and Shanxi-1 Formations have potential gas-saturated zones. Crossplot analysis distinguished the lowest impedance coal from the highest impedance tight sandstone facies. The outcomes of the constrained sparse spike inversion (CSSI) reliably distinguished the coal facies from the channel-tight sandstone facies. The tight sandstone facies showed the highest impedance values as compared to coal and mudstone facies on the absolute acoustic impedance section. Impedance and porosity maps of T9d and T9e suggested the presence of a maximum porosity (8%–12% for T9d, and 5%–10% for T9e), and maximum distribution of tight sandstone facies, while T9c shows the lowest porosity (0%–6%) and lowest impedance values due to the presence of coal facies. Thick braided fluvial channels are evident on the T9d impedance and porosity maps, making it the most favorable horizon to produce the maximum gas. Whereas, T9c shows the least distribution of sandstone facies making it the least favorable. We propose that the zones of maximum porosity on the T9c, T9d, and T9e horizons can be exploited for future gas explorations.
One of the most important characteristics of a reservoir system is its porosity, which is often distributed in a non-uniform and non-linear way across the reservoir (Yasin et al., 2021). It is difficult to predict the distribution of porosity in sandstone reservoirs because of varying depositional conditions, intercalations of heterogeneous lithofacies, and repetition of pore size variations (Ashraf et al., 2019; Ehsan et al., 2019; Ali et al., 2020; Ehsan and Gu, 2020; Mangi et al., 2020; Yasin et al., 2020). It is standard practice to utilize porosity to predict reserves and production estimation (Ehsan et al., 2018; Yasin et al., 2019; Ali et al., 2021). In many recent studies, authors have utilized porosity to evaluate the efficiency and potential of CO2 storage capacity (Thanh et al., 2019; Vo Thanh et al., 2020; Thanh and Sugai, 2021; Alalimi et al., 2022; Safaei-Farouji et al., 2022). Typically, core samples are used to measure porosity, although this method is time-consuming and may not always be accurate. Thus, well-logs are used as an indirect method to calibrate the porosity proficiently (Kumar et al., 2016). In order to correctly identify the high-quality porous regions, one must have a comprehensive understanding of petrophysical and petroelastic parameters, vertical and horizontal distribution of lithofacies, and thickness of porous zones that can be accomplished through the integration of seismic and well-log data (Qiang et al., 2020; Ashraf et al., 2021). Also, geophysical logs may offer reliable information on the porosity of individual wells, but a degree of uncertainty exists when porosity is interpolated between wells solely based on well-logging data (Yasin et al., 2020). Henceforth, we have utilized integrated seismic and well-log data to get reliable results of porosity estimation that would be helpful for the field development of the study area (Feng et al., 2020; Jiang et al., 2021).
The study area is Hangjinqi which lies in the northern region of the Ordos Basin, northern China. The Hangjinqi have been studied for exploring the natural gas resources for about 40 years, but pure gas development began a decade ago. Also, the Hangjinqi has several wells, however, the prospective porous zones are uncertain (Aqsa et al., 2022b). The reservoir within the Hangjinqi area and nearby fields lie within the tight sandstone reservoirs of Shihezi and Shanxi Formations (Wang et al., 2020; Anees et al., 2022a; Zhang et al., 2022). Also, it has been discovered that the Upper Paleozoic sandstones of the Hangjinqi region contain a significant amount of gas (Qin et al., 2022). Since the early Paleozoic, Hangjinqi’s tectonic high location has favored gas movement and accumulation (Ma, 2005). Thus, the study area has the potential to become a major gas exploration zone (Mingjian et al., 2011; Anees et al., 2019).
Acoustic impedance (AI) inversion is described as a key tool for the identification of the reservoir’s porosity and lithofacies distribution (Avadhani et al., 2006; Mahgoub et al., 2017; Abdolahi et al., 2022). The post-stack seismic inversion is a cheap, rapid, and effective method for investigating exploration wells that are distant from each other (Abdolahi et al., 2022). Seismic inversion aims to turn seismic reflection data into a layer rock characteristic that accurately characterizes reservoir quality with high-resolution (Xu et al., 2009), thus enabling the geoscientists to improve reservoir estimates of porosity and facies distinction (Ashraf et al., 2020b). Several algorithms are available to accomplish the seismic inversion which incorporates model based inversion, artificial neural network (ANN) based inversion, and constrained sparse spike inversion (CSSI) (Latimer et al., 2000). CSSI uses constrained high-amplitude reflection coefficients and relies on sparse inverse deconvolution. Each seismic trace is a collection of reflection coefficients that must be convolved with an approximated wavelet (Wang and Guo, 2008). In addition, CSSI applies inversion restrictions based on available information to decrease non-uniqueness and provide an accurate, simple impedance model (Campbell et al., 2015; Ashraf et al., 2020b). It is possible to apply CSSI assessment with extra constraints to analyze full bandwidth reflectivity, which gives CSSI an edge over traditional approaches (Simm et al., 2014). Therefore, we have employed CSSI in our study to delineate porosity and lithofacies which are the two most important parameters of rock.
Recently, several studies are conducted on the Hangjinqi area related to sedimentary and structural geology and covered the geological aspects related to gas migration, channel identification, and tectonics (Yang et al., 2015a; Wu et al., 2017; Zhang et al., 2017; Anees et al., 2019,2022a; Liu et al., 2020; Wang et al., 2020). However, very few studies conducted on the geophysical aspects are conducted that were focused on the demarcation of favorable zones within the members of the Shihezi Formation (Anees et al., 2022a; Anees et al., 2022b). But no studies are available to date that address the porosity estimation and lithofacies distinction that covers a wide range of Lower Permian Shihezi (T9d-T9e), and Carboniferous Shanxi-to-Taiyuan Formations (T9c-T9d).
This work attempts to explore the facies distribution and porosity estimation spatially in the Lower Permian and Upper Carboniferous strata that incorporate the Lower Shihezi Formation (member-1), Shanxi Formation (member-1 and member-2), and Taiyuan Formation in the Hangjinqi region, northern Ordos Basin, China. We used post-stacked 3D seismic and well-logs to better understand facies and porosity distribution through petrophysical analysis, acoustics impedance inversion, and geostatiscal analyses. We also aimed to present new facts about the low-impedance and high-porous zones that will be helpful for the future gas exploration of the Hangjinqi area.
The Ordos Basin was formed in the Paleozoic Era in the Archean-Proterozoic basement and it resulted in a Plateau during the uplifting of the Late Cretaceous Era (Zhang et al., 2017). Large-scale strike-slip episodes throughout the Cenozoic Era split Ordos Basin from the north China block and built graben structures across the basin (Zhang et al., 1998). The study area of Hangjinqi lies between the Yishan ramp and the Yimeng uplift (Figure 1A). The paleohigh in the northern Ordos Basin makes Hangjinqi a suitable hydrocarbon migration location (Xue et al., 2009). The Porjianghaizi fault (P-fault) is the biggest fault that split the Hangjinqi into northern and southern parts.
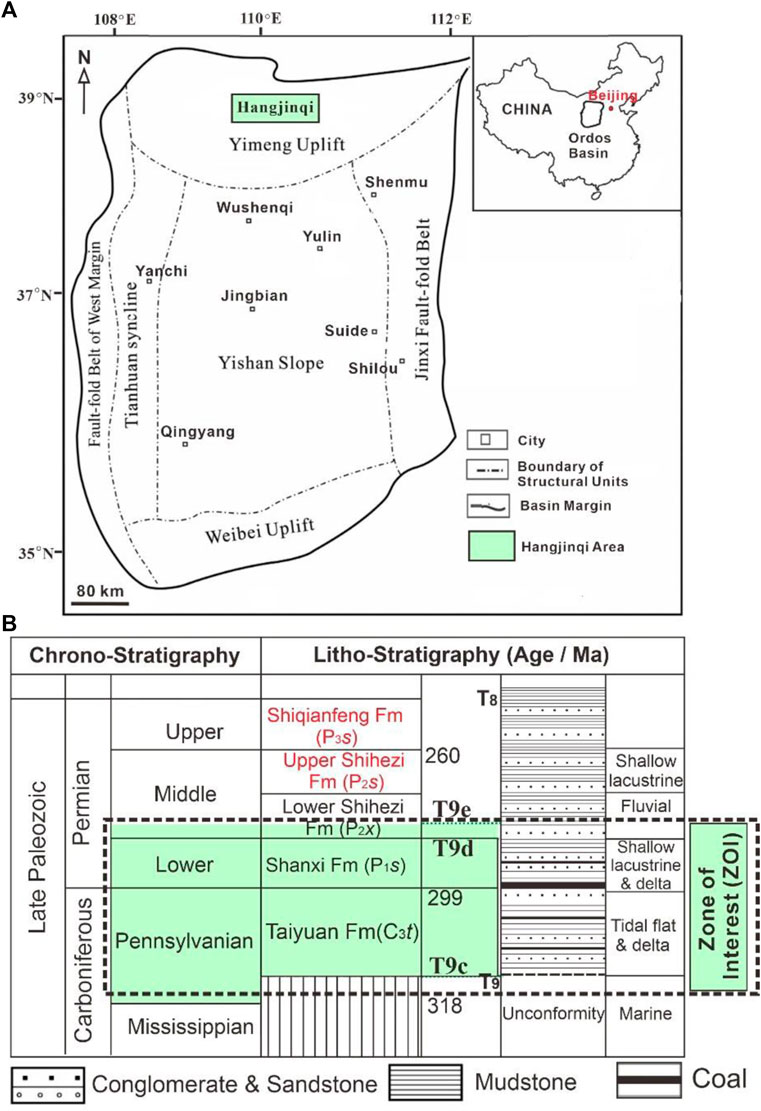
FIGURE 1. (A) Location of Hangjinqi area on the Ordos Basin. (B) A stratigraphic chart of Hangjinqi. The highlighted region shows the targeted reservoir formations and ZOI. The red color text shows seal formations, while coal and mudstone within targeted formations are source rocks.
The petroleum play of the zone of interest (ZOI) lies within the Late Paleozoic rocks. Thick lacustrine mudstone layers and sandstone intercalations in the Upper Shihezi and Shiqianfeng Formations are the principal seal rocks (Wu et al., 2017). Source rocks include coal and mudstones from the Taiyuan and Shanxi Formations (Wu et al., 2017). Whereas, the tight sandstone within the three members of the Lower Shihezi Formation (LSF) and two members of the Shanxi Formation makes up the whole reservoir rock system (Zhang et al., 2009; Anees et al., 2022a; Zhang et al., 2022) (Figure 1B). In terms of a proven reservoir, the fluvial sandy conglomerate and coarse-to-fine-grained tight sandstones found in the LSF act as the main reservoir (Zhang et al., 2009; Anees et al., 2019).
The paleogeomorphology of the Hangjinqi area largely controls sedimentary facies distribution. A recent study conducted by Anees et al. (2022b) showed that the structural, thickness, and sand-ratio mapping indicated that the sedimentary facies of the LSF were deposited in fluvial delta deposits. Channels and floodplains were major sedimentary microfacies. Sand bodies were deposited in fluvial channels and braided distributary channels. Mudstone facies, on the other hand, was deposited in the floodplains. Member-1 of the LSF showed thick braided channels and bars, whereas member-2 and member-3 showed thin braided channels (Anees et al., 2022a; 2022b).
In order to determine the porosity of the reservoir located within the Hangjinqi area, our research makes use of a vast grid of 3D post-stacked seismic data that covers an area of approximately 1,000 km2 and consists of 11 wells (J16, J20, J21, J32, J53, J54, J55, J69, J74, J75, and J76). In order to accomplish the purpose of the study, a number of geophysical logs were included in it. These geophysical logs included acoustic slowness (AC) (us/m), density (DEN) (g/cm3), deep resistivity (LLD) (ohm.m), shallow resistivity (LLS) (ohm.m), compensated neutron log(CNL) (%), and gamma-ray (GR) (API). The research was carried out successfully with the assistance of the Jason software program. In the first stage of the interpretation process, seismic sections and well logs were used in order to perform the stratigraphic and structural interpretations. In the beginning, we interpreted the lithofacies and gas-saturated zones using petrophysical analysis. Following that, the seismic-to-well-tie method was employed to prepare a synthetic seismogram (Ashraf et al., 2016).
Within the whole ZOI, three horizons T9c, T9d, and T9e were recognized. The Shanxi and Taiyuan Formations lie within the T9c and T9d horizons. Whereas, member-1 of LSF (Shihezi-1) lies from T9d to T9e horizons. The geological models were interpolated along the T9c to T9e horizons in order to get the best results. The three targeted horizons were used to assist in better comprehending the distinction of the various lithofacies distribution. In the second stage, the thickness of the ZOI was determined by doing calculations based on the geophysical logs of the selected well J32. The former study by Anees et al. (2022a) showed the proposed depositional facies map where well J32 lies within the favorable region of braided channel and braided bar. Therefore, we have chosen J32 as a case study. In the next stage, a wavelet was generated for each well in order to calculate the average wavelet. It was merged with a band-limited model in order to increase the resolution of the inverted broadband model by extracting average wavelet, seismic, log, and horizon data. This was done in order to make the model more accurate and reliable. After the inversion, a number of quality control (QC) tests were carried out to confirm that the findings were reliable. In order to ascertain the distribution of lithofacies, a geostatistical analysis was used for calculating the porosity maps.
The inversion that was suggested in this study followed the procedure of minimizing the objective function that was provided by Jason Geoscience Workbench (2002). The objective function is expressed as:
Where
In spite of the fact that the reflectivity term is just a sum of the absolute values, the final result should be as tiny a total as is practicable. This is a result of the fact that variations in AI, and therefore reflectivities in the ground, are rather minor. In addition, it is essential to point out that the first two elements of the objective function cannot be reduced at the same time. This is due to the fact that tiny residuals can only arise with a comprehensive model, and sparse models can only occur with a significant data mismatch. Therefore, the two terms of the objective function need to be balanced by controlling λ.
The geostatistical methods are often employed to calculate the association amid reservoir properties via petrophysical parameters to the seismic (Haas and Dubrule, 1994; Qiang et al., 2020). Generally, regression analysis is performed using a linear (direct or inverse) correlation to establish a statistical relationship. These relationships are utilized to identify the distribution of the reservoir properties such as porosity (Abdolahi et al., 2022).
We have utilized well J32 as a case study in order to investigate the pattern of the vertical distribution of lithofacies in the Hangjinqi area. The ZOI lies between depths of 2,888–3048 m. The ZOI enclosed four formations which include xiashihezi (also known as Shihezi-1), Shanxi-1, Shanxi-2, and Taiyuan Formations. Member-1 of LSF (Shihezi-1) is a proven reservoir. Results of the petrophysical analysis show that Shihezi-1 is composed of mudstone and sandstone facies. The sand is abundant as compared to mudstone in this region, with a very small amount of limestone. There are two porous and permeable zones that are gas-saturated that lie in the middle and lower regions. Within the Shanxi-2 Formation, there are three lithologies which are mudstone, sandstone and coal. There are two thin intercalations of coal that lie in the middle region. A porous, permeable, and gas-saturated zone also lies at the bottom of the Shanxi-2 (Upper Shanxi) Formation. Within the Shanxi-1 (Lower Shanxi) Formation, there are three porous, permeable, gas-saturated zones that lies in the top, middle and bottom region. Also, there is a thin coal layer at the top and a thick coal layer at the near-bottom region. The lithologies within the Shanxi-1 incorporate mainly sandstone, mudstone, coal, and a small amount of limestone. On the other hand, the Taiyuan Formation is mainly composed of mudstone and coal facies which is the main source of rock within the study area. Below the Taiyuan Formation, there is a thick zone of carbonate rocks which suggests the transition from continental to marine settings (Figure 2).
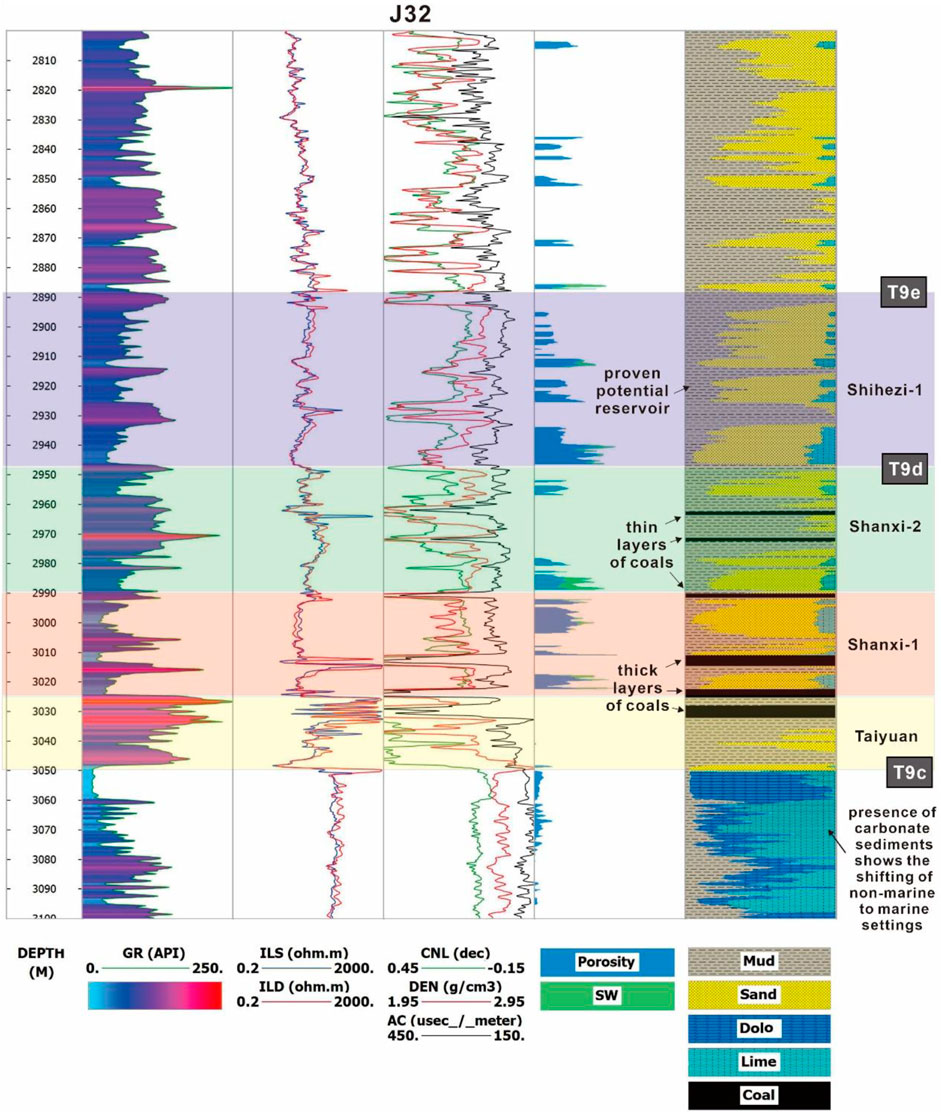
FIGURE 2. Petrophysical analysis of J32. The highlighted zones show the targeted zone of interest (ZOI). Shihezi-1 formation is a proven reservoir and mostly consists of sand and mud facies. Whereas, Shanxi-2 and Shanxi-shows coal layers, but also shows prominent porous zones. The Taiyuan formation zone shows a thick coal layer and prominent mud facies. The area below the ZOI shows frequent carbonate facies highlighting the marine depositional environment.
The sand and coal facies are distinguished by the difference in logging characteristics. As compared to coal facies, the sand facies shows low GR, moderate resistivity, moderate CNL, high DEN, and low AC values. On the other hand, coal facies shows the lowest GR, low DEN, high AC, high CNL, and high resistivity values. For the coal facies, variations in log values may be attributed to differences in the rank, kind, gas concentration, and adsorption content of the various types of coal (Deng et al., 2013; Mangi et al., 2020, 2022; Wood and Cai, 2022). The porosity values of gas-saturated zones are low suggesting the presence of tight sandstone facies. Two thick layers of coal near the Shanxi-1 Formation exhibit high permeability which might be associated with the presence of fractures in the region. The coal layers which showed high permeability show intermixing with the tight sandstone facies. Whereas, the coal layers which does not show permeability lies within the mudstone shaly region. The coal facies are not porous and show zero porosity. Overall, our results show that Shihezi-1 and Shanxi-2 show the characteristics of a good reservoir as compared to Shanxi-2. The presence of coal within the Shanxi Formation can be targeted as an unconventional gas resource.
We also employed crossplot analysis of well J32 to distinguish the numerous lithofacies. The crossplot was plotted within ZOI. The AC log was used to make the p-velocity (Vp) log. The DEN log was available within J32, which was used along with the Vp to calibrate a p-impedance. Results show that coal has low velocity and low impedance and is easily distinguishable. The mudstone and tight sandstone show overlapping, but mudstone show lower impedance values as compared to tight sandstone. The tight sandstone shows the highest impedance values as compared to coal and mudstone. Whereas, there is a small cluster of limestone that shows the highest velocity and highest impedance values (Figure 3).
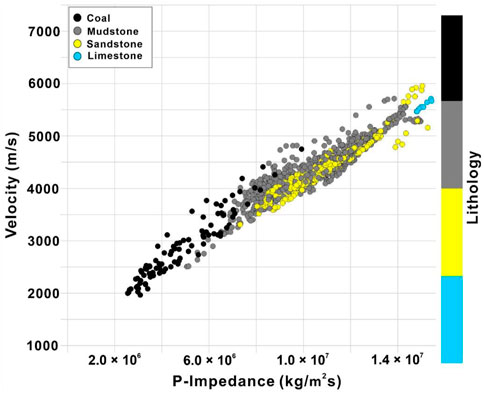
FIGURE 3. Crossplot of ZOI of well J32 showing the p-velocity and p-impedance presenting the different lithofacies in the Hangjinqi area. Coal showed low velocity and low impedance, limestone showed high velocity and high impedance. Mudstone and sandstone show overlapping, but mudstone shows lower impedance as compared to tight sandstone.
Loaded horizons were smoothed using the Jason program to make interpretation mapping as smooth as feasible. This limited the data’s dips and peaks. This approach provided a smoothed version of the interpolated well-log AI throughout the complete survey. Figure 4A shows the seismic section’s T9c and T9d horizons, while Figures 4B–D show their interpolated structural maps. Initially, not all research wells had a p-impedance log. To complete the inversion, an AI log was constructed by averaging the AC log on the ZOI using Backus’ method. Since AI includes DEN and AC, updated AC logs were used to construct the missing DEN. By applying Gardner’s method to the data (Gardner et al., 1974), the missing DEN log was created.
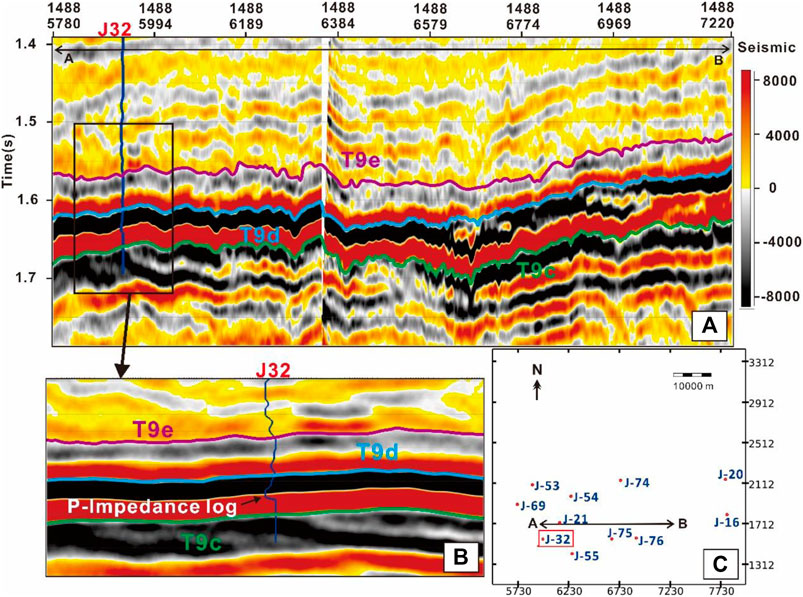
FIGURE 4. (A) A inline showing a regional section crossing well J32. Three horizons are marked named T9c, T9d, and T9e. (B) A zoomed section highlights the deflections of P-impedance log within the ZOI. (C) Basemap showing the corresponding studied inline (AB) and well J32.
The wavelet is contingent upon the seismic source, the filtering of the Earth, and the processing that is given to the reflectivity data. In addition, the process of estimating wavelet is an under-determined issue since the noise component as well as all the other elements that were described are unknown. Wavelet components include amplitude and phase spectra. Phase spectrum is more challenging to define than amplitude spectrum. Since the phase spectrum is the main source of inversion mistakes, it is crucial to utilize the proper phase spectrum to get the right inversion and outcomes. The synthetic seismograms were generated for each well to match seismic and well data (Anees et al., 2017; Abbas et al., 2019). Because reliable ties are needed to acquire the low-frequency AI trend, constructing a synthetic seismogram was followed by an iterative procedure to enhance the tie. Autocorrelation on seismic data yields the amplitude spectrum. We used autocorrelation to eliminate the phase from seismic data by smoothing the spectrum. A correlation coefficient was generated between the real and the synthetic seismic trace in order to assess the quality of a well-tie. This correlation coefficient was produced across the intended time in which the well-log data was accessible. When applying this approach, it is possible that the majority of the wells will have a well-tie that has significant uncertainty. As a result, the quantitative seismic analysis included only those well ties that were showing dependable results. This method was used to improve the quality of the tie for the estimated wavelet and continued until a suitable tie had been created. The algorithm then moved on to the next step, which was the wavelet estimation procedure. Incorporating the estimate of wavelet amplitude spectrum into this approach involved making use of several seismic traces as an input in order to construct a zero-phase wavelet as an output.
The estimated wavelet was used in the production of synthetic seismograms, which were then subjected to the customary stretch and squeeze procedure using time-depth (T-D) functions in order to ensure a close match between the synthetics and the seismic data (Young et al., 2000). Following the completion of the tying operation, the wavelets for all the wells were created. Because the seismic inversion needed a wavelet, only those wavelets that do not exhibit any inconsistency were kept after the process. In light of the fact that the wavelet of some wells was displaying inconsistency, the wavelets of those wells were excluded from the subsequent inversion. Well locations and quality were considered while extracting the average wavelet from the seismic survey. The wavelet was produced from the reservoir enclosing T9c through T9e horizons (Figure 5A). All these wells were utilized to calculate the average wavelet for consistent AC and DEN logs reaching T9c and T9e (Figure 5B).
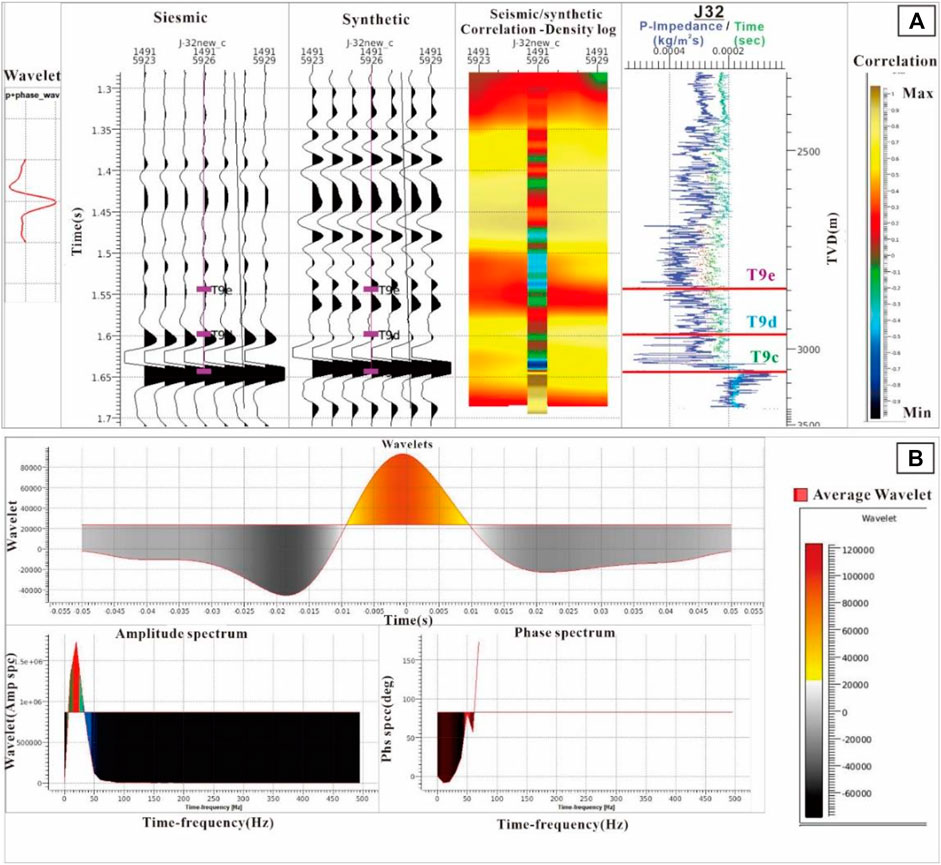
FIGURE 5. (A) The well editing window shows the synthetic seismogram utilizing the well J32. The first panel shows seismic data from well traces. The second and third panels show synthetics, third shows the correlation between the seismic and synthetics. The highest value shows a good correlation, whereas the lowest value shows a minimum correlation. An overlay log on the correlation panel shows the variations of the RHOB log within ZOI. The last and fourth panel shows the time and P-impedance log of well J32. (B) An average wavelet along with amplitude and phase spectrums were made by utilizing the wavelets of all the studied wells.
Low-frequency turbulences in seismic data ruin low-frequency information, which disturbs recorded seismic data. The low-frequency model generated a zero-Hz component that converted relative to absolute AI. Our work used Ferguson and Margrave’s (Ferguson and Margrave, 1996) low-frequency AI model and methodology. This model uses iterative forward modeling (Veeken and Da Silva, 2004). Using integrated well-log data (primarily AC and DEN logs), an estimate of average wavelet, 3D seismic data (band limited), and seismic horizons using seismic reflectivity data enhanced low-frequency information. All wells with logs extending to T9c were used for low-frequency seismic data. Figure 6 illustrates the Hangjinqi 3D low-frequency model.
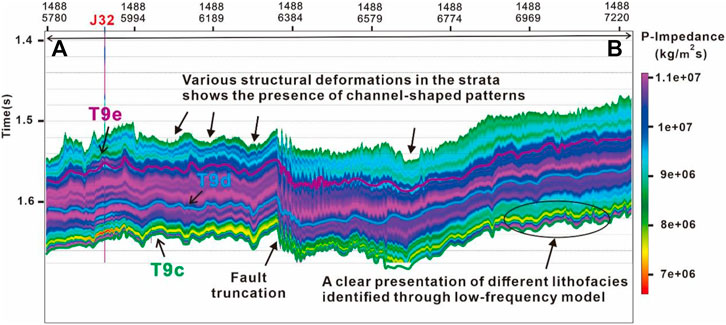
FIGURE 6. Low-frequency model of the ZOI that shows the presence of fault truncations and channel-shaped patterns associated with structural variations. A highlighted zone evidently highlights the presence of various lithofacies.
Because AI inversion was band-limited, a low-frequency model was required. This well-log-derived low-frequency model was added to a seismic-derived band-limited AI model. The triangulation technique was chosen as the preferred interpolation method for the research’s regional data. This strategy generated the best interpolation results for the whole survey since it created continuous and smoothed results. Three horizons (T9c to T9e) were used to interpolate well-logs. The low-frequency model aided in a reliable explanation of the lateral and vertical variation of lithofacies within the ZOI. Results of the overlay well J32 show deflection towards the left side showing low values of AI that suggests the presence of red-colored coal facies have now low impedance values. The layers present above the coal facies give the indication of mudstone and tight sandstone layers with high impedances.
After computing wavelets and interpolating AI logs, inversion parameters were set. They include lambda, trend mismatch, maximum and minimum AI values the inversion may achieve, p and q reflectivity parameters, and seismic misfit term. The basic steps followed to accomplish CSSI were as follows; 1) trends were edited first. Generally, well log depth increases p-impedance. All well trends (T9c-T9e) were modified, 2) trace merging of combined low-frequency and seismic data sets through a band-pass filter. The cut-off frequency set was 0–50 Hz, 3) the CSSI lambda factor was used as a QC variable. After modifying all QC parameters, CSSI was performed to achieve inverted bandlimited AI. To add low-frequency missing information, a low-frequency model was added. Full bandwidth inversion findings gave the most accurate information for interpretation since they had the highest bandwidth and the fewest wavelet effects. The AI results were connected to well p-impedance logs for quantitative analysis. Once areas and ZOI on the full-bandwidth result were identified, bandlimited component was also investigated to determine the underlying coalbeds from channel sandstone and mudstone facies.
The CSSI results revealed improved and reliable vertical and lateral variations in lithofacies’ impedances after integrating it with the low-frequency model. The resulting broadband model has maximum resolution and AI variations which allowed to resolve the disparity between the coal, mudstone and tight sandstone reservoir facies in the Hangjinqi area. Low-velocity coal obscures sandstone’s amplitude, due to which the seismic resolution can’t distinguish coal from tight sandstone. The low-velocity coalbed layer generated a thick reflector due to its high amplitude reflection which may be misleading.
The CSSI reliably distinguished the coal deposit from tight sandstone facies. The thick beds of coal facies (red-yellow) are present within the T9c to T9d horizons that lie between the Taiyuan and Shanxi Formations. The AI broadband (absolute) model indicated multiple lithologies between T9c-T9e horizons that were not readily resolvable on the seismic section (Figure 7A). The tight sandstone (purple-blue) differs from mudstone (green-cyan) and coal (red-yellow) lithofacies. Coal has the lowest impedance than mudstone and tight sandstone. Whereas, mudstone shows moderate and tight sandstone shows the highest impedance in the Hangjinqi area. Results obtained from the bandlimited AI model also supported the results of the inverted absolute AI model (Figure 7B).
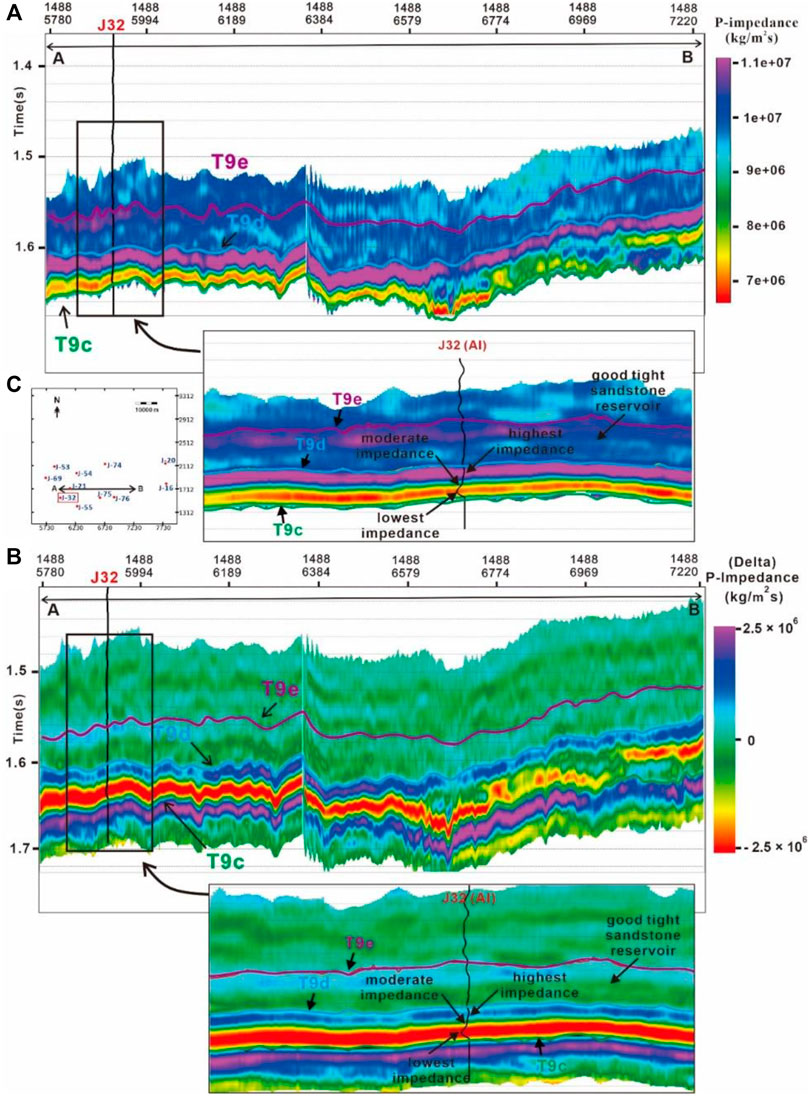
FIGURE 7. (A) Absolute AI broadband model along with the zoomed section on J32 location (B). Bandlimited AI model along with a zoom section. An overlay well J32 on inverted AI models highlights the differences in impedance values. (C) A basemap showing the location of J32 and studied inline for inverted sections.
After the AI model was accomplished, some QC steps were followed to check the accuracy. We have utilized a p-impedance log which was overlaid on the inverted absolute AI and bandlimited AI models.
Impedance sections frequently show reservoir connectivity, which may be connected with porosity and impedance sections to delineate the geological model. Because seismic has a poorer vertical resolution than well-logs, many well-observed beds are not visible in seismic. To compare well logs and inversion results more accurately, a high-cut filter was applied to the p-impedance (AI) log and then filtered back to the inversion result’s frequency. After filtering, the Al log was overlaid over the section at the studied well J32 location (Figure 7). Within T9d-T9e horizons, the area shows fewer variations in impedance values suggesting the presence of mainly tight sandstone facies that belong to the proven reservoir of the Shihezi-1 Formation. Towards the bottom between the T9c horizon, the p-impedance log shows deflection towards the left side which shows the lowest AI values that are associated with the coal facies. Above the coal facies, the curve of the AI log curve shows deflection towards the right side that represents the moderate values of mudstone facies, and a straight log curve of AI presents the highest AI values that are associated with tight sandstone facies. The values of coal facies lie between 4.5 × 10⁶–7.5 × 10⁶ kg/m2s, 6.5× 10⁶–1.5 × 10⁷ kg/m2s for mudstone facies, whereas the tight sandstone reservoir has AI ranges from 8.5 × 10⁶–1.25 × 10⁷ kg/m2s. The trend of the lithofacies within the Ordos Basin is unconventional. Several authors in very recent studies have already reported the behavior of lithofacies within other gas fields of Ordos Basin, where they have revealed that the coal showed the lowest AI (low velocity and low density), mudstone showed moderate AI (moderate velocity and moderate density), and tight sandstone showed the highest AI values (Liu et al., 2022; Pan et al., 2022).
After the QC, the inverted AI model was further utilized for reservoir characterization and porosity distribution through geostatistical analysis.
To analyze the coal seams and the fluvial channel sandstone facies distribution in the targeted region, AI maps of horizons T9c to T9d (Taiyuan and Shanxi Formations) and T9d to T9e (Shihezi-1) were developed. Maps of AI corresponding to the productive zones were extracted to compute the statistical attributes. Heretofore, it is apparent from looking at Figure 8 that there is a distinct and more detailed response of the characteristics during the T9c to T9e period when employing the inverted AI model. The only AI feature that was shown was the average root mean square (RMS) values since they provided a more accurate representation of how the AI is distributed over the ZOI.
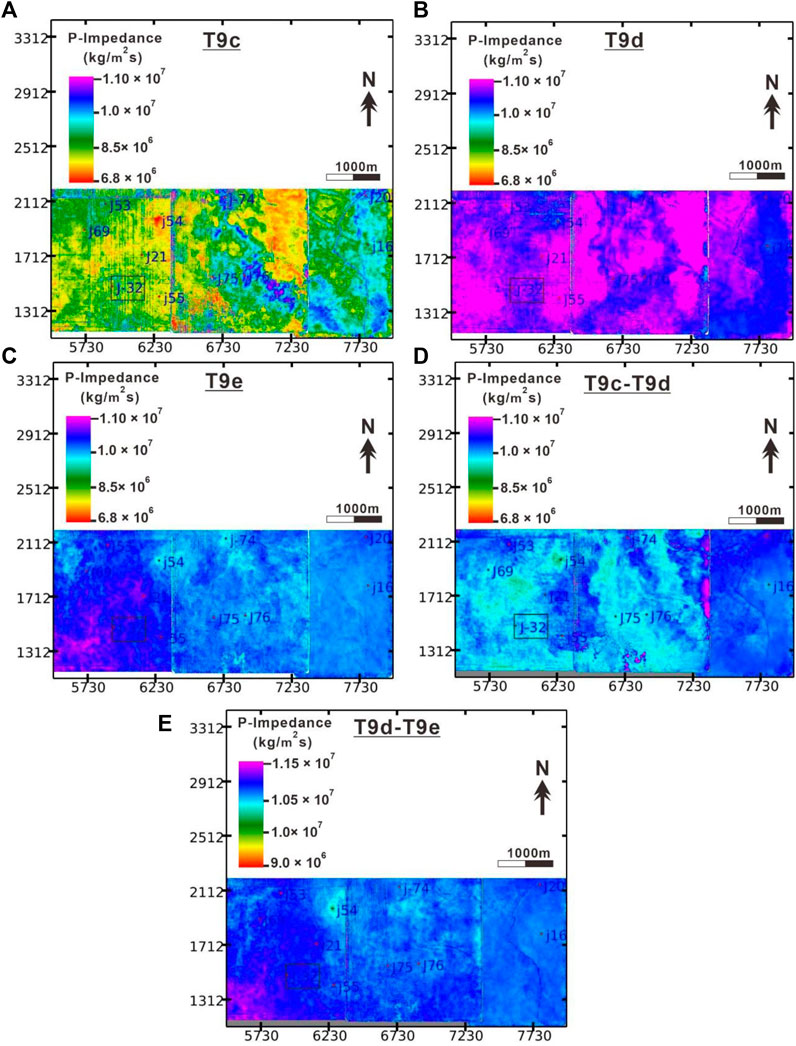
FIGURE 8. Impedance maps of (A) T9c, (B) T9d, (C) T9e, (D) T9c-T9d, and (E) T9d-T9e horizons. The studied well J32 as a case study is highlighted by black color box.
The AI map of the T9c map mainly shows the presence of low impedance values highlighted by red and yellow colors. These lowest impedance values give the presence of coal facies. The associated green color shows the presence of mudstone facies. On the other hand, the moderate to high impedance values show the presence of tight sandstone (blue-purple) facies. The middle location near J75 and J76 wells, and the eastern region towards J20 and J16 wells suggest the presence of fluvial channels (Figure 8A). The AI maps of T9d and T9e show moderate to highest impedance values. Since there are no coal facies within T9d-T9e, mudstone and sandstone facies are prevalent in Shihezi-1. Therefore, the blue-colored facies with moderate impedance values shows mudstone, whereas the highest impedance values give the indication of tight sandstone facies. Results also provided a good illustration of the distribution of the thick fluvial-braided sandstone channels (purple color) which are extending from North towards South (Figure 8B). The AI map of T9e shows the presence of high impedance values that are associated with tight sandstone facies (Figure 8C). Our results are in agreement with the recent study conducted on the T9d-T9e which also showed the presence of thick braided channels and interdistributary channels (Anees et al., 2022a).
Results of the AI map of T9c-T9d layers show a different behavior as compared to the individual T9c and T9d AI maps. The two colors which are prominent are cyan and blue. The other colors in legend are almost negligible on the map. The spatial analysis of the T9c-T9d AI map shows that the middle and western regions are mostly associated with light green-cyan colors having low values of AI representing the swamp coal facies and associated mudstone facies. Whereas, the northwestern region, the area near J55 well, and the eastern region has blue color with high AI values presenting the tight sandstone facies (Figure 8D).
The AI map that lies between the T9d and T9e horizons is shown in Figure 8E. The impedance values are quite variable which is suggestive of numerous facies present in this area. The T9d-T9e AI map shows frequent dispersion of blue-colored tight sandstone facies giving an indication of good reservoir characteristics. The cyan color with low impedance value show mudstone facies. The region between T9d to T9e shows the features of tight sandstone lithofacies, which are quite prevalent on the whole map. Overall, the results of T9d-T9e show good results of favorable zones for potential gas accumulation.
Porosity estimate in reservoir rocks is as challenging as it is critical. When coal measurements are present in reservoir rocks, or the reservoir rock displays many forms of porosity, it becomes more difficult to evaluate porosity (Adekanle and Enikanselu, 2013). Data from wells provides the finest vertical resolution and reliable estimates of porosity at specific points within the targeted region. In order to better understand the spatial distribution of porosity, it is critical to integrate seismic inversion data with petrophysics. Since wells are distributed across the field, makes it difficult to estimate reservoir characteristics in the form of porosity.
To evaluate the porosities from the absolute AI model, a correlation between AI and porosities must be established. The well data was restricted from the T9c horizon to the T9e horizon for the estimation of porosities. A mathematical relationship between the AI log and porosity log was established after the well data was evaluated for the ZOI. Crossplotting the AI value on each well log along with the average porosity values for every well in the targeted region separately led to this correlation. This was accomplished by performing a polynomial regression of the second degree for each well to recognize which well gives the most accurate regression and trend. Because the AI and the predicted average porosities showed a linear connection with a positive slope, we employed a linear regression approach to estimate them (Figures 9, 10). The positive slope is the indication of the direct relationship between coal and tight sandstone facies. Coal showed low porosity and low impedance values, while tight sandstone showed high porosity (around 12–13%) and high impedance values, thus, indicating a direct relationship (Figures 2, 7).
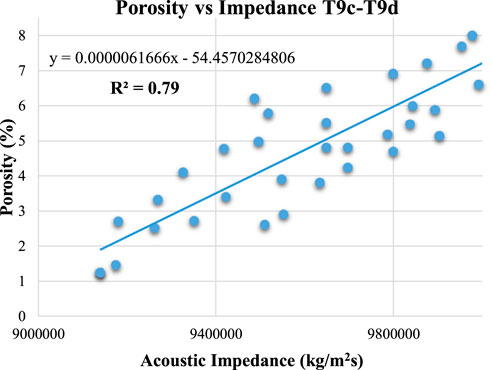
FIGURE 9. A cross plot between the AI and average porosity of T9c-T9d horizons shows a positive slope trend line.
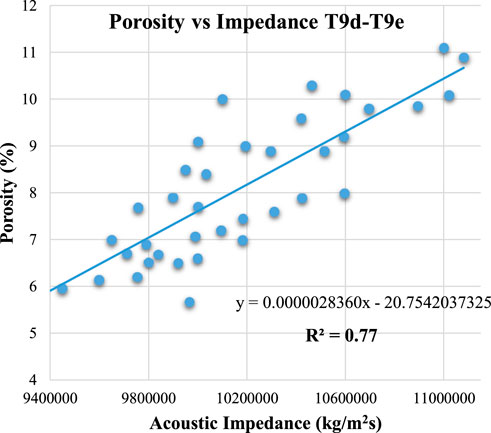
FIGURE 10. A cross plot between the AI and average porosity of T9d-T9e horizons shows a positive slope trend line.
The average porosity values of all of the wells that extended from the T9c horizon to the T9e horizon were used to generate the crossplot that compares the AI to the porosity. The linear relationship developed for the best fit line showed a good association of R2 = 0.79 for T9c-T9d horizons, and R2 = 0.77 among T9d-T9e horizons. The Eqs 2,3 for T9c–T9d and T9d–T9e horizons are as follows;
The obtained equations were utilized in Jason’s Function mode for statistical computations. Porosity maps of horizons T9c to T9d (Taiyuan and Shanxi Formations) and T9d to T9e (Shihezi-1) were constructed to estimate porosity distribution. The porosity ranges between 1 and 8 for T9c-T9d (Figure 9), whereas it ranged from 5 to 11 for the T9d-T9e (Figure 10). The low porosity ranges in the study area suggest that tight sandstone is present in the Hangjinqi area.
The porosity maps of horizons T9c, T9d, T9e, T9c-T9d, and T9d-T9e (Figures 11A–E). The porosity map shows the presence of maximum porosity in the region of fluvial sandstone and minimum porosity in the region of coal and mudstone. The porosity maps of T9c, T9d, and T9e horizons show that T9d is the reservoir horizon that has maximum porosity as compared to T9e and T9c. The porosity is less than 6% in the majority of the area of the T9c horizon and is more than 8% in the majority of the area of the T9d horizon. The porosity of the T9e horizon is less as compared to the T9d horizon due to the presence of a greater amount of mudstone in the upper part of the Shihezi-1, but the overall it also shows a good presentation of sand accumulation.
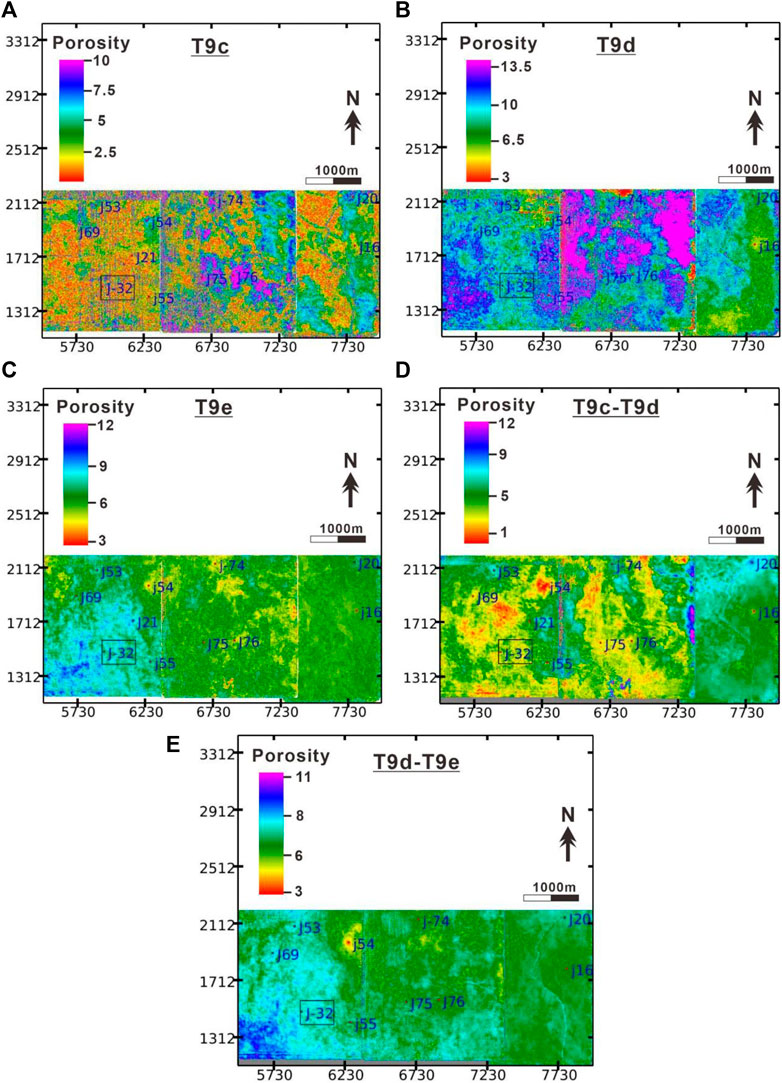
FIGURE 11. Porosity maps of (A) T9c, (B) T9d, (C) T9e, (D) T9c-T9d, and (E) T9d-T9e horizons. The studied well J32 as a case study is highlighted by black color box.
The porosity of the T9c horizon shows maximum porosity (10%–12%) near well locations J75 and J76. But, the overall porosity map of the T9c horizon revealed the lowest porosity which lies between 0% and 6%. The porosity of the T9d horizon shows maximum porosity that mainly ranges from 10%–14% in the middle region, whereas the maximum region of the T9d map shows moderate porosity values of 6%–9%. The porosity of the T9e horizon shows the maximum porosity (8%–11%) in the southwestern region which can be predicted as a favorable reservoir location, whereas the porosity in the eastern region is minimum (5%–7%). The porosity map shows the deltaic and swamp coal source rocks deposition in Taiyuan and Shanxi Formations whereas fluvial and deltaic sandstone reservoirs deposition in Shanxi and Lower Shihezi. Corollary, the estimated porosities through the AI are reasonable for the geological settings of the Hangjinqi area.
For future research, we proposed the usage of pre-stack seismic data that will combine sensitive parameters of hydrocarbons with detailed seismic features such as amplitude, offset, and incidence angle. The pre-stack inversion together with elastic parameters will provide more accurate results as compared to post-stack seismic inversion.
The conclusions of the study are as follows;
1. Results of petrophysical analysis of well J32 revealed that the ZOI shows three thin and three thick coal layers. Shihezi-1 formation shows the presence of two gas-saturated zones, Shanxi-2 show one gas zone, whereas Shanxi-1 shows three gas zones. The Shihezi-1 is a proven reservoir, however, Shanxi-1 (lower Shanxi) also revealed good characteristics of producing gas reservoir zones. Crossplot of J32 within ZOI distinguished the lithofacies. Coal showed low impedance, whereas limestone showed highest impedance. The mudstone revealed lower impedance values as compared to tight sandstone.
2. The AI inversion showed useful insights regarding the horizontal and vertical distribution of coal, mudstone, and tight sandstone facies through the inverted AI broadband and bandlimited models. Coal showed the lowest impedance and is present at the bottom of the study area. Mudstone lies above coal facies. Whereas the tight sandstone lies above the thick coal and thin mudstone layers having high impedance values. The overlay AI log of well J32 also showed reliable results that also highlighted that coal has the lowest values (4.5 × 10⁶–7.5 × 10⁶ kg/m2s), mudstone has moderate-to-high (6.5 × 10⁶–1.15 × 10⁷ kg/m2s), while tight sandstone showed moderate-to-highest (8.5 × 10⁶–1.25 × 10⁷ kg/m2s) impedance values.
3. The relationship established for the average porosity and AI showed good association (R2 = 0.79) for T9c-T9d horizons, and also good association (R2 = 0.77) among T9d-T9e horizons. The porosity maps of T9d showed maximum porosity (mostly 8%–12%), and moderate porosity (5%–10%) on T9e, while lowest porosity (0%–6%) on T9c maps. The results of impedance maps of these horizons are in agreement with the porosity maps. In addition, the porosity and impedance maps of T9c-T9d and T9d-T9e horizons overall showed the highest impedance and highest porosity unconventional relationship. Wells lie within the fluvial channels should be targeted for maximum gas production within the Hangjinqi area.
The data analyzed in this study is subject to the following licenses/restrictions: The data is confidential and cannot be made available. Requests to access these datasets should be directed to aqsaanees01@outlook.com
AA, WS, and UA conceived this study. WS supervised this project. RW undertook the responsibility of arranging the data for this project. AA and UA wrote the manuscript. MA and RJ helped in formal analysis and software. XZ, II, and HT discussed the data. WS and HZ reviewed the manuscript and provided the necessary funding. All authors contributed to the article and approved the submitted version.
This research was supported by the National Natural Science Foundation of China (Grant Nos. 4162134 and 41820104008), China University of Geosciences (Wuhan) (CUGCJ1712), and the Open Fund of the Key Laboratory of Tectonics and Petroleum Resources (China University of Geosciences in Wuhan) (TPR- 2018-18), the 13th Five year Plan of the Ministry of Science and Technology of China (2016ZX05034-002003), and Yunnan Provincial Government Leading Scientist Program, No. 2015HA024.
AA and UA are grateful to the former supervisor WS for providing the necessary data, guidance, support, and technical help to accomplish this research. I am also thankful for my labmates at the China University of Geosciences. I also acknowledge the China University of Geosciences, Wuhan, and Yunnan University for funding this project.
RJ was employed by the Petro-China Company Limited
The remaining authors declare that the research was conducted in the absence of any commercial or financial relationships that could be construed as a potential conflict of interest.
All claims expressed in this article are solely those of the authors and do not necessarily represent those of their affiliated organizations, or those of the publisher, the editors and the reviewers. Any product that may be evaluated in this article, or claim that may be made by its manufacturer, is not guaranteed or endorsed by the publisher.
Abbas, A., Zhu, H., Anees, A., Ashraf, U., and Akhtar, N. (2019). Integrated seismic interpretation, 2d modeling along with petrophysical and seismic atribute analysis to decipher the hydrocarbon potential of missakeswal area. Pak. J. Geol. Geophys 7 (2), 1–12. doi:10.4172/2381-8719.1000455
Abdolahi, A., Chehrazi, A., Kadkhodaie, A., and Babasafari, A. A. (2022). Seismic inversion as a reliable technique for anticipating of porosity and facies delineation, a case study on Asmari Formation in Hendijan field, southwest part of Iran. J. Petroleum Explor. Prod. Technol., 1–14. doi:10.1007/s13202-022-01497-y
Adekanle, A., and Enikanselu, P. A. (2013). Porosity prediction from seismic inversion properties over ‘XLD’Field, Niger Delta. Am. J. Sci. industrial Res. 4 (1), 31–35. doi:10.5251/ajsir.2013.4.1.31.35
Alalimi, A., AlRassas, A. M., Vo Thanh, H., Al-qaness, M. A., Pan, L., Ashraf, U., et al. (2022). Developing the efficiency-modeling framework to explore the potential of CO2 storage capacity of S3 reservoir, Tahe oilfield, China. Geomech. Geophys. Geo. Energy. Ge. Resour. 8 (4), 128–223. doi:10.1007/s40948-022-00434-x
Ali, M., Jiang, R., Ma, H., Pan, H., Abbas, K., Ashraf, U., et al. (2021). Machine learning-A novel approach of well logs similarity based on synchronization measures to predict shear sonic logs. J. Petroleum Sci. Eng. 203, 108602. doi:10.1016/j.petrol.2021.108602
Ali, M., Ma, H., Pan, H., Ashraf, U., and Jiang, R. (2020). Building a rock physics model for the formation evaluation of the Lower Goru sand reservoir of the Southern Indus Basin in Pakistan. J. Petroleum Sci. Eng. 194, 107461. doi:10.1016/j.petrol.2020.107461
Anees, A., Shi, W., Ashraf, U., and Xu, Q. (2019). Channel identification using 3D seismic attributes and well logging in lower Shihezi Formation of Hangjinqi area, northern Ordos Basin, China. J. Appl. Geophys. 163, 139–150. doi:10.1016/j.jappgeo.2019.02.015
Anees, A., Zhang, H., Ashraf, U., Wang, R., Liu, K., Abbas, A., et al. (2022a). Sedimentary facies controls for reservoir quality prediction of lower Shihezi member-1 of the Hangjinqi area, Ordos Basin. Minerals 12, 126. doi:10.3390/min12020126
Anees, A., Zhang, H., Ashraf, U., Wang, R., Liu, K., Mangi, H. N., et al. (2022b). Identification of favorable zones of gas accumulation via fault distribution and sedimentary facies: Insights from Hangjinqi area, northern Ordos Basin. Front. Earth Sci. (Lausanne). 9, 1375. doi:10.3389/feart.2021.822670
Anees, A., Zhong, S. W., Ashraf, U., and Abbas, A. (2017). Development of a computer program for zoeppritz energy partition equations and their various approximations to affirm presence of hydrocarbon in missakeswal area. Geosciences 7 (2), 55–67. doi:10.5923/j.geo.20170702.02
Ashraf, U., Zhang, H., Anees, A., Ali, M., Zhang, X., Shakeel Abbasi, S., et al. (2020b). Controls on reservoir heterogeneity of a shallow-marine reservoir in Sawan gas field, SE Pakistan: Implications for reservoir quality prediction using acoustic impedance inversion. Water 12 (11), 2972. doi:10.3390/w12112972
Ashraf, U., Zhang, H., Anees, A., Mangi, H. N., Ali, M., Zhang, X., et al. (2021). A core logging, machine learning and geostatistical modeling interactive approach for subsurface imaging of lenticular geobodies in a clastic depositional system, SE Pakistan. Nat. Resour. Res. 30 (3), 2807–2830. doi:10.1007/s11053-021-09849-x
Ashraf, U., Zhu, P., Anees, A., Abbas, A., and Talib, A. (2016). Analysis of balkassar area using velocity modeling and interpolation to affirm seismic interpretation, upper indus basin. Geosciences 6 (3), 78–91. doi:10.5923/j.geo.20160603.02
Ashraf, U., Zhu, P., Yasin, Q., Anees, A., Imraz, M., Mangi, H. N., et al. (2019). Classification of reservoir facies using well log and 3D seismic attributes for prospect evaluation and field development: A case study of sawan gas field, Pakistan. J. Petroleum Sci. Eng. 175, 338–351. doi:10.1016/j.petrol.2018.12.060
Avadhani, V. L. N., Anandan, M., Thattacherry, B. J., Murthy, K. S., Gariya, B. C., and Dwivedi, A. K. (2006). Acoustic impedance as a lithological and hydrocarbon indicator—A case study from cauvery basin. Lead. Edge 25 (7), 854–858. doi:10.1190/1.2221363
Campbell, T. J., Richards, F. B., Silva, R. L., Wach, G., and Eliuk, L. (2015). Interpretation of the Penobscot 3D seismic volume using constrained sparse spike inversion, Sable sub-Basin, offshore Nova Scotia. Mar. Petroleum Geol. 68, 73–93. doi:10.1016/j.marpetgeo.2015.08.009
Deng, S., Hu, Y., Chen, D., Ma, Z., and Li, H. (2013). Integrated petrophysical log evaluation for coalbed methane in the Hancheng area, China. J. Geophys. Eng. 10 (3), 035009. doi:10.1088/1742-2132/10/3/035009
Ehsan, M., Gu, H., Ahmad, Z., Akhtar, M. M., and Abbasi, S. S. (2019). A modified approach for volumetric evaluation of shaly sand formations from conventional well logs: A case study from the talhar shale, Pakistan. Arab. J. Sci. Eng. 44 (1), 417–428. doi:10.1007/s13369-018-3476-8
Ehsan, M., Gu, H., Akhtar, M. M., Abbasi, S. S., and Ullah, Z. (2018). Identification of hydrocarbon potential of Talhar shale: Member of lower Goru Formation using well logs derived parameters, southern lower Indus basin, Pakistan. J. Earth Sci. 29 (3), 587–593. doi:10.1007/s12583-016-0910-2
Ehsan, M., and Gu, H. (2020). An integrated approach for the identification of lithofacies and clay mineralogy through Neuro-Fuzzy, cross plot, and statistical analyses, from well log data. J. Earth Syst. Sci. 129 (1), 101–113. doi:10.1007/s12040-020-1365-5
Feng, R., Hansen, T. M., Grana, D., and Balling, N. (2020). An unsupervised deep-learning method for porosity estimation based on poststack seismic data. Geophysics 85 (6), M97–M105. doi:10.1190/geo2020-0121.1
Ferguson, R. J., and Margrave, G. F. (1996). A simple algorithm for band-limited impedance inversion. CREWES Res. Rep. 8 (21), 1–10.
Gardner, G. H. F., Gardner, L. W., and Gregory, A. (1974). Formation velocity and density—the diagnostic basics for stratigraphic traps. Geophysics 39 (6), 770–780. doi:10.1190/1.1440465
Haas, A., and Dubrule, O. (1994). Geostatistical inversion-a sequential method of stochastic reservoir modelling constrained by seismic data. First break 12 (11). doi:10.3997/1365-2397.1994034
Jason Geoscience Workbench (2002). Unpublished training manual: Trace based inversion and modeling. Houston, Texas: Fugro - Jason.
Jiang, R., Zhao, L., Xu, A., Ashraf, U., Yin, J., Song, H., et al. (2021). Sweet spots prediction through fracture Genesis using multi-scale geological and geophysical data in the karst reservoirs of Cambrian Longwangmiao Carbonate Formation, Moxi-Gaoshiti area in Sichuan Basin, South China. J. Pet. Explor. Prod. Technol. 12, 1313–1328. doi:10.1007/s13202-021-01390-0
Kumar, R., Das, B., Chatterjee, R., and Sain, K. (2016). A methodology of porosity estimation from inversion of post-stack seismic data. J. Nat. Gas Sci. Eng. 28, 356–364. doi:10.1016/j.jngse.2015.12.028
Latimer, R. B., Davidson, R., and Van Riel, P. (2000). An interpreter's guide to understanding and working with seismic-derived acoustic impedance data. Lead. edge 19 (3), 242–256. doi:10.1190/1.1438580
Liu, B., Chang, S., Zhang, S., Chen, Q., Zhang, J., Li, Y., et al. (2022). Coalbed methane gas content and its geological controls: Research based on seismic-geological integrated method. J. Nat. Gas Sci. Eng. 101, 104510. doi:10.1016/j.jngse.2022.104510
Liu, K., Wang, R., Shi, W., Zhang, W., Qi, R., Qin, S., et al. (2020). Tectonic controls on Permian tight gas accumulation: Constrains from fluid inclusion and paleo-structure reconstruction in the Hangjinqi area, northern Ordos Basin, China. J. Nat. Gas Sci. Eng. 83, 103616. doi:10.1016/j.jngse.2020.103616
Ma, X. H. (2005). Discussion on characteristics and reservoiring mechanism of deep basin gas in Upper Paleozoic in Ordos basin. Oil Gas. Geol. 26, 230–236.
Mahgoub, M. I., Padmanabhan, E., and Abdullatif, O. M. (2017). Seismic inversion as a predictive tool for porosity and facies delineation in Paleocene fluvial/lacustrine reservoirs, Melut Basin, Sudan. Mar. Petroleum Geol. 86, 213–227. doi:10.1016/j.marpetgeo.2017.05.029
Mangi, H. N., Chi, R., DeTian, Y., Sindhu, L., He, D., Ashraf, U., et al. (2022). The ungrind and grinded effects on the pore geometry and adsorption mechanism of the coal particles. J. Nat. Gas Sci. Eng. 100, 104463. doi:10.1016/j.jngse.2022.104463
Mangi, H. N., Detian, Y., Hameed, N., Ashraf, U., and Rajper, R. H. (2020). Pore structure characteristics and fractal dimension analysis of low rank coal in the Lower Indus Basin, SE Pakistan. J. Nat. Gas Sci. Eng. 77, 103231. doi:10.1016/j.jngse.2020.103231
Mingjian, W., Dengfa, H., Hongping, B., Renqi, L., and Baoling, G. (2011). Upper palaeozoic gas accumulations of the Yimeng uplift, Ordos Basin. Petroleum Explor. Dev. 38 (1), 30–39. doi:10.1016/s1876-3804(11)60013-x
Pan, H., Yin, X., Li, K., and Pei, S. (2022). An improved matching pursuit method for coal seam identification driven by seismic inversion. Chin. J. Geophys. 65 (6), 2276–2293. doi:10.6038/cjg2022P0211
Qiang, Z., Yasin, Q., Golsanami, N., and Du, Q. (2020). Prediction of reservoir quality from log-core and seismic inversion analysis with an artificial neural network: A case study from the sawan gas field, Pakistan. Energies 13 (2), 486. doi:10.3390/en13020486
Qin, S., Wang, R., Shi, W., Liu, K., Zhang, W., Xu, X., et al. (2022). Diverse effects of intragranular fractures on reservoir properties, diagenesis, and gas migration: Insight from Permian tight sandstone in the Hangjinqi area, north Ordos Basin. Mar. Petroleum Geol. 137, 105526. doi:10.1016/j.marpetgeo.2022.105526
Safaei-Farouji, M., Thanh, H. V., Dashtgoli, D. S., Yasin, Q., Radwan, A. E., Ashraf, U., et al. (2022). Application of robust intelligent schemes for accurate modelling interfacial tension of CO2 brine systems: Implications for structural CO2 trapping. Fuel 319, 123821. doi:10.1016/j.fuel.2022.123821
Simm, R., Bacon, M., and Bacon, M. (2014). Seismic amplitude: An interpreter's handbook. Cambridge, United Kingdom: Cambridge University Press.
Thanh, H. V., and Sugai, Y. (2021). Integrated modelling framework for enhancement history matching in fluvial channel sandstone reservoirs. Upstream Oil Gas Technol. 6, 100027. doi:10.1016/j.upstre.2020.100027
Thanh, H. V., Sugai, Y., Nguele, R., and Sasaki, K. (2019). Integrated workflow in 3D geological model construction for evaluation of CO2 storage capacity of a fractured basement reservoir in Cuu Long Basin, Vietnam. Int. J. Greenh. Gas Control 90, 102826. doi:10.1016/j.ijggc.2019.102826
Veeken, P. C. H., and Da Silva, A. M. (2004). Seismic inversion methods and some of their constraints. First break 22 (6). doi:10.3997/1365-2397.2004011
Vo Thanh, H., Sugai, Y., and Sasaki, K. (2020). Impact of a new geological modelling method on the enhancement of the CO2 storage assessment of E sequence of Nam Vang field, offshore Vietnam. Energy Sources, Part A Recovery, Util. Environ. Eff. 42 (12), 1499–1512. doi:10.1080/15567036.2019.1604865
Wang, Q. F., and Guo, K. (2008). Constrained sparse spike inversion applied in the reservoir prediction. Well Logging Technol. 32 (1), 35–37. doi:10.16489/j.issn.1004-1338.2008.01.02
Wang, R., Shi, W., Xie, X., Zhang, W., Qin, S., Liu, K., et al. (2020). Clay mineral content, type, and their effects on pore throat structure and reservoir properties: Insight from the Permian tight sandstones in the Hangjinqi area, north Ordos Basin, China. Mar. Petroleum Geol. 115, 104281. doi:10.1016/j.marpetgeo.2020.104281
Wood, D. A., and Cai, J. (2022). “Coal-bed methane reservoir characterization using well-log data,” in Sustainable geoscience for natural gas subsurface systems (Oxford, United Kingdom: Gulf Professional Publishing), 243–274.
Wu, X., Ni, C., Liu, Q., Liu, G., Zhu, J., and Chen, Y. (2017). Genetic types and source of the upper paleozoic tight gas in the Hangjinqi area, northern Ordos Basin. China: Geofluids.
Xu, Y. Z., Huang, W. C., Chen, T. J., Cui, R. F., and Chen, S. Z. (2009). An evaluation of deep thin coal seams and water-bearing/resisting layers in the quaternary system using seismic inversion. Min. Sci. Technol. (China) 19 (2), 161–165. doi:10.1016/s1674-5264(09)60030-2
Xue, H., Zhang, J. C., Wang, Y., Xu, B., and Guo, H. Q. (2009). Relationship between tectonic evolution and hydrocarbon in Hangjinqi block of north Ordos Basin. Geotect. Metallogenia 33 (2), 206–214. doi:10.3787/j.issn.1000-0976.2009.12.003
Yang, M. H., Li, L., Zhou, J., Jia, H. C., Sun, X., Gong, T., et al. (2015a). Structural evolution and hydrocarbon potential of the upper paleozoic northern Ordos Basin, north China. Acta Geol. Sin. - Engl. Ed. 89, 1636–1648. doi:10.1111/1755-6724.12570
Yasin, Q., Du, Q., Ismail, A., and Shaikh, A. (2019). A new integrated workflow for improving permeability estimation in a highly heterogeneous reservoir of Sawan Gas Field from well logs data. Geomech. Geophys. Geo. Energy. Ge. Resour. 5 (2), 121–142. doi:10.1007/s40948-018-0101-y
Yasin, Q., Sohail, G. M., Ding, Y., Ismail, A., and Du, Q. (2020). Estimation of petrophysical parameters from seismic inversion by combining particle swarm optimization and multilayer linear calculator. Nat. Resour. Res. 29 (5), 3291–3317. doi:10.1007/s11053-020-09641-3
Yasin, Q., Sohail, G. M., Khalid, P., Baklouti, S., and Du, Q. (2021). Application of machine learning tool to predict the porosity of clastic depositional system, Indus Basin, Pakistan. J. Petroleum Sci. Eng. 197, 107975. doi:10.1016/j.petrol.2020.107975
Young, M. J., Gawthorpe, R. L., and Sharp, I. R. (2000). Sedimentology and sequence stratigraphy of a transfer zone coarse‐grained delta, Miocene Suez Rift, Egypt. Sedimentology 47 (6), 1081–1104. doi:10.1046/j.1365-3091.2000.00342.x
Zhang, L., Liu, C., Fayek, M., Wu, B., Lei, K., Cun, X., et al. (2017). Hydrothermal mineralization in the sandstone–hosted Hangjinqi uranium deposit, North Ordos Basin, China. Ore Geol. Rev. 80, 103–115. doi:10.1016/j.oregeorev.2016.06.012
Zhang, S. C., Mi, J. K., Liu, L. H., and Tao, S. Z. (2009). Geological features and formation of coal-formed tight sandstone gas pools in China: Cases from Upper Paleozoic gas pools, Ordos Basin and Xujiahe Formation gas pools, Sichuan Basin. Petroleum Explor. Dev. 36 (3), 320–330. doi:10.1016/s1876-3804(09)60129-4
Zhang, X., Fu, J., Hou, F., Zheng, X., Zhang, Y., Wang, R., et al. (2022). Sand-mudstone modeling of fluvial fan sedimentary facies: A case study of Shanxi Formation reservoir in Ordos Basin. J. Pet. Explor. Prod. Technol., 1–14. doi:10.1007/s13202-022-01496-z
Keywords: constrained sparse spike inversion, porosity estimation, Shanxi and Taiyuan Formations, tight sandstone, hangjinqi area, Ordos Basin
Citation: Ashraf U, Anees A, Shi W, Wang R, Ali M, Jiang R, Vo Thanh H, Iqbal I, Zhang X and Zhang H (2022) Estimation of porosity and facies distribution through seismic inversion in an unconventional tight sandstone reservoir of Hangjinqi area, Ordos basin. Front. Earth Sci. 10:1014052. doi: 10.3389/feart.2022.1014052
Received: 08 August 2022; Accepted: 13 September 2022;
Published: 30 September 2022.
Edited by:
Muhsan Ehsan, Bahria University, PakistanReviewed by:
Hamzeh Ghorbani, Islamic Azad University, IranCopyright © 2022 Ashraf, Anees, Shi, Wang, Ali, Jiang, Vo Thanh, Iqbal, Zhang and Zhang. This is an open-access article distributed under the terms of the Creative Commons Attribution License (CC BY). The use, distribution or reproduction in other forums is permitted, provided the original author(s) and the copyright owner(s) are credited and that the original publication in this journal is cited, in accordance with accepted academic practice. No use, distribution or reproduction is permitted which does not comply with these terms.
*Correspondence: Wanzhong Shi, c2hpd3pAY3VnLmVkdS5jbg==; Hucai Zhang, emhhbmdoY0B5bnUuZWR1LmNu
†These authors have contributed equally to this work and share first authorship
Disclaimer: All claims expressed in this article are solely those of the authors and do not necessarily represent those of their affiliated organizations, or those of the publisher, the editors and the reviewers. Any product that may be evaluated in this article or claim that may be made by its manufacturer is not guaranteed or endorsed by the publisher.
Research integrity at Frontiers
Learn more about the work of our research integrity team to safeguard the quality of each article we publish.