 Atsushi Nakao
 Tatsu Kuwatani1
 Kenta Ueki
 Kenta Yoshida
 Hideitsu Hino
 Shotaro Akaho
- 1Research Institute for Marine Geodynamics, Japan Agency for Marine-Earth Science and Technology, Yokosuka, Japan
- 2The Institute of Statistical Mathematics, Tachikawa, Japan
- 3Human Informatics and Interaction Research Institute, National Institute of Advanced Industrial Science and Technology, Tsukuba, Japan
The potential mechanisms that drive the behavior of subducted oceanic plates at the 660-km discontinuity are subject to debate. Here we conduct logistic regression analysis and model selection to determine the key subduction-zone parameters in natural subduction zones that discriminate the plate behavior along the discontinuity. We select the key variables based on three information criteria: leave-one-out cross-validation score (LOO), Akaike Information Criterion (AIC), and Bayesian Information Criterion (BIC). Among the 17 subduction-zone parameters analyzed, only the trench velocity, convergence rate, and trench width are selected in the simplest model that minimizes BIC. The thermal parameter and several other variables are also selected to minimize AIC and LOO. Our results suggest that a stagnant slab occurs along the 660-km discontinuity when there is a narrow oceanic plate and a retreating trench in natural subduction zones, which has also been modeled in previous numerical simulations. Neither the stress nor the deformation rate of the upper-plate margin is selected in the three optimal models, which suggests that back-arc spreading in natural subduction zones does not globally characterize plate behavior at the 660-km discontinuity, although back-arc spreading and a stagnant slab coincide in some numerical simulations. The combination of subduction-zone data analysis and numerical simulations will therefore provide deep insights into the dynamics of Earth’s deep interior.
1 Introduction
The 660-km discontinuity is a major seismic discontinuity at approximately 660 km depth that marks the boundary between the upper and lower mantle. This boundary has been inferred to act as a partial barrier to subducted oceanic plates (slabs) and is associated with a phase change in mantle minerals (e.g., Ringwood, 1991). Seismic tomography has imaged the stagnation of some slabs above this boundary (so-called stagnant slabs), such as that observed beneath Eastern Asia, with others, such as that beneath the Mariana Islands, penetrating this boundary (e.g., Fukao et al., 2009). The fate of subducting slabs is a topic of particular interest among geophysicists, as it affects the thermal and chemical evolution of the entire mantle and influences various tectonic processes, such as intra-plate volcanism that is triggered by water derived from the stagnant slab (e.g., Zhao et al., 2007; Richard and Iwamori, 2010).
The mechanisms that generate the variations in slab behavior at the 660-km discontinuity are still debatable, although numerical experiments have been conducted to clarify the relationship between given tectonic conditions and the resultant slab behavior. Christensen (1996) and subsequent studies have shown that seaward trench motion (or trench retreat) coincides with plate stagnation along the 660-km discontinuity. Additional controlling mechanisms have been proposed, such as the thermal structures of the subducting and upper plates, the width of the subducting oceanic plate, Clapeyron slopes and viscosity jumps at the 410- and 660-km discontinuities, the rheology of the back-arc basin and subducting plates, and the water content of the subducting plate (e.g., Torii and Yoshioka, 2007; Stegman et al., 2010; Nakakuki and Mura, 2013; Čížková and Bina, 2013; Garel et al., 2014; Nakao et al., 2016, 2018; Agrusta et al., 2017). This suite of potential mechanisms that can be used to explain the slab behavior at the 660-km discontinuity therefore makes it necessary to determine the predominant mechanisms by analyzing data obtained from natural subduction zones.
The predominant mechanisms driving slab behavior at the 660-km discontinuity can be constrained by statistically clarifying the relationship between the slab behavior at the boundary (i.e., stagnation or penetration) and the observed physical parameters along all of the subduction zones (hereafter “subduction-zone parameters”). This problem can be reduced to a general discriminant problem to determine the key explanatory variables that effectively discriminate an objective variable into labeled classes (e.g., Kuwatani et al., 2014; Ueki et al., 2018) by defining the slab behavior (stagnation or penetration) as an objective variable that can be characterized using subduction-zone parameters. Sparse modeling, which expresses an objective variable using a limited number of variables, is a suitable solver for this discriminant problem because it provides key variables and can assist in identifying the important mechanisms. Furthermore, sparse modeling does not require a large data volume and is applicable to sparse datasets, such as the observed subduction-zone parameters to date. We therefore apply sparse modeling for this discriminant problem owing to its explainability of the subduction-zone parameter results and the current sparsity of the subduction-zone parameter dataset.
Here we identify the subduction-zone parameters that shape the slab behavior at the 660-km discontinuity via discriminant analysis and variable selection. We then discuss the predominant mechanism driving this slab behavior by comparing our analytical results with published numerical solutions for plate subduction.
2 Methods
2.1 Data
We investigated 17 types of subduction-zone parameters, which are visualized in Figure 1, as explanatory variables of the subducted oceanic plate behavior at the 660-km discontinuity. We used the subduction-zone parameters that were observed at 163 subduction-zone locations (circles with thin black lines in Figure 2) as training data for the logistic regression analysis (Section 2.2), with the remaining 40 or less locations, which lack observations for some of the subduction-zone parameters, serving as testing data for the resultant regression model (circles with thick black lines in Figure 2).
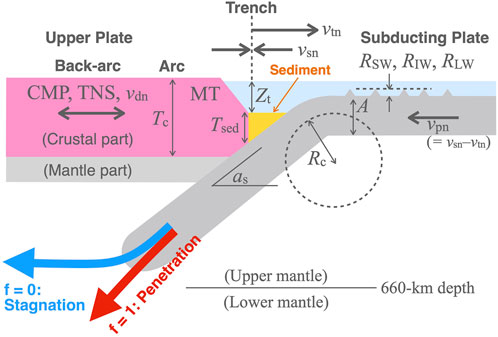
FIGURE 1. Schematic cross-section (perpendicular to the trench axis) of a subduction zone, with the analyzed subduction-zone parameters labeled (Section 2.1 for details). Gray, pink, yellow, and blue regions indicate lithospheric rocks, the upper crust, trench sediments, and seawater, respectively.
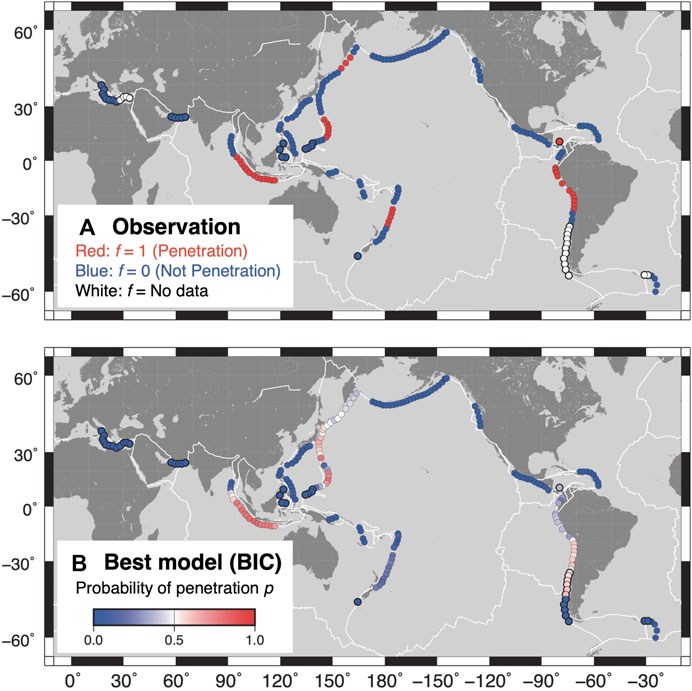
FIGURE 2. (A) Plate behavior at the 660-km discontinuity, f, which is based on the maximum plate depth defined by SubMap 4.3 (Heuret and Lallemand, 2005). (B) Probability of the subducted oceanic plate penetrating the 660-km discontinuity, pBIC, which is calculated using the optimal model that yields the minimum BIC (black bars in Figure 3). Circles with thin black lines in both figures indicate the samples used for training, and those with thick black lines indicate test samples. White lines mark the plate boundaries.
We reduced our problem to a two-class discriminant problem by labeling the objective variable, the plate behavior, beneath the j-th sample location as:
where dj is the maximum depth of the subducting oceanic plate beneath location j, which is taken from SubMap 4.3 (Heuret and Lallemand, 2005). Therefore, f = 1 indicates that the oceanic plate penetrates the 660-km discontinuity, whereas f = 0 indicates that the oceanic plate either stagnates at the 660-km discontinuity or does not reach this boundary. The global distribution of f used in the analysis is shown in Figure 2A; 24.5% of the test data are labeled f = 1, and the rest are labeled f = 0.
The 17 explanatory variables used to discriminate f are almost the same as the subduction-zone parameters in Nakao et al. (2022). These 17 variables are as follows: 1) A, the age of the subducting oceanic plate at the trench (Müller et al., 1997); 2) as, the mean dip angle of the subducting oceanic plate over the 0–125 km depth range (Heuret and Lallemand, 2005); 3) CMP (compression) and 4) TNS (tension), dummy variables that express the strain state of the upper plate, and are based on earthquake focal mechanisms (“UPS” in Heuret et al., 2011): (CMP, TNS) = (1, 0) for compressible upper plates, (0, 1) for tensile upper plates, and (0, 0) for neutral upper plates; 5) Lp, the width of the oceanic plate defined by Brizzi et al. (2018); 6) MT (margin type), a dummy variable that expresses either the accretionary or erosional conditions of the upper-plate margin: MT = 1 for accretionary margins and MT = 0 for erosional margins; 7) Rc, the bending radius of the subducting oceanic plate; 8) RSW, 9) RIW, and 10) RLW, the seafloor roughnesses of the subducting oceanic plate for different bathymetric wavelengths, which have been defined by Lallemand et al. (2018): 12–20 km [short wavelengths (SW)], 20–80 km [intermediate wavelengths (IW)], and 80–100 km [long wavelengths (LW)]; 11) Tc, the upper-plate crustal thickness at the arc, which is taken from CRUST 1.0 (Laske et al., 2013); 12) Tsed, the sediment thickness at the trench, which is taken from GlobSed 3 (Straume et al., 2019); 13) vsn, the trench-normal component of the convergence rate at the trench (Lallemand et al., 2008); 14) vdn, the trench-normal component of the extension rate of the upper-plate margin (Lallemand et al., 2008), which is positive for back-arc spreading and negative for back-arc shortening; 15) vtn, the trench-normal component of the trench migration rate, which is positive for a retreating trench (oceanward motion) and negative for an advancing trench (continent-ward motion), with the values used in this study based on the Indian hotspot (Steinberger et al., 2004; Lallemand et al., 2008); 16) Zt, the trench depth; and 17) Φ, the thermal parameter, which is defined as Φ = Avsn sin as by Kirby et al. (1991) and corresponds to the coldness of the subducted oceanic plate.
2.2 Logistic regression analysis
We apply logistic regression analysis, a simple method for discriminant problems, to express the probability of plate penetration at the 660-km discontinuity (hereafter p) using the 17 subduction-zone parameters. The relative contribution of each explanatory variable to p is evaluated by standardizing the i-th explanatory variable (i = 1, …, I) observed at location j (j = 1, …, J) as:
where xij is an unstandardized explanatory variable (i.e., A, as, …, Φ),
A generalized linear model is used for two-class discriminant analysis. We assume a Bernoulli distribution, such that the probability of plate penetration beneath location j can be written as:
where a = (a0, a1, …, aI) is a coefficient vector and c = (c1, …, cI) is a parameter vector that controls whether
The coefficient is estimated based on the premise that the likelihood L (a; c) is the maximum for a given c:
Here, the likelihood is defined as the joint probability:
where P(fj∣pj) is the probability that the observed and predicted subducted-plate behaviors are the same for location j. When P(fj∣pj) follows a Bernoulli distribution, the log likelihood can be written as:
2.3 Model evaluation
We determined the optimal variable combination c based on three criteria: log-likelihood-based leave-one-out cross-validation score (LOO; Stone, 1974), Akaike Information Criterion (AIC; Akaike, 1974), and Bayesian Information Criterion (BIC; Schwarz, 1978). LOO is defined here as:
where
AIC and BIC are defined as:
and:
respectively, where
3 Results
We determined the three models that most effectively discriminated the subducted plate behavior f (Figure 3). LOO is minimized by selecting 10 variables: as, Lp, MT, Rc, RIW, RSW, Tsed, vsn, vtn, and Φ. AIC is minimized when A and RLW are selected in addition to the 10 LOO variables. The optimal LOO and AIC models are similar since cross validation is asymptotically equivalent to AIC (Stone, 1977). However, BIC is minimized by selecting only three variables: Lp, vsn, and vtn. Lp, vsn, and vtn, are common variables among the three optimal models. Furthermore, the relative contribution of these three variables to the discrimination is large in the optimal LOO and AIC models compared with the other variables (Figure 3), which indicates that f is better discriminated in the three-dimensional (3-D) space of these three variables, as shown in Figure 4), than in the other variable spaces. Φ has the third largest contribution to the discrimination in the optimal LOO model; its effects on slab behavior will be discussed along with Lp, vsn, and vtn.
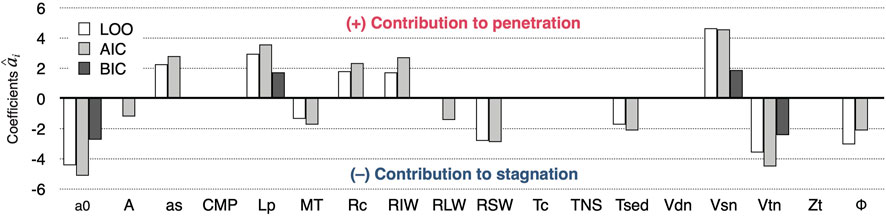
FIGURE 3. Selected variables and their coefficients
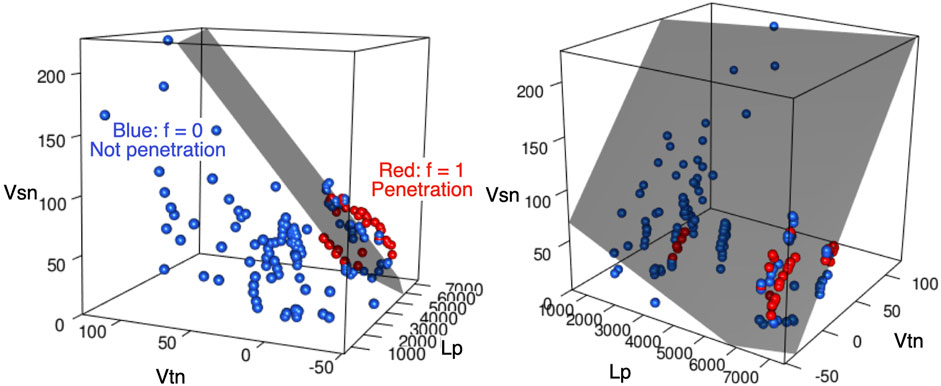
FIGURE 4. Two views of a three-dimensional plot of Lp (km), vsn (mm/yr), and vtn (mm/yr) for all of the training data. Blue and red spheres indicate those labeled as f = 0 (stagnation) and f = 1 (penetration), respectively. The gray plane indicates the estimated discriminant plane that minimizes BIC (i.e., zBIC = 0 in Eq. 12, pBIC > 0.5 above the plane, and pBIC < 0.5 below the plane).
The probability of slab penetration for the variable combination that minimizes BIC, pBIC, can be expressed in non-dimensionalized form as:
where Lp,j (km) is the width of the subducting plate to which location j belongs, vsn,j (mm/yr) is the trench-normal convergence rate at location j, and vtn,j (mm/yr) is the trench-normal trench retreat rate at location j. Similarly, the p that minimizes LOO and AIC can be expressed using the estimated coefficients in Supplementary Table S1. The hyperplane zBIC = 0 corresponds to the estimated discriminant plane of the optimal BIC model to classify f (Figure 4).
Figure 2B shows the global pBIC distribution for both the training and test data. Even though the optimal BIC model yields a lower likelihood value than the optimal LOO and AIC models, the very small pBIC values are correctly derived for most of the test locations where there is no 660-km discontinuity penetration, such as those beneath the Mediterranean Sea and Southeast Asian islands. However, a significant discrepancy between f and pBIC is observed beneath the southern Tonga region, whereas a better fit between f and p is obtained in the optimal LOO and AIC models (Supplementary Figure S1). The subducted Pacific Plate beneath the southern Tonga region is believed to penetrate the 660-km discontinuity and form a horizontal stagnant slab at 1,000 km depth based on seismic velocity models (Fukao and Obayashi, 2013), although the optimal BIC model indicates plate stagnation along the 660-km discontinuity.
4 Discussion
We propose that Lp, vsn, and vtn, which are the three variables selected in each of the three optimal models, are the primary subduction-zone features that characterize f. In addition, LOO and AIC place more weight on model predictability than model simplicity compared with BIC, such that the additional variables selected by LOO and AIC may be considered secondary variables that are important for improving the fit between f and p. Here we discuss the likely mechanisms of driving slab behavior in natural subduction zones based on these primary and secondary variables.
vtn is selected as a variable that decreases p, which is consistent with previous numerical simulations that show relations between slab behavior and the trench motion (e.g., Christensen, 1996). The relationship between a stagnant slab and trench retreat is governed by the anchoring of the tip of a subducting plate to the 660-km discontinuity, which causes the plate to bend in a convex downward direction, with the negative buoyancy force pulling the upper plate oceanward (Nakakuki and Mura, 2013; Nakao et al., 2016). Continent-ward counter-flows dominate in the mantle transition zone and extend the subducted plate horizontally during rollback (or trench retreat) (Nakakuki and Mura, 2013; Nakao et al., 2016). This mechanism may explain the relationship between f and vtn in natural subduction zones.
Our optimal models also show that increasing Lp result in decreasing p, which is consistent with 3-D numerical simulations (e.g., Schellart et al., 2007; Stegman et al., 2010) which have demonstrated that a narrow oceanic plate contributes to rapid trench retreat and plate stagnation along the 660-km discontinuity. These previous experiments have indicated that toroidal flows [flows in the two-dimensional (2-D) horizontal section] from sub-oceanic to sub-continental mantle regions become dominant compared with poloidal flows (flows in the 2-D vertical section) around narrow plates, and are essential to the formation of a stagnant slab with a retreating trench. Our results indicate that this along-arc mechanism is a significant driver of slab stagnation/penetration in natural subduction zones.
vsn is selected in each optimal model as a variable that increases p. This result may appear to contradict some numerical experiments (e.g., Nakakuki and Mura, 2013; Garel et al., 2014; Agrusta et al., 2017; Nakao et al., 2018), which show a high vsn during the initial stage of subduction that then decreases as the slab penetrates the 660-km boundary. It also appears to be inconsistent with the subduction mode classification of Schellart (2011), whereby a stagnant slab coincides with large vsn. However, vsn is an important variable when selected with vtn and Lp because the discriminant plane is located along the data trend (Figure 4). The slightly large vsn of the penetrating plates relative to the stagnating plates under negative vtn and large Lp may be associated with acceleration during the collapse of the stagnant slab or an external force affecting the movement of the oceanic plates towards the trench (e.g., Fuji et al., 2021).
Φ is selected in the optimal LOO and AIC models, suggesting that colder plates tend to stagnate along the 660-km discontinuity. The same result has been obtained in previous simulations (e.g., Garel et al., 2014; Agrusta et al., 2017; Fuji et al., 2021), as colder (older) plates tend to stagnate more readily because they are generally heavier and drag the upper plate oceanward. A subducted cold oceanic plate can stagnate along the 660-km discontinuity because of the buoyancy related to a delay in the phase transition from pyroxene to majoritic garnet (King et al., 2015). Metastable minerals, such as olivine and pyroxene, may also contribute to the buoyancy of a cold slab in the mantle transition zone, thereby leading to stagnation (Tetzlaff and Schmeling, 2000; Agrusta et al., 2014). Therefore, a large Φ may induce a negative buoyancy effect in the shallow mantle and a positive buoyancy effect in the mantle transition zone, both of which would lead to stagnation of the subducting slab. Conversely, the rheological effects associated with Φ may have a complex influence on slab morphology (e.g., Lee and King, 2011; Dasgupta et al., 2021; Cerpa et al., 2022).
The optimal LOO and AIC models indicate that a small Tsed value and the absence of an accretionary prism lead to increased p. This can be explained by the numerical simulations of Brizzi et al. (2020), which show the emplacement of a thicker sediment layer overlying the subducting oceanic plate causes the trench to move oceanward and the sediment to be accreted to the upper plate, forming an accretionary prism. This process further reduces the shallow dip angle of the subducting oceanic plate. A similar trend has been observed in simulations of the South America (Hu et al., 2021). Therefore, this mechanism, which is driven by a large Tsed value, yields positive MT, small as, and large vtn values, and is consistent with our optimal LOO and AIC models.
CMP, TNS, vdn, and Tc are not selected in any of the optimal models, although previous numerical simulations have indicated that a stagnant slab occurs with stretching of the upper plate (e.g., Nakakuki and Mura, 2013; Garel et al., 2014; Nakao et al., 2016, 2018). Our finding may reflect exceptions to the results of the previous numerical simulations, as observed in the Mariana subduction zone, where the subducting Pacific Plate penetrates the lower mantle despite back-arc spreading, because of the tensile stress related to subduction of the overlying Philippine Sea Plate (Čížková and Bina, 2015). Even though the formation of a back-arc basin may coincide with a stagnant slab in some tectonic environments, our result suggests that it does not explain the global distribution of f.
We are unable to explain why variables related to seafloor roughness (RSW, RIW, and RLW) were selected as explanatory variables of f in the optimal AIC and LOO models, given the various geophysical and geochemical processes that shape the seafloor topography, including hot-spot and petit-spot volcanism, trench outer-rise faulting, and sedimentation. The relationship between seafloor roughness and slab behavior at the 660-km discontinuity should therefore be investigated in future numerical simulations.
We note that the optimal variable combination could potentially change if more favorable variables are additionally given. We used relatively shallow data in the present study because deeper data were unavailable. However, we will develop a new regression model that incorporates any new data that may be acquired via advances in observational techniques, especially in the deep mantle. For example, the sudden increases in viscosity and density at the 660-km discontinuity might influence slab dynamics (Torii and Yoshioka, 2007; Nakakuki and Mura, 2013; Čížková and Bina, 2013), and mantle winds, which are driven by the pressure gradient in the deep mantle, might give rise to a stagnant slab (Peng et al., 2021). The consideration of future observations of the deep mantle will further advance our understanding of the dynamics of subducting slabs.
While we only performed a simple two-class discriminant analysis based on the maximum depth of a subducted slab, which was the objective variable, the slab morphology and its behavior can be expressed by additional factors, such as its buckling wavelength and amplitude (Lee and King, 2011), and the dip angle of deeper sections of the slab (Hu and Gurnis, 2020). However, these morphological factors may vary with physical parameters that are either not selected or not considered in the present analysis, such as the ages of the subducting and upper plates (Dasgupta et al., 2021; Cerpa et al., 2022). If we can quantify the slab morphology, then multi-class discriminant analysis will provide additional insights into the dynamics of subducting slabs.
5 Conclusion
Logistic regression analysis and exhaustive model evaluation were conducted to determine the subduction-zone parameters that increased the probability of the subducting slab penetrating the 660-km discontinuity, p. The results highlight that the slab behavior observed at this mantle boundary can be effectively classified by considering the combination of the trench retreat rates vtn, convergence rates at the trench vsn, and the width of the oceanic plate Lp; these three variables were selected in each of the three optimal models, which were based on three employed criteria: LOO, AIC, and BIC. Negative vtn (trench advance) and large Lp (wide oceanic plate) both increase p, consistent with previous numerical simulations. The predominant influences of vtn and Lp on p are likely due to both variables being related to mantle flow from the sub-oceanic to sub-continental mantle material surrounding the subducting slab, which is necessary to induce slab rollback. The thermal parameter Φ and trench sediment thickness Tsed were selected to obtain a better fit between f and p, which is also consistent with previous numerical simulations. Neither the stress nor deformation rate of the upper-plate margin were selected in the three optimal models, thereby suggesting that back-arc spreading does not globally characterize f. However, the dataset used in this study lacks some information, such as the data of the deep mantle and chemical composition; therefore, further analyses with improved subduction-zone data are needed to advance our knowledge of the dynamics of Earth’s deep interior.
Data availability statement
Publicly available datasets were analyzed in this study. This data can be found here: All of the data used in our analysis were downloaded from SubMap 4.3 (Heuret and Lallemand, 2005) (https://doi.org/10.1016/j.pepi.2004.08.022), Supplementary Material S1 of Brizzi et al. (2018) (https://doi.org/10.1016/j.tecto.2018.01.027), CRUST 1.0 (https://igppweb.ucsd.edu/∼gabi/rem.html), and GlobSed 3 (https://ngdc.noaa.gov/mgg/sedthick/).
Author contributions
AN designed the research, collected the data, conducted the analysis, and wrote the original draft under the supervision of TK. TK and KU developed the analytical method. TK, KU, KY, and TY reviewed and edited the original draft. HH and SA verified the analytical method and reviewed and edited the statistical discussions in the manuscript.
Funding
This work was supported by the Japan Science and Technology Agency (CREST Grant No. JPMJCR1761), JSPS KAKENHI (Grant Nos. JP19K04026, JP20K04119, JP22K14131, and JP22H03653), and the Joint Research program 2021-B-01 of the Earthquake Research Institute, the University of Tokyo.
Acknowledgments
We thank constructive comments by two reviewers and handling by Nobuaki Fuji. AN would like to thank Manabu Morishige for useful discussions. We used the R language (R Core Team, 2021) and MuMIn package (Barton and Barton, 2015). Some of the figures were produced using Generic Mapping Tools (Wessel et al., 2019).
Conflict of interest
The authors declare that the research was conducted in the absence of any commercial or financial relationships that could be construed as a potential conflict of interest.
Publisher’s note
All claims expressed in this article are solely those of the authors and do not necessarily represent those of their affiliated organizations, or those of the publisher, the editors and the reviewers. Any product that may be evaluated in this article, or claim that may be made by its manufacturer, is not guaranteed or endorsed by the publisher.
Supplementary material
The Supplementary Material for this article can be found online at: https://www.frontiersin.org/articles/10.3389/feart.2022.1008058/full#supplementary-material
References
Agrusta, R., Goes, S., and Van Hunen, J. (2017). Subducting-slab transition-zone interaction: Stagnation, penetration and mode switches. Earth Planet. Sci. Lett. 464, 10–23. doi:10.1016/j.epsl.2017.02.005
Agrusta, R., Van Hunen, J., and Goes, S. (2014). The effect of metastable pyroxene on the slab dynamics. Geophys. Res. Lett. 41, 8800–8808. doi:10.1002/2014gl062159
Akaike, H. (1974). A new look at the statistical model identification. IEEE Trans. Autom. Contr. 19, 716–723. doi:10.1109/tac.1974.1100705
Brizzi, S., Sandri, L., Funiciello, F., Corbi, F., Piromallo, C., and Heuret, A. (2018). Multivariate statistical analysis to investigate the subduction zone parameters favoring the occurrence of giant megathrust earthquakes. Tectonophysics 728, 92–103. doi:10.1016/j.tecto.2018.01.027
Brizzi, S., van Zelst, I., Funiciello, F., Corbi, F., and van Dinther, Y. (2020). How sediment thickness influences subduction dynamics and seismicity. JGR. Solid Earth 125, e2019JB018964. doi:10.1029/2019jb018964
Cerpa, N. G., Sigloch, K., Garel, F., Heuret, A., Davies, D. R., and Mihalynuk, M. G. (2022). The effect of a weak asthenospheric layer on surface kinematics, subduction dynamics and slab morphology in the lower mantle. JGR. Solid Earth 127, e2022JB024494. doi:10.1029/2022jb024494
Christensen, U. R. (1996). The influence of trench migration on slab penetration into the lower mantle. Earth Planet. Sci. Lett. 140, 27–39. doi:10.1016/0012-821x(96)00023-4
Čížková, H., and Bina, C. R. (2013). Effects of mantle and subduction-interface rheologies on slab stagnation and trench rollback. Earth Planet. Sci. Lett. 379, 95–103. doi:10.1016/j.epsl.2013.08.011
Čížková, H., and Bina, C. R. (2015). Geodynamics of trench advance: Insights from a Philippine-Sea-style geometry. Earth Planet. Sci. Lett. 430, 408–415. doi:10.1016/j.epsl.2015.07.004
Dasgupta, R., Sen, J., and Mandal, N. (2021). Bending curvatures of subducting plates: Old versus young slabs. Geophys. J. Int. 225, 1963–1981. doi:10.1093/gji/ggab070
Fuji, N., Jang, H., Nakao, A., Kim, Y., Fernández-Blanco, D., Lee, S.-M., et al. (2021). A possible roll-over slab geometry under the caroline plate imaged by Monte Carlo finite-frequency traveltime inversion of teleseismic SS phases. Front. Earth Sci. (Lausanne). 9, 593947. doi:10.3389/feart.2021.593947
Fukao, Y., Obayashi, M., Nakakuki, T., and Group, D. S. P. (2009). Stagnant slab: A review. Annu. Rev. Earth Planet. Sci. 37, 19–46. doi:10.1146/annurev.earth.36.031207.124224
Fukao, Y., and Obayashi, M. (2013). Subducted slabs stagnant above, penetrating through, and trapped below the 660 km discontinuity. J. Geophys. Res. Solid Earth 118, 5920–5938. doi:10.1002/2013jb010466
Garel, F., Goes, S., Davies, D., Davies, J. H., Kramer, S. C., and Wilson, C. R. (2014). Interaction of subducted slabs with the mantle transition-zone: A regime diagram from 2-D thermo-mechanical models with a mobile trench and an overriding plate. Geochem. Geophys. Geosyst. 15, 1739–1765. doi:10.1002/2014gc005257
Heuret, A., Lallemand, S., Funiciello, F., Piromallo, C., and Faccenna, C. (2011). Physical characteristics of subduction interface type seismogenic zones revisited. Geochem. Geophys. Geosyst. 12. doi:10.1029/2010gc003230
Heuret, A., and Lallemand, S. (2005). Plate motions, slab dynamics and back-arc deformation. Phys. Earth Planet. Interiors 149, 31–51. doi:10.1016/j.pepi.2004.08.022
Hu, J., and Gurnis, M. (2020). Subduction duration and slab dip. Geochem. Geophys. Geosyst. 21, e2019GC008862. doi:10.1029/2019gc008862
Hu, J., Liu, L., and Gurnis, M. (2021). Southward expanding plate coupling due to variation in sediment subduction as a cause of Andean growth. Nat. Commun. 12, 7271–7279. doi:10.1038/s41467-021-27518-8
King, S. D., Frost, D. J., and Rubie, D. C. (2015). Why cold slabs stagnate in the transition zone. Geology 43, 231–234. doi:10.1130/g36320.1
Kirby, S. H., Durham, W. B., and Stern, L. A. (1991). Mantle phase changes and deep-earthquake faulting in subducting lithosphere. Science 252, 216–225. doi:10.1126/science.252.5003.216
Kuwatani, T., Nagata, K., Okada, M., Watanabe, T., Ogawa, Y., Komai, T., et al. (2014). Machine-learning techniques for geochemical discrimination of 2011 Tohoku tsunami deposits. Sci. Rep. 4, 7077. doi:10.1038/srep07077
Lallemand, S., Heuret, A., Faccenna, C., and Funiciello, F. (2008). Subduction dynamics as revealed by trench migration. Tectonics 27. doi:10.1029/2007tc002212
Lallemand, S., Peyret, M., van Rijsingen, E., Arcay, D., and Heuret, A. (2018). Roughness characteristics of oceanic seafloor prior to subduction in relation to the seismogenic potential of subduction zones. Geochem. Geophys. Geosyst. 19, 2121–2146. doi:10.1029/2018gc007434
Laske, G., Masters, G., Ma, Z., and Pasyanos, M. (2013). Update on CRUST1.0–A 1-degree global model of Earth’s crust. Geophys. Res. Abstr. 15, 2658.
Lee, C., and King, S. D. (2011). Dynamic buckling of subducting slabs reconciles geological and geophysical observations. Earth Planet. Sci. Lett. 312, 360–370. doi:10.1016/j.epsl.2011.10.033
Müller, R. D., Roest, W. R., Royer, J.-Y., Gahagan, L. M., and Sclater, J. G. (1997). Digital isochrons of the world’s ocean floor. J. Geophys. Res. 102, 3211–3214. doi:10.1029/96jb01781
Nakakuki, T., and Mura, E. (2013). Dynamics of slab rollback and induced back-arc basin formation. Earth Planet. Sci. Lett. 361, 287–297. doi:10.1016/j.epsl.2012.10.031
Nakao, A., Iwamori, H., and Nakakuki, T. (2016). Effects of water transportation on subduction dynamics: Roles of viscosity and density reduction. Earth Planet. Sci. Lett. 454, 178–191. doi:10.1016/j.epsl.2016.08.016
Nakao, A., Iwamori, H., Nakakuki, T., Suzuki, Y. J., and Nakamura, H. (2018). Roles of hydrous lithospheric mantle in deep water transportation and subduction dynamics. Geophys. Res. Lett. 45, 5336–5343. doi:10.1029/2017gl076953
Nakao, A., Kuwatani, T., Ueki, K., Yoshida, K., Yutani, T., Hino, H., et al. (2022). Regression analysis and variable selection to determine the key subduction-zone parameters that determine the maximum earthquake magnitude. doi:10.2139/ssrn.4142188 (under review).
Peng, D., Liu, L., Hu, J., Li, S., and Liu, Y. (2021). formation of east Asian stagnant slabs due to a pressure-driven cenozoic mantle wind following mesozoic subduction. Geophys. Res. Lett. 48, e2021GL094638. doi:10.1029/2021gl094638
R Core Team (2021). R: A language and environment for statistical computing. Vienna, Austria: R Foundation for Statistical Computing.
Richard, G. C., and Iwamori, H. (2010). Stagnant slab, wet plumes and Cenozoic volcanism in East Asia. Phys. Earth Planet. Interiors 183, 280–287. doi:10.1016/j.pepi.2010.02.009
Ringwood, A. E. (1991). Phase transformations and their bearing on the constitution and dynamics of the mantle. Geochimica Cosmochimica Acta 55, 2083–2110. doi:10.1016/0016-7037(91)90090-r
Schellart, W. (2011). A subduction zone reference frame based on slab geometry and subduction partitioning of plate motion and trench migration. Geophys. Res. Lett. 38. doi:10.1029/2011gl048197
Schellart, W. P., Freeman, J., Stegman, D. R., Moresi, L., and May, D. (2007). Evolution and diversity of subduction zones controlled by slab width. Nature 446, 308–311. doi:10.1038/nature05615
Schwarz, G. (1978). Estimating the dimension of a model. Ann. Stat. 6, 461–464. doi:10.1214/aos/1176344136
Stegman, D., Schellart, W., and Freeman, J. (2010). Competing influences of plate width and far-field boundary conditions on trench migration and morphology of subducted slabs in the upper mantle. Tectonophysics 483, 46–57. doi:10.1016/j.tecto.2009.08.026
Steinberger, B., Sutherland, R., and O’connell, R. J. (2004). Prediction of Emperor-Hawaii seamount locations from a revised model of global plate motion and mantle flow. Nature 430, 167–173. doi:10.1038/nature02660
Stone, M. (1977). An asymptotic equivalence of choice of model by cross-validation and Akaike’s criterion. J. R. Stat. Soc. Ser. B Methodol. 39, 44–47. doi:10.1111/j.2517-6161.1977.tb01603.x
Stone, M. (1974). Cross-validatory choice and assessment of statistical predictions. J. R. Stat. Soc. Ser. B Methodol. 36, 111–133. doi:10.1111/j.2517-6161.1974.tb00994.x
Straume, E. O., Gaina, C., Medvedev, S., Hochmuth, K., Gohl, K., Whittaker, J. M., et al. (2019). GlobSed: Updated total sediment thickness in the world’s oceans. Geochem. Geophys. Geosyst. 20, 1756–1772. doi:10.1029/2018gc008115
Tetzlaff, M., and Schmeling, H. (2000). The influence of olivine metastability on deep subduction of oceanic lithosphere. Phys. Earth Planet. Interiors 120, 29–38. doi:10.1016/s0031-9201(00)00139-4
Torii, Y., and Yoshioka, S. (2007). Physical conditions producing slab stagnation: Constraints of the Clapeyron slope, mantle viscosity, trench retreat, and dip angles. Tectonophysics 445, 200–209. doi:10.1016/j.tecto.2007.08.003
Ueki, K., Hino, H., and Kuwatani, T. (2018). Geochemical discrimination and characteristics of magmatic tectonic settings: A machine-learning-based approach. Geochem. Geophys. Geosyst. 19, 1327–1347. doi:10.1029/2017gc007401
Wessel, P., Luis, J. F., Uieda, L., Scharroo, R., Wobbe, F., Smith, W. H. F., et al. (2019). The generic mapping tools version 6. Geochem. Geophys. Geosyst. 20, 5556–5564. doi:10.1029/2019gc008515
Keywords: plate tectonics, Subduction Zone, stagnant slab, slab penetration, discriminant analysis, sparse modeling
Citation: Nakao A, Kuwatani T, Ueki K, Yoshida K, Yutani T, Hino H and Akaho S (2022) Subduction-zone parameters that control slab behavior at the 660-km discontinuity revealed by logistic regression analysis and model selection. Front. Earth Sci. 10:1008058. doi: 10.3389/feart.2022.1008058
Received: 31 July 2022; Accepted: 11 October 2022;
Published: 26 October 2022.
Edited by:
Nobuaki Fuji, UMR7154 Institut de Physique du Globe de Paris (IPGP), FranceReviewed by:
Lijun Liu, University of Illinois at Urbana-Champaign, United StatesNibir Mandal, Jadavpur University, India
Copyright © 2022 Nakao, Kuwatani, Ueki, Yoshida, Yutani, Hino and Akaho. This is an open-access article distributed under the terms of the Creative Commons Attribution License (CC BY). The use, distribution or reproduction in other forums is permitted, provided the original author(s) and the copyright owner(s) are credited and that the original publication in this journal is cited, in accordance with accepted academic practice. No use, distribution or reproduction is permitted which does not comply with these terms.
*Correspondence: Atsushi Nakao, YXRzdXNoaS5uYWthb0BnbWFpbC5jb20=, YS1uYWthb0BqYW1zdGVjLmdvLmpw