 Wenhui Liu
 Hairui Liu
 Qingpeng Li
 Changwei Xie
 Zhijun Zhang
 Guanghao Zhou
 Qi Zhang
 Qinhao Zhao
95% of researchers rate our articles as excellent or good
Learn more about the work of our research integrity team to safeguard the quality of each article we publish.
Find out more
ORIGINAL RESEARCH article
Front. Earth Sci. , 09 January 2023
Sec. Cryospheric Sciences
Volume 10 - 2022 | https://doi.org/10.3389/feart.2022.1007384
This article is part of the Research Topic Climatic and Associated Cryospheric and Hydrospheric Changes on the Third Pole, volume II View all 11 articles
The lakes on the Qinghai–Tibetan Plateau have undergone substantial changes. As intensive cryospheric components change, the response of the lake dynamics to climatic factors, glacier-snow melting, and permafrost thawing has been complex. Based on Landsat images, meteorological data, and glacier and permafrost data, the spatial-temporal changes in the lake area on the northeastern Tibetan Plateau between 1988 and 2019 were analyzed and the driving factors behind the lake changes were further explored. The results suggest that the regional lake area increased from 1988 to 2019 at rates of 0.01–16.03 km2/yr. It decreased during 1988–2000, quickly increased during 2000–2012, and rapidly increased during 2012–2019. The most significant lake expansion occurred in sub-region I, which is the source region of the Yangtze River Basin. There was a sharper increase during 2012–2019 than during 2000–2012 in sub-region II (the source region of the Yellow River Basin and the Qinghai Lake Basin) and sub-region III (the Qaidam Basin). The significant lake expansion occurred about 12 years earlier in sub-region I than in sub-regions II and III. This dramatic change in the lake area was closely associated with the annual precipitation, and precipitation was the primary driving factor. Although serious glacier retreat occurred, most of the lakes in the sub-regions were non-glacier-fed lakes. The correlation between glacier ablation and the change in the lake area was poor, which suggests that glacial meltwater was not the replenishment source of most of the lakes in this region. A more accelerated increase in the active layer thickness occurred (1.90 cm/yr), which was consistent with the more rapid lake expansion, and the permafrost degradation further intensified the lake expansion.
The Qinghai–Tibetan Plateau (QTP) is the source of several large rivers in China and east Asia, and therefore, it is known as the Asian water tower (Zhang et al., 2019; Wang et al., 2021). It contains more than 1,000 lakes (areas of >1 km2), with a total lake area of about 41,800 km2. These lakes account for 39.2% and 51.4% of the total number of lakes and lake area in China, respectively (Zhang et al., 2014). They play a crucial role in regulating the balance between the regional surface water and groundwater. In recent decades, the QTP has experienced significant changes, which were mainly characterized by climate warming-wetting (Yang et al., 2011; Duan et al., 2015), glacier melting (Bolch et al., 2010; Yao et al., 2012), and permafrost thawing (Wu et al., 2010; Cheng et al., 2019; Zhao et al., 2020). Due to cloud-radiation feedback, an accelerated warming trend occurred on the Tibetan Plateau during 1998–2013 (0.25°C decade−1), compared with that during 1980–1997 (0.21°C decade−1) (Duan and Xiao, 2015). The annual retreat rate of the Basu Glacier in the Karakorum Mountains is nearly 50 m/yr and that of the Large Dongkemadi Glacier in the Tanggula Mountains is 4.6 m/yr (Yao et al., 2012). With continued climate warming, as well as accelerated glacier ablation and permafrost degradation, a succession of hydrological changes is anticipated to occur, which will have intensive impacts on the hydrological processes (Cheng et al., 2021; Ding et al., 2021; Gao et al., 2021). In particular, the lakes on the QTP have undergone substantial changes, including significant lake expansion, since 2000 (Lei et al., 2013; Li et al., 2014; Song et al., 2014; Yang et al., 2017; Zhang et al., 2019, 2021; Liu et al., 2021). The relationship between the lake dynamics and climate mechanism has been explored in many studies, but the dominant driver behind these lake changes is still under debate (Phan et al., 2013; Song and Sheng, 2016; Yao et al., 2018). Furthermore, the permafrost was not taken into consideration in these studies.
Permafrost is widely distributed on the QTP, with a total area of 1.06 × 10⁶ km2 (Zou et al., 2017), and the total volume of the ground ice in the permafrost regions is 9,528 km3 (Zhao et al., 2010). Permafrost degradation has accelerated due to the rising air temperature, resulting in reduced permafrost coverage (Zou et al., 2017), increased permafrost ground temperature (Wu et al., 2010), thickening of the active layer (Li et al., 2012), a decrease in the depth of the zero annual amplitude of the ground temperature of the permafrost (Xie et al., 2015; Liu et al., 2016), intensified thawing-freezing processes in the active layer (Zhu et al., 2022), and even a decrease in the ground ice content (Zhao et al., 2010). Long-term monitoring data have revealed that the Active Layer Thickness (ALT) along the Qinghai–Tibet Highway has increased at a rate of 1.33–1.90 cm/yr (Li et al., 2012). Permafrost temperatures at a depth of 15 m have decreased at a rate of 0.57°C per 100 m of altitude increase and 0.79°C per degree latitude northward (Wu et al., 2010). The effect of the presence of ice-rich permafrost and its thawing on the hydrological regimes of catchments has been commonly detected in the sub-basins in the QTP (Song et al., 2020) and typical basins in northwestern China (Niu et al., 2011; Li et al., 2016; Wang et al., 2018). Permafrost degradation has caused increases in the amount of ground ice meltwater, aquifer thicknesses, and the amount of surface water infiltration, which has impacted the movement patterns of the surface water and groundwater and enhanced the hydraulic exchange between the surface water and groundwater, further resulting in an important contribution to rive runoff (Kurylyk et al., 2014; Walvoord and Kurylyk, 2016). An increasing number of studies have suggested that the spatial trend in the lake changes in recent years has been closely related to the existence of permafrost and its accelerated degradation, which have contributed to the increase in lake volume in permafrost catchments (Zhang et al., 2017a; Liu et al., 2020).
In addition, intensive changes in cryospheric components and increases in climate extremes, especially accelerated glacier ablation and permafrost degradation, are playing increasingly significant roles in influencing the hydrological regimes and water resources in cold regions. Lake changes are one consequence of these influencing factors; and they may be related to the permafrost and glacier melting distribution rather than to a direct climatic mechanism such as increased precipitation. Many previous studies have extensively explored the lake variation across the endorheic basin on the QTP (Song et al., 2014; Yang et al., 2017; Yao et al., 2018; Liu et al., 2021) or focused on single large lakes (Qinghai Lake, Selin Co, Num Co) (Lei et al., 2013; Tang et al., 2018; Liu et al., 2022), but less research focuses on that on the northeast QTP. In fact, the northeastern QTP contains many lakes, and most of these lakes are distributed in the Yangtze River Basin (489 lakes, 38.29%), the Yellow River Basin (265 lakes, 20.75%), and the Qaidam Basin (164 lakes, 12.8%). Due to the large differences in the landforms, climate, hydrological conditions, and topography at the basin scale, as well as significant human interventions on lakes, especially lakes in the Qaidam Basin, the responses of the lake dynamics to climatic factors, glacier-snow melting, permafrost thawing, and water input from other lakes have been more complex. Therefore, a comprehensive analysis of many factors behind lake change for different geomorphologic units is necessary and of importance. In this study, the spatial-temporal trend of the lake area across the northeastern QTP between 1988 and 2019 was analyzed, and the potential driving factors were further explored. The results of this study provide a comprehensive understanding of the major mechanism controlling the lake dynamics.
The northeastern QTP (89°35′–103°04′N, 31°39′–39°19′E), the coverage of the whole Qinghai Province in this paper, has a total area of 72.23 × 10⁴ km2, a west-east length of 1,200 km, and a north-south width of 800 km. It is characterized by an alpine continental climate with a Mean Annual Air Temperature (MAAT) of −5.6°C to 8.6°C and a mean Annual Precipitation (AP) of 15–750 mm. The precipitation mainly occurs from May to September. As shown in Figure 1, the average elevation is 3,000 m above sea level (a.s.l.). The areas with elevations of <3,000 m a.s.l., 3,000–5,000 m a.s.l., and >5,000 m a.s.l. account for 26.3%, 67%, and 5% of the total area, respectively. The terrain is high in the southwest and low in the east. It is the source region of the Yangtze River, Yellow River, and Lancang River; so, it is also known as the river source region. There are 1,277 lakes with areas greater than 0.01 km2, with a total area of 14,370.2 km2, accounting for 1.99% of the total area of Qinghai Province (Pi et al., 2018). Qinghai Lake (99°37′–100°44′N, 36°33′–37°14′E) is the largest inland salt lake on the QTP, with a lake area of 4,165 km2, a surface elevation of 3,193 m, and a water volume of 71.6 km3 (Tang et al., 2018). It has a maximum length of 101 km, a width of 76 km, and a depth of 25.5 m. The annual river runoff in the region is 63.34 km3, accounting for 2.34% of the total annual river runoff in China. Modern glaciers have grown, covering an area of 5,225.38 km2 and having a glacial storage of 3,705.92 km3, accounting for 9.2% and 12.5% of the total glacier area and storage in China, respectively (Pi et al., 2018). Permafrost is widely distributed with coverage of 336,783 km2, its area accounts for 46.6% of the entire study region and 31.7% of the total permafrost area on the QTP, respectively. The permafrost temperature is low, with a lowest value of −13.58°C; and the permafrost thickness is large, with a maximum value of 139 m in the Qilian Mountains, which may provide the occurrence conditions and resource background for the formation of a large amount of natural gas hydrates. The region studied is classified as alpine meadow, alpine steppe, and alpine desert.
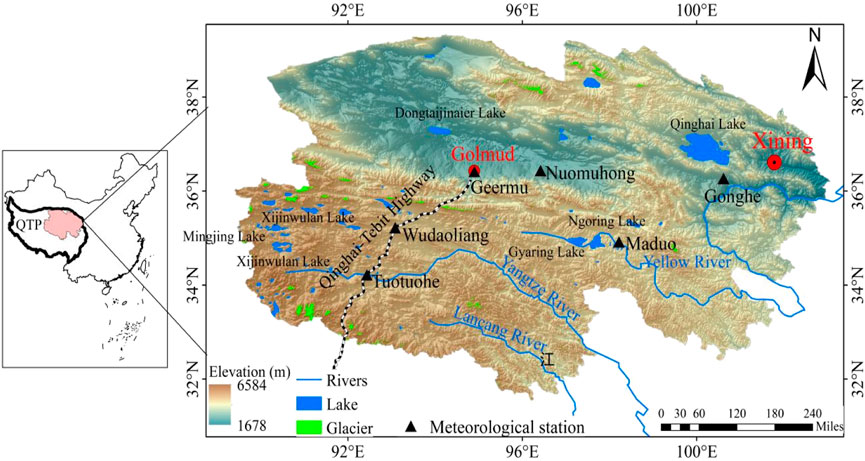
FIGURE 1. Schematic representation of the study area. The digital elevation model was obtained from the Advanced Spaceborne Thermal Emission and Reflection Radiometer (ASTER) Global Digital Elevation Model (GDEM) version 2.0, with a spatial resolution of 30 m; the glacier area shown is from the Second Glacier Inventory Dataset of China; the drainage networks and drainage basins were extracted from the HydroSHEDS dataset to calculate the glacier area in each basin; and the lake areas shown in 2019 are from this paper.
Landsat data (http://glovis.usgs.gov) are widely used to delineate lakes. Landsat Thematic Mapper (TM), Enhanced Thematic Mapper Plus (ETM+), and Operational Land Imager (OLI) images with no or small fractions of cloud coverage (<10%) were selected to extract the lake surface areas to create a continuous time series of the area changes from 1998 to 2019. All of these images had a 30 m spatial resolution and were acquired each October because the lake areas were relatively stable in October. The data window was also extended to September and November if insufficient data were available for October (Zhang et al., 2017b). Manual visual interpretation was used to delineate the lakes. The false color compositions of the raw Landsat images for each lake using the ENVI 5.3 software were processed to identify lake boundary (bands 5, 4, and 3 as red, green, and blue, respectively, for Landsat TM/ETM+ and bands 7, 6, and 5 for Landsat OLI), which satisfactorily distinguished the water areas from the non-water areas. Then, visual examination and manual editing of the lake boundaries based on false color compositions images (also called lake digitization) were conducted to delineate the lakes and the calculated geometry of lake boundary shapes were subsequently carried out in ArcGIS 10.2 software. The accuracy of the manual digitization was controlled within one pixel. All image data were projected into the UTM coordinate system Zone 45 using the WGS-84 geodetic datum.
The air temperature and precipitation recorded at the Wudaoliang (93.08°E, 35.21°N, 4,612 m a.s.l.), Tuotuohe (92.43°E, 34.21°N, 4,433 m a.s.l.), Maduo (98.21°E, 34.91°N, 4,272 m a.s.l.), Gonghe (100.61°E, 36.26°N, 2,835 m a.s.l.), Geermu (94.9°E, 36.41°N, 2,807 m a.s.l.), and Nuomuhong (96.41°E, 36.43°N, 2,790 m a.s.l.) meteorological stations, as well as the pan evaporation from a 20-cm pan by using a data set recorded at the Tuotuohe, Maduo, and Geermu meteorological stations on the QTP, were used to analyze the influences of the climatic condition on the lake changes. These climate data were provided by the National Meteorological Information Center (NMIC), China Meteorological Administration (CMA) (http://cdc.cma.gov.cn).
The glacier and permafrost data were used to analyze the influence of the cryosphere changes on the lake dynamics under the background of climate warming. The glacier areas (http://www.tpedatabase.cn/portal/Login.jsp) in 1980 and 2010 were extracted from the First Glacier Inventory of China (images taken during 1950–1980) and the Second Glacier Inventory of China (images taken during 2006–2010), respectively. The spatial distribution of the permafrost types, Mean Annual Ground Temperature (MAGT), and ground ice content over the study area, as well as the long-term averaged ALT along the Qinghai–Tibet Highway (available at http://www.crs.ac.cn/), were provided by the Cryosphere Research Station on the QTP, Chinese Academy of Sciences. The MAGT and ground ice content over the study region were extracted from the MAGT and ground ice content across the QTP calculated by Zhao and Sheng. (2019). The spatial distribution MAGT was modeled by using an improved Noah land surface model (LSM). The ground ice content was calculated by the formula:
The freezing and thawing depths were subsequently calculated using Stefan’s equation, as follows:
where Z is the depth of the frost or thaw (m), K is the appropriate frozen or thawed thermal conductivity (W·m−1°C−1),
Figure 2 shows the spatial-temporal changes in the areas of the lakes in the northeastern Tibetan Plateau from 1988 to 2019. Overall, the lakes experienced dramatic changes. Although the shrinkage of some of the lakes weakened, the regional lake area tended to increase. The areas of 75.7% of the lakes increased at rates of 0.01–16.03 km2/yr; and the areas of only 24.2% of the lakes decreased at rates of 0.01–3.52 km2/yr (Figure 2D). Specifically, this change trend exhibited three stages between 1988 and 2019. During 1988–2000, the lake area decreased sharply; and the areas of 54.5% of the lakes decreased slightly at rates of 0.01–2.27 km2/yr. In addition, the areas of 45.6% of the lakes increased at rates of 0.01–8.53 km2/yr (Figure 2A). However, after 2000, the lake area increased quickly. The areas of 75.7% of the lakes increased at rates of 0.01–20.74 km2/yr from 2000 to 2012 (Figure 2B), and the areas of 72.7% of the lakes increased at high rates of 0.01–32.80 km2/yr from 2012 to 2019 (Figure 2C). The prevailing lake expansion in this region since 2000 was also commonly observed for the inland lakes in the endorheic basin on the QTP and has been reported in many studies (Li et al., 2014; Song et al., 2014; Yang et al., 2017; Liu et al., 2021).
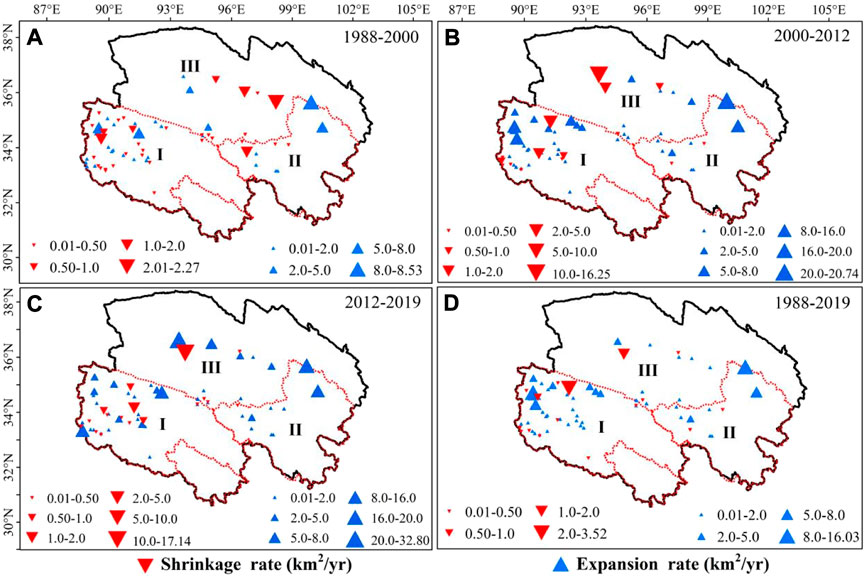
FIGURE 2. Spatial patterns of the trends in the lake area from (A) 1988 to 2000, (B) from 2000 to 2012, (C) from 2012 to 2019, and (D) from 1988 to 2019. The blue and red dots indicate lake expansion and lake shrinkage, respectively. The red line is the boundary of the drainage-basin of the river source region.
Figure 2 also shows the large spatial differences in the lake area changes in the three sub-regions (I–III). These large spatial differences in the lake area changes were observed during the same period. Generally, from 1988 to 2019, the most significant lake expansion occurred in sub-region I, which is the source region of the Yangtze River Basin (Figure 2D). In sub-region I, most of the lakes are mainly distributed in the northwestern part of the source region of the Yangtze River in the unpopulated, high-altitude area. The areas of most of the lakes exhibited an obvious decreasing trend during 1988–2000, an abrupt increasing trend during 2000–2012, and a relatively slow increasing trend during 2012–2019. Similar to sub-region I, most of the lakes in sub-regions II and III have increased since 2000, with significant area increases and rates. However, in sub-region II, which is the source region of the Yellow River and the Qinghai Lake Basin, the lakes exhibited sharper increases during 2012–2019 than during 2000–2012. In sub-region III, in the northern part of Qinghai Province (mainly the Qaidam Basin), the lake area shrunk dramatically before 2000, but it began to expand rapidly and substantially in 2012. There was a more rapid increasing trend during 2012–2019 than during 2000–2012. The lake expansion occurred in sub-region I about 12 years earlier than in sub-regions II and III. Compared with the results for the period before 2000 obtained by Huang et al. (2011), widespread decreases occurred in the abundance and areas of inland lakes in the entire source area of the Yellow River and the southeastern part of the source area of the Yangtze River, while the western and northern parts of the source area of the Yangtze River exhibited completely opposite trends. The spatial difference in the lake expansion and contraction in sub-region II was not fully reflected, which may be related to the delimitation of only the large lakes (>10 km2) and not the small lakes (<10 km2) in this study.
Seven typical expanding large-lakes with great area-increase from 1988 to 2019 in the three sub-regions were selected to present dramatic lake changes, and the annual area changes of these lakes are shown in Figure 3. Overall, in spite of the small lake areas in some years, the trends in the areas of the seven lakes were highly consistent with the overall trend in the lake area on the northeastern QTP, which decreased before 2000 and increased after 2000. In detail, during 1988–2019, Qinghai Lake experienced the greatest increase of 452.11 km2 at a rate of 15.96 km2/yr. The areas of the Xijinwulan Lake, the Wulanwula Lake, and the Mingjing Lake increased by 370.17 km2, 118.36 km2, and 125.09 km2, respectively, at rates of increase of 10.31 km2/yr, 5.46 km2/yr, and 4.70 km2/yr, respectively. The areas of these three lakes exhibited similar trends, and the changes occurred in three stages: decreasing during 1988–2000, sharply increasing during 2000–2012, and increasing since 2012. The areas of the Gyaring Lake and the Ngoring Lake increased by 43.58 km2 and 92.97 km2, respectively, at rates of 0.77 km2/yr and 2.27 km2/y, respectively. Their areas decreased obviously during 1988–1996, rapidly increased during 1996–2012, and slightly decreased during 2012–2019. In addition to increased precipitation, the expansion of the lakes’ surface areas was primarily due to the construction of a hydropower station near the outlet of the Ngoring Lake. The areas of the Dongtaijinaier Lake increased by a large amount (278.23 km2) but at a slow rate of 4.33 km2/yr. Its change trend was different from those of the other lakes, was mainly attributed to increasing imbalance between precipitation and evaporation, with Annual Evaporation (AE) of 3,560 mm and AP of 21.9 mm. The area change was W-shaped: decreasing during 1988–1996, increasing during 1996–2003, decreasing during 2003–2012, and decreasing more rapidly during 2012–2019. Similar to the Qinghai Lake, a sustainable expansion has occurred in recent years (since 2012). The Zonag, Kusai, Hedin Noel, and Yanhu lakes are independent inland lakes in the Hoh Xil region of the QTP. After the outburst of the Zonag Lake in September 2011, the flood waters flowed through the Kusai Lake and the HedinNoel Lake and eventually into the Yanhu Lake, leading to rapid shrinkage of the Zonag Lake and the continuous expansion of the Yanhu Lake. The temporal changes of the four lakes involved in this event were examined and discussed in detail by Liu et al. (2019).
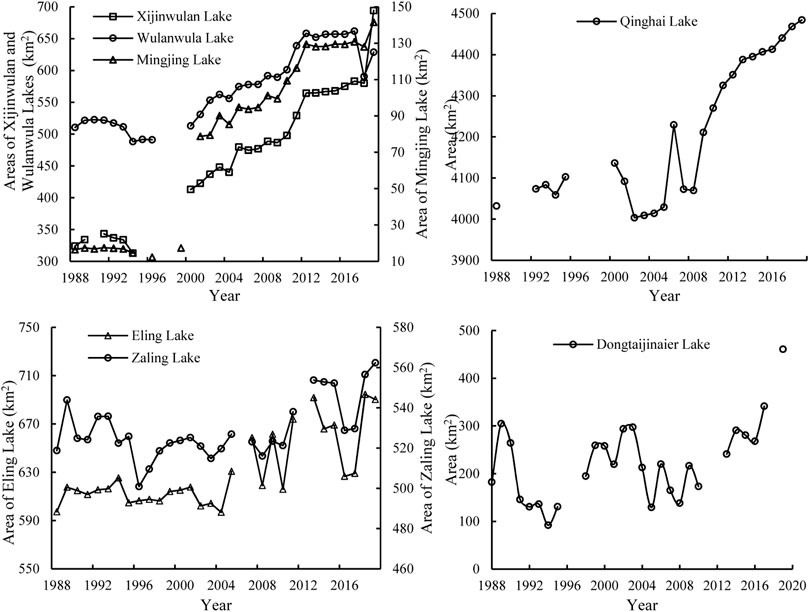
FIGURE 3. The annual area changes of seven typical lakes that expanded from 1988 to 2019.
Both the AP and MAAT recorded at the meteorological stations exhibited overall increasing trends, with rates of 2.37 mm/yr and 0.06°C/yr, respectively, from 1988 to 2018 (Figures 4A, 5A). The AE exhibited a decreasing trend (14.31 mm/yr) during the same period (Figure 6A). During the same period, the P/E (the ratio of annual precipitation to annual evaporation) tended to increase continuously (Figure 7A). The climate has exhibited a warming and wetting trend with significant accelerated increases in the MAAT, AP and P/E over the last 30 years. These climatic characteristics are consistent with the warming-wetting of the climate in most regions of the QTP in recent decades (Yang et al., 2011). In general, the AP and P/E decreased before 2000 but rapidly increased after 2000, which well explains the lake shrinkage during 1988–2000 and the lake expansion during 2000–2019 in the study area. The continuous decrease in the AE indicates an actual increase in potential evaporation, which suggests that the lake evaporation and the evaporation in the lake basin increased, theoretically exerting a positive effect on the lake water budget and contributing to the enhanced lake growth. However, it appears that the decrease in the AE was not significantly correlated with the change in the lake area. Under the continuous decrease in the AE, the lake area significantly decreased before 2000 and significantly increased after 2012.
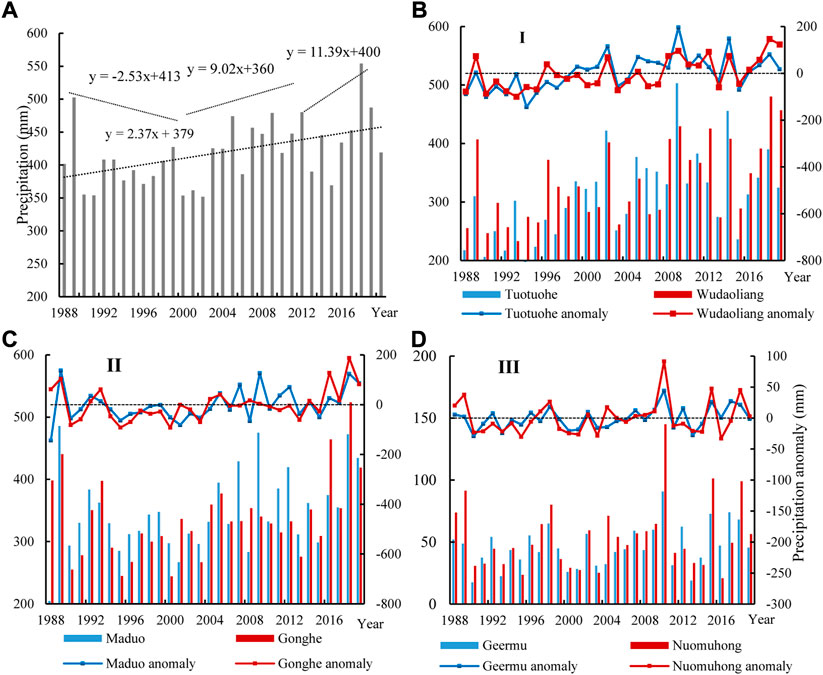
FIGURE 4. The changes in the average values of annual precipitation for the meteorological stations (A) and the annual precipitation recorded at meteorological stations in the three sub-regions from 1988 to 2019 (B–D).
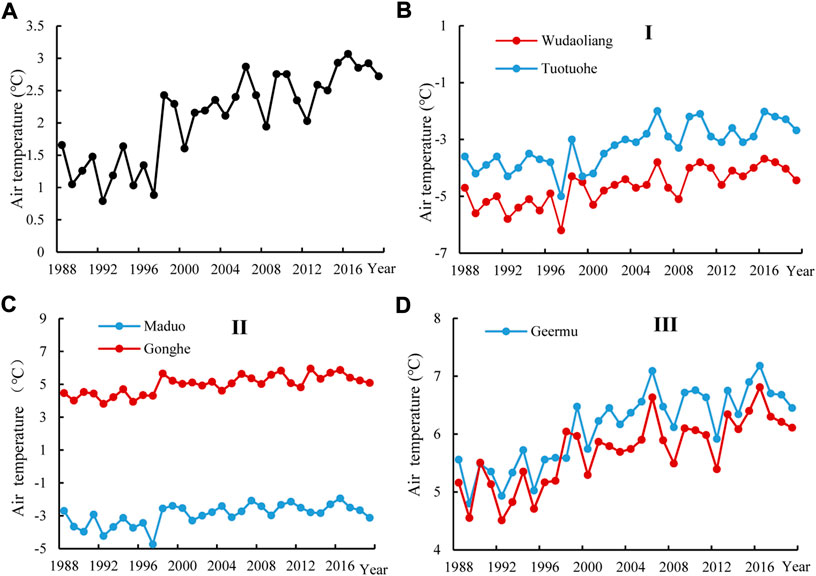
FIGURE 5. The changes in the average values of mean annual air temperature for the meteorological stations (A) and the mean annual air temperature recorded at meteorological stations in the three sub-regions from 1988 to 2019 (B–D).
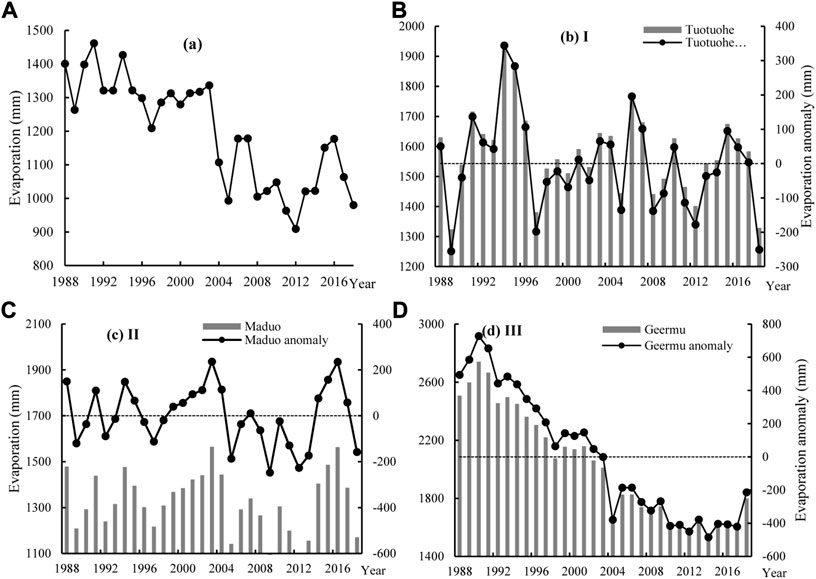
FIGURE 6. The changes in the average values of annual evaporation for the meteorological stations (A) and the annual evaporation recorded at meteorological stations in the three sub-regions from 1988 to 2019 (B–D).
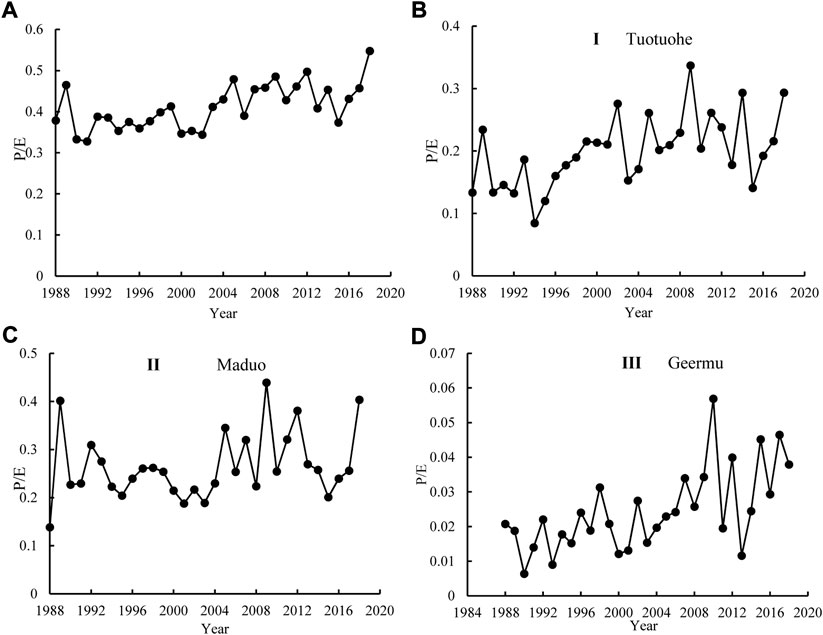
FIGURE 7. The changes in the average values of the P/E for the meteorological stations (A) and the P/E based on annual precipitation and evaporation recorded at meteorological stations in the three sub-regions from 1988 to 2019 (B–D).
More importantly, the large spatial variations in the AP, MAAT, and AE resulted in a regional discrepancy in the lake area changes. In sub-region I, the lake area responded well to the decrease in the AP and increase in the AE as reducing MAAT during 1988–2000, the significant increase in the AP and decrease in the AE during 2000–2012, and the increase in the AP during 2012–2019 (Figures 4B2212;Figures 6B). Slightly different from that in sub-region I, the lakes in sub-region II expanded more rapidly during 2012–2019 in response to the most significant increase in the AP, in spite of no obvious trend in the AE and MAAT (Figures 4C2212;Figures 6C). Most of the lakes in sub-region III have expanded before 2012 was mainly attributed to significant increase in the AP (0.47 mm/yr) and sharp rising MAAT (0.04–0.05°C/yr), in spite of the decreasing AE (−39.69 mm/yr) (Figures 4D2212;Figures 6D). Since 2012, the accelerated lake expansion was mainly caused by climate change and human activities, such as water consumption in the catchment, blocking rivers and lakes connection around the lake, brine mining utilization, constructions of solar ponds. What’s more, a strong positive relationship between lake area change and precipitation increase was observed; lake area increases more than 0.5 km2/yr agrees fairly well with precipitation increase rates (R2=0.18, p<0.05). These results suggest that the expansion of most of the lakes in the study area was more closely related to the changes in the AP than the changes in the AE, and precipitation was the primary factor influencing the lake area changes. The good correlation between the regional precipitation and the changes in the areas of the lakes in the study area, as well as over the entire QTP, has also been confirmed by other researchers (Li et al., 2010; Huang et al., 2011; Duan et al., 2015).
The total glacier area in Qinghai Province was 5,381.56 km2 in 1980 and 4,464.93 km2 in 2010, i.e., a significant decrease of 916.62 km2 (17.03%). The spatial variation in the glacier area differed obviously in the sub-regions of Qinghai Province. The glacier area in sub-region II decreased the most (22%), followed by that in sub-region III (19%) (Figure 8). The glacier area in sub-region I decreased relatively little (14%). This spatial pattern of the change in the glacier area did not agree well with the spatial pattern of the lake area changes in the three sub-regions due to the presence of glacier-fed lakes and non glacier-fed lakes, as well as the different responses of the glacier-fed lakes to the regional glacial meltwater. In sub-region I, only four large lakes (Lexiewudan Lake, Kekexili Lake, Xijinwulan Lake and Wulanwula Lake) that expanded were glacier-fed lakes, which were fed by the Malan Glacier and the Hantaishan Glacier, respectively, with accelerated area decreases of 6.04% and 5.4%, respectively, from 1973 to 2010 (Jiang et al., 2012). The Xijinwulan Lake and Wulanwula Lake, the glacier-fed lakes, glacier areas in basins greatly decrease by 58.492 km2 (39.7%) and 23.193 km2 (48.8%) from 1988 to 2019, but the Mingjing Lake, the non-glacier-fed lakes, its area change exhibited same trends as theses two lakes. This was not consistent with the significant lake expansion, and this further suggests that glacial meltwater was not the replenishment source of most of the lakes in the source area of the Yangtze River. Similarly, in sub-regions II and III, although significant glacier retreat occurred, all of the lakes were non-glacier-fed lakes, except for the Qinghai Lake. In spite of large glacier shrinkage in the Qinghai Lake basin, i.e., a decrease of 19.191 km2 (29.12%), the recharge from the glacier meltwater was small (5 × 10⁶ m3/yr), contributing <2% of the water supply and a small increase in the lake volume (297.67 × 10⁶ m3/yr). This suggests that the glacier melting caused by the rising temperature contributed little to the recent lake expansion in this region, and it was not the dominant driving factor of the recent lake expansion in Qinghai Province.
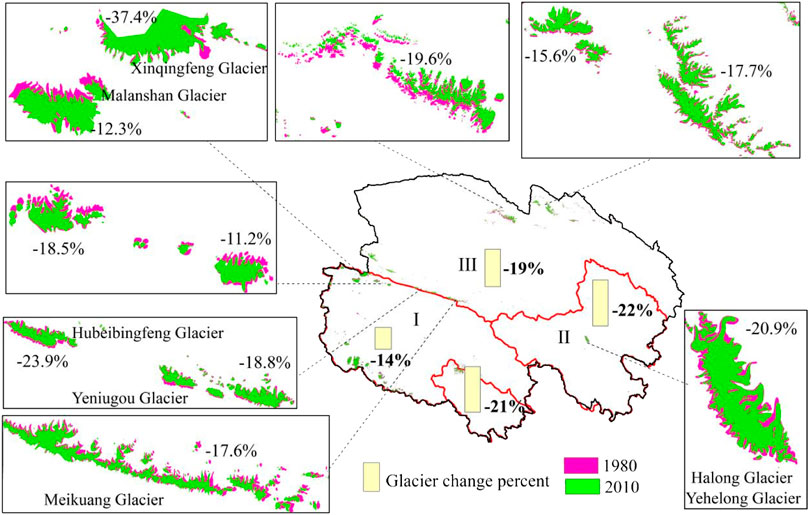
FIGURE 8. The changes in the total glacier area in the different sub-regions.
The study area has a total permafrost area of 0.336 × 10⁶ km2, accounting for approximately 31.7% of the total permafrost area on the QTP. The total volume of ground ice in the permafrost is 4,142 km3, with contents of 2.0–185.8 km3, accounting for 32.6% of the total ground ice content in the QTP. The permafrost in the study area was mainly distributed in sub-region I (the hinterland of continuous permafrost on the QTP), followed by sub-region II (the eastern boundary of continuous permafrost on the QTP). 81.3% of the total expanding lakes were distributed in continuous permafrost region, and the area increased by 1,673.85 km2, accounting for 74.3% of the total area increase. A dramatic lake expansion was observed in the continuous permafrost region, which has exhibited large spatial differences. (Figure 9A). The spatial pattern of the lake expansion in the continuous permafrost region agreed well with the spatial patterns of the MAGT and the ground ice content of the continuous permafrost. The lakes in the continuous permafrost region with a large amount of ground ice and a low MAGT expanded significantly, whereas the lakes in the continuous permafrost with little ground ice and a high MAGT only expanded slightly (Figures 9B,C). The statistical result showed that 79.5% of the total expanding lakes and even all lakes with increase rate larger than 5 km2/yr in continuous permafrost region distributed in cold permafrost (MAGT<−1.5°C) with high-ground ice content (>10×106 m3). This is also supported by the fact that the permafrost characteristics and degradation trends were closely related to the lake changes in the endorheic basin in the QTP (Liu et al., 2020). The lake expansion in the continuous permafrost region was mainly due to the presence of ice-rich permafrost with a high permafrost coverage, which acted as a barrier layer due to its low hydraulic conductivity and permeability. This layer impeded the infiltration of liquid water and the interaction between the surface water and groundwater, which finally resulted in more direct surface runoff of both rain and snow-melt and the lack of a water storage buffer effect compared to the non-permafrost regions. This was followed by the melting of the ground ice in the shallow permafrost due to the accelerated permafrost degradation, which was a significant potential source in the water balance of the lakes in this cold region.
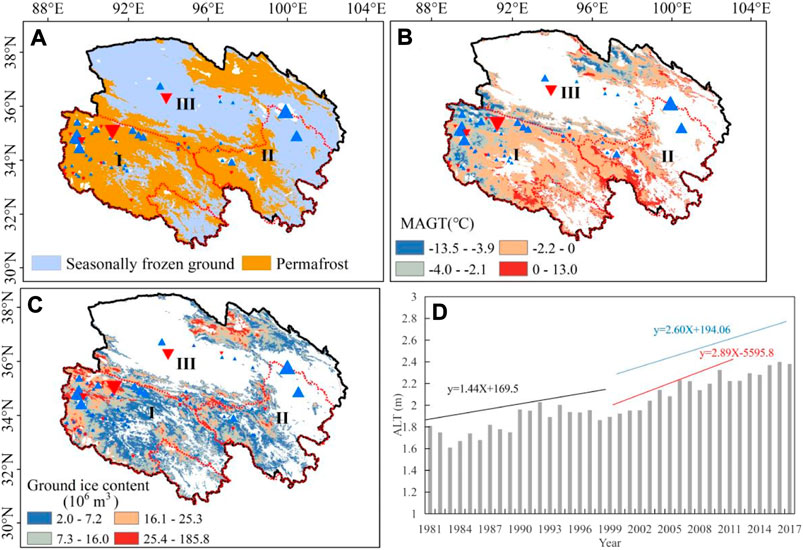
FIGURE 9. (A) The permafrost distribution; (B–C) the spatial patterns of the mean annual ground temperature and the ground ice content of permafrost, respectively; (D) the annual change in the active layer thickness from 1981 to 2017 along the Qinghai–Tibet Highway.
The permafrost was significantly degraded in the continuous permafrost region, as well as on the QTP, due to the increase in temperature in recent decades. Long-term monitoring data collected along the Qinghai–Tibet Highway reveal that the average ALT increased from 181 cm in 1981 to 238 cm in 2017 at a rate of 1.90 cm/yr. Notably, an accelerated increase has been observed since 2000. The rate of increase during 2000–2017 (2.60 cm/yr) was higher than that during 1981–2000 (1.44 cm/yr). Specifically, the rate during 2000–2012 (2.89 cm/yr) was higher during 2012–2019 (2.29 cm/yr) (Figure 9D), which is consistent with the more rapid lake expansion during 2000–2012 than during 2012–2019 in sub-region I. The calculated thawing index and ALT of the permafrost in the source area of the Yellow River Basin also exhibited increasing trends, with rates of 7.50°Cd/yr and 0.13 m/yr, respectively (Figure 10). Due to the permafrost degradation, the larger amount of meltwater from the ground ice due to permafrost degradation was a major supply of water for the lake growth. In addition, as the ground ice began to melt, the permeability of the soil increased and the hydraulic exchange between the surface water and the suprapermafrost groundwater was enhanced. Thus, aquifer activation arising from permafrost degradation may have increased the recharge and groundwater discharge to the rivers and lakes, further accelerating the lake expansion. Thus, the permafrost degradation may have partially contributed to the increase in the lake surface area in the study area, especially in sub-region I.
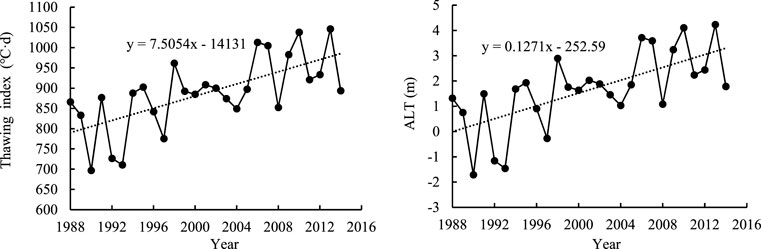
FIGURE 10. The annual changes in the thawing index and active layer thickness of the permafrost from 1988 to 2014 in the source region of the Yellow River Basin.
Moreover, the analysis of infuential factors in basins for several typical lakes showed that lake changes were mostly related to AP. The Xijinwulan Lake and Wulanwula Lake, the glacier-fed lakes with large decrease in glacier area, presented same area-change trends as the Mingjign Lake, which was consistent with the decrease in the AP and increase in the AE during 1988–2000, the significant increase in the AP and decrease in the AE during 2000–2012, and the increase in the AP in spite of slight decreasing AE during 2012–2019 recorded at Tuotuohe meteorological station. Similar to the Gyaring Lake and Ngoring Lake, the area-change trends also showed well corresponding response to AP. For the Qinghai Lake, with little contribution of glacial meltwater to water budget, its sustainable expansion, especially in recent years (since 2012) showed closer covariation with significant increasing AP (226 mm/yr) and MAAT (0.03°C/yr) than with slight decreasing AE (−0.98 mm/yr) from 1988 to 2019 recorded at Gangcha meteorological station.
The source region of the Yellow River is underlain by seasonally frozen ground, as well as continuous, discontinuous, and sporadic permafrost in the northeastern QTP. Since the 1980s, significant regional permafrost degradation due to warming has occurred, along with decreased permafrost area, decreased permafrost thickness, and expansion of taliks. The lower limit of the permafrost has risen by 50–80 m. The average maximum depth of the frost penetration has decreased by 12 cm in the areas of seasonally frozen ground (Jin et al., 2010). The maximum frozen soil depth decreased from 3.2 m in 1980 to 2.8 m in 2000 and further decreased to 2.4 m in 2008. The temperature at the depth of the zero annual amplitude of the permafrost increased by 0.03–0.20°C during 2010–2017 (Luo et al., 2020). Thermokarst ponds (ground subsidence induced by the degradation of ice-rich permafrost causes the formation of thermokarst lakes) (French, 1974), which are a significant sign of local permafrost degradation, are the most widespread evidence of accelerating permafrost thawing in the source region of the Yellow River. There are a variety of thermokarst ponds dotting the predominantly continuous permafrost region. There are 477,518 thermokarst lakes in the permafrost region in 2021 with a total area of 190.22×10⁶ m2. Water bodies consisting of lakes, thermokarst ponds, and depressions are widely distributed in this region and occasionally form clusters of ponds in the same geographical unit. Adjacent thermokarst ponds and depressions are sometimes interconnected by ditches and troughs, indicating the melting of ground ice in the permafrost table.
Moreover, due to the thawing of discontinuous permafrost under the present climate and warmer climate conditions, the evolution of the hydrogeological conditions also dramatically affects the lake dynamics. Although most of the lakes in the source region of the Yellow River are still distributed in the continuous permafrost region, these lakes may still shrink or disappear when the permafrost in the lake region and its surrounding area undergoes a transition from continuous to discontinuous-isolated permafrost, and some isolated permafrost areas may have already been converted to seasonally frozen ground. Further intensified permafrost degradation will lead to thinning and eventual breakage of the permafrost beneath the lakes, greatly facilitating their drainage into the subsurface zone via taliks (Smith et al., 2005). Newly formed open taliks can facilitate groundwater movement into subpermafrost aquifers at lower heads and can thereby drain lakes, leading to decreased groundwater levels and lake shrinkage. The phenomenon of significant lake expansion in the continuous permafrost region is in sharp contrast to the lake shrinkage in the island-discontinuous permafrost region that is widespread throughout the endorheic basin in the QTP (Liu et al., 2020) and the Mongolian Plateau (Zhou et al., 2019). Lake shrinkage has become a common feature in the island-discontinuous permafrost region, especially, the shrinkage or disappearance of thermokarst lakes in the discontinuous permafrost region in the Arctic and in subarctic regions (Yoshikawa and Hinzman, 2003). This phenomenon was well described by Smith et al. (2005) and Riordan et al., 2015: initial permafrost warming led to the development of thermokarst lakes and lake expansion, followed by lake drainage as the permafrost degraded further.
In addition, the groundwater in the island-discontinuous permafrost region and the adjacent area became connected and was mutually transformed. The increased recharge and discharge supplied the groundwater in the adjacent regions at low heads with a low elevation through taliks (activated aquifers), which caused lake expansion instead. Thus, the coexistence of lake expansion and shrinkages in one geographic unit in this region, and even over the entire QTP, will occur and become a common feature of the permafrost region. This is manifested as the broad geographic pattern, in which permanently drained lakes are commonly found alongside unchanged neighboring lakes. In the island-discontinuous permafrost region, Southern Seling Co has expanded, while in the continuous permafrost boundary, Northern Seling Co has expanded (Liu et al., 2022). Lake expansion in the continuous permafrost region and losses where the permafrost is thinner and less contiguous have been observed in Siberia (Smith et al., 2005). This also suggests a spatially patchy process, rather than a direct climatic mechanism such as increased precipitation and decreased evaporation.
Even though regional climate conditions were the main drivers of the dynamic changes of the lakes, recent research has also revealed that the lakes have had an important influence on the local temperature and precipitation and are also regulators of the regional climate. The lakes are strong heat sinks in the daytime and heat sources at night in summer, and they are weak heat sinks in the daytime and strong heat sources at night in autumn (Dai et al., 2020). After the outburst of the Zonag Lake on 14 September 2011, the influences of this event on the permafrost surrounding it and the permafrost surrounding the Yanhu Lake were investigated. Observations revealed that new permafrost had formed in the exposed lake bottom, accompanied by various periglacial landscapes. The permafrost aggradation in the exposed bottom of the lake was rapid, and the permafrost base reached 4.9, 5.4, and 5.7 m in the first 3 years. The simulated results indicate that the permafrost in the exposed lake bottom is likely to continue to develop, quickly at first and then slowly (Zhang et al., 2022). In contrast, the continuous expansion of the Yanhu Lake significantly accelerated the degradation of the surrounding permafrost. It resulted in the obvious thermal disturbance of the underlying permafrost and lateral thermal erosion of the surrounding permafrost. Such degradation may have been due to the thermal alteration of the thawing-freezing cycle of the permafrost and the melting of the ground ice, along with the resulting changes in the hydrological connectivity and soil permeability (Lu et al., 2020).
The permafrost hydrological processes on the QTP are complex, and they affect soil water movement, rainfall-runoff, base flow, and evaporation (Gao et al., 2021). Although several in situ observation stations have been established to gather long-term measurements, given the vast area of the QTP, the permafrost hydrology research in this region remains far from adequate. Due to the different scales of the permafrost coverage, the thermal conditions and the amount of ground ice melting in the different watersheds in the study area, and the different changes in the streamflow characteristics, it is difficult to determine the specific contribution of the permafrost degradation to the lake changes in each lake basin, as well as those of the glacier ablation and climate factors. Therefore, permafrost hydrological modeling is a powerful tool for quantifying the effects of the spatiotemporal variations in the permafrost on the basin-scale hydrology because it can incorporate landscape and topographical data in order to sufficiently represent the horizontal heterogeneities. There are some developing hydrological models which considers both snow and frozen ground processes describe interactions between cryosphere, hydrosphere, biosphere, and atmosphere. These model have been applied in many river basins in cold regions and performed very well. The HydroSiB2-SF model coupled snow and frozen ground physics was developed based on a hydrologically improved land surface model (HydroSiB2), and indicated good performance at two typical sites on the QTP (Zhou et al., 2015; Wang et al., 2017). Based on the Water and Energy Budget-based Distributed Hydrological Model (WEB-DHM), the WEB-DHM-SF model incorporating both three-layer snow and frozen ground physics successfully reproduced the basin-wide daytime and nighttime land surface temperature as well as snow depth in basin-averaged time series and spatial distributions at the upper Yangtze River Basin under widespread snow cover and frozen ground (Qi et al., 2019). The cryosphere-hydrology-lake-dam model was recently used to quantify the different contributors to the rising water levels at Lake Yanhu. This well-performing model reproduce the volume of Lake Zonag satisfactorily, with an RMSE (root mean square error) of 0.012–0.062 km3, which can well used for reproduce the following simulations and predictions of lake change (Wang et al., 2022). Determining the balance point between model simplicity and catchment complexity is likely one of the most important scientific challenges yet to be resolved in permafrost hydrological modeling on the QTP, which will be investigated in our next study.
Overall, from 1988 to 2019, the lakes in the northeastern Tibetan Plateau experienced rapid expansion. The total area of 75.7% of the lakes increased at rates of 0.01–16.03 km2/y. In detail, the lake area generally decreased during 1988–2000, quickly increased during 2000–2012, and rapidly increased from 2012 to 2019. Large spatial differences in the lake area changes were observed in the three sub-regions, and the most significant lake expansion occurred in sub-region I. In sub-region I, the lake area significantly decreased during 1988–2000, quickly increased during 2000–2012, and slowly increased during 2012–2019. Similarly, most of the lakes in sub-regions II and III have continued to increase since 2000, with significant lake area increases and rates of increase. The lakes in sub-region II exhibited sharper increasing trends during 2012–2019 than during 2000–2012. In sub-region III, the lakes shrank dramatically before 2000 but have expanded rapidly and substantially since 2012. There was a sharper increasing trend during 2012–2019 than during 2000–2012. The lake expansion occurred in sub-region I about 12 years earlier than in sub-regions II and III.
The AP decreased before 2000 but rapidly increased after 2000, which explains the lake shrinkage during 1988–2000 and the lake expansion since 2000 in the study area. The expansion of most of the lakes in the study area was closely related to the AP, and precipitation was the primary factor influencing the lake area changes. Although significant glacier retreat occurred, most of the lakes in the sub-regions were non-glacier-fed lakes. This is inconsistent with the significant lake expansion, further suggesting that glacial meltwater was not the replenishment source of most of the lakes in the study area. An accelerated increase in the ALT has occurred since 2000. The increase rate was higher during 2000–2017 (2.60 cm/yr) than during 1981–2000 (1.44 cm/yr). Specifically, the rate was higher during 2000–2012 (2.89 cm/yr), which is consistent with the more rapid lake expansion during 2000–2012 than during 2012–2019 in sub-region I. Permafrost degradation further intensified the lake expansion.
The raw data supporting the conclusions of this article will be made available by the authors, without undue reservation.
Conceptualization and writing (original draft) for WL and QL, supervision and editing for HL and CX, data curation for ZZ, QZ, QHZ, methodology and software for GZ.
This study was supported by the Natural Science Foundation of Qinghai Province, China (No. 2021-ZJ-940Q). Significant thanks to all author for their contributions; conceptualization and writing (original draft) for WL and QL, supervision and editing for HL and CX, data curation for ZZ, QZ, QHZ, methodology and software for GZ.
Special thanks to all the staff of the Cryosphere Research Station on the Qinghai-Tibet Plateau, Chinese Academy of Sciences for their hard work in obtaining field permafrost data.
The authors declare that the research was conducted in the absence of any commercial or financial relationships that could be construed as a potential conflict of interest.
All claims expressed in this article are solely those of the authors and do not necessarily represent those of their affiliated organizations, or those of the publisher, the editors and the reviewers. Any product that may be evaluated in this article, or claim that may be made by its manufacturer, is not guaranteed or endorsed by the publisher.
Bolch, T., Yao, T. D., Kang, S. C., Buchroithner, M. F., Scherer, D., Maussion, F., et al. (2010). A Glacier Inventory for the Western nyainqentanglha range and the nam Co basin, tibet, and glacier changes 1976-2009. Cryosphere 4 (3), 419–433. doi:10.5194/tc-4-419-2010
Cheng, G. D., Zhao, L., Li, R., Wu, X. D., Sheng, Y., Hu, G. J., et al. (2019). Characteristic, changes and impacts of permafrost on Qinghai-Tibet Plateau. Chin. Sci. Bull. 64, 2783–2795. doi:10.1360/tb-2019-0191
Cheng, J., Song, C. Q., Liu, K., Ke, L. H., Chen, T., and Fan, C. Y. (2021). Regional assessment of the potential risks of rapid lake expansion impacting on the Tibetan human living environment. Environ. Earth Sci. 80 (4), 166. doi:10.1007/s12665-021-09470-4
Dai, Y., Yao, T., Wang, L., Li, X., and Zhang, X. (2020). Contrasting Roles of a large alpine lake on Tibetan Plateau in shaping regional precipitation during Summer and Autumn. Front. Earth Sci. 8, 358. doi:10.3389/feart.2020.00358
Ding, Y. J., Mu, C. C., Wu, T. H., Hu, G. J., Zou, D. F., Wang, D., et al. (2021). Increasing cryospheric hazards in a warming climate. Earth. Sci. Rev. 213, 103500. doi:10.1016/j.earscirev.2020.103500
Duan, A. M., and Xiao, Z. X. (2015). Does the climate warming hiatus exist over the Tibetan Plateau? Sci. Rep. 5, 13711. doi:10.1038/srep13711
Duan, S. Q., Fan, S. X., Cao, G. C., Liu, X. S., and Sun, Y. S. (2015). The changing features and cause analysis of the lakes in the source regions of the Yellow River from 1976 to 2014. J. Glaciol. Geocryol. 37 (3), 745–756.
French, H. M. (1974). Active thermokarst processes, eastern banks island, western Canadian arctic. Can. J. Earth Sci. 11, 785–794. doi:10.1139/e74-078
Gao, H. K., Wang, J. J., Yang, Y. Z., Pan, X. C., Ding, Y. J., and Duan, Z. (2021). Permafrost hydrology of the Qinghai-Tibet Plateau: A review of processes and modeling. Front. Earth Sci. 8, 576838. doi:10.3389/feart.2020.576838
Huang, L., Liu, J. Y., Shao, Q. Q., and Liu, R. G. (2011). Changing inland lakes responding to climate warming in Northeastern Tibetan Plateau. Clim. Change 109, 479–502. doi:10.1007/s10584-011-0032-x
Jiang, S., Yang, T. B., and Tian, H. Z. (2012). Glacier shrinkage and its dependence on climate in the Malan Mountain in the past 40 years based on RS and GIS. J. Glaciol. Geocryol. 34 (3), 522–529.
Jin, H. J., Wang, S. L., lv, L. Z., He, R. X., Chang, X. L., and Luo, D. L. (2010). Features and degradation of frozen ground in the sources area of the Yellow River, China. J. Glaciol. Geocryol. 32 (1), 10–17.
Kurylyk, B. L., MacQuarrie, K. B., and McKenzie, J. M. (2014). Climate change impacts on groundwater and soil temperatures in cold and temperate regions: Implications, mathematical theory, and emerging simulation tools. Earth. Sci. Rev. 138, 313–334. doi:10.1016/j.earscirev.2014.06.006
Lei, Y. B., Yao, T. D., Bird, B. W., Yang, K., Zhai, J. Q., and Sheng, Y. W. (2013). Coherent lake growth on the central Tibetan plateau since the 1970s: Characterization and attribution. J. Hydrol. X. 483, 61–67. doi:10.1016/j.jhydrol.2013.01.003
Li, H., Xiao, P. F., Feng, X. Z., Wan, W., Ma, R. H., and Duan, H. T. (2010). Lake changes in spatial evolution and area in source region of Three Rivers in recent 30 years. J. Lake .Sci. 22 (6), 862–873. doi:10.18307/2010.0608
Li, R., Zhao, L., Ding, Y. J., Wu, T. H., Xiao, Y., Du, E. J., et al. (2012). Temporal and spatial variations of the active layer along the Qinghai-Tibet Highway in a permafrost region. Chin. Sci. Bull. 57, 4609–4616. doi:10.1007/s11434-012-5323-8
Li, Y. K., Liao, J. G., Guo, H. D., Liu, Z. W., and Shen, G. Z. (2014). Patterns and potential drivers of dramatic changes in Tibetan lakes, 1972-2010. PLoS ONE 9, e111890. doi:10.1371/journal.pone.0111890
Li, Z. X., Feng, Q., Wang, Q. J., Yong, S., Cheng, A. F., and Li, J. G. (2016). Contribution from frozen soil meltwater to runoff in an in-land river basin under water scarcity by isotopic tracing in northwestern China. Glob. Planet. Change 136, 41–51. doi:10.1016/j.gloplacha.2015.12.002
Liu, G. Y., Zhao, L., Xie, C. W., Pang, Q. Q., Du, E. J., and Qiao, Y. P. (2016). Variation characteristics and impact factors of the depth of zero annual amplitude of ground temperature in permafrost regions on the Tibetan Plateau. J. Glaciol. Geocryol. 38, 1189–1200. doi:10.7522/j.issn.1000-0240.2016.0139
Liu, W. H., Liu, H. R., Xie, C. W., Zhao, J. Y., Liu, G. Y., Wang, W., et al. (2022). Dynamic changes in lakes and potential drivers within the Selin Co basin, Tibetan Plateau. Environ. Earth Sci. 81, 84. doi:10.1007/s12665-021-10155-1
Liu, W. H., Xie, C. W., Wang, W., Yang, G. Q., Zhang, Y. X., Wu, T. H., et al. (2020). The impact of permafrost degradation on lake changes in the endorheic basin on the Qinghai–Tibet Plateau. Water 12, 1287. doi:10.3390/w12051287
Liu, W. H., Xie, C. W., Zhao, L., Li, R., Liu, G. Y., Wang, W., et al. (2021). Rapid expansion of lakes in the endorheic basin on the Qinghai-Tibet Plateau since 2000 and its potential drivers. Catena 197, 104942. doi:10.1016/j.catena.2020.104942
Liu, W. H., Xie, C. W., Zhao, L., Wu, T. H., Wang, W., Zhang, Y. X., et al. (2019). Dynamic changes in lakes in the Hoh Xil region before and after the 2011 outburst of Zonag Lake. J. Mt. Sci. 16, 1098–1110. doi:10.1007/s11629-018-5085-0
Lu, P., Han, J. P., Li, Z. S., Xu, R. G., Li, R. X., Hao, T., et al. (2020). Lake outburst accelerated permafrost degradation on Qinghai-Tibet Plateau. Remote Sens. Environ. 249, 112011. doi:10.1016/j.rse.2020.112011
Luo, D. L., Jin, H. J., Du, H. Q., Li, C., Ma, Q., Duan, S. Q., et al. (2020). Variation of alpine lakes from 1986 to 2019 in the headwater area of the Yellow River, Tibetan plateau using google Earth engine. Adv. Clim. Change Res. 11 (1), 11–21. doi:10.1016/j.accre.2020.05.007
Niu, L., Ye, B. S., Li, J., and Sheng, Y. (2011). Effect of permafrost degradation on hydrological processes in typical basins with various permafrost coverage in Western China. Sci. China Earth Sci. 54, 615–624. doi:10.1007/s11430-010-4073-1
Phan, V. H., Lindenbergh, R. C., and Menenti, M. (2013). Geometric dependency of Tibetan lakes on glacial runoff. Hydrol. Earth Syst. Sci. 17, 4061–4077. doi:10.5194/hess-17-4061-2013
Pi, Y. N., Liu, S. Y., Li, Z. R., Xin, R. F., and Zhang, X. (2018). Remote-sensing survey and dynamic change analysis on lakes in Qinghai Province based on GF-1 and Landsat satellite data. J. Ningxia Univ. Nat. Sci. Ed. 39, 170–176.
Qi, J., Wang, L., Zhou, J., Song, L., Li, X. P., Zeng, T., et al. (2019). Coupled snow and frozen ground physics improves cold region hydrological simulations: An evaluation at the upper Yangtze River basin (Tibetan plateau). JGR. Atmos. 124, 12985–13004. doi:10.1029/2019JD031622
Riordan, B., Verbyla, D., and Mcguire, A. D. (2015). Shrinking ponds in subarctic Alaska based on 1950-2002 remotely sensed images. J. Geophys. Res. 111 (G4), 277–305. doi:10.1029/2005JG000150
Smith, L. C., Sheng, Y., Macdonald, G. M., and Hinzman, L. D. (2005). Disappearing arctic lakes. Science 308, 1429. doi:10.1126/science.1108142
Song, C. L., Wang, G. X., Mao, T. X., Dai, J. C., and Yang, D. Q. (2020). Linkage between permafrost distribution and river runoff changes across the Arctic and the Tibetan Plateau. Sci. China Earth Sci. 63, 292–302. doi:10.1007/s11430-018-9383-6
Song, C. Q., Huang, B., Richards, K., Ke, L. H., and Phan, V. (2014). accelerated lake expansion on the Tibetan plateau in the 2000s: Induced by glacial melting or other processes? Water Resour. Res. 50, 3170–3186. doi:10.1002/2013WR014724
Song, C. Q., and Sheng, Y. W. (2016). Contrasting evolution patterns between glacier-fed and non-glacier-fed lakes in the Tanggula Mountains and climate cause analysis. Clim. Change 135, 493–507. doi:10.1007/s10584-015-1578-9
Tang, L. Y., Duan, X. F., Kong, F. J., Zhang, F., Zheng, Y. F., Li, Z., et al. (2018). Influences of climate change on area variation of Qinghai Lake on Qinghai-Tibetan plateau since 1980s fluences of climate change on area variation of Qinghai Lake on Qinghai-Tibetan plateau since1980s. Sci. Rep. 8, 7331. doi:10.1038/s41598-018-25683-3
Walvoord, M. A., and Kurylyk, B. L. (2016). Hydrologic impacts of thawing permafrost-a review. Vadose Zone J. 15, 1–20. doi:10.2136/vzj2016.01.0010
Wang, L., Liu, H., Zhong, X. Y., Zhou, J., Zhu, L. P., Yao, T. D., et al. (2022). Domino effect of a natural cascade alpine lake system on the Third Pole. PNAS Nexus 1, 1–9. doi:10.1093/pnasnexus/pgac053
Wang, L., Song, C. Q., Conradt, T., Rasmy, M., and Li, X. P. (2021). Editorial: Climatic and associated cryospheric and hydrospheric changes on the third Pole. Front. Earth Sci. 8, 638371. doi:10.3389/feart.2020.638371
Wang, L., Zhou, J., Qi, J., Sun, L. T., Yang, K., Tian, L. D., et al. (2017). Development of a land surface model with coupled snow and frozen soil physics. Water Resour. Res. 53, 5085–5103. doi:10.1002/2017WR020451
Wang, X. Q., Chen, R. S., Han, C. T., Yang, Y., Liu, J. F., Liu, Z. W., et al. (2018). Changes in river discharge in typical mountain permafrost catchments, northwestern China. Quat. Int. 519, 32–41. doi:10.1016/j.quaint.2018.11.010
Wu, Q. B., Zhang, T. J., and Liu, Y. Z. (2010). Permafrost temperatures and thickness on the Qinghai-Tibet Plateau. Glob. Planet. Change 72 (1-2), 32–38. doi:10.1016/j.gloplacha.2010.03.001
Xie, C. W., William A, G., Zhao, L., Wu, T. H., and Liu, W. H. (2015). Temperature-dependent adjustments of the permafrost thermal profiles on the Qinghai-Tibet Plateau, China. Arct. Antarct. Alp. Res. 47, 719–728. doi:10.1657/AAAR00C-13-128
Yang, K., Ye, B. S., Zhou, D. G., Wu, B. Y., Foken, T., Qin, J., et al. (2011). Response of hydrological cycle to recent climate changes in the Tibetan Plateau. Clim. Change 109, 517–534. doi:10.1007/s10584-011-0099-4
Yang, R. M., Zhu, L. P., Wang, J. B., Ju, J. T., Ma, Q. F., Turner, F., et al. (2017). Spatiotemporal variations in volume of closed lakes on the Tibetan plateau and their climatic responses from 1976 to 2013. Clim. Change 140, 621–633. doi:10.1007/s10584-016-1877-9
Yao, F. F., Wang, J. D., Yang, K. H., Wang, C., Walter, B. A., and Crétaux, J. F. (2018). Lake storage variation on the endorheic Tibetan Plateau and its attribution to climate change since the new millennium. Environ. Res. Lett. 13, 064011. doi:10.1088/1748-9326/aab5d3
Yao, T. D., Thompson, L., Yang, W., Yu, W. S., Gao, Y., Guo, X. J., et al. (2012). Different glacier status with atmospheric circulations in Tibetan Plateau and surroundings. Nat. Clim. Chang. 2, 663–667. doi:10.1038/nclimate1580
Yoshikawa, K., and Hinzman, L. D. (2003). Shrinking thermokarst ponds and groundwater dynamics in discontinuous permafrost near Council, Alaska. Permafr. Periglac. Process. 14, 151–160. doi:10.1002/ppp.451
Zhang, G. Q., Bolch, T., Chen, W. F., and Crétaux, J. F. (2021). Comprehensive estimation of lake volume changes on the Tibetan Plateau during 1976–2019 and basin-wide glacier contribution. Sci. Total Environ. 772, 145463. doi:10.1016/j.scitotenv.2021.145463
Zhang, G. Q., Li, J. L., and Zheng, G. X. (2017b). Lake-area mapping in the Tibetan plateau: An evaluation of data and methods. Int. J. Remote Sens. 38, 742–772. doi:10.1080/01431161.2016.1271478
Zhang, G. Q., Yao, T. D., Chen, W. F., Zheng, G. X., Shum, C. K., Yang, K., et al. (2019). Regional differences of lake evolution across China during 1960s-2015 and its natural and anthropogenic causes. Remote Sens. Environ. 221, 386–404. doi:10.1016/j.rse.2018.11.038
Zhang, G. Q., Yao, T. D., Shum, C. K., Yi, S., Yang, K., Xie, H. J., et al. (2017a). Lake volume and groundwater storage variations in Tibetan Plateaus endorheic basin. Geophys. Res. Lett. 44, 5550–5560. doi:10.1002/2017GL073773
Zhang, G. Q., Yao, T. D., Xie, H. J., Zhang, K. X., and Zhu, F. J. (2014). Lakes’ state and abundance across the Tibetan Plateau. Chin. Sci. Bull. 59, 3010–3021. doi:10.1007/s11434-014-0258-x
Zhang, Y. X., Xie, C. W., Wu, T. H., Zhao, L., Wu, J. C., Wu, X. D., et al. (2022). New permafrost is forming on the exposed bottom of Zonag Lake on the Qinghai-Tibet Plateau. Sci. Total Environ. 815, 152879. doi:10.1016/j.scitotenv.2021.152879
Zhao, L., Ding, Y. J., Liu, G. Y., Wang, S. L., and Jin, H. J. (2010). Estimates of the reserves of ground ice in permafrost regions on the Tibetan Plateau. J. Glaciol. Geocryol. 32, 1–9.
Zhao, L., and Sheng, Y. (2019). Permafrost and its changes on the Qinghai-Tibetan plateau (in Chinese). Beijing: Science Press, 200–237.
Zhao, L., Zou, D. F., Hu, G. J., Du, E. j., Pang, Q. Q., Xiao, Y., et al. (2020). Changing climate and the permafrost environment on the qinghai-tibet (xizang) plateau. Permafr. Periglac. Process. 31, 396–405. doi:10.1002/ppp.2056
Zhou, J., Wang, L., Zhang, Y. S., Guo, Y. H., Li, X. P., and Liu, W. B. (2015). Exploring the water storage changes in the largest lake (Selin Co) over the Tibetan Plateau during 2003–2012 from a basin-wide hydrological modeling. Water Resour. Res. 51, 8060–8086. doi:10.1002/2014WR015846
Zhou, Y., Dong, J. W., Xiao, X. M., Liu, R. G., Zou, Z. H., Zhao, G. S., et al. (2019). Continuous monitoring of lake dynamics on the Mongolian Plateau using all available Landsat imagery and Google Earth Engine. Sci. Total Environ. 689, 366–380. doi:10.1016/j.scitotenv.2019.06.341
Zhu, X. F., Wu, T. H., Ni, J., Wu, X. D., Hu, G. J., Wang, S. J., et al. (2022). Increased extreme warming events and the differences in the observed hydrothermal responses of the active layer to these events in China’s permafrost regions. Clim. Dyn. 59, 785–804. doi:10.1007/s00382-022-06155-x
Keywords: lake area, spatial-temporal changes, influencing factors, northeastern Tibetan Plateau, permafrost impact
Citation: Liu W, Liu H, Li Q, Xie C, Zhang Z, Zhou G, Zhang Q and Zhao Q (2023) Extensive responses of lake dynamics to climate change on northeastern Tibetan Plateau. Front. Earth Sci. 10:1007384. doi: 10.3389/feart.2022.1007384
Received: 30 July 2022; Accepted: 27 September 2022;
Published: 09 January 2023.
Edited by:
Chunqiao Song, Nanjing Institute of Geography and Limnology (CAS), ChinaReviewed by:
Haijun Deng, Fujian Normal University, ChinaCopyright © 2023 Liu, Liu, Li, Xie, Zhang, Zhou, Zhang and Zhao. This is an open-access article distributed under the terms of the Creative Commons Attribution License (CC BY). The use, distribution or reproduction in other forums is permitted, provided the original author(s) and the copyright owner(s) are credited and that the original publication in this journal is cited, in accordance with accepted academic practice. No use, distribution or reproduction is permitted which does not comply with these terms.
*Correspondence: Hairui Liu, bGhyYm90YW55QDE2My5jb20=
Disclaimer: All claims expressed in this article are solely those of the authors and do not necessarily represent those of their affiliated organizations, or those of the publisher, the editors and the reviewers. Any product that may be evaluated in this article or claim that may be made by its manufacturer is not guaranteed or endorsed by the publisher.
Research integrity at Frontiers
Learn more about the work of our research integrity team to safeguard the quality of each article we publish.