 Weiyong Lu
 Erhu Bai2,3*
 Yaohui Sun
 Lei Shi
- 1Department of Mining Engineering, Lyuliang University, Shanxi, China
- 2State Key Laboratory Cultivation Base for Gas Geology and Gas Control (Henan Polytechnic University), Jiaozuo, China
- 3School of Energy Science and Engineering, Henan Polytechnical University, Jiaozuo, China
- 4Lyuliang Engineering Research Center of Intelligent Coal Mine, Shanxi, China
- 5China Coal Technology and Engineering Group Chongqing Research Institute, Chongqing, China
- 6School of Civil Engineering and Architecture, East China University of Technology, Nanchang, China
- 7State Key Laboratory of Coal Resources and Safe Mining, China University of Mining and Technology, Xuzhou, China
For purpose of clearing the spatial pattern of hydraulic fracture during directional perforation in low-permeability unconventional reservoirs, RFPA2D-Flow software is used to numerically calculate their spatial steering trajectory and deflection distance. The accuracy of numerical calculation results is verified by theoretical and experimental results. Then the influences of horizontal principal stress difference, perforation length, and azimuth on the hydraulic fractures’ spatial steering trajectory are studied. It is shown by the results that 1) the software can accurately predict the space steering trajectory and deflection distance of directional perforation hydraulic fractures, 2) both deflection distance and spatial steering trajectory of hydraulic fractures are quantitatively evaluation indexes, which are used to evaluate the hydraulic fractures’ spatial steering effects, and 3) under different horizontal principal stress differences, perforation azimuths, and lengths, the same hydraulic fracture’s propagation trajectories are presented. They initiate from the perforation end and gradually deflect along the maximum horizontal principal stress direction and finally represent curved fractures like both wings. With the increase in horizontal principal stress difference, the fractures’ deflection distance decreases. However, it increases with the increase in perforation azimuth and length. Their deflection amplitude increases first and then decreases. Initiation pressure of hydraulic fracture rises with the decrease in perforation length and increase in perforation azimuth and horizontal principal stress difference.
1 Introduction
It is hydraulic fracturing that is considered to be one of the most effective and common methods to improve the physical properties of low-permeability reservoirs. Generally, it is conducted before an oil and gas well is put into production (Gehne and Benson, 2019; Nandlal and Weijermars, 2019; Lu et al., 2020a; Lu et al., 2020b; Lu and Huang, 2020; Ogata et al., 2020). Directional perforation hydraulic fracturing can alleviate the quick water outlet problems, enlarge the reformed reservoir volume, and poor water injection effect caused by straight line communication among fractures. It can also effectively reduce the initiation pressure, which is favorable for the formation of hydraulic fracture (Zhun et al., 2015; Liu et al., 2018; Qi et al., 2018; Hossain et al., 2020; Zhang et al., 2020). However, hydraulic fracture initiates from the perforation, which is the result of being affected by the perforating direction and far-field in situ stress and well-born effect. Hydraulic fracture with a certain curvature is formed, and its curvature is determined by the angle between the maximum principal stress and perforating direction (Chen et al., 2017). For directional perforation hydraulic fracturing, accurate prediction and control of hydraulic fracture propagation trajectory are the key conditions to the successful implementation of this technology. Therefore, the propagation path of hydraulic fractures must be clearly obtained before the hydraulic fracturing is conducted, so as to determine reasonable parameters of the fracture morphology and reconstruction effect of directional perforation hydraulic fracturing.
In recent years, serial physical experiments, the critical water pressure, and propagation path have been studied using the method of theoretical calculations and numerical simulations. Their impact factors of directional perforation hydraulic fracture have also been studied. The fracture initiation and propagation are influenced by the prefabricated fracture dip, which is studied by Liyuan Liu and Haiyan Zhu et al. through numerical simulation and physical test (Zhun et al., 2015; Liu et al., 2018). In the same way, large-scale true triaxial hydraulic fracturing physical simulation experiment was conducted by Chen and Jiang Hu et al. It is shown that formation fracture pressure and its morphology is affected by perforation azimuth and horizontal principal stress difference (Jiang et al., 2009; Chen et al., 2010; Jiang et al., 2014). For some laboratory test methods, they take more money and time, but only limited results can be obtained at times. Theoretical calculation and numerical simulation are widely used because of their low cost and convenient operation in controlling the variation of influence parameters. The summary of the existed analytical models and empirical models can be seen in Table 1. All these analytical models and empirical models can be used to study the characteristics of the hydraulic fracture rotation rule in rock mass.
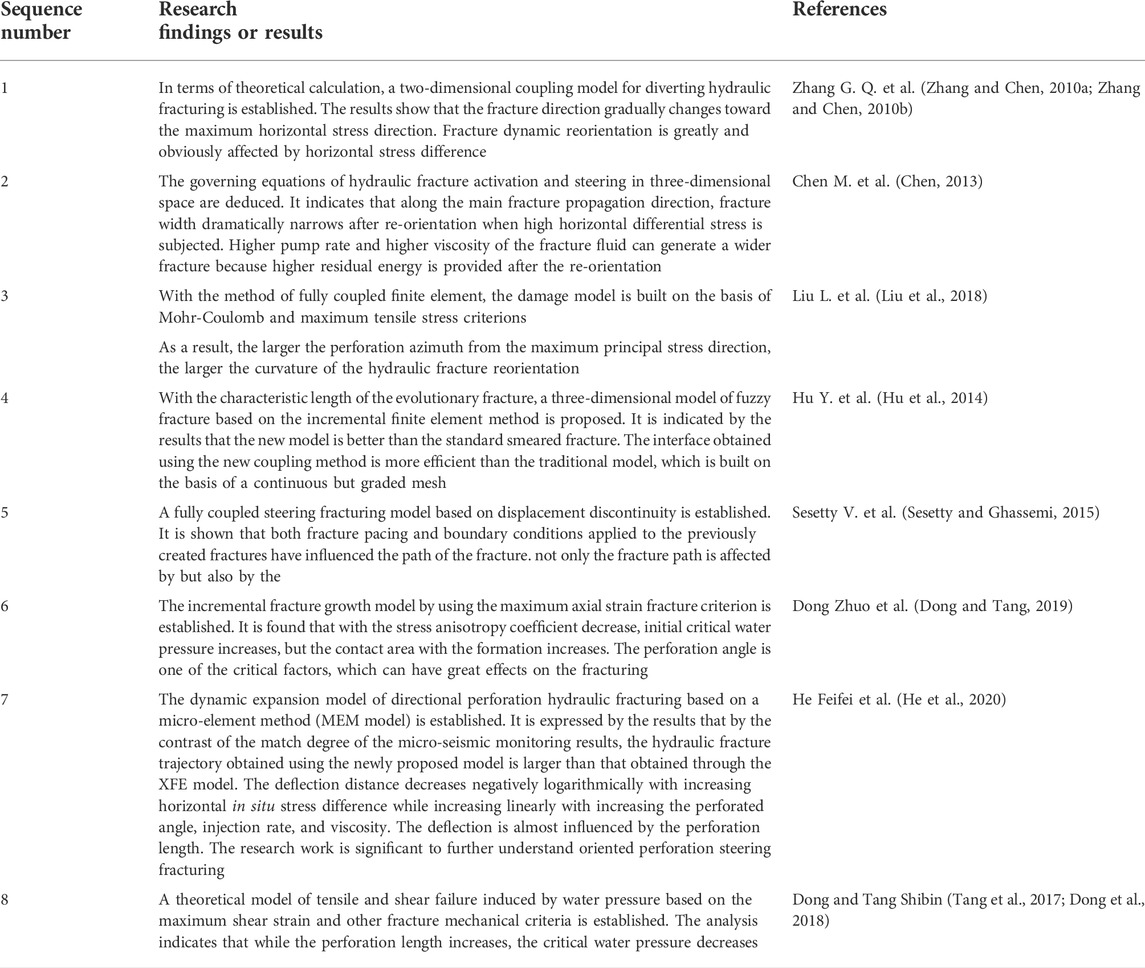
TABLE 1. Summary of the existing analytical models and empirical models.
Although the theoretical method can analyze the parameter influence and provide the theoretical basis for verification for numerical calculation, they cannot intuitively show the propagation process of hydraulic fracture intuitively. That is to say, the propagation process of hydraulic fracture can be shown using numerical simulation methods. However, the accuracy of numerical calculation is affected by the selected parameters. At times, the calculation results may not be accurate. Moreover, there is a certain gap with the actual calculation results. Therefore, the selected parameters need to be verified before the numerical calculation. In general, there are two methods, the finite element method (FEM) and the extended finite element method (EFEM), which can be used to conduct numerical simulation. The FEM has been a common method to simulate the propagation progress of hydraulic fracture in recent years (Zhang and Chen, 2010a; Zhang and Chen, 2010b; Hunsweck et al., 2013; Bao et al., 2014; Bao et al., 2015). However, the fracture path needs to be set in advance before computation, which cannot reflect the turning law of the fracture and the arbitrariness of its expansion. At the end of each time step, the fractures need to be re-gridded, thus mitigating the grid accuracy and computing efficiency (Chen et al., 2017). The EFEM makes up for the FEM defects in simulating the fracture propagation (Daux et al., 2000; Sukumar et al., 2000; Moës and Belytschko, 2002). Based on the EFEM, the morphology of fracture propagation influenced by different horizontal stress differences and perforation azimuth was simulated by Sepehri et al. (2015). A solid–fluid coupling for simultaneous propagation and steering of directional perforating hydraulic fractures in vertical wells in low-permeability reservoirs was established by Shi Jihui et al. It is indicated that both the fracture turning radius and its initiation pressure are influenced by fracturing fluid injection rate, perforation azimuth, and main stress difference (Shi et al., 2020). The parameters, including perforation length and azimuth, have great influence on hydraulic fractures’ initiation and propagation. The coupling model of hydraulic fracturing is established with the foundation of two criterions. One is the maximum tensile stress criterion; the other is the stress intensity factor criterion. This method is utilized to conduct the degree of influence (Chen et al., 2017). As we know, the fracture propagation deflection is affected by the parameters of fracturing fluid. The fracturing fluid is characterized with its viscosity and injection rate. So, a fluid–solid coupling model of the steering fracture was established by Wang X.L. (Wang et al., 2018a; Wang et al., 2018b).
The existing studies have played an important role in rules of the spatial turning and directional fracture propagation under different influence factors (Wang et al., 2017; Guo et al., 2018; He et al., 2018; Guo et al., 2020). However, the influencing mechanism of each factor has not been revealed, and the deflection process of the directional perforation hydraulic fracture remains unknown. In addition, there are few research studies on the deflection distance of hydraulic fracture, which is key to measuring the directional propagation effect of hydraulic fracture. Thus, it is the computer simulation software of RFPA2D-Flow that is adopted to analyze the fractures’ deflection process in this study. First, two indexes are put forward to quantitatively analyze and evaluate the spatial deflection of directional perforated hydraulic fracture. One index is the quantitative extraction of the deflection propagation trajectory of hydraulic fracture, and the other is deflection distance of hydraulic fracture. Then, the accuracy of the numerical calculation results of RFPA2D-Flow was verified by the results obtained using the MEM model and laboratory test. Finally, regarding the two quantitative indexes as the starting point, the influence rule and the mechanism of horizontal principal stress difference, perforation azimuth, and length on the fractures’ distances and deflection path is analyzed. The results of this study have certain reference value for further understanding the spatial steering process and the optimization of parameters of hydraulic fracturing with the help of the directional perforation.
2 Numerical simulations of the steering process of the directional perforation hydraulic fracture
2.1 Tensile and shear failure criteria of the rock of the software
In this study, a piece of computer simulation software is used. The detailed introduction about the software can be found from the literatures (Zhu and Tang, 2004; Li et al., 2011; Lu et al., 2020a). So, it has not been repeatedly introduced. But the tensile and shear failure criteria of the rock mass are introduced in detail.
As illustrated in Figure 1, rock damage in tension or shear is initiated when its state of stress (positive for compression) satisfies the maximum tensile stress criterion or the Mohr-Coulomb criterion, respectively, as F1 = 0 and F2 = 0. In terms of the damage constitutive law shown in Figure 1, when F1 < 0 and F2 < 0, the applied stress is insufficient to satisfy the maximum tensile stress criterion and the Mohr-Coulomb failure criterion, respectively. F1 = 0 and dF1>0 implies rock damage in the tensile mode when the stress state satisfies the maximum tensile stress criterion and the rock is still under load. F1 = 0 and dF2>0 implies rock damage in the shear mode when the stress state satisfies the Mohr-Coulomb failure criterion and the rock remains loaded (Liu et al., 2018).
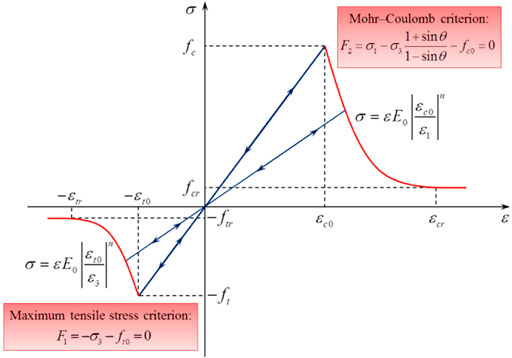
FIGURE 1. Damage constitutive law for rock under uniaxial stress condition (Liu et al., 2018).
In Figure 1, ft0 and fc0 are, respectively, uniaxial tensile and compressive strength, E and E0 are, respectively, the Young’s modulus of the damaged and the undamaged element, σ1 and σ3 are, respectively, the first and third principal stresses, θ is the internal frictional angle, and F1 and F2 are two damage threshold functions; ε1 and ε3 are, respectively, the major and minor principal strains, εt0 and εc0 are, respectively, the maximum tensile and maximum compressive principal strains when tensile and shear damage occurs, and n is a constitutive coefficient specified as 2.0.
2.2 Establishment of physical model
The size of the two-dimensional model is 300 mm × 300 mm (Figure 2). Its boundary is impermeable and constrained by surrounding pressure. There is a borehole, whose diameter is 20 mm, in the center of the model. The total cell number of the model, which is divided, is 90000. There are two pre-existing perforations. One is named AB, and the other is marked with CD. Their length, a, is 30 mm. The angle, marked with θ, between the directional perforation and the maximum horizontal principal stress σH, is termed as orientation angle. θ is valued as 60°. The maximum principal stress σH and minimum principal stress σh is 6 and 1 MPa in the horizontal and vertical direction, respectively. In the beginning, there is no water pressure, and its increase rate is 0.2 MPa/step.
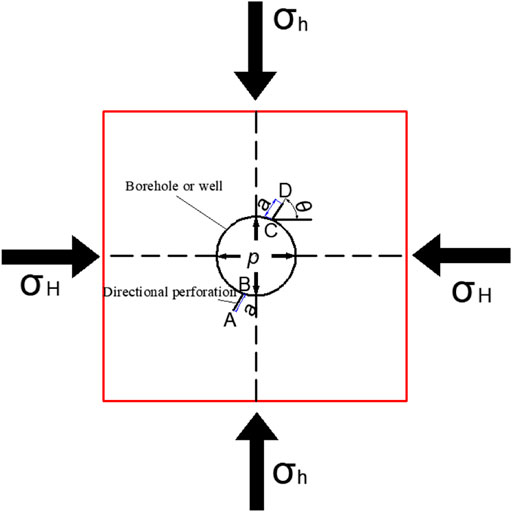
FIGURE 2. Geometric model of directional perforation hydraulic fracturing.
2.3 Parameter selection
The parameters of the experimental test adopted by Jiang Hu et al. and the theoretical calculation by He Feifei et al. are seen in Table 2 (Jiang et al., 2009; He et al., 2020). The parameters, such as compressive and tension strength, can be obtained by a mechanical test, and their proportion and internal friction angle can be calculated. Then, the stress-strain curve can be obtained. Moreover, the residual strength coefficient, the maximum tension and compressive strain coefficient, the elastic modulus, and the internal friction angle are very easy to obtain. The permeability can be obtained by the laboratory experiment. Before water is poured into the borehole, there is no water pressure. Therefore, initial water pressure is 0. A piece of computer simulation software is used to calculate the fracture propagation trajectory with the similar experimental and theoretical conditions, and the results of numerical simulation were compared with the experimental and theoretical results.
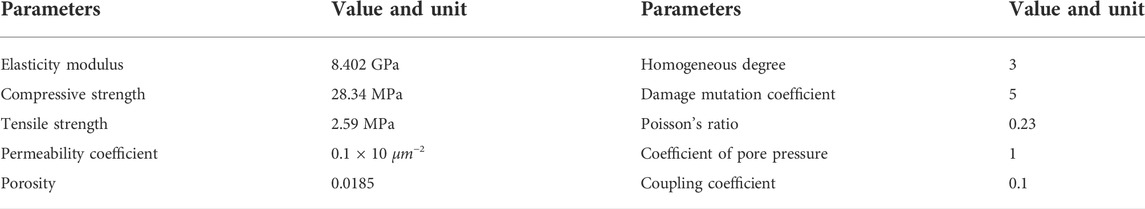
TABLE 2. Parameters of numerical simulation.
2.4 Comparison of RFPA2D-flow numerical calculation results with MEM model and laboratory test results
2.4.1 Evaluation index of spatial steering of directional perforation hydraulic fracture
In general, the maximum principle is along the vertical direction. During the expansion of hydraulic fracture, fracture always propagates along the direction in which the resistance is the least value. Therefore, the surface of the preferred fracture is usually along the maximum horizontal principal stress. In the far field, the hydraulic fracture expansion direction is usually perpendicular to the direction of the minimum horizontal principal stress. In this study, the distance of the deflection is marked with L, and the spatial turning expansion trajectory of the hydraulic fractures is shown in Figure 3. These two indexes are utilized to measure the law of spatial turning of the directional perforating hydraulic fracturing. The maximum horizontal principal stress, minimum horizontal principal stress, perforation azimuth, perforation length, water injection pressure, and fracture deflection distance is marked with σH, σh, θ, a,p, and L.
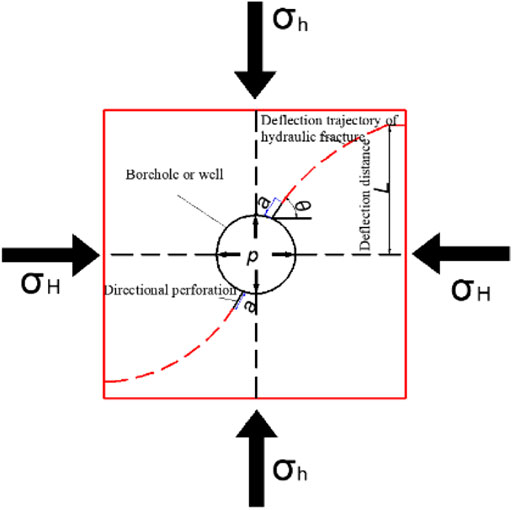
FIGURE 3. Evaluation indexes of spatial steering expansion of hydraulic fractures.
2.4.2 Accuracy of numerical calculation results calculated by RFPA2D-Flow software
The result of simulation obtained by Hu et al. is shown in Figure 4. It can be indicated that the hydraulic fracture gradually biases toward the direction of σH after it initiates at the point of the perforation end. A steering fracture in a bent wing is formed, but the two wings of the bent fracture is not strictly symmetrical. The spatial steering expansion trajectory of the directional perforation hydraulic fracture obtained by the numerical simulation is basically identical with that of the experimental test.
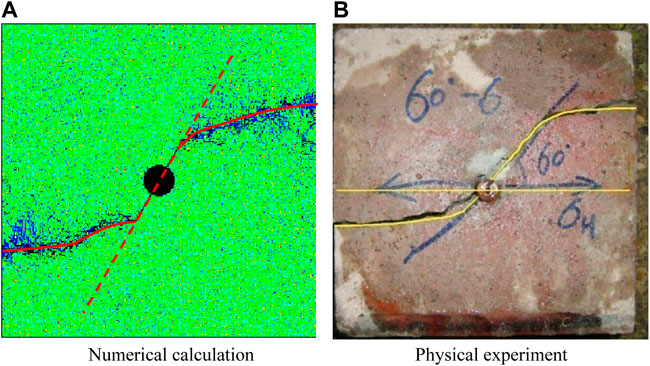
FIGURE 4. Comparison of the deflection trajectory of hydraulic fracture between numerical calculation and physical experiment.
Based on the micro-element method, a dynamic propagation model (MEM model) was established by He Feifei et al., which is used to quantitatively determine the expansion trajectory and deflection distance of hydraulic fractures in low-permeability unconventional oil and gas reservoirs during directional perforation steering fracturing (He et al., 2020). In this study, the results of the MEM model, physical experiment, and RFPA2D-Flow calculation are quantitatively compared (Figure 5) to verify the accuracy of numerical simulation results. It can be seen from Figure 5 that 1) for the right wing (X > 0) of the hydraulic fracture, the results of numerical calculation are basically consistent with those obtained using laboratory tests and the MEM model. For the left wing (X < 0), the results of numerical calculation and indoor laboratory test and the MEM model are a little different. This can be explained by the fact that in the laboratory test, due to the impact of loading conditions and the heterogeneity of specimens themselves, the hydraulic fracture does not initiate along the predetermined direction. A two-wing steering fracture with an incomplete symmetry of the starting end of directional perforation is eventually formed. The steering asymmetry of the right wing (X > 0) is more obvious. 2) The distance of the fracture deflection of the left wing (X < 0) calculated using physical experiment, numerical calculation and the MEM model is 0.049, 0.07, and 0.079 m, respectively. The distance of the fracture deflection calculated by numerical calculation is located between the deflection distance calculated using physical experiment and the MEM model. The results of numerical calculation are basically the same as those calculated using the MEM model. They are closer to those calculated by the physical experiment. Through the quantitative comparison of the trajectory and deflection distance of hydraulic fracturing obtained using laboratory fracturing test and the MEM model, it is proved that the results calculated using RFPA2D-Flow software are accurate, feasible, and reliable.
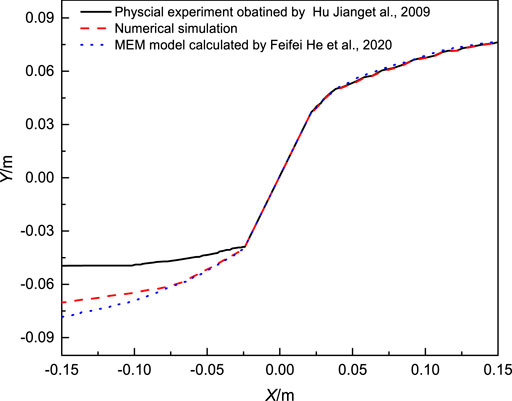
FIGURE 5. Comparison of results calculated using RFPA2D-Flow software, laboratory test, and the MEM model.
3 The influencing factors of spatial steering process and deflection distance of hydraulic fracture
The deflection trajectory and its deflection distance of hydraulic fractures, which is shown in Figure 3, are two key indexes to evaluate the fracturing turning effect. As we know, it is very important for the design optimization of hydraulic fracture turning to figure out the fracture propagation trajectory and deflection distance under various influencing factors. RFPA2D-Flow software is adopted to study the influence of parameters such as principal stress difference △σ(△σ = σH-σh), perforation length, and azimuth on the propagation trajectory and deflection distance of directional perforation hydraulic fracture.
3.1 Influence of horizontal stress difference on spatial steering trajectory and deflection distance of hydraulic fractures
△σ is the most important factor, which affects the fracture deflection distance and propagation path. In the model, the σh is 1 MPa, and the σH is selected as 10 MPa, 8 MPa, 6 MPa, 4 MPa, and 2 MPa to determine how horizontal principal stress difference △σ influences the trajectory and deflection distance of hydraulic fractures in space.
It is water pressure, acoustic emission signal, and fracture morphology of hydraulic fractures under several different △σ that is illustrated in Figure 6. Figure 7 indicates the quantitative comparison results of deflection distance. It can be seen that the fracture propagation trace is almost consistent. From the perforation end, the hydraulic fracture initiates first. Then it deflects along the σH direction gradually. Meanwhile, the fracture deflection amplitude increases first. But it then decreases on the contrary. However, the fracture deflection distance under different △σ is different. The greater the △σ, the smaller the fracture deflection distance. With the increase in the horizontal stress difference, the deflection curvature radius of the hydraulic fracture becomes smaller and smaller. This can be explained by the fact that the deflection curvature radius of the hydraulic fracture in a two-dimensional space can be calculated using the formula (Romero et al., 1995) where K is the ratio of σH and σh, RL is the deflection curvature radius of hydraulic fracture, the stress intensity factor KI is related to the fracture size, the geometric characteristics of fractures, and the load received. It can be seen from this formula that K being greater causes the curvature radius of hydraulic fracture to be smaller when the stress intensity factor KI and minimum principal stress σh are constant. The greater difference of △σ makes the shorter fracture turning path and the faster turning to the optimal fracture surface (Jiang et al., 2009).

FIGURE 6. Water pressure, AE signal, and fracture deflection morphology under different △σ
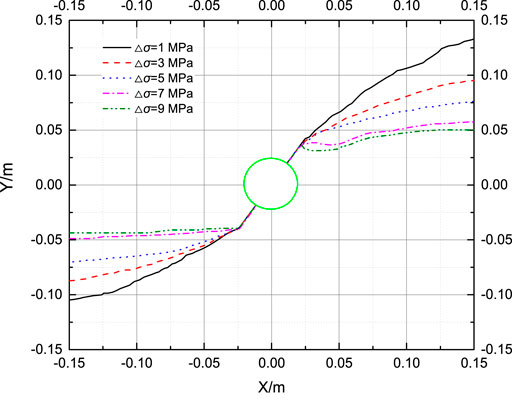
FIGURE 7. Deflection trajectory of hydraulic fracture under different principal stress difference.
During the hydraulic fracturing process of numerical simulation, the acoustic emission (AE) signal, water pressure changes, and fractures’ shape change is monitored (Figure 6). The failure of the rock mass is usually caused by tensile or shear stress. For the AE signal, tensile and shear fracture is marked as circles with red and white colors, respectively. The location of the circles is the place in which the tensile or shear failure occurs. The larger the circle, the more the rupture energy releases. The shape of the AE signal can be used to track the fracture propagation. It is obvious that the tensile rupture is more than the shear rupture because the number of red circles is more than the white ones.
The relationship between L and the △σ can be further illustrated in Figure 8: 1) The deflection distance L and △σ conform to the quadratic polynomial L = 0.1345–0.01621△σ-4 (△σ)2, and the correlation coefficient is 0.99537. 2) When △σ decreases from 9 MPa to 7 MPa, 5 MPa, 3 MPa, and 1 MPa, respectively, the average deflection distance of hydraulic fractures increases by 0.006 meters, 0.017 meters, 0.021 meters, and 0.028 m, respectively. When △σ is less than 7 MPa, the fracture deflection distance is more visible. When △σ is greater than 7 MPa, little change happens. 3) The slope of the fitting curve decreases with the increase in △σ. It is demonstrated that the fracture deflection distance variation decreases slowly.
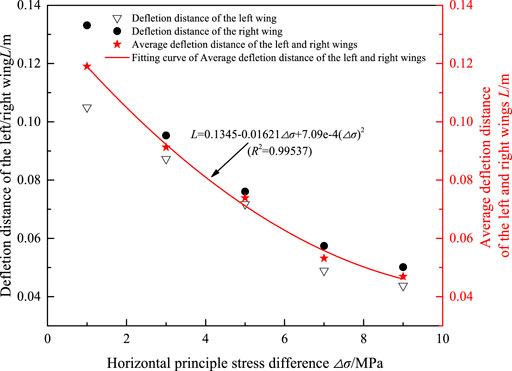
FIGURE 8. Deflection distance of hydraulic fracture under different principal stress difference.
Figure 9 manifests the initiation pressure of the hydraulic fracture corresponding to different horizontal principal stress differences. With △σ being 9 MPa, 7 MPa, 5 MPa, 3 MPa, and 1 MPa, the correspondent fracture initiation pressure is 7.4, 6.8, 6.4, 6.2, and 6.0 MPa. It makes clear that the initiation pressure decreases gradually with the decrease in △σ. The reason is that the higher the normal stress on the surface of the fracture surface, the greater the water pressure that is required to open the fracture. The greater △σ produces the greater normal stress on the fracture surface, and the greater initiation pressure of hydraulic fracture. The conclusions of this study are consistent with the results of relevant physical experiments (Chen et al., 2010; Dong and Tang, 2019).
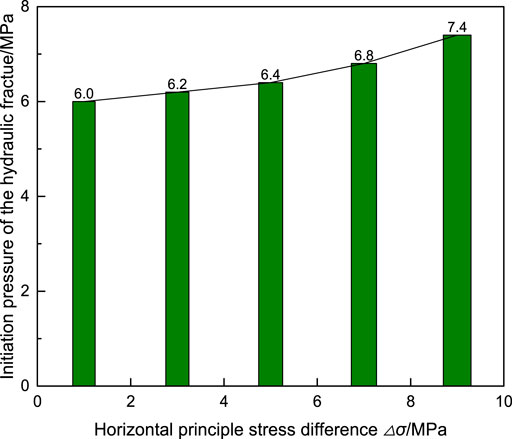
FIGURE 9. Initiation pressure of hydraulic fractures under different horizontal principal stresses.
3.2 Influences of perforation parameters on the fracture’s spatial turning process and deflection distance
The parameters, mainly including the azimuth and length of perforation, most directly affect the steering propagation trajectory and deflection distance of directional perforation hydraulic fracture. To a large extent, it determines the fracturing effect and deflection distance of hydraulic fracture.
3.2.1 Perforation azimuth
Several different perforation azimuths of 15°, 30°, 45°, 60°, and 75° are chosen to study its influence on the fracture deflection distance and trajectory.
It is shown in Figure 10 that AE signal, water pressure changes, and fracture deflection morphology under different perforation azimuth: 1) all hydraulic fractures under different perforation azimuths initiate at the perforation tip and then extend for a distance in the direction of the existing perforation and gradually turn toward the σH direction. The deflection amplitude first increases and then decreases. 2) There are differences in the deflections of hydraulic fractures under different perforation azimuths. Larger perforation azimuth produces the more obvious fracture deflection. 3) Under different perforation azimuths, the trends of the propagation trajectory of the hydraulic fractures are roughly the same, and all the final shape is presented as a two-wing bending fracture. 4) When the directional perforation azimuth is 75°, a new fracture also appears σH. This is because the maximum stress concentration value of around the fracturing borehole wall appears along the maximum horizontal principal stress. At this time, two hydraulic fractures simultaneously initiate along both the directional perforation and the borehole wall in the σH direction. This directional perforation azimuth is considered as a critical angle. At this critical angle, the first principal stress magnitude occurring at the directional perforation tip and the wall of the borehole in the σH direction are equal (Lu and He, 2021a). The analysis about acoustic emission signals of Figure 6II is also suitable for Figure 10II.
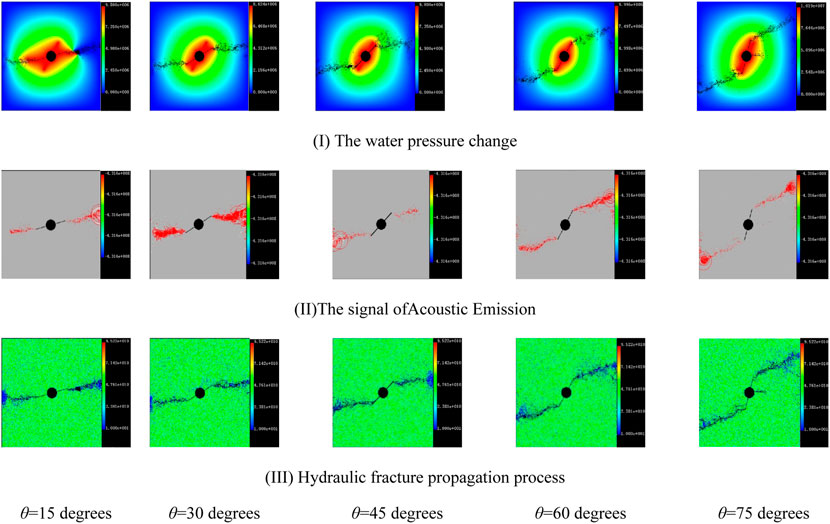
FIGURE 10. Water pressure, acoustic emission signal, and fracture deflection morphology under different perforation azimuths.
The hydraulic fracture deflection trajectory is well shown in Figure 11. Several perforation azimuths of 15°, 30°, 45°, 60°, and 75° are chosen to study its fluences on the fracture deflection distance. As a result, 0.024, 0.032, 0.045, 0.073, and 0.104 m are the corresponding average deflection. This indicates that smaller perforation azimuth will lead to a quicker deflection of hydraulic fracture to the σH direction.
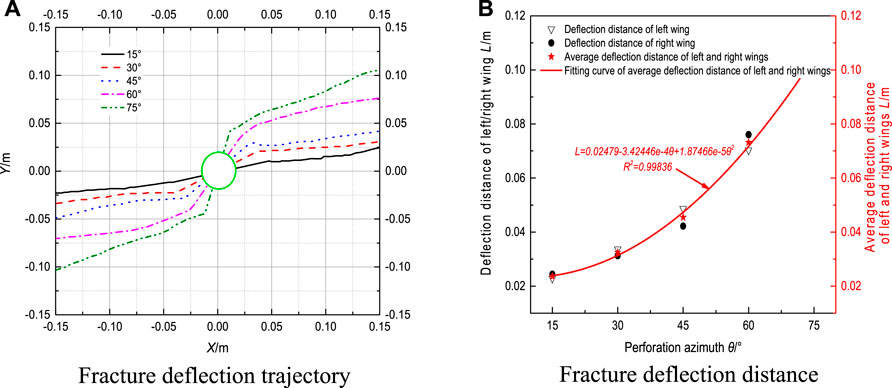
FIGURE 11. Hydraulic fractures’ deflection trajectory and distance under different perforation azimuths.
That is to say, with the perforation azimuth being increased, a larger fracture initiation angle in the initial stage of fracture expansion appears. So, the fracture slowly turns to the σH direction. The reason is as following. When the main principal stress is fixed, the distribution of the shear and tensile stress at the perforation end will be affected by the perforation azimuth, and then the fracture initiation angle and the deflection angle of the micro-step increment in the subsequent expansion will also be affected. In the range from 0 to π/2, the larger the perforation azimuth, the more the number of the micro-step increment and deflection times, the smaller the deflection curvature of the hydraulic fracture propagation path, and the larger the deflection distance. However, there are few variation amplitudes of initial fracture angles under different values of θ. Compared with the effect of perforation azimuth on the number of deflections, the effect of perforation azimuth on the initial fracture angle can be ignored (He et al., 2020).
The relationship between L and θ appears in Figure 11B: 1) the relationship between L and θ is conformed to L = 0.02479–3.42446e-4θ+1.87466e-5θ2, which is a quadratic polynomial, and 0.998 is the corresponding correlation coefficient. The fitting curve derivatives increase with the increase in θ. It is indicated that deflection distance of hydraulic fracture increases with the increase in perforation azimuth, which means the sensitivity between L and θ rises slowly. With the increase in perforating azimuth angle, hydraulic fractures near the well or the borehole or drilling become more twisted, and the corresponding deflection distance is greater. 2) With the perforation azimuth being 15° increment, the corresponding fracture deflection distance increases by 0.08, 0.13, 0.28, and 0.31 m, respectively. It is indicated that with the increase in θ, the variation amplitude of L is increasing slowly as well, and the reservoir that can be communicated by the hydraulic fracture is also broader.
The relationship between the fracture initiation pressure Pf and the θ is shown in Figure 12. It is characterized with nonlinearity between the Pf and θ. With θ being, respectively, 15°, 30°, 45°, 60°, and 75°, the corresponding fracture initiation pressure is, respectively, 5.2, 5.8, 6.2, 6.4, and 6.6 MPa. According to the theory of the fracture mechanics, with the maximum effective tensile stress coming to the tensile strength around the wall of the borehole strength, the rock mass is broken and the fracture occurs. Pf increases with the increase in θ as well. The initiation pressure of the perforated vertical well can be calculated using the formula Pf = ¼{σh [3+6cos (2θ)]+σH [3-6cos (2θ)]+2μ(σH-σh)cos (2θ)-αPp+σt}. Here, pore pressure, tensile strength, Poisson’s ratio, and the pore elastic coefficient are marked as Pp, σt, μ, and α, respectively (Hossain et al., 2020). Accordingly, with the increase in θ, the Pf increases gradually. In addition, the larger the θ, the more energy is needed to overcome the shear failure of the perforation tip, resulting in a high holding pressure generated by the injection of fracturing fluid that is needed to achieve the fracture initiation at the perforation tip (Shi et al., 2020).
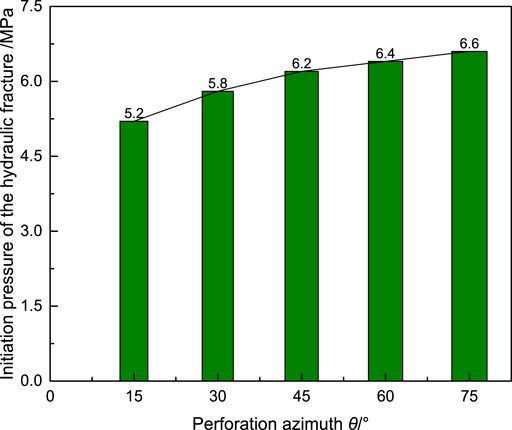
FIGURE 12. Initiation pressure of hydraulic fractures under different perforation azimuths.
With the increase in θ, the stress variation increases, the fracture expansion path is longer and steering radius is larger in this region (Shi et al., 2020). Consequently, the perforation in the σH direction can be better connected with hydraulic fracture, allowing for the fracturing fluid to flow along the path of least resistance. Perforated hole, which is consistent with the best fracture plane, can effectively reduce or eliminate the tortuous flow path or flow restrictions near the well. The two-wing fracture that is formed is characterized with the smallest tortuosity and lower injection pressure. If the perforation hole is not consistent with the σH direction, a complex flow path is often generated near the well. Therefore, the angle between directional perforation azimuth and the optimal fracture surface must be as small as possible to reduce the distortion of hydraulic fractures near the well.
3.2.2 Perforation length
The proper perforation length is beneficial to pass through the polluted area near the well and reduce the influence of well-born effect on the fracture initiation and propagation. Several perforation lengths a of 20, 30, 40, 50, and 60 mm are chosen to study its influence on the spatial turning expansion trajectory and deflection distance of hydraulic fracture.
From Figure 13, several rules are found: 1) although the perforation lengths are different, the fracture propagation trajectories are nearly the same as each other. The monograph of hydraulic fracture is presented like curve fractures with two wings. 2) After hydraulic fractures initiate from the perforation end, they gradually turn to the σH direction. The amplitude of the fracture deflection increases first, but then the opposite feature is presented. 3) For different perforation lengths, there are different fracture deflection distances, and there is a positive correlation. The analysis about acoustic emission signals of Figure 6II is also suitable for Figure 13II.
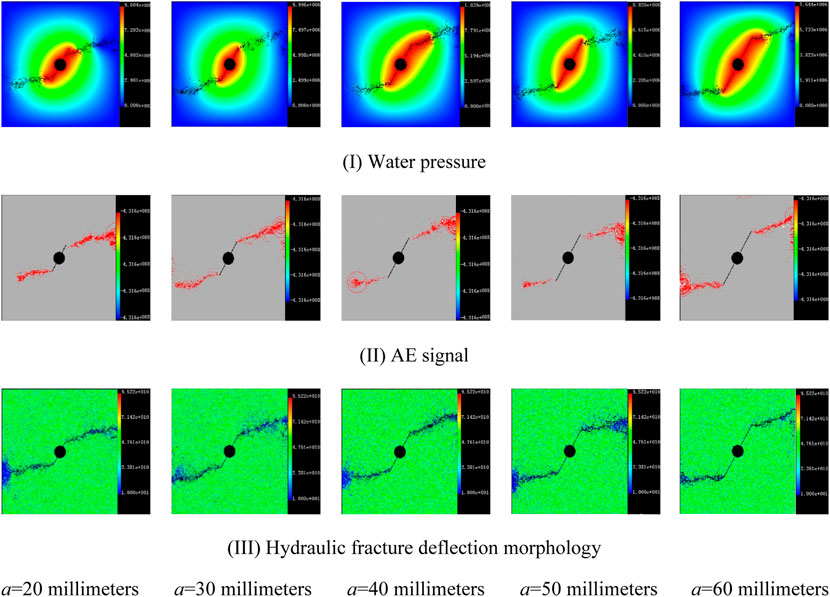
FIGURE 13. Water pressure, AE signal, and fracture deflection morphology under different perforation lengths.
Several perforation lengths a of 60, 50, 40, 30, and 20 mm are chosen. For the left and right fracture wing, the fracture deflection distance is different. For the right fracture wing, they are 0.074, 0.073, 0.071, 0.070, and 0.053 m. However, for the right fracture wing, they are 0.086, 0.079, 0.076, 0.073, and 0.054 m. It is indicated that with the increase in perforation length, the deflection distances of the left or right wing increases. So does the average deflection distance. Meanwhile, the perforation length increase is unconducive to the control of fracture deflection distance. The communicating effect of effective reservoirs is not good during the propagation process of the hydraulic fracture (Figure 14).
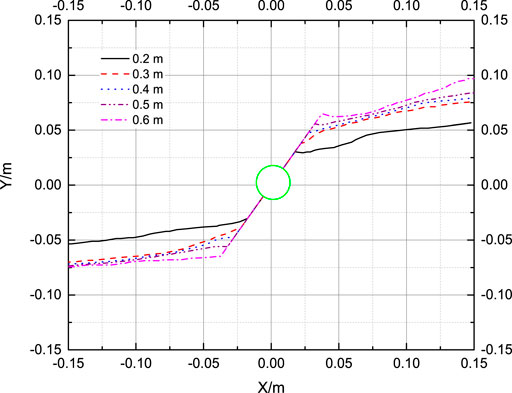
FIGURE 14. Fracture deflection trajectory with the change of perforation length.
The relationship between the L and a is quantitatively illustrated in Figure 15: 1) the relationship is conformed to the formula L = 0.02177 + 0.00206a-1.715e-5a2, which is presented as a quadratic polynomial relationship. It is 0.92 that is the correlation coefficient R2.
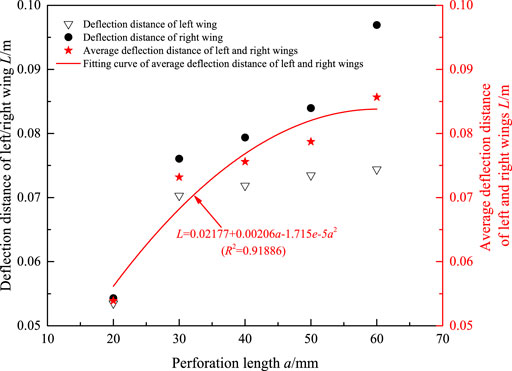
FIGURE 15. Curve line of hydraulic fracture deflection distance with the perforation length.
2) When the a is a fixed value, the right fracture wing deflection distance is larger than the left one. The difference of the deflection distance between the two under the same perforation length increases with the increase in the value of a. 3) The tangent derivative of the fitting line in Figure 15 gradually decreases. It is indicated that with the increase in the perforation length, its influence on the fracture deflection distance becomes smaller and smaller.
The curve line of hydraulic fracture deflection distance with the perforation length is shown in Figure 16. The hydraulic fracture initiation pressure increases gradually with the perforation length decrease. It is the same as the calculation results of the fracture growth increment method obtained by Dong Zhuo et al. and the numerical method by Chen Zhengrong et al. (Chen et al., 2013; Dong and Tang, 2019; Bai et al., 2020; Lu and He, 2021b). It is shown that the appropriate perforation length under the condition of relatively low injection pressure can obtain the optimal fracturing effect in the engineering practice of hydraulic fracturing.
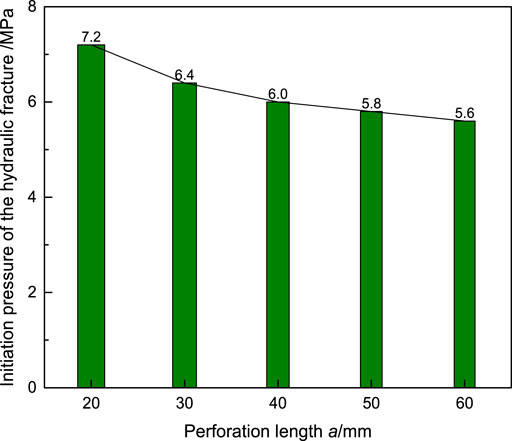
FIGURE 16. Change of hydraulic fracture initiation pressure with perforation length.
4 Discussion
For oriented perforation steering fracturing, accurate prediction and control of the fracture propagation trajectory are the key conditions for successful implementation of this technology. Therefore, it is important to determine the fracture propagation path before the diversion fracturing operation, so as to determine the proper operation parameters and improve the post-pressure effect. Currently, the hydraulic fractures’ deflection characterizations can be presented by spatial shape and initiation pressure. However, in this study, it is demonstrated that it is found that the deflection distance and angle are the other two important parameters to measure the fractures’ directional propagation effect. So, it is better and fuller to use these aforementioned four parameters, which can realize the purpose of the quantitative evaluation. However, the trajectory of the hydraulic fracture is also influenced by the fluid injection parameters, formation mechanical parameters, perforation depth, aperture, and density. All the influencing effect should be studied in the following research work.
5 Conclusion
(1) The accuracy of numerical calculation results calculated using RFPA2D-Flow software is verified by the experimental and theoretical results. It is demonstrated that this software can be used to predict the change of the hydraulic fractures’ spatial turning trajectory and deflection distance with the principal stress differences, perforation azimuth, and lengths accurately. The results calculated using this software are not only more consistent with the experimental results than the MEM model based on the micro-element method but can also realize the visualization of the spatial steering process of hydraulic fracture.
(2) Hydraulic fractures’ spatial steering trajectory and deflection distance can be two quantitative evaluation indexes to evaluate the directional perforated hydraulic fracture’s spatial steering effect. Through the quantitative comparison of these two indexes obtained using laboratory fracturing test and the MEM model, it is proved that these two indexes are accurate, feasible, and reliable.
(3) The variation of the propagation path of the hydraulic fracture under different horizontal principal stress differences, perforation azimuth, and perforation length are almost identical. First, they initiate from the perforation end. Then they slowly deflect toward the direction of the maximum horizontal principal stress. At last, a curved fracture with double wings is presented. The hydraulic fracture deflection distance and its ascending amplitude increase with the decrease in horizontal principal stress difference. Larger perforation azimuth will lead to more deflection and larger deflection distance, and the deflection amplitude will increase first but then decrease. With the perforation length increase, the fracture deflection distance slowly increases, and the deflection amplitude increases first and then decreases. Initiation pressure of hydraulic fracture increases with the decreases in perforation length and the increase in horizontal principal stress difference and perforation azimuth.
Data availability statement
The original contributions presented in the study are included in the article/Supplementary Material; further inquiries can be directed to the corresponding author.
Author contributions
Conceptualization, WL and EB; methodology, WL and LW; formal analysis, WL and CH; investigation, WL and YS; data curation, WL and LS; writing—original draft preparation, WL; writing—review and editing, WL and EB; funding acquisition, WL, EB, and CH. All authors have read and agreed to the published version of the manuscript.
Funding
This work was supported by the Fundamental Research Program of Shanxi Province (No. 20210302124633), the State Key Laboratory Cultivation Base for Gas Geology and Gas Control (Henan Polytechnic University) (No. WS 2021B07), the National Natural Science Foundation of China (No. 52104127), and the Lvliang Platform base construction project (No.2021GCZX-1–46), and Funded by the Research Fund of The State Key Laboratory of Coal Resources and safe Mining, CUMT (No. SKLCRSM22KF012) and Jiangxi Provincial Natural Science Foundation (No. 20212BAB214003).
Conflict of interest
The authors declare that the research was conducted in the absence of any commercial or financial relationships that could be construed as a potential conflict of interest.
Publisher’s note
All claims expressed in this article are solely those of the authors and do not necessarily represent those of their affiliated organizations, or those of the publisher, the editors, and the reviewers. Any product that may be evaluated in this article, or claim that may be made by its manufacturer, is not guaranteed or endorsed by the publisher.
References
Bai, Q. S., Liu, Z. H., Zhang, C., and Wang, F. (2020). Geometry nature of hydraulic fracture propagation from oriented perforations and implications for directional hydraulic fracturing. Comput. Geotechnics 125 (4), 103682. doi:10.1016/j.compgeo.2020.103682
Bao, J. Q., Fathi, E., and Ameri, S. (2014). A coupled finite element method for the numerical simulation of hydraulic fracturing with a condensation technique. Eng. Fract. Mech. 131, 269–281. doi:10.1016/j.engfracmech.2014.08.002
Bao, J. Q., Fathi, E., and Ameri, S. (2015). Uniform investigation of hydraulic fracturing propagation regimes in the plane strain model. Int. J. Numer. Anal. Methods Geomech. 39 (5), 507–523. doi:10.1002/nag.2320
Chen, M. (2013). Re-orientation and propagation of hydraulic fractures in shale gas reservoir. J. China Univ. Petroleum Nat. Sci. Ed. 37 (5), 88–94. doi:10.3969/j.issn.1673-5005.2013.05.013
Chen, M., Jiang, H., Zhang, G. Q., and Jin, Y. (2010). The experimental investigation of fracture propagation behavior and fracture geometry in hydraulic fracturing through oriented perforations. Pet. Sci. Technol. 28 (13), 1297–1306. doi:10.1080/10916466.2010.483435
Chen, Z. R., Deng, J. G., Zhu, H. Y., Dong, G., Hu, L., and Lin, H. (2013). Research on initiation of oriented perforation fracturing and perforation optimization design method. Rock Soil Mech. 34 (8), 2309–2315. doi:10.1007/s00345-014-1381-7
Chen, J. B., Wei, B., and Wang, H. Q. (2017). Influence of directional perforation parameters on fracture propagation. Fault-Block Oil Gas Field 24 (3), 391–395. doi:10.6056/dkyqt201703021
Daux, C., Moes, N., Dolbow, J., Sukumar, N., and Belytschko, T. (2000). Arbitrary branched and intersecting cracks with the extended finite element method. Int. J. Numer. Methods Eng. 48 (12), 1741–1760. doi:10.1002/1097-0207(20000830)48:12<1741::aid-nme956>3.0.co;2-l
Dong, Z., Tang, S. B., Gamage, R. P., and Lang, Y. (2018). A theoretical model for hydraulic fracturing through a single radial perforation emanating from a borehole. Eng. Fract. Mech. 196, S1016654205. doi:10.1016/j.engfracmech.2018.04.029
Dong, Z., and Tang, S. B. (2019). Oriented perforation hydraulic fracture propagation based on the maximum tangential strain criterion. Rock Soil Mech. 40 (11), 4543–4553. doi:10.16285/j.rsm.2018.1740
Gehne, S., and Benson, P. M. (2019). Permeability enhancement through hydraulic fracturing: Laboratory measurements combining a 3D printed jacket and pore fluid over-pressure. Sci. Rep. 9 (1), 12573–12611. doi:10.1038/s41598-019-49093-1
Guo, T. K., Rui, Z. H., Qu, Z. Q., and Qi, N. (2018). Experimental study of directional propagation of hydraulic fracture guided by multi-radial slim holes. J. Petroleum Sci. Eng. 166, 592–601. doi:10.1016/j.petrol.2018.03.102
Guo, T. K., Tang, S. J., Liu, S., Liu, X., Xu, J., Qi, N., et al. (2020). Physical simulation of hydraulic fracturing of large-sized tight sandstone outcrops. SPE J. 1 (26), 372–393. doi:10.2118/204210-pa
He, Y. W., Cheng, S. Q., Rui, Z. H., Qin, J., Fu, L., Shi, J., et al. (2018). An improved rate-transient analysis model of multi-fractured horizontal wells with non-uniform hydraulic fracture properties. Energies 11 (2), 393. doi:10.3390/en11020393
He, F., Zhang, R. X., Kang, T. H., and Zhang, X. (2020). Dynamic propagation model for oriented perforation steering fracturing cracks in low permeability reservoirs based on microelement method. Chin. J. Rock Mech. Eng. 39 (4), 782–792. doi:10.1016/j.jngse.2019.103105
Hossain, M. M., Rahman, M. K., and Rahman, S. S. (2020). Hydraulic fracture initiation and propagation: Roles of wellbore trajectory, perforation and stress regimes. J. Petroleum Sci. Eng. 27 (3), 129–149. doi:10.1016/s0920-4105(00)00056-5
Hu, Y. J., Chen, G. L., Cheng, W. P., and Yang, Z. (2014). Simulation of hydraulic fracturing in rock mass using a smeared crack model. Comput. Struct. 137, 72–77. doi:10.1016/j.compstruc.2013.04.011
Hunsweck, M. J., Shen, Y. X., and Lew, A. J. (2013). A finite element approach to the simulation of hydraulic fractures with lag. Int. J. Numer. Anal. Methods Geomech. 37 (9), 993–1015. doi:10.1002/nag.1131
Jiang, H., Chen, M., Zhang, G. Q., Jin, Y., Zhao, Z., and Zhu, G. (2009). Impact of oriented perforation on hydraulic fracture initiation and propagation. Chin. J. Rock Mech. Eng. 28 (7), 1321–1326. doi:10.3321/j.issn:1000-6915.2009.07.004
Jiang, H., Liu, S. J., He, B. S., Chen, M., and Zhang, G. Q. (2014). Experiments of the oriented perforating impact on the multi-fracture pattern of hydraulic fracturing treatment. Nat. Gas. Ind. 34 (2), 66–70. doi:10.3787/j.issn.1000-0976.2014.02.010
Li, L. C., Yang, T. H., Liang, Z. Z., Wancheng, Z., and Chunan, T. (2011). Numerical investigation of groundwater outbursts near faults in underground coal mines. Int. J. Coal Geol. 85 (3-4), 276–288. doi:10.1016/j.coal.2010.12.006
Liu, L. Y., Li, L. C., Elsworth, D., Zhi, S., and Yu, Y. (2018). The impact of oriented perforations on fracture propagation and complexity in hydraulic fracturing. Processes 6 (11), 213. doi:10.3390/pr6110213
Lu, W. Y., Wang, Y. L., and Zhang, X. (2020). Numerical simulation on the basic rules of multi-hole linear codirectional hydraulic fracturing. Geofluids 2020 (1), 1–14. doi:10.1155/2020/6497368
Lu, W. Y., Huang, B. X., Chen, S. L., and Huang, B. (2020). Experimental verification of the water-methane displacement effect in gassy coal. Int. J. Oil Gas Coal Technol. 23 (1), 126–141. doi:10.1504/ijogct.2020.10026582
Lu, W. Y., and He, C. C. (2021). Numerical simulation of the laws of fracture propagation of multi-hole linear co-directional hydraulic fracturing. Energy Explor. Exploitation 39 (3), 903–926. doi:10.1177/0144598721988993
Lu, W. Y., and He, C. C. (2021). Quantitative evaluation indexes of the spatial steering effect of directional perforation hydraulic fractures. Energy Explor. Exploitation 39 (4), 1246–1261. doi:10.1177/01445987211010266
Lu, W. Y., and Huang, B. X. (2020). Mathematical model of methane driven by hydraulic fracturing in gassy coal seams. Adsorpt. Sci. Technol. 38 (3-4), 127–147. doi:10.1177/0263617420919247
Moës, N., and Belytschko, T. (2002). Extended finite element method for cohesive crack growth. Eng. Fract. Mech. 69 (7), 813–833. doi:10.1016/s0013-7944(01)00128-x
Nandlal, K., and Weijermars, R. (2019). Impact on drained rock volume (DRV) of storativity and enhanced permeability in naturally fractured reservoirs: Upscaled field case from hydraulic fracturing test site (hfts), wolfcamp formation, midland basin, west Texas. Energies 12 (20), 3852. doi:10.3390/en12203852
Ogata, S., Yasuhara, H., Kinoshita, N., and Kishida, K. (2020). Coupled thermal-hydraulic-mechanical–chemical modeling for permeability evolution of rocks through fracture generation and subsequent sealing. Comput. Geosci. 7 (7), 1845–1864. doi:10.1007/s10596-020-09948-3
Qi, M. H., Li, M. Z., Guo, T. K., Liu, C., Gao, S., and Tang, S. (2018). Influence of oriented perforation design on refracture reorientation: Simulation and experiment. J. Energy Resour. Technol. 140 (8), 82903. doi:10.1115/1.4039742
Romero, J., Mack, M. G., and Elbel, J. L. (1995). “Theoretical model and numerical investigation of near-wellbore effects in hydraulic fracturing,” in SPE Annual Technical Conference and Exhibition:Drilling and Completion, Houston, USA, October 1995 (Houston, TX: Society of Petroleum Engineers).
Sepehri, J., Soliman, M. Y., and Morse, S. M. (2015). Application of extended finite element method (XFEM) to simulate hydraulic fracture propagation from oriented perforations. Soc. Petroleum Eng. 1 (3), 173342. doi:10.2118/SPE-173342-MS
Sesetty, V., and Ghassemi, A. (2015). A numerical study of sequential and simultaneous hydraulic fracturing in single and multi-lateral horizontal wells. J. Pet. Sci. Eng. 132, 65–76. doi:10.1016/j.petrol.2015.04.020
Shi, J. H., Li, Q. C., Li, Q., and Cheng, Y. F. (2020). Factors affecting reorientation of hydraulically induced fracture during fracturing by oriented perforations in shale reservoirs. China Sci. 15 (5), 528–536.
Sukumar, N., Moës, N., Moran, B., and Belytschko, T. (2000). Extended finite element method for three‐dimensional crack modelling. Int. J. Numer. Methods Eng. 48 (11), 1549–1570. doi:10.1002/1097-0207(20000820)48:11<1549::aid-nme955>3.0.co;2-a
Tang, S. B., Liu, X. J., Luo, J., and Dong, Z. (2017). Theoretical model for tensile and shear crack initiation at the crack tip in rock subjected to hydraulic pressure. Chin. J. Rock Mech. Eng. 36 (9), 2124–2135. doi:10.13722/j.cnki.jrme.2017.0114
Wang, X. M., Chen, P., Rui, Z. H., and Jin, F. (2017). Modeling friction performance of drill string torsional oscillation using dynamic friction model. Shock Vib. 2017, 1–14. doi:10.1155/2017/4051541
Wang, X. L., Shi, F., Liu, C., Lu, D., Liu, H., and Wu, H. (2018). Extended finite element simulation of fracture network propagation in formation containing frictional and cemented natural fractures. J. Nat. Gas Sci. Eng. 15 (5), 528–536. doi:10.1016/j.jngse.2017.12.013
Wang, B., Zhou, F. J., Wang, D. B., Liang, T., Yuan, L., and Hu, J. (2018). Numerical simulation on near-wellbore temporary plugging and diverting during refracturing using XFEM-Based CZM. J. Nat. Gas. Sci. Eng. 55, 368–381. doi:10.1016/j.jngse.2018.05.009
Zhang, G. Q., and Chen, M. (2010). Dynamic fracture propagation in hydraulic re-fracturing. J. Petroleum Sci. Eng. 70 (3-4), 266–272. doi:10.1016/j.petrol.2009.11.019
Zhang, G. Q., and Chen, M. (2010). The relationship between the production rate and initiation location of new fractures in a refractured well. Pet. Sci. Technol. 28 (7), 655–666. doi:10.1080/10916460902804564
Zhang, R. X., Zhang, X. Y., Kang, T. H., and He, F. (2020). Dynamic fracture propagation model for oriented perforation steering fracturing in low permeability reservoir based on microelement method. J. Nat. Gas Sci. Eng. 74, 103105. doi:10.1016/j.jngse.2019.103105
Zhu, W. C., and Tang, C. A. (2004). Micromechanical model for simulating the fracture process of rock. Rock Mech. Rock Eng. 37 (1), 25–56. doi:10.1007/s00603-003-0014-z
Keywords: low-permeability reservoir, directional perforation, hydraulic fracture, steering trajectory, deflection distance
Citation: Lu W, Bai E, Wei L, He C, Sun Y and Shi L (2022) Numerical simulation on spatial steering rule of directional perforation hydraulic fractures in low-permeability reservoir. Front. Earth Sci. 10:1007218. doi: 10.3389/feart.2022.1007218
Received: 30 July 2022; Accepted: 22 August 2022;
Published: 13 September 2022.
Edited by:
Guangyao Si, University of New South Wales, AustraliaReviewed by:
Jiahao Wu, Tsinghua University, ChinaYuqing Bai, Comenius University, Slovakia
Weisheng Du, China Coal Research Institute (China), China
Copyright © 2022 Lu, Bai, Wei, He, Sun and Shi. This is an open-access article distributed under the terms of the Creative Commons Attribution License (CC BY). The use, distribution or reproduction in other forums is permitted, provided the original author(s) and the copyright owner(s) are credited and that the original publication in this journal is cited, in accordance with accepted academic practice. No use, distribution or reproduction is permitted which does not comply with these terms.
*Correspondence: Erhu Bai, MjI4MzIwNDU1MEBxcS5jb20=