 Bai-Zhou Xu1
 Wen-Feng Wang
- 1School of Computer Science and Technology, Hainan University, Haikou, China
- 2Jiyang College, Zhejiang A&F University, Zhuji, China
- 3Xinjiang Institute of Ecology and Geography, Chinese Academy of Sciences, Urumqi, China
- 4University of Chinese Academy of Sciences, Beijing, China
- 5Sino-Belgian Joint Laboratory of Geo-information, Urumqi, China
- 6CAS Research Centre for Ecology and Environment of Central Asia, Urumqi, China
The rapid increase in atmospheric CO2 concentration has caused a climate disaster (CO2 disaster). This study expands the theory for reducing this disaster by analyzing the possibility of reinforcing soil CO2 uptake (Fx) in arid regions using partial least-squares regression (PLSR) and machine learning models such as artificial neural networks. The results of this study demonstrated that groundwater level is a leading contributor to the regulation of the dynamics of the main drivers of Fx–air temperature at 10 cm above the soil surface, the soil volumetric water content at 0–5 cm (R2=0.76, RMSE=0.435), and soil pH (R2=0.978, RMSE=0.028) in arid regions. Fx can be reinforced through groundwater source management which influences the groundwater level (R2=0.692, RMSE=0.03). This study also presents and discusses some basic hypotheses and evidence for quantitively reinforcing Fx.
1 Introduction
The Earth is a complicated system with considerable uncertainties regarding the biotic/abiotic processes in many ecosystems (Caers, 2011). The Earth’s surface temperature is widely recognized to be heavily influenced by greenhouse gases, among which CO2 is the major contributor (Joos et al., 1999). The rapid increase of atmospheric CO2 concentration and the resulting climate disaster (the CO2 disaster) have attracted attention (Mercer, 1978). With the intensification of the CO2 disaster, arid regions are getting more arid and, hence, are facing more serious threats (Huang et al., 2017). The warming trends in arid and semi-arid regions are significantly higher than those in non-arid regions (Schlaepfer et al., 2017). Moreover, the CO2 disaster may reduce the extent of temperate drylands and intensify drought in deep soils, such that approximately 15%–30% of the temperate dry area might be transformed into arid areas by the late 21st century (Schlaepfer et al., 2017). Global warming accelerates not only dryland expansion but also soil CO2 release in some regions (Jenkinson et al., 1991; Huang et al., 2016). Therefore, any possible technologies for reducing the CO2 disaster are worthy of investigation (Murata and Cheolsong, 2008; Edmonds and Smith, 2011).
Since 2006, a series of studies have demonstrated soil CO2 uptake in arid regions (Wang et al., 2015a; Wang et al., 2016a). In the traditional ecological paradigm, soils can only release CO2 (Baldocchi et al., 2001; Wang et al., 2015a). Soil CO2 release was defined as the sum of two organic components: plant root respiration (autotrophic respiration) and soil organic carbon decomposition by soil fauna and soil microbes (Falge et al., 2001; Farifteh et al., 2007; Baldocchi et al., 2015). Many observations of soil CO2 fluxes with both chambers and open- or closed-path eddy systems have highlighted anonymous CO2 uptake (Hastings et al., 2005; Jasoni et al., 2005; Mielnick et al., 2005; Reichstein et al., 2005; Chapin et al., 2006). The components of soil CO2 fluxes are the sum of its inorganic (soil inorganic respiration) and organic (soil organic respiration) components, respectively (Wohlfahrt et al., 2008). Moreover, soil inorganic respiration temporally dominates the net ecosystem exchange of CO2 (Schlesinger, 2001; Kowalski et al., 2008; Inglima et al., 2009; Sanchez-Cañete et al., 2011; Chen et al., 2013). Hence, we are motivated to investigate the possibility of reinforcing soil CO2 uptake to reduce the CO2 disaster. The environmental contributions to the main drivers of soil CO2 uptake and whether such contributions can be reinforced through human activities remain unknown (Chen et al., 2013). However, if possible, soil CO2 uptake not only indicates a hidden carbon cycle loop potentially contributing to the long-sought “missing sink” (Stone, 2008; Xie et al., 2008; Serrano-Ortiz et al., 2010; Ma et al., 2013; Chen et al., 2014; Wang et al., 2015b; Wang et al., 2016b) but also promises an emerging technology to reduce the CO2 disaster (Wang et al., 2016a; Wang et al., 2016b).
The risk of soil salinization in arid regions is increasing due to the combined effects of global warming, drought intensification, and population growth (Utset and Borroto, 2001). Many studies have demonstrated the high sensitivity of arid regions to the CO2 disaster (Gök et al., 2000; Rey et al., 2012; Rey, 2014; Li et al., 2015). However, few studies have addressed the feasibility of reinforcing soil CO2 uptake in these regions (Wang et al., 2015a; Wang et al., 2016a). The utilization of CO2 uptake as a practical technology for reducing the CO2 disaster requires the reliable quantification of environmental influences on the main drivers of soil CO2 uptake and the assessment of the possibility of reinforcing these influences (Wang et al., 2016b). Until now, considerable uncertainties remain regarding the underlining mechanisms of soil CO2 uptake (Wang et al., 2015b; Wang et al., 2016b). Nevertheless, a global model of soil CO2 uptake has been established (Chen et al., 2014), which can be used to expand the theory for reducing the CO2 disaster by analyzing the main drivers involved in the model. The main challenges are as follows. First, since the mechanisms of such CO2 uptake remain undetermined, any possible environmental contributors to these main drivers must be comprehensively considered. Second, since the influencing modes of most environmental controls are not fully understood, their possible interactions cannot be ignored. These two challenges have not been explicitly tackled in previous studies. Addressing these challenges and clarifying the environmental contributors of the main drivers could allow an assessment of the feasibility of artificially enhancing CO2 uptake and the limits of such enhancement. Scientists could then determine whether such enhancements could provide a new method to replace reduced industrial emissions and, ultimately, reduce the CO2 disaster.
Therefore, the objectives of the present study were to 1) examine the leading environmental contributors to the main drivers for soil CO2 uptake in arid regions, 2) evaluate the most interpretable proportion of all considered contributors and determine the need to introduce other environmental contributors, and 3) discuss the feasibility of reinforcing soil CO2 uptake in arid regions by human activities. The organization of this article is as follows. Section 2 illustrates the methods for computing soil CO2 uptake, along with the subsequent regression and machine learning theory. Partial least-squares regression (PLSR) is used to exclude interactions among the considered environmental contributors. A machine learning model (ANN) is used for cross-validation by excluding the secondary contributors. Hypotheses are developed from the PLSR-ANN and discussed in Section 3. We also assess the largest proportions of these contributors in explaining soil CO2 uptake and further clarify their leading roles. In addition, we evaluate the most interpretable proportion of all the contributors considered in the present study and determine whether other contributors need to be involved in subsequent studies. Based on the results from the PLSR-ANN calibrations, Section 4 establishes and discusses the theory of a conceptual framework to reinforce soil CO2 uptake through effective activities in the background of global warming. The conclusions and some outstanding remarks are presented in Section 5.
2 Theory and methodology
2.1 Computation of soil CO2 uptake
Soil CO2 uptake involves not only fluxes of CO2 over the soil surface but also beneath the soil. To compute CO2 fluxes over the soil surface, a PVC column is set to measure CO2 concentration above the soil in a closed chamber. As shown in Eqs 1, 2 in Wang et al. (2016c), the net soil CO2 release (Fc) can be computed by
where r, h, Vpvc, and Spvc are the height, radius volume, and surface area of the PVC column, respectively; ρ is the CO2 density under the standard state; and k is a dynamic transform coefficient.
A temperature-dependent Q10 model has been widely utilized, in which Q10 is the derivative of the exponential chemical reaction-temperature equation originally developed by Van’t Hoff (1898). With Tas defined as the air temperature at 10 cm above the soil surface, θs the soil volumetric water content at 0–5 cm, and R10 the referred Fc at 10°C, then Q10 is the factor by which Fc is multiplied when T increases by 10°C. According to Eqs 1–3 described by Wang et al. (2015b), the part of Fc unexplained by the Q10 model is attributed to the inorganic component of Fc. Alternatively, the soil CO2 uptake (Fx) can be computed by
where Fo and Fi are the organic and inorganic components of Fc, respectively.
Equation 6 can be further reconciled as
where Fxnp and Fxlp are the linear and nonlinear components of Fx, respectively. EVnp and EVlp are the sets of environmental variables for the linear and nonlinear components, respectively.
As seen in Chen et al. (2014), the main drivers for Fx are pH, Tas, θs; thus,
where the pH belongs to EVnp and Tas and θs belong to EVlp.
For computation, the empirical coefficients from Chen et al. (2014) and Wang et al. (2015b) can be directly used. That is,
where Fx is hypothetically attributed as pH-driven, Tas-driven, and θs-driven CO2 uptake by soils.
2.2 PLSR and machine learning theory
Two adaptive methods—partial least-squares regression (PLSR) and a machine learning model (ANN)—were used to examine the environmental contributors of pH, Tas, and θs. Backpropagation was utilized in the machine learning processes with ANN. The performance statistics of the ANN calibration were explicitly displayed and the environmental contributors with relatively small contributions (<5%) were excluded from the ANN model performance. The PLSR model was performed on a random partition of the dataset (70% for training, 30% for testing) and ANN models were assessed against the whole data set. The major steps of the PLSR calibration are shown in Figure 1 (Zhou et al., 2021).
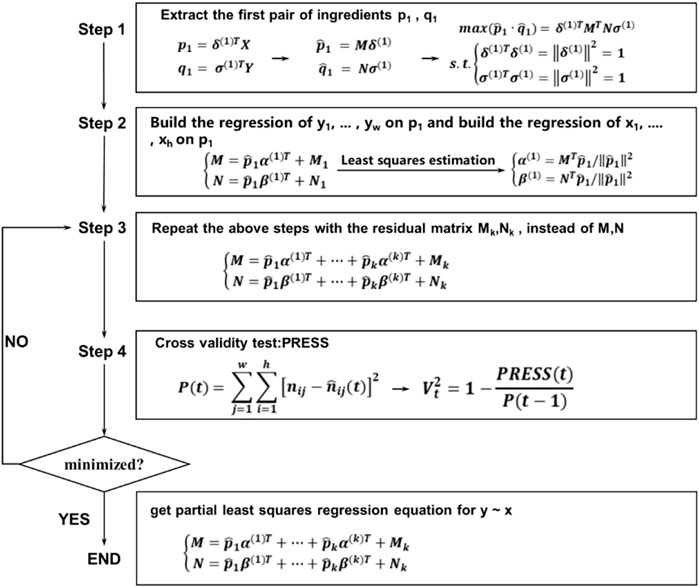
FIGURE 1. Major steps of PLSR calibration. Note: X and Y are the data on environmental variables and soil CO2 uptake respectively. The corresponding matrices of X and Y are M and N, respectively. The corresponding eigenvectors of M and N are δ and σ, respectively. To calculate the coefficients α and β in the principal components from PLSR, we extract as much variation information as possible from each variable group. This is a conditional extremum problem, which is solved using the Lagrange multiplier method.
Six calibration processes were performed during PLSR. The first was the standardization, which was done before Step 1. The second process was to find the correlation coefficient matrix, where X and Y were put into an augmented matrix that was included in Steps 2 and 3. The third process was to find the pair of principal components. This process was included in Step 4, where the Lagrange multiplier method was utilized. The fourth subsequent process involved the calculation of the contribution rate table, in which the contributions of each environmental contributor were determined individually. The fifth process was to select k principal component pairs according to the contribution rate table, which was used in the sixth and seventh processes to carry out the final regressions between environmental contributors and the main drivers for soil CO2 uptake. The eighth process performed cross-validation with the above PLSR components.
However, PLSR also has some limits. PLSR is a linear model, which is advantageous for determining the contributions of individual environmental variables. However, the best model might be nonlinear. Meanwhile, ANN cross-validation is also required to ensure that the selected determining factors from PLSR remain dominant in nonlinear models. The ANN aims to imitate the working mechanisms of the human brain. Neurons are connected to form each layer of the neural network. Each layer transmits information through a function operation running on the connection between each layer. By adjusting the connected weights between each layer, the neural network can output the desired target. This goal needs to be achieved through the training of the neural network, which is within the allowable range of error. The basic information transfer function for the connection between each connection layer is xw + b, where x is the information passed from the previous layer, w is the weight reflecting the relevance, and b is the deviation. As the brain sometimes needs to choose to transmit or ignore received information, neural networks filter information through an activation function. The major steps in ANN for updating parameters are shown in Figure 2 (Zhou et al., 2021; Zhuang et al., 2021).
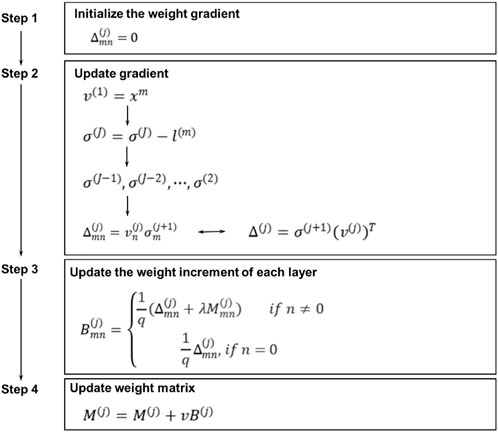
FIGURE 2. Major steps in machine learning processes with ANN. Note: After obtaining a training set, the ANN can extract the features of each part of the observed object by learning. If the training effect is not satisfied, error data will be generated and back-propagated and relevant parameters will be adjusted according to the error value to minimize the target. The parameter adjustment is mainly based on the prediction results of the errors in each layer.
Environmental data-driven PLSR-ANNs were collected from a series of previous studies (Chen et al., 2014; Zhou et al., 2021; Zhuang et al., 2021). The present study further hypothesized that the precipitation amounts (Pa) and groundwater level (GL) were another two elements in EVnp. Based on the results of PLSR and machine learning, the other environmental variables; namely, air humidity (AH), air pressure (AP), soil temperature (Ts), soil salinity (SS), and wind speed (WS) and direction (WD) were included in EVlp. Evidence for the above two hypotheses is presented in Sections 3 and 4. The calibration errors were quantified using R2 and RMSE, as described by Farifteh et al. (2007) and Zhou et al. (2021).
3 Hypotheses and evidence
3.1 Reinforcement of Tas-driven CO2 uptake
According to Eq. 10, soil CO2 uptake can be reinforced by reducing Tas. The reinforcement degree is −0.0059 μmol m−2 s−1 when Tas decreases by 1°C. We hypothesized that Tas was a function of other environmental variables; that is,
The hypothetical mechanisms in the function Tf are as follows. Ts can affect Tas because Ts is a direct reflection of the surface heat condition. Since the volume heat capacity of water is much larger than that of air, AH, GL, WD, WS, Pa, and θs can affect Tas. Decreases in AP indicate that the air above the soil is expanding and Tas is increasing. Since soil water and salt transport can be aggravated by higher Tas, SS and pH are also potential indicators for local Tas. Under these hypotheses, the reinforcement of Tas-driven CO2 uptake is possible if one of the environmental variables AH, AP, Ts, SS, WS, WD, pH, GL, θs, and Pa can be changed through human activities.
The results of the PLSR-ANN analyses present some basic evidence for Eq. 11. As shown in Figure 3, the PLSR results demonstrated the very accurate prediction of Tas by a linear combination of other environmental variables (R2=0.894 and RMSE=2.975 on the training data set, R2=0.939 and RMSE=2.507 on the testing data set). These results were further demonstrated by the ANN (R2=0.924 and RMSE=2.495 before excluding the secondary contributors, R2=0.887 and RMSE=2.966 after excluding the secondary contributors).
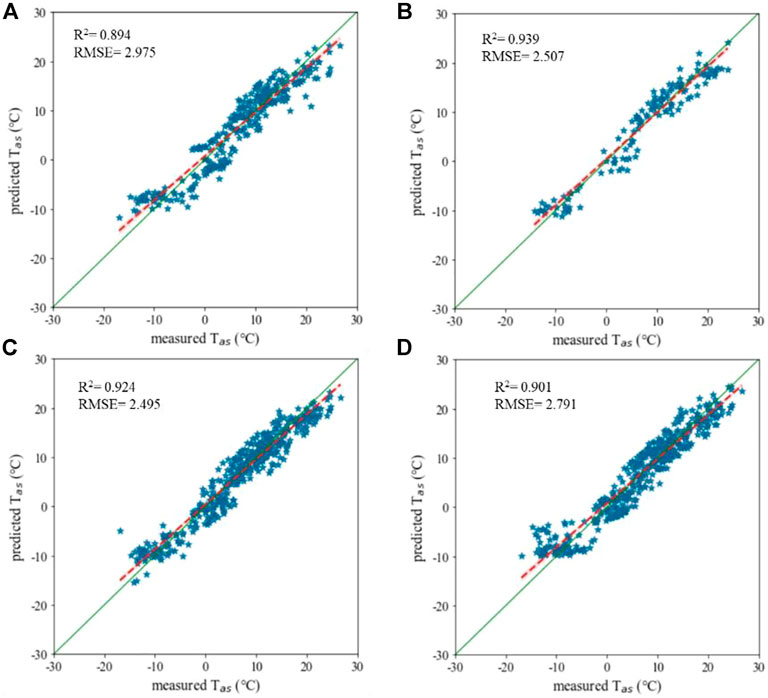
FIGURE 3. Evidence for Eq. 11 from the PLSR training stage (A), testing stage (B), and ANN analyses before excluding the secondary contributors (C) and after excluding the secondary contributors (D). Note: Tas is the air temperature at 10 cm above the soil surface. All other environmental variables are considered potential contributors to Tas.
From the PLSR results, the function Tasf can be approximated by
where the contributions of AH, AP, Ts, SS, WS, WD, pH, GL, θs, and Pa to Tas can be calculated from the coefficients c1, c2, …, c10, in which c0 is the residual.
The computed coefficients for Eq. 12 were c1=−2.0413, c2=−1.4424, c3=2.3231, c4=−1.3964, c5=0.3635, c6=−0.1313, c7=1.6382, c8=−1.9786, c9=0.6742, c10=0. Hence, the leading environmental contributors to Tas were Ts, AH, GL, pH, AP, SS and θs, with contributions to Tas of 19.4%, 17%, 16.5%, 13.7%, 12%, 11.6%, and 5.6%, respectively. Among these leading environmental contributors, GL was significantly affected by human activities and can also influence pH, SS, and θs. Therefore, we can try to reinforce Tas-driven soil CO2 uptake in arid regions through groundwater management, which is associated not only with irrigation decisions but also with living plans and industrial water use. A decrease in GL by 1 m means a Tas reduction of 1.9786°C and a reinforcement of Fx by −0.0117 μmol m−2 s−1 according to Eqs 10, 12.
3.2 Reinforcement of θs-driven CO2 uptake
According to Eq.10, soil CO2 uptake can be reinforced by reducing θs. The reinforcement degree is −0.0003 μmol m−2 s−1 when θs decreases by 1%. We hypothesized that θs was a function of other environmental variables; that is,
The hypothetical mechanisms in the function θsf are as follows. Precipitation and evaporation are the two most important factors influencing θs. Therefore, Pa affects θs. Since Ts and Tas can directly reflect the surface heat conditions, the θs values under different temperatures can vary. Except for precipitation and evaporation, atmospheric environments, soil properties, and surface vegetation also affect θs. Hence, AP, AH, WD, WS, SS, and pH can potentially affect θs. The influence of GL on θs is easily understood. In arid regions, soil water is mainly supplied by groundwater. A decrease in GL can directly induce the decrease of θs. Under these hypotheses, θs-driven CO2 uptake can be reinforced if one of these environmental variables can be changed through human activities.
The results of the PLSR-ANN analyses present some basic evidence for Eq. 13. As shown in Figure 4, the PLSR results suggest that the best linear combination of other environmental variables can only explain about half of the variations in θs (R2=0.552 and RMSE=0.577 on the training data set, R2=0.51 and RMSE=0.663 on the testing data set). However, we cannot conclude that the function θsf in Eq. 13 does not exist. The ANN results suggest that θs can be correctly predicted by a nonlinear combination of the considered environmental variables (R2=0.9 and RMSE=0.274 before excluding the secondary contributors, R2=0.904 and RMSE=0.283 after excluding the secondary contributors).
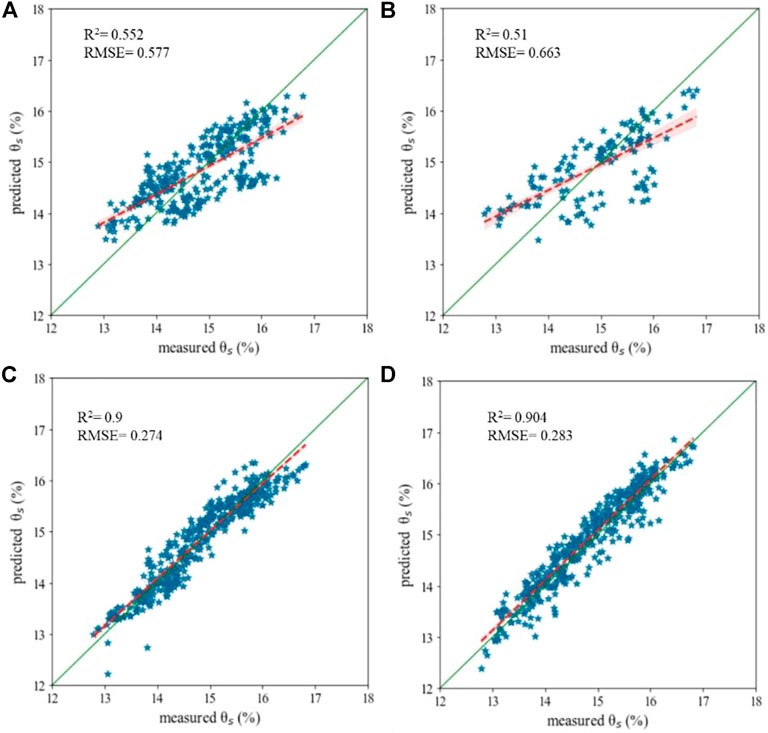
FIGURE 4. Evidence for Eq. 13 from the PLSR training stage (A), testing stage (B), and ANN analyses before excluding the secondary contributors (C) and after excluding the secondary contributors (D). Note: θs is the soil volumetric water content at 0–5 cm. All other environmental variables are considered potential contributors to θs.
From the PLSR results, the function θsf cannot be approximated by
where the computed coefficients from PLSR are c1=−0.1691, c2=−0.0238, c3=0.2133, c4=0.3858, c5=0.0326, c6=−0.102, c7=−0.0202, c8=−0.219, c9=0.1813, c10=0.
These computed coefficients further reveal that the PLSR results are not convincing. Thus, the leading contributors are SS, GL, Ts, Tas, AH, and WD, with contributions to θs of 28.6%, 16.3%, 15.8%, 13.5%, 12.6%, and 7.6%, respectively. While the results are wrong to exclude Pa, we can obtain significant information from the two subfigures in Figures 4C,D. No significant differences in ANN performance were observed before and after excluding the secondary contributors. They were both very robust. Since Eq. 14 excluded WS, AP, pH, and Pa as the second contributors to θs, there must be another important contributor among Ts, Tas, GL, WD, SS, and AH.
Although the ANN results present a very accurate prediction of θs by a nonlinear combination of the considered environmental variables, we cannot determine the best θsf from ANN. Consequently, we are motivated to choose the most important contributor to θs among Ts, Tas, GL, WD, SS, and AH. Since GL can be influenced by human activities and the management of groundwater sources has attracted attention (Daliakopoulos et al., 2005; Wang et al., 2016d; Cruz-Paredes et al., 2021), we prefer to choose GL. As shown in Figure 5, θs fluctuates when GL varies from 65 to 90 m in irrigation seasons.
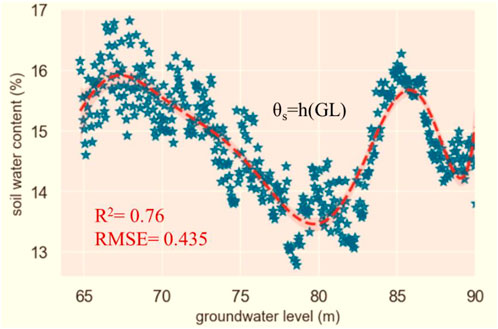
FIGURE 5. Evidence for groundwater level (GL) as a leading variable in Eq. 13 showing evident fluctuations in θs when GL varies from 65 to 90 m in irrigation seasons. Note: function h is an eight-degree polynomial. The coefficients of the 8th, 7th, 6th, 5th, 4th, 3rd, 2nd, and 1st order terms are 3.488e−08, −2.114e−05, 0.005591, −0.8432, 79.32, −4765, 1.786e+05, and −3.815e+06, respectively. The constant is 3.559e+07.
GL is also a well-known factor associated with θs (Buttle, 1989). Irrigation decisions can significantly affect θs and other soil properties (Rawls et al., 1982). In Section 3.1, GL is a suitable controller to reinforce Tas-driven soil CO2 uptake. Benefitting from a suitable plan on water use for living and industry, we can effectively control GL that can, in turn, affect θs. In particular, we can try to reinforce θs-driven soil CO2 uptake in arid regions through proper irrigation decisions and groundwater use plans. Considering Figure 5 as an example, it is easy to see that the relationships between GL and θs are complicated. When GL increased from 68 to 78 m, θs decreased from 15.88% to 13.70%. Thus, an increase in GL at this stage led to a 2.18% decrease in θs, which reinforced Fx by −0.001 μmol m−2 s−1 according to Eqs 10, 13.
3.3 Reinforcement of pH-driven CO2 uptake
According to Eq. 9, soil CO2 uptake can be reinforced by increasing soil pH. Both Tas and θs belong to EVlp, while pH belongs to EVnp. Since Fx(EVnp) is an exponential function, the reinforcement degree of Fx can differ when the pH is increased from different starting points. For example, Fx can be reinforced by −0.7170 μmol m−2 s−1 with a pH increase from 7 to 8. However, when the pH is increased from 8 to 9, the Fx is reinforced by only −0.5467 μmol m−2 s−1.
We can hypothesize that pH is a function of other environmental variables; that is
However, as we learned in Section 3.2, the PLSR-ANN results cannot help us directly identify the leading contributor unless the hypothesized function can be approximated by a linear function. Thus, pHf may be approximated by a linear function. As proper irrigation decisions and groundwater source management have been recommended to reinforce both Tas-driven and θs-driven CO2 uptake, we directly hypothesize that pH is a nonlinear function of GL; that is
The hypothetical mechanisms in the function pHf are as follows. Fluctuation of GL significantly affects soil salt transport, which in turn changes the salt composition of the soil. Since soil pH is majorly influenced by salt composition, pH can be approximated by a nonlinear function of GL. Eq. 16 is proved to be robust (R2=0.978, RMSE=0.028), as shown in Figure 6. Hence, the hypotheses with Eq. 16 are not only reasonable but are also robust in predicting soil pH.
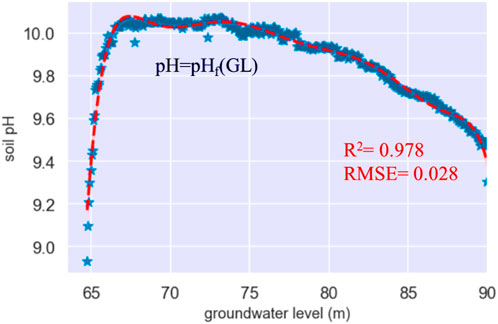
FIGURE 6. Evidence for Eq. 16 showing the close relationship between pH and groundwater level (GL) when GL varies from 65 to 90 m in irrigation seasons. Note: function h is an eighth-degree polynomial. The coefficients of the 8th, 7th, 6th, 5th, 4th, 3rd, 2nd, and 1st order terms are −8.034e−09, −5.022e−06, 0.001371, 0.2137, −20.77, 1291, −5.005e+04, and 1.107e+06, respectively. The constant is −1.07e+07.
Under these hypotheses, pH-driven CO2 uptake can be reinforced through human activities. Similar to the strategies in Sections 3.1 and 3.2, only a suitable plan on water use for living and industry is required to ensure that the GL fluctuations are advantageous for reinforcing soil CO2 uptake. Considering Figure 6 as an example, it is easy to see that the relationships between GL and pH are also complicated. When GL increased from 65 to 70 m, the pH increased from 9.40 to 10.03. Therefore, a GL increase at this stage caused a pH increase of 0.63, leading to a −0.2473 μmol m−2 s−1 reinforcement of Fx according to Eqs 10, 16. However, when GL increased from 70 to 90 m, the pH increased from 10.03 to 9.40. Therefore, a GL increase at this stage caused a decrease in pH of 0.63, which cannot reinforce Fx.
4 Perspectives and discussions
The CO2 disaster has led to global warming and environmental deterioration (Zekai, 2009; Wani et al., 2012). This crisis can further exacerbate violent conflicts in countries and regions over territory or water supply, which lead to energy, ecological, food, and even economic crises (Pimentel et al., 1973; Coyle and Simmons, 2014; Weston, 2014). Protecting the Earth (and ourselves) requires expanding the theory for reducing the CO2 disaster. The mechanisms of CO2 uptake by soils in arid regions are not fully understood. This uptake might be one way for the Earth to repair itself. The present study analyzed whether there is a way for humans to enhance CO2 uptake. As previous studies identified the main drivers of soil CO2 uptake, our analyses focused on the influences of other environmental variables on these drivers. However, precipitation in arid regions is limited and we have not collected sufficient and continuous data to accurately quantify the contributions of Pa to Tas, θs, and soil pH. Both the PLSR and machine learning results in this study suggested GL as a common controller for the main drivers of soil CO2 uptake. Tas, θs, and soil pH may each show changes in groundwater discharge or recharge, which will in turn influence CO2 uptake. Therefore, groundwater source management may be a way to reinforce CO2 uptake by soils in arid regions. There are still considerable uncertainties regarding the influences of Pa and GL on Fx. Their influences on soil CO2 uptake are complicated, as shown in Figure 7.
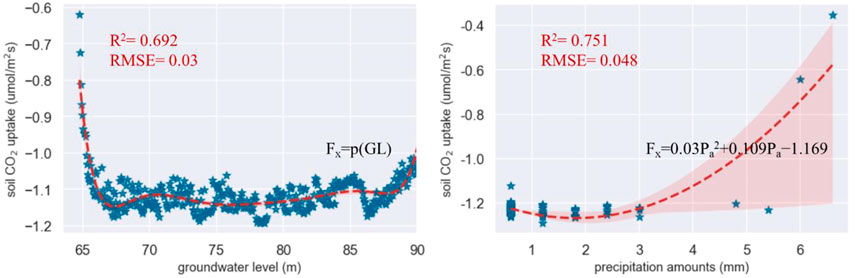
FIGURE 7. Complicated influences of groundwater level (GL) and precipitation amounts (Pa) on soil CO2 uptake (Fx). Note: p is an eighth-order polynomial. The coefficients of the 8th, 7th, 6th, 5th, 4th, 3rd, 2nd, and 1st order terms are 2.658e−09, −1.66e−06, 0.0045, 0.0705, 6.853, −425.8, 1.652e+04, and 3.655e+05, respectively. The constant is 3.535e+06.
Besides the methodology discussed in this study, many other methods have been proposed to regulate Tas, θs, and soil pH. For example, increasing vegetation can shield the direct radiation of the Sun to soil. Because the Tas-driven reinforcement coefficient is almost 20 times that of the θs-driven reinforcement coefficient, there is no need to consider the increase in θs caused by the reduction of Tas. In addition, increased θs is also conducive to the growth of vegetation and photosynthetic CO2 absorption. Meanwhile, the adjustment of soil pH requires a comprehensive consideration of soil conditions. If the soil conditions are good, then increasing vegetation can provide photosynthetic CO2 absorption. In most situations, it is not wise to directly increase soil pH to reinforce soil CO2 uptake. The total reinforcement of photosynthetic CO2 absorption and soil CO2 uptake must be comprehensively considered when making decisions, as shown in Figure 8.
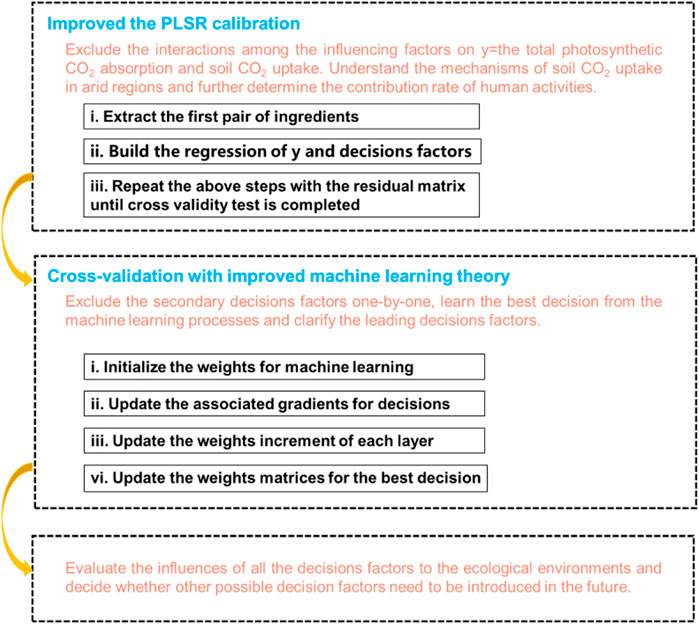
FIGURE 8. Perspective scheme to comprehensively consider the total reinforcement of photosynthetic CO2 absorption and soil CO2 uptake.
The methods in this study allow us to assess soil CO2 uptake on different scales and also minimize the influences on soil structure. If Pt is the period for measurements, the contribution of soil CO2 uptake to reducing CO2concentration can be inferred through Eqs 11–17, as follows:
where dx represents the changes in soil depth and the soil CO2 uptake corresponding to the environmental changes, which can be computed from Eqs 1–10.
The presentation of reliable decisions in Figure 8 requires determining whether the interactions between photosynthetic CO2 absorption and soil CO2 uptake should be involved. The reliable partition of soil CO2 uptake requires improving the current NEE model.
5 Conclusion
Groundwater level is a leading environmental contributor to the main drivers for soil CO2 uptake in arid regions. The reinforcement of soil CO2 uptake through groundwater source management is possible. The results of the PLSR-ANN presented evidence of the theoretical feasibility of reinforcing soil CO2 uptake in arid regions by human activities. Groundwater discharge and recharge can regulate changes in Tas, θs, and soil pH. However, the influences of groundwater are complicated. Meanwhile, we must comprehensively consider the total reinforcement of photosynthetic CO2 absorption and soil CO2 uptake when making decisions. Further expansion of the theory for reducing the CO2 disaster requires further investigation of the need to consider the interactions between photosynthetic CO2 absorption and soil CO2 uptake. Thus, these are the next research priorities.
Data availability statement
The raw data supporting the conclusion of this article will be made available by the authors without undue reservation.
Author contributions
B-ZX was mainly responsible for data collection, code convenience, and paper writing as the core contributor of this paper. X-LL assisted in the completion of experiments and compilation of the data tables. W-FW led the project and conceived the main idea of this research. XC was responsible for guiding the experimental code and language polishing of the paper.
Funding
This research was funded by the National Natural Science Foundation of China (41571299) and the High-level Base-building Project for Industrial Technology Innovation (1021GN204005-A06).
Conflict of interest
The authors declare that the research was conducted in the absence of any commercial or financial relationships that could be construed as a potential conflict of interest.
Publisher’s note
All claims expressed in this article are solely those of the authors and do not necessarily represent those of their affiliated organizations, or those of the publisher, the editors, and the reviewers. Any product that may be evaluated in this article, or claim that may be made by its manufacturer, is not guaranteed or endorsed by the publisher.
References
Baldocchi, D., Falge, E., Gu, L., Olson, R., Hollinger, D., Running, S., et al. (2001). Fluxnet: A new tool to study the temporal and spatial variability of ecosystem–scale carbon dioxide, water vapor, and energy flux densities. Bull. Am. Meteorol. Soc. 82 (11), 2415–2434. doi:10.1175/1520-0477(2001)082<2415:fantts>2.3.co;2
Baldocchi, D., Sturtevant, C., and Contributors, F. (2015). Does day and night sampling reduce spurious correlation between canopy photosynthesis and ecosystem respiration? Agric. For. Meteorol. 207, 117–126. doi:10.1016/j.agrformet.2015.03.010
Buttle, J. M. (1989). Soil moisture and groundwater responses to snowmelt on a drumlin sideslope. J. Hydrology 105 (3), 335–355. doi:10.1016/0022-1694(89)90112-1
Chapin, F. S., Woodwell, G. M., Randerson, J. T., Rastetter, E. B., Lovett, G. M., Baldocchi, D. D., et al. (2006). Reconciling carbon-cycle concepts, terminology, and methods. Ecosystems 9 (710), 1041–1050. doi:10.1007/s10021-005-0105-7
Chen, X., Wang, W. F., Luo, G. P., Li, L. H., and Li, Y. (2013). Time lag between carbon dioxide influx to and efflux from bare saline-alkali soil detected by the explicit partitioning and reconciling of soil CO2 flux. Stoch. Environ. Res. Risk Assess. 27 (3), 737–745. doi:10.1007/s00477-012-0636-3
Chen, X., Wang, W. F., Luo, G. P., and Ye, H. (2014). Can soil respiration estimate neglect the contribution of abiotic exchange? J. Arid. Land 6 (2), 129–135. doi:10.1007/s40333-013-0244-1
Coyle, E. D., and Simmons, R. A. (2014). Understanding the global energy crisis[M]. Purdue University Press.
Cruz-Paredes, C., Tájmel, D., and Rousk, J. (2021). Can moisture affect temperature dependences of microbial growth and respiration?[J]. Soil Biology and Biochemistry, 108223.
Daliakopoulos, I. N., Coulibaly, P., and Tsanis, I. K. (2005). Groundwater level forecasting using artificial neural networks. J. Hydrology 309 (1), 229–240. doi:10.1016/j.jhydrol.2004.12.001
Edmonds, I., and Smith, G. (2011). Surface reflectance and conversion efficiency dependence of technologies for mitigating global warming. Renew. Energy 36 (5), 1343–1351. doi:10.1016/j.renene.2010.11.001
Falge, E., Baldocchi, D., Tenhunen, J., Aubinet, M., Bakwin, P., Berbigier, P., et al. (2001). Seasonality of ecosystem respiration and gross primary production as derived from FLUXNET measurements. Agric. For. Meteorol. 113, 53–74. doi:10.1016/s0168-1923(02)00102-8
Farifteh, J., Meer, F. V. D., Atzberger, C., and Carranza, E. (2007). Quantitative analysis of salt-affected soil reflectance spectra: A comparison of two adaptive methods (PLSR and ANN). Remote Sens. Environ. 110 (1), 59–78. doi:10.1016/j.rse.2007.02.005
Gök, M., Coupé, V. M. H., Berkhof, J., Schulze, E. D., Rebmann, C., Moors, E. J., et al. (2000). Respiration as the main determinant of carbon balance in European forests. Nature 404 (6780), 861–865. doi:10.1038/35009084
Hastings, S. J., Oechel, W. C., and Muhlia-Melo, A. (2005). Diurnal, seasonal and annual variation in the net ecosystem CO2 exchange of a desert shrub community (Sarcocaulescent) in Baja California, Mexico. Glob. Chang. Biol. 11 (6), 927–939. doi:10.1111/j.1365-2486.2005.00951.x
Huang, J. P., Yu, H. P., Dai, A. G., Wei, Y., and Kang, L. (2017). Drylands face potential threat under 2 °C global warming target. Nat. Clim. Chang. 7, 417–422. doi:10.1038/nclimate3275
Huang, J. P., Yu, H. P., Guan, X. D., Wang, G., and Guo, R. (2016). Accelerated dryland expansion under climate change. Nat. Clim. Chang. 6, 166–171. doi:10.1038/nclimate2837
Inglima, I., Alberti, G., Bertolini, T., Vaccari, F. P., Gioli, B., Miglietta, F., et al. (2009). Precipitation pulses enhance respiration of mediterranean ecosystems: the balance between organic and inorganic components of increased soil CO2 efflux[J]. Glob. Change Biol. 15 (5), 1289–1301. doi:10.1111/j.1365-2486.2008.01793.x
Jasoni, R., Smith, S., and Arnone, J. (2005). Net ecosystem CO2 exchange in Mojave Desert shrublands during the eighth year of exposure to elevated CO2. Glob. Chang. Biol. 11 (5), 749–756. doi:10.1111/j.1365-2486.2005.00948.x
Jenkinson, D. S., Adams, D. E., and Wild, A. (1991). Model estimates of CO2 emissions from soil in response to global warming[J]. Nature 351 (6324), 304–306. doi:10.1038/351304a0
Joos, F., Plattner, G. K., Stocker, T. F., Marchal, O., and Schmittner, A. (1999). Global warming and marine carbon cycle feedbacks on future atmospheric CO2[J]. Science 284 (5413), 464–467. doi:10.1126/science.284.5413.464
Kowalski, A. S., Serrano-Ortiz, P., Janssens, I. A., Sanchez-Moral, S., Cuezva, S., Domingo, F., et al. (2008). Can flux tower research neglect geochemical CO2 exchange? Agric. For. Meteorol. 148 (148), 1045–1054. doi:10.1016/j.agrformet.2008.02.004
Li, Y., Wang, Y., Houghton, R. A., and Tang, L. S. (2015). Hidden carbon sink beneath desert. Geophys. Res. Lett. 42 (14), 5880–5887. doi:10.1002/2015gl064222
Ma, J., Wang, Z. Y., Stevenson, B. A., Zheng, X. J., and Li, Y. (2013). An inorganic CO2 diffusion and dissolution process explains negative CO2 fluxes in saline/alkaline soils. Sci. Rep. 3, 2025. doi:10.1038/srep02025
Mercer, J. H. (1978). West antarctic ice sheet and CO2 greenhouse effect: A threat of disaster[J]. Nature 271 (5643), 321–325. doi:10.1038/271321a0
Mielnick, P., Dugas, W. A., Mitchell, K., and Havstad, K. (2005). Long-term measurements of CO2, flux and evapotranspiration in a Chihuahuan desert grassland. J. Arid Environ. 60 (3), 423–436. doi:10.1016/j.jaridenv.2004.06.001
Murata, A., and Cheolsong, L. I. (2008). A modeling analysis of the deployment of energy efficient industrial technologies in China under CO2 emission constraints[J]. J. Jpn. Inst. Energy 87 (87), 938–945. doi:10.3775/jie.87.938
Pimentel, D., Hurd, L. E., Bellotti, A. C., Forster, M. J., Oka, I. N., Sholes, O. D., et al. (1973). Food production and the energy crisis. Science 182 (4111), 443–449. doi:10.1126/science.182.4111.443
Rawls, W. J., Brakensiek, D. L., and Saxtonn, K. E. (1982). Estimation of soil water properties[J]. Trans. Am. Soc. Agric. Eng. 25 (5), 1316–1320.
Reichstein, M., Falge, E., Baldocchi, D., Papale, D., Aubinet, M., Berbigier, P., et al. (2005). On the separation of net ecosystem exchange into assimilation and ecosystem respiration: review and improved algorithm. Glob. Chang. Biol. 11 (9), 1424–1439. doi:10.1111/j.1365-2486.2005.001002.x
Rey, A., Belelli-Marchesini, L., Were, A., Serrano-ortiz, P., Etiope, G., Papale, D., et al. (2012). Wind as a main driver of the net ecosystem carbon balance of a semiarid Mediterranean steppe in the South East of Spain. Glob. Chang. Biol. 18 (2), 539–554. doi:10.1111/j.1365-2486.2011.02534.x
Rey, A. (2014). Mind the gap: non-biological processes contributing to soil CO2 efflux. Glob. Chang. Biol. 21 (5), 1752–1761. doi:10.1111/gcb.12821
Sanchez-Cañete, E. P., Serrano-Ortiz, P., Kowalski, A. S., et al. (2011). Subterranean CO2 ventilation and its role in the net ecosystem carbon balance of a karstic shrubland. Geophys. Res. Lett. 38 (9), 159–164.
Schlaepfer, D. R., Bradford, J. B., Lauenroth, W. K., Munson, S. M., Tietjen, B., Hall, S. A., et al. (2017). Climate change reduces extent of temperate drylands and intensifies drought in deep soils. Nat. Commun. 8, 14196. doi:10.1038/ncomms14196
Schlesinger, W. H. (2001). Carbon sequestration in soils: some cautions amidst optimism. Agric. Ecosyst. Environ. 82 (1-3), 121–127. doi:10.1016/s0167-8809(00)00221-8
Serrano-Ortiz, P., Roland, M., Sanchez-Moral, S., Janssens, I. A., Domingo, F., Godderis, Y., et al. (2010). Hidden, abiotic CO2 flows and gaseous reservoirs in the terrestrial carbon cycle: Review and perspectives. Agric. For. Meteorol. 151 (4), 321–329. doi:10.1016/j.agrformet.2010.01.002
Stone, R. (2008). Have desert researchers discovered a hidden loop in the carbon cycle? Science 320 (5882), 1409–1410. doi:10.1126/science.320.5882.1409
Utset, A., and Borroto, M. (2001). A modeling-GIS approach for assessing irrigation effects on soil salinisation under global warming conditions. Agric. Water Manag. 50 (1), 53–63. doi:10.1016/s0378-3774(01)00090-7
Wang, W. F., Chen, X., and Pu, Z. (2015). Negative soil respiration fluxes in unneglectable arid regions. Pol. J. Environ. Stud. 24 (2), 905–908. doi:10.15244/pjoes/23878
Wang, W. F., Chen, X., Wang, L., Zhang, H., Yin, G., and Zhang, Y. (2016). Approaching the truth of the missing carbon sink. Pol. J. Environ. Stud. 25 (4), 1799–1802. doi:10.15244/pjoes/62357
Wang, W. F., Chen, X., Zhang, H., Jing, C., Zhang, Y., and Yan, B. (2015). Highlighting photocatalytic H2-production from natural seawater and the utilization of quasi-photosynthetic absorption as two ultimate solutions for CO2 mitigation. Int. J. Photoenergy, 1–11. Article ID: 481624. doi:10.1155/2015/481624
Wang, W. F., Chen, X., and Zhang, H. W. (2016). Intelligence in ecology: How internet of things expands insights into the missing CO2 sink. Scientific Programming, 589723.
Wang, W. F., Chen, X., and Zhang, H. W. (2016). Soil CO2 uptake in deserts and its implications to the groundwater environment. doi:10.3390/w8090379Water
Wang, W. F., Chen, X., Zhang, Y. F., Yu, J., Ma, T., Lv, Z., et al. (2016). Nanodeserts: A conjecture in nanotechnology to enhance quasi-photosynthetic CO2 absorption. Int. J. Polym. Sci. 2016, 1–10. Article ID 5027879. doi:10.1155/2016/5027879
Wani, S A, Asif, M, and Lone, S (2012). Global warming and its impact on environment.[J]. J. Indian Med. Assoc. 111 (6), 376–376.
Wohlfahrt, G., Fenstermaker, L. F., and Arnone, J. A. (2008). Large annual net ecosystem CO2 uptake of a Mojave Desert ecosystem. Glob. Change Biol. 14 (7), 1475–1487. doi:10.1111/j.1365-2486.2008.01593.x
Xie, J. X., Li, Y., Zhai, C. X., Li, C., and Lan, Z. (2008). CO2 absorption by alkaline soils and its implication to the global carbon cycle. Environ. Geol. 56 (5), 953–961. doi:10.1007/s00254-008-1197-0
Zekai, Şen. (2009). Global warming threat on water resources and environment: A review. Environ. Geol. 57, 321–329. doi:10.1007/s00254-008-1569-5
Zhou, J. L., Li, X. Q., and Wang, W. F. (2021). Analysis of environmental controls on the quasi-ocean and ocean CO2 concentration by two intelligent algorithms. Mathematical Problems in Engineering, 6666139.
Keywords: CO2 disaster, partial least-squares regression (PLSR), artificial neural network (ANN), desert systems, environmental controls
Citation: Xu B-Z, Li X-L, Wang W-F and Chen X (2022) Expanding the theory for reducing the CO2 disaster—Hypotheses from partial least-squares regression and machine learning. Front. Earth Sci. 10:1004920. doi: 10.3389/feart.2022.1004920
Received: 27 July 2022; Accepted: 22 August 2022;
Published: 12 September 2022.
Edited by:
Faming Huang, Nanchang University, ChinaReviewed by:
Ouarda Assas, University of Batna 2, AlgeriaSateesh Hosamane, KLE Dr. M.S. Sheshgiri College of Engineering and Technology, India
Hao Zhang, Beijing Institute of Technology, China
Copyright © 2022 Xu, Li, Wang and Chen. This is an open-access article distributed under the terms of the Creative Commons Attribution License (CC BY). The use, distribution or reproduction in other forums is permitted, provided the original author(s) and the copyright owner(s) are credited and that the original publication in this journal is cited, in accordance with accepted academic practice. No use, distribution or reproduction is permitted which does not comply with these terms.
*Correspondence: Wen-Feng Wang, d2FuZ3dlbmZlbmdAbmltdGUuYWMuY24=; Xi Chen, Y3hAbXMueGpiLmFjLmNu