- 1Institute of Geography, Fujian Normal University, Fuzhou, China
- 2Fujian Provincial Engineering Research Centre for Monitoring and Assessing Terrestrial Disasters, Fujian Normal University, Fuzhou, China
- 3Fujian Provincial Key Laboratory for Plant Eco-Physiology, Fujian Normal University, Fuzhou, China
- 4State Key Laboratory of Desert and Oasis Ecology, Xinjiang Institute of Ecology and Geography, Chinese Academy of Sciences, Urumqi, China
- 5Nuclear and Radiation Safety Center, Beijing, China
- 6Northwest Institute of Eco-Environment and Resources, Chinese Academy of Sciences, Lanzhou, China
- 7College of Resources and Environmental Sciences, Tibet Agriculture and Animal Husbandry University, Nyingchi, China
A component of terrestrial water storage, vegetation is also an influential driver of changes in terrestrial water storage. In the context of warming on the Tibetan Plateau, it is essential to explore the relationship between changes in terrestrial water storage and vegetation in this region to understand further the role of vegetation in the changes of water systems in alpine mountains. Our study combines terrestrial water storage anomalies data and vegetation indices to determine how their interact. The results indicate a warming rate of 0.44°C/decade (p<0.01) over the Tibetan Plateau from 1980–2020, while evapotranspiration trended upward (12.9 mm/decade, p<0.01), which is slower than precipitation (15 mm/decade, p<0.01). On the Tibetan Plateau, spatial-temporal differences in temperature, precipitation, and evapotranspiration dominate the variations in terrestrial water storage. The change in terrestrial water storage was relatively stable from 2003 to 2011, but decreased from 2012 to 2016. Terrestrial water storage increased in endorheic basins while decreasing in exorheic basins. Partial correlation analysis indicates a negative correlation between the terrestrial water storage anomaly and the temperature. It is found that terrestrial water storage and net precipitation are positively correlated in the Yangtze River Basin and the northeast of the endorheic basins. However, the Qaidam Basin and the north part of the Yellow River Basin are negatively correlated. Under the current climate change state (the increased rate of precipitation is faster than actual evapotranspiration), vegetation change has an insignificant impact on the changes in terrestrial water storage. In contrast, changes in terrestrial water storage (surplus/deficit) significantly affect vegetation changes (greening/browning) in parts of the Tibetan Plateau. The study contributes to a deeper understanding of the relationship between water system changes and vegetation on the Tibetan Plateau.
1 Introduction
The Tibetan Plateau is known as the " Asian Water Towers " because it has substantial both solid water resources (mainly glaciers and snow) and liquid water resources (mostly lake water). In the context of global warming, the Tibetan Plateau is undergoing a decrease in solid water storage and an increase in liquid water storage (Yao et al., 2022; Xiong et al., 2019). Essentially, glacier retreat, snow melt, and permafrost degradation are only transitions in water body states and do not affect the overall terrestrial water storage changes on the Tibetan Plateau. Temperature, evapotranspiration, and runoff have increased, resulting in glaciers and snow melt water loss. These factors contribute to an imbalance in water storage on the Tibetan plateau.
Terrestrial water storage (TWS) is a crucial indicator for quantitatively assessing the dynamics of the regional water balance, which consists of glaciers, snow, soil moisture, groundwater, surface water (rivers and lakes), and vegetation canopy water (Syed et al., 2008). Global warming has resulted in glacier retreat, snow melt, permafrost degradation, and lake expansion on the Tibetan Plateau, significantly affecting terrestrial water storage (Che et al., 2019; Wang et al., 2018). Assessing water balance changes on the Tibetan Plateau based on traditional hydrological methods has considerable uncertainty because of the region’s large gap in hydro-meteorological observations (Kang et al., 2020), especially in the endorheic basins. The development and advancement of remote sensing monitoring technologies in the last 2 decades, especially the Gravity Recovery and Climate Experiment (GRACE) gravity satellite launched in March 2002 and the GRACE second-generation satellite GRACE Follow On (GRACE-FO) in May 2018, have provided the opportunity to monitor terrestrial water storage changes (Sun et al., 2014; Pokhrel et al., 2021).
Since its launch, the GRACE gravity satellite has been widely used to study the terrestrial water storage changes on the Tibetan Plateau and surrounding areas (Matsuo and Heki, 2010; Long et al., 2014). There are apparent spatial differences in terrestrial water storage changes on the Tibetan Plateau (Li et al., 2022). The decrease in terrestrial water storage in the southern part of the Tibetan Plateau is caused by rising temperatures and decreasing precipitation (Jacob et al., 2012; Wang et al., 2020). Terrestrial water storage increased in the Sanjiangyuan area due to soil moisture rising (Meng et al., 2019), but surface water storage in the region is declining (Liu et al., 2020). The southeastern part of the Tibetan Plateau shows an overall decreasing trend in terrestrial water storage (-2.4 mm/a), especially the region’s most severe water storage deficit in the Salween River basin (Zhu et al., 2020). Terrestrial water storage in the inner Tibetan Plateau is on the rise, with the increase in lake water storage being the main contributor in terms of water storage components (Song et al., 2015; Zhang et al., 2019) and the increase in precipitation in terms of the water cycle (Deng et al., 2018; Meng et al., 2019).
The southeastern part of the Tibetan Plateau has high vegetation cover and is an area of forest distribution. In contrast, the central and northwestern parts have low vegetation cover and are areas of scrub or herbaceous distribution. The change in vegetation to either greening or browning in the context of warming of the Tibetan Plateau (Shen et al., 2013; Cai et al., 2015; Zhang et al., 2017) will have a significant impact on terrestrial water storage: firstly, vegetation canopy water is a component of terrestrial water storage; secondly, changes in vegetation transpiration will also affect evapotranspiration. Thus, it is necessary to clarify the interaction between changes in terrestrial water storage and changes in vegetation on the Tibetan Plateau due to global warming. It will contribute to a better understanding of the mechanisms underlying changes in terrestrial water storage on the Tibetan Plateau. However, this aspect has received little attention in the current research.
Therefore, based on the changes in temperature, precipitation, and evapotranspiration of the Tibetan Plateau, this study analyses the terrestrial water storage changes. Then explains the interrelationship between terrestrial water storage changes and vegetation. It answers whether there is an interactive feedback mechanism between terrestrial water storage changes and vegetation changes on the Tibetan Plateau. Section 2 describes the study area, data, and methods; Section 3 includes temperature, precipitation, evapotranspiration, and terrestrial water storage changes before examining the mechanisms explaining terrestrial water storage change and vegetation change. Section 4 provides detailed discussions, and Section 5 presents the conclusions.
2 Data and methods
2.1 Study area
The Tibetan Plateau covers an area of about 254 × 104 km2 and is the highest plateau in the world, with an average altitude of more than 4,000 m (Figure 1A). The Tibetan Plateau has a wide distribution of solid water resources (mainly glaciers, snow, and permafrost) and large liquid water reserves (especially lake water). It is the source of many major rivers in Asia, including the Yellow, Yangtze, Lancang- Mekong, Ganges, and Indus rivers. As a result, it is known as the “Asian Water Towers.” The average annual temperature of the Tibetan Plateau is about 6.1°C, with the average temperature in summer being above 15°C and the average temperature in winter below -5°C (Figure 1B). The average annual precipitation on the plateau is about 596 mm, with rainfall mainly occurring between May and September (Figure 1C).
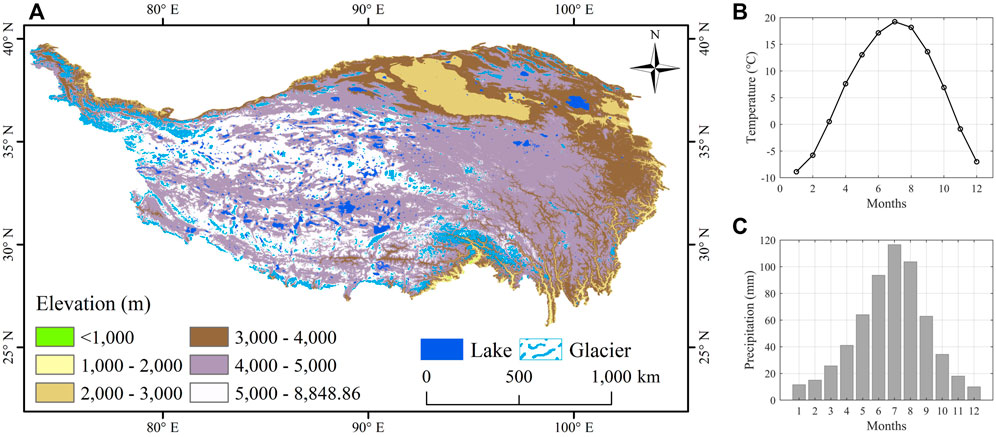
FIGURE 1. Study area (A), boundary data for the Tibetan Plateau provided by the Global Change Science Research Data Publishing System (http://www.geodoi.ac.cn/WebCn/doi.aspx?Id=135), glacier vector data from the National Center for Glacial Permafrost Desert Science and Data (http://www.ncdc.ac.cn)[33], and lake data from Wan et al. (2016)[34]. (B–C) Mean monthly temperature and precipitation based on the CN05.
2.2 Data sources
2.2.1 Climate data
Temperature and precipitation datasets were obtained from the China National Meteorological Information Center (CNMIC, https://data.cma.cn/). The period covered from January 1961 to December 2020, with a spatial resolution of 0.5° × 0.5° (CN05). The accuracy of the CN05 dataset was assessed using strict quality control, which included cross-validation and error analysis. We calculated the temperature and precipitation for winter (December; January and February the following year), spring (March-May), summer (June-August), and autumn (September-November). The seasonal division here refer to Cai’s result (Cai et al., 2017).
Evapotranspiration (ET) and vegetation transpiration data were collected from the Global Land Evaporation Amsterdam Model (GLEAM v3.5; https://www.gleam.eu/), which is based on satellite and reanalysis data (ERA5 net radiation and air temperature) and has a temporal span of January 1980- December 2020, with a spatial resolution of 0.25°.
2.2.2 Vegetation index
The Normalized Difference Vegetation Index-third generation (NDVI) data using the Global Inventory Monitoring and Modeling System (GIMMS), GIMMS NDVI 3 g (https://ecocast.arc.nasa.gov/data/pub/gimms), with the time range of 1981–2015, spatial resolution 1/12° (roughly 8 km). In this study, NDVI data for 2002–2015 is used to reveal the vegetation index variation characteristics of the Tibetan Plateau. NDVI <0.3, represent low coverage; 0.3 ≤ NDVI <0.5, moderate coverage; 0.5 ≤ NDVI, high coverage.
2.2.3 GRACE data
In this study, the GRACE Level-2 data was released by the University of Texas Center for Space Studies (UTCSR, http://www2.csr.utexas.edu/grace/) for April 2002- June 2017 from the mass concentration blocks (Mascons) method, with a spatial resolution of 0.25°. The dataset comprised data from 183 months with 20 missing values (June-2002, July-2002, July-2003, January-2011, June-2011, May-2012, October-2012, March-2013, August-2013, September-2013, February-2014, July-2014, December-2014, June-2015, October-2015, November-2015, April-2016, September-2016, October-2016, and February-2017). The missing values of terrestrial water storage anomaly (TWSA) were filled using the multiyear mean of a missing month and the TWSA of its nearest month (Long et al., 2015).
2.3 Methodology
2.3.1 Terrestrial water storage calculations
The GRACE twin satellites, launched in March 2002, collaborate with the US space agencies (NASA) and the German aerospace center (DLR). The satellites use a precise microwave ranging system, based on the satellite-to-satellite tracking in the low-low model (SST-LL), to measure the distance between themselves due to gravitational acceleration. Onboard GPS instruments determine the exact position of the satellites over the Earth. The GRACE measures changes in Earth’s gravity field, which after deducting tidal effects (including sea tides, solid tides, and polar tides generated by the Earth’s rotation), as well as non-tidal atmospheric and oceanic effects, the signal changes largely reflect changes in total water storage on the seasonal scale (Rodell and Famiglietti, 1999).
In this study, the monthly TWS anomaly (TWSA) data of GRACE RL06 Mascon solutions (version 02) from the Center for Space Research (CSR RL06 v02). The solutions with all the appropriate corrections applied (ellipsoidal correction, C20, degree 1, GIA, etc.) in 0.25° grids. The ellipsoidal correction of CSR RL06 v02 for mass anomaly grid representation has been applied as described by Ditmar (2018). The C20 (degree two order 0) coefficients are replaced with the C20 solutions from satellite laser ranging (SLR) (Loomis et al., 2019) for consistency with all the other solutions. The degree-1 coefficients (Geocenter) corrections are applied using the estimates in TN-13a (available at https://podaac-tools.jpl.nasa.gov/drive/files/allData/grace/docs/TN-13_GEOC_CSR_RL06.txt). A glacial isostatic adjustment (GIA) correction has been applied based on the model ICE6G-D (Peltier et al., 2018). On this basis, the TWSA in the endorheic of the Tibetan Plateau during March 2002-June 2017 (the basis period of anomaly is January 2004-December 2009, and the observation series of this period without missing value) is obtained, and then to analyze the seasonal and interannual variations of TWSA.
2.3.2 Net precipitation calculation
Net precipitation is a key hydrological variable directly related to water resources. The net precipitation (net pre) is equal to the precipitation (P) minus the evapotranspiration (ET) (Equation 1). As precipitation data for the CN05 are spatially resolved at 0.5°, evapotranspiration data are spatially resolved at 0.25°, so we resample the evapotranspiration data to 0.5° here. Resampling is performed here using Matlab’s griddata function.
Where net pre represents net precipitation (mm), P is precipitation (mm), and ET is evapotranspiration (mm).
2.3.3 Trend rate estimate
In this study, we applied the Mann-Kendal (M–K) nonparametric method to detect trends of temperature, precipitation, evapotranspiration, transpiration, and NDVI in the Tibetan Plateau. Furthermore, the trend rate was estimated using Sen’s (1968) nonparametric trend estimator.
3 Results
3.1 Recent climate change in Tibetan Plateau
In this study, we first analyze the climate change (including temperature, precipitation, and evapotranspiration) in the Tibetan Plateau during 1961–2020 due to climate warming being the main driving force for changes in TWSA on the Tibetan Plateau. Figure 2A shows that the warming rate of temperature was 0.35°C/decade (p<0.01) during 1961–2020, while it reached 0.44°C/decade (p<0.01) during 1981–2020, which was nearly 0.1°C/decade faster. The results of the Tibetan Plateau temperature anomalies (the basis period of anomaly is 1981–2010) during the past 60 years indicate that the anomalies were negative before 1990 and positive after 2000 (Figure 2A). The anomaly in the 1960s was about -1°C while it reached 1°C in the 2010 s, indicating that the average temperature of the Tibetan Plateau has increased by 2°C in recent 60 years.
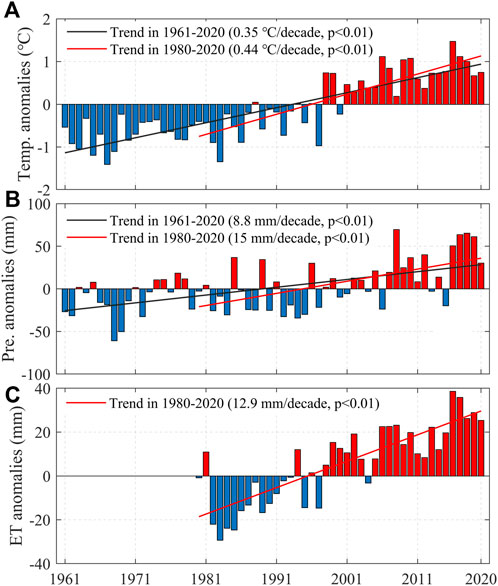
FIGURE 2. The anomalies of climate variables in the Tibetan Plateau from 1961 to 2020, (A) temperature anomalies, (B) precipitation anomalies, and (C) evapotranspiration (ET) anomalies (from 1980 to 2020). The base period of anomalies is 1981–2010.
Precipitation has also increased on the Tibetan Plateau over the past 60 years. The precipitation anomaly was mainly negative before 1990 and positive after 1990 (Figure 2B). The increased rate of precipitation is 15.0 mm/decade (p<0.01) from 1980 to 2020 was nearly twice as fast as that from 1961 to 2020 (8.8 mm/decade, p<0.01). The increased water vapor content caused by temperature rise is essential for the annual average precipitation increase over the Tibetan Plateau. At the same time, it has also been pointed out that there are significant spatial differences in precipitation on the Tibetan Plateau (Yao et al., 2022), with a decrease in precipitation in the monsoon-controlled southern and southeastern exorheic river basin and an increase in precipitation in the westerly-controlled northwestern endorheic basin (Zhu et al., 2019). Meanwhile, the evapotranspiration on the Tibetan Plateau shows an increasing trend (12.9 mm/decade, p<0.01) during the period 1980–2020 (Figure 2C), which is slower than the rate of increase in precipitation during the same period.
The trend rates of temperature, precipitation, and evapotranspiration for different climatic periods are shown in Table 1. The results showed that the temperature warming rate was 0.17°C/decade (p<0.05) in 1961–1990 and 0.23°C/decade (p<0.05) in 1971–2000, respectively, while the precipitation increased or decreased is insignificant. During the period 1981–2010, the temperature warming rate reached 0.59°C/decade (p<0.01), and the precipitation increase rate was 13.4 mm/decade (p<0.05). The rapid increase in temperature during this period accelerated the increase in evapotranspiration to 16.5 mm/decade (p<0.01), which exceeded the increase in precipitation. During the period 1991–2020, the warming rate of temperature was 0.44°C/decade (p<0.01), the rate of increase in precipitation reached 26.9 mm/decade (p<0.01), and the rate of increase in evapotranspiration slowed down (11.4 mm/decade, p<0.01). The rapid increase in precipitation during this period slowed the rate of warming during this period, which in turn affected the changes in evapotranspiration.

TABLE 1. The average values and trend rates (per decade) of temperature (°C), precipitation (mm), and actual evapotranspiration (mm) in different periods of the Tibetan Plateau.
The average temperature of the Tibetan Plateau increased steadily in all seasons, but the warming rates of different seasons differed in different periods (Figures 3A,B). During 1961–1990, the warming rates of winter and autumn were higher than in spring and winter. The warming rates of summer and autumn were faster than winter and spring from 1971 to 2000. During 1981–2010, the warming rate exceeded 0.4°C/decade, more than other periods, especially in winter, nearly to 0.8°C/decade. During 1991–2020, the warming rate in winter and autumn exceeded 0.6°C/decade faster than in spring and summer (<0.4°C/decade).
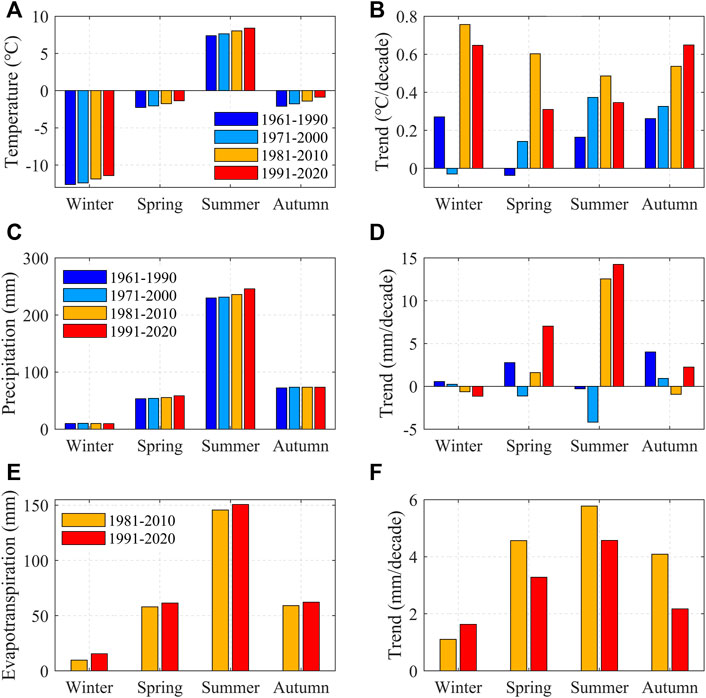
FIGURE 3. Seasonal changes of climate variables in the Tibetan Plateau. From left to right: results for averaged value and trend. From top to bottom: results for temperature (A–B), precipitation (C–D), and evapotranspiration (E–F).
The mean summer precipitation on the Tibetan Plateau has steadily risen over the four climatic periods, while the other season’s precipitation has remained relatively stable (Figure 3C). During 1961–1990, except for a slight decrease in summer precipitation, the other seasons showed an upward trend (Figure 3D). Precipitation increased in winter and autumn from 1971–2000 but declined in spring and summer. Meanwhile, precipitation increased in spring and summer but decreased in winter and autumn from 1981 to 2010. From 1991 to 2020, except for winter, which showed a slightly declining trend, all other seasons showed an upward trend, especially summer, nearly 15 mm/decade. Therefore, precipitation increased on the Tibetan Plateau in summer but decreased in winter.
In the context of increasing temperature and precipitation, the actual evapotranspiration on the Tibetan Plateau also tends to rise (Figure 3E). The actual evapotranspiration for all seasons on the Tibetan Plateau in 1991–2020 is higher than in 1981–2010 (Figure 3F). However, the increasing trend of evapotranspiration in 1991–2020 is slower than in 1981–2010, except for winter, which is faster than in 1981–2010.
There are apparent seasonal differences in the changes in precipitation and actual evapotranspiration under the ongoing warming of the Tibetan Plateau. The increasing trend of precipitation in spring and summer is greater than the rising rate of actual evapotranspiration, while it is the opposite in autumn and winter. Therefore, it will aggravate the water storage deficit in the winter half-year on the Tibetan Plateau.
3.2 TWSA changes in Tibetan Plateau
The changes in TWSA on the Tibetan Plateau have noticeable stage differences (Figure 4A). From 2003 to 2012, the changes in TWSA were relatively stable, with positive anomalies in summer and autumn and negative anomalies in winter and spring; from 2012 to 2016, annual and seasonal variations of TWSA showed a downward trend. The results in Figure 4B show that the seasonal TWSA has a corresponding good relationship with net precipitation. The net precipitation in June-September is positive, and the connected water storage is positive. In contrast, the net precipitation from October to the following January is negative, but the TWSA in these 4 months is also positive due to the summer’s surplus effect of summer positive TWSA. From February to April, the net precipitation was negative, the corresponding TWSA was negative, and the net precipitation in May was favorable. The TWSA was negative, mainly affected by the winter’s deficit effect in winter negative TWSA. Therefore, in general, the response of terrestrial water storage changes to net precipitation is leg 1–3 months over the Tibetan Plateau.
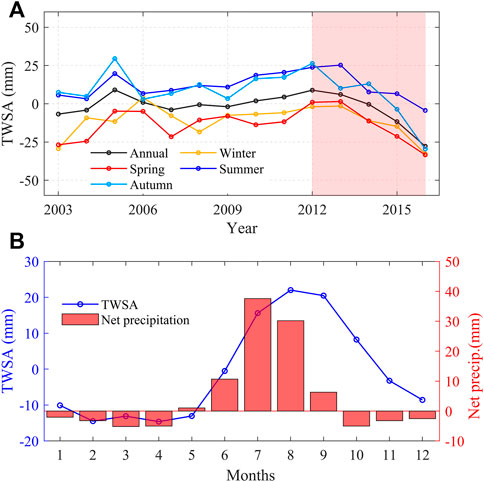
FIGURE 4. The TWSA in the Tibetan Plateau from 2003 to 2016. (A) is annual and seasonal TWSA, and (B) is monthly TWSA and net precipitation (precipitation minus actual evapotranspiration). The anomalies base period of TWSA and net precipitation is between January 2004 and December 2009.
Figure 5A shows that the TWSA negative anomalies occurred in the southern and eastern parts of the Tibetan Plateau and the southern part of the endorheic basin. The most significant negative anomalies in TWSA at the Yarlung Zangbo River bend. The northern part of Inner TP and Qaidam basin are positive anomalies in TWSA. According to the results of Figure 4A, the whole study period can be divided into two stages: 2003–2011 and 2012–2016. From 2003 to 2011, the spatial range of positive and negative anomalies in TWSA was similar (Figure 5B). However, from 2012 to 2016, the spatial range of positive anomalies in TWSA was narrowed to the endorheic basin, while most region of the Tibetan Plateau was a negative anomaly, especially at the Yarlung Zangbo River bend, which reached -500 mm (Figure 5C). Similarly, seasonal TWSA also shows the same spatial pattern (Supplementary Figure S1). This indicates that the extent and scope of the TWSA deficit are increasing on the Tibetan Plateau, reflecting the increasingly profound impact of climate warming on the water system on the Tibetan Plateau.

FIGURE 5. The spatial pattern of average annual TWSA in the Tibetan Plateau. (A) is averaged TWSA in 2003–2016, (B) is averaged TWSA in 2003–2011, and (C) is averaged TWSA in 2012–2016.
The spatial pattern of the annual (Figure 6A1) and seasonal (Figures 6B1–E1) TWSA variation is consistent, both showing an increase in the endorheic basins and a decrease in the exorheic basins. We calculate the TWSA relationship with temperature and net precipitation using partial correlation analysis. In addition, we resample TWSA data to 0.5° since temperature and net precipitation have a 0.5° spatial resolution. The partial correlation analysis result shows that the negative correlation between annual TWSA and temperature in the Tibetan Plateau, except for the endorheic basin (Figure 6A2). Figure 6A3 indicated that the positive correlation between annual TWSA and net precipitation in the Yangtze River basin and the northeastern part of the endorheic basins. In contrast, a negative correlation is found between the Qaidam Basin and the north part of the Yellow River basin (Figure 6A3). In winter, the TWSA positively correlates with temperature (Figure 6B2) and net precipitation (Figure 6B3) in the exorheic basins. In contrast, those in the endorheic basins and the Qaidam Basin negatively correlate with net precipitation. In spring, the change of TWSA is negatively correlated with temperature in most regions of the Tibetan Plateau (Figure 6C2), except for the northeastern endorheic basins and the western part of the Qaidam Basin. In summer, the variation of TWSA in the endorheic zone is positively correlated with temperature (Figure 6D2), while it is positively correlated with net precipitation in the exorheic basins (Figure 6D3). In autumn, the decreasing TWSA region has a significant negative correlation with temperature (Figure 6E2), and the increasing TWSA region positively correlates with temperature and net precipitation (Figure 6E3). Overall, temperature determines the spatial pattern of TWSA variations, as plateau warming accelerates the retreat of the cryosphere, changes in precipitation types, and vegetation changes, which in turn drive changes in TWSA.
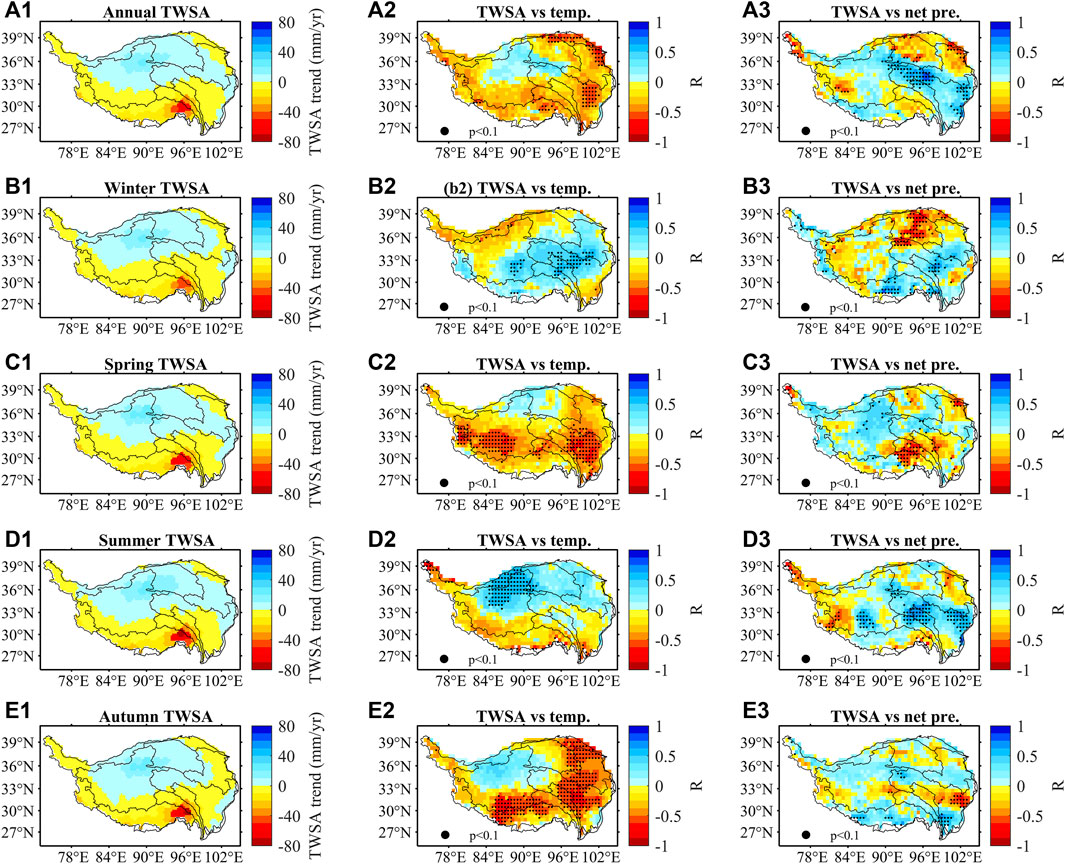
FIGURE 6. The spatial pattern of TWSA changes across the Tibetan Plateau from 2003 to 2016. From left to right: results for TWSA changes, the partial correlation between TWSA and temperature, and partial correlation between TWSA and net precipitation. From top to bottom: results for Annual, winter, spring, summer, and autumn. The black dots represent significance at the 0.1 confidence level (p < 0.1).
The warming rate over most regions of the Tibetan Plateau exceeded 0.04°C/yr from 2000 to 2019 and even exceeded 0.06°C/yr (Figure 7A). During this period, increasing precipitation in most regions (Figure 7B), including the Yangtze River basin, Yellow River basin, Qilian Mountains, and the western and northern parts of the endorheic basins, while decreasing precipitation was observed in the southeastern part of the endorheic basins, Yarlung Zangbo River Basin, and the Hengduan Mountains. The evapotranspiration in most areas of the Tibetan Plateau shows an increasing trend. In contrast, the endorheic zone, the Yellow River, and the Yangtze River Basin show a decreasing trend (Figure 7C). Net precipitation (precipitation minus actual evapotranspiration) increases mainly in the Yellow River and Yangtze River basins and the western part of the endorheic basins (Figure 7D) due to the increase in precipitation and decrease in evapotranspiration. The reduction in net precipitation in the southern part of the Tibetan Plateau, the Hengduan Mountains, the Yarlung Zangbo River Basin, and the eastern part of the endorheic basins is mainly due to the decrease in precipitation. The reduction in net precipitation in the Qaidam Basin and the northeastern part of the endorheic basins is due to the increase in evapotranspiration that exceeds the increase in precipitation.
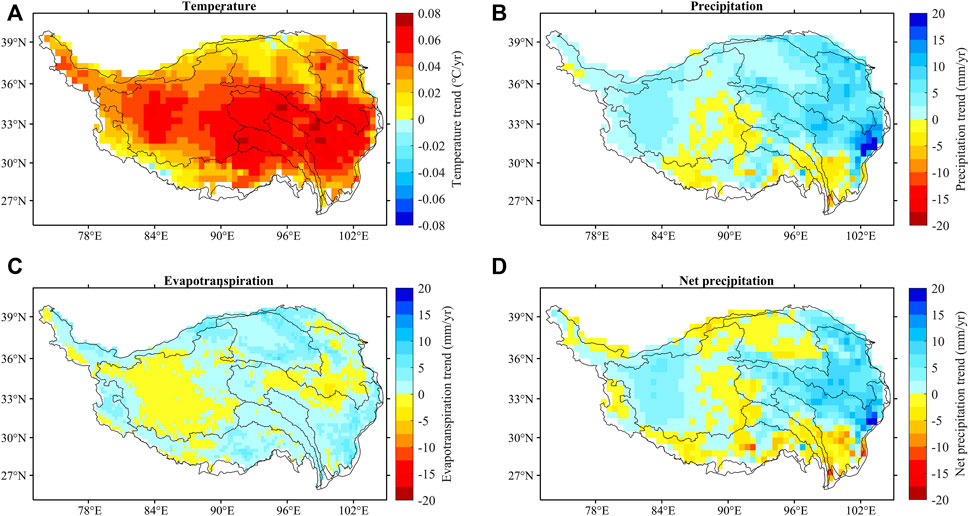
FIGURE 7. The spatial changes of temperature (A), precipitation (B), actual evapotranspiration (C), and net precipitation (D) across the Tibetan Plateau during 2000–2019.
The empirical orthogonal function (EOF) analysis the mode of TWSA shows in the Figure 8. The first mode of TWSA represents the characteristics of TWSA changes in the Tibetan Plateau (Figure 8A), i.e., a surplus in the endorheic basins and a deficit in the exorheic basins. The second mode of TWSA represents the TWSA deficit in the northern part of the Tibetan Plateau after 2012 (Figure 8B). The third mode means the TWSA deficit in the western part of the endorheic basins (Figure 8C). Figure 8D show that the cumulative variance contribution of the first, second, and third modes reached 87%. On this basis, the correlation analysis results in Table 2 showed that the first mode of TWSA was mainly influenced by air temperature, while the second mode of TWSA was significantly negatively correlated with NDVI (r=-0.68, p<0.05). It indicates that air temperature determined the spatial pattern of the spatial variation of TWSA on the Tibetan Plateau, and vegetation change may also be an essential factor.
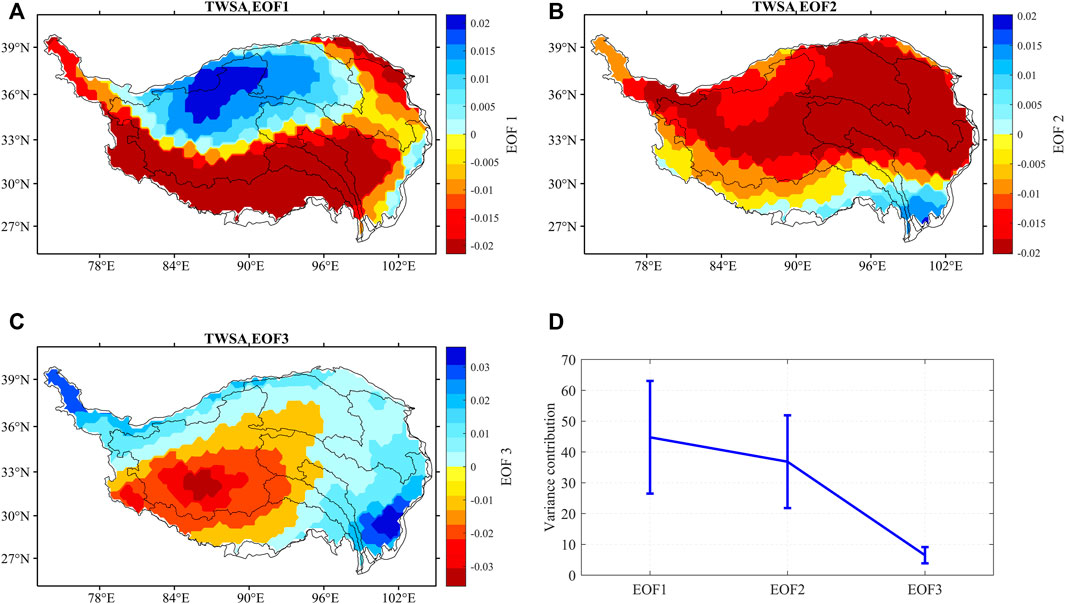
FIGURE 8. The spatial modes of TWSA in the Tibetan Plateau, (A) is EOF1, (B) is EOF2, (C) is EOF3, and (D) is variance contribution rate and error bar using the North test.
3.3 The relationship between TWSA changes and vegetation
Transpiration is an essential component of actual evapotranspiration and is directly related to vegetation. Figure 9A shows that the vegetation index (NDVI value) is higher in the eastern and southeastern parts of the Tibetan Plateau (NDVI > 0.5) and lower in other regions (NDVI < 0.3). Meanwhile, using 2004–2009 as a base period of anomaly (which is consistent with the TWSA), the results showed that the anomaly of NDVI in most regions of the Tibetan Plateau was between -0.025 and 0.025 NDVI (Figure 9B), but reached -0.1 NDVI at the Yarlung Zangbo River bend in the southern part of the Tibetan Plateau. The vegetation index changes in most areas of the Tibetan Plateau are not noticeable (-0.005 - 0.005 NDVI/yr) (Figure 9C) but significantly increased in the northeastern part of the Tibetan Plateau, the northeast part of the endorheic basins. The vegetation index decreased in the southern part of the Tibetan Plateau (-0.1 NDVI/yr), which is closely related to the TWS deficit. The transpiration change is directly related to the vegetation cover under warming in the Tibetan Plateau. In the higher vegetation cover area (NDVI>0.5, Figure 9C), when vegetation indexes decline, vegetation transpiration may be reduced (i.e., Yellow River Basin and Yangtze River Basin) or increased (southern Tibetan Plateau) (Figure 9D). However, in the lower vegetation cover area (NDVI<0.3), when the vegetation index decreases (i.e., the endorheic zone and the Qaidam Basin), vegetation transpiration will decrease (Figures 9C,D); when the vegetation index increases (i.e., northeastern endorheic basins, western Yarlung Tsangpo River Basin, and Indus Basin), vegetation transpiration will increase (Figures 9C,D).
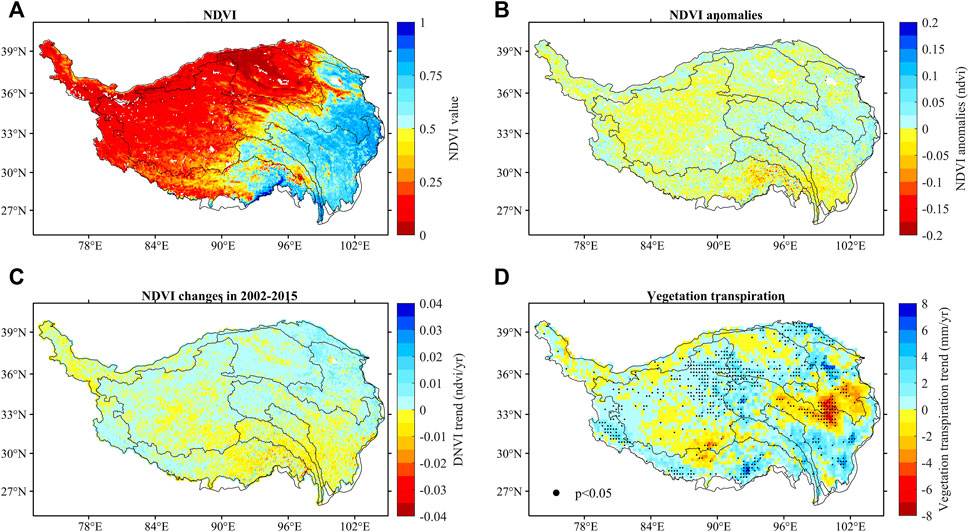
FIGURE 9. The changes in vegetation index and vegetation transpiration on the Tibetan Plateau between 2002 and 2015. (A) an annual average of NDVI; (B) an annual average of anomalies of NDVI are based on 2004–2009, with a similar base period for TWSA anomalies; (C) NDVI changes during 2002–2015; and (D) vegetation transpiration trends from 2002 to 2015.
In the Tibetan Plateau, the low proportion of vegetation canopy water to TWS means vegetation mainly influences TWSA through transpiration. Therefore, we analyzed the pattern of relationship between TWSA and transpiration on the Tibetan Plateau based on the singular value decomposition (SVD) method. The SVD decomposition results showed that the variance contribution of the first mode of TWSA reached 60.27% (Supplementary Figure S2). The spatial pattern of the first mode of TWSA was positively correlated in the endorheic basins and negative in the exorheic basin. Meanwhile, the spatial pattern of the first mode of transpiration was positive in the endorheic basin and negatively correlated in the exorheic basin. The heterogeneous correlation results show that the correlation coefficients of the right field (transpiration) to the left field (TWSA) are all negatively related (Figure 10A), which indicates that the increase in transpiration is causing terrestrial water storage loss. However, the correlation is insignificance (p>0.05). It suggests that the transpiration increase will not contribute to the TWSA deficit under the current precipitation conditions (precipitation is more significant than actual evapotranspiration). The heterogeneous correlation coefficient of the left field (TWSA) to the right field (transpiration) (Figure 10B) shows a positive correlation in the northeastern part of the endorheic basins, while the exorheic basins and the western part of the endorheic basins show a negative correlation. It indicates that transpiration tends to increase in the TWSA surplus region while transpiration tends to decrease in the TWSA deficit region.
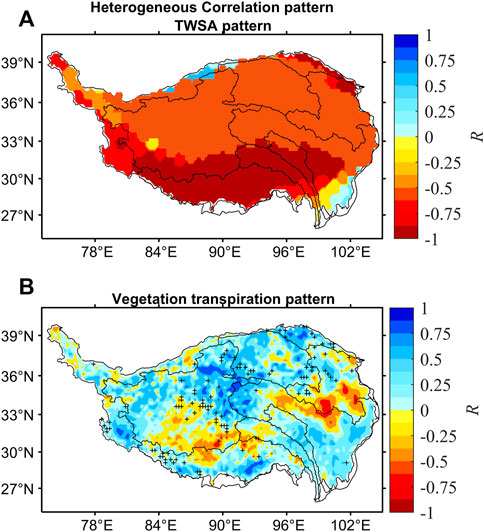
FIGURE 10. Heterogeneous correlation maps between the first mode of TWSA (A) and vegetation transpiration (B). The black plus represents significance at 95%.
Therefore, there is a close relationship between TWSA and vegetation on the Tibetan Plateau. Under the current climatic conditions (the rate of increase in precipitation is faster than the increase in evapotranspiration), the effect of transpiration change on the TWSA is negative but insignificant. However, the impact of TWSA changes on vegetation transpiration is positively correlated, mainly occurring in the endorheic basin. The TWSA surplus in the northeastern endorheic zone is causing greening vegetation and increasing transpiration. In contrast, the TWSA deficit in the southern part of the endorheic basin is an important reason for the browning of vegetation and the decrease of transpiration.
4 Discussion
Increasing temperatures and precipitation on the Tibetan Plateau in the context of global warming have exacerbated uncertainties in the hydrological cycle processes in the region (Yao et al., 2019a). Since the mid-20th century, temperature and precipitation have increased on the Tibetan Plateau. The warming rate in the northern part of the Tibetan Plateau is faster than in other regions (Guo and Wang, 2012). The annual mean temperature warming rate on the Tibetan Plateau is faster than the global warming rate over the same period (Deng et al., 2017; Pepin et al., 2019). At the same time, the warming rate on the Tibetan Plateau increases with altitude, i.e., there is elevation-dependent warming (Yan et al., 2016; Pepin et al., 2019; You et al., 2020a), especially for below 5,000 m regions (Gao et al., 2018). This elevation-dependent warming will continue in the future (Guo et al., 2016; You et al., 2019). Precipitation increased at a rate of 1.4 mm/yr on the Tibetan Plateau during 1960–2014 (Deng et al., 2017). Meanwhile, snowfall increased in the Karakorum region and decreased in the Himalayas (Kapnick et al., 2014; You et al., 2020b).
In the context of global warming, the water storage of the Tibetan Plateau is undergoing dramatic imbalance, such as glacier retreat, snowpack reduction, permafrost degradation, lake expansion, and runoff increase (Chen et al., 2015; Yao et al., 2019b), which have received widespread attention from the scientific community. Glacier changes are sensitive to the response to plateau warming (Zhao et al., 2019). Spatially, glacier retreat rates are decreasing from the southeastern part to the inner Tibetan Pleau (Wang et al., 2019). In the last 50 years, glaciers on the Tibetan Plateau have been in negative mass equilibrium (Yao et al., 2019a), especially since the 1990s. From 2003 to 2009, the glacier’s mass retreated across the Tibetan Plateau to -15.6 ± 10.1 Gt/yr (Neckel et al., 2014).
Spatial differences in temperature and precipitation variations on the Tibetan Plateau trigger spatial differences in glacier retreat, snowmelt, and terrestrial water storage, leading to regional differences in river runoff changes. Changes in TWSA on the Tibetan Plateau are closely related to precipitation; for example, increased water storage in the Yangtze River Basin and Yellow River Basin is associated with an increase in precipitation (Meng et al., 2019; Yang et al., 2019), while decreased TWSA is closely associated with decreased precipitation in the Yarlung Tsangpo River Basin (Deng et al., 2018). The TWSA (Figure 6A1) and net precipitation (Figure 7D) increased in the Yangtze River Basin headwaters and northeast of the endorheic basin. Thus, Figure 6A3 shows a positive correlation between TWSA and net precipitation. TWSA increased in the Qaidam Basin and the northern Yellow River Basin (the Datong River) due to glaciers and snow melting from surrounding mountains. Therefore, TWSA and net precipitation negatively correlate in the Qaidam Basin and the northern Yellow River Basin (Figure 6A3). Runoff increased in the Yangtze and Lancang River source areas due to rising temperatures (Li et al., 2013), while the Yellow River source area runoff decreased due to evapotranspiration and precipitation increased (Cuo et al., 2013). The runoff changes in the Yarlung Tsangpo River were determined by temperature and precipitation, but temperature played a more significant role than precipitation (Liu et al., 2018).
Vegetation is a vital medium for coupling the atmosphere-pedosphere- hydrosphere, and changing will impact the hydrological system. On the Tibetan Plateau, vegetation changes are strongly influenced by the Asian monsoon, particularly seasonal variations (Zhong et al., 2010). Thus, vegetation’s spatial distribution is consistent with precipitation distribution, i.e., the vegetation index decreases from southeast to northwest (Figure 9A). Meanwhile, vegetation changes in response to precipitation with a 1-month lag (Zhong et al., 2010). On the Tibetan Plateau, the vegetation greening season advanced at a rate of 1.04 days/yr from 1982 to 2011 due to climate change (Zhang et al., 2013; Zhang et al., 2012). Different vegetation types will respond differently to climate change: alpine meadows and desert vegetation will shrink while shrubs and forests will expand (Zhao et al., 2011). During the growing season, the Tibetan Plateau may experience a slower rate of warming due to increased transpiration (Shen et al., 2015).
In the Tibetan Plateau, the low proportion of vegetation canopy water to TWS means vegetation mainly influences TWSA through transpiration (Deng et al., 2022). There, there is a complex correlation between changes in TWSA and the vegetation on the Tibetan Plateau. The impacts of vegetation changes on the TWSA is negative and insignificant under current climate change condition (precipitation increased rate faster than actual evapotranspiration increased). However, the effects of TWSA on vegetation changes were significant in the northeastern part of the endorheic basins. Thus, in the context of current climate change, the impact of vegetation change on TWSA on the Tibetan Plateau is relatively small compared to other climate factors.
5 Conclusion
There was an increase in annual temperatures, precipitation, and evapotranspiration on the Tibetan Plateau. Over the period 1961–2020, temperatures and precipitation increased at rates of 0.35°C/decade and 8.8 mm/decade, respectively. Over the decades 1980–2020, the Tibetan Plateau warmed by 0.44°C/decade, precipitation increased by 15.0 mm/decade, and evapotranspiration rose by 12.9 mm/decade. In spring and summer, precipitation increases faster than evapotranspiration. In contrast, precipitation increases slower than evapotranspiration in winter and autumn. It will exacerbate the TWSA deficit in the Tibetan Plateau throughout the winter half-year.
There are evident stages and spatial variability in TWSA on the Tibetan Plateau. TWSA changes were relatively stable from 2003 to 2011 but decreased from 2012 to 2016. Tibetan Plateau TWSA changes are laggards to net precipitation by approximately 1–3 months. Positive anomalies of TWSA occur in the northeastern endorheic basins, while negative anomalies occur at the Yarlung Zangbo River bend (less than -500 mm). TWSA changes on the Tibetan Plateau are negatively related to temperature because temperature rise accelerates the melting of solid water bodies. TWSA positively correlates with net precipitation in the Yangtze River basin and the northeastern endorheic basins while negatively correlates in the Qaidam and Yellow River basins. Overall, the Tibetan Plateau’s TWSA spatial pattern is determined by temperature variation.
In areas with low vegetation cover (NDVI <0.3), transpiration decreases as the vegetation index decreases (i.e., in the western and southern portions of the endorheic basins and the Qaidam Basin), while transpiration increases as the vegetation index increases (i.e., in the northeastern part of the endorheic basins and on the Tibetan Plateau). SVD analysis indicates that the heterogeneous correlation coefficient of the right field (transpiration) to the left field (TWSA) indicates a negative correlation (but it is insignificant), indicating that even though increased transpiration does not result in a deficit of TWSA under the current climate change conditions (the increase in precipitation is faster than the increase in evapotranspiration). The heterogeneous correlation coefficient of the left field (TWSA) to the right field (transpiration) shows a positive correlation (p<0.05) in the northeastern part of the endorheic basins, while the western part of the endorheic basins and the exorheic basins show a negative correlation. It indicates that transpiration tends to increase in areas with TWSA surpluses and decrease in areas with TWSA deficits.
Data availability statement
The original contributions presented in the study are included in the article/Supplementary Materials, further inquiries can be directed to the corresponding author.
Author contributions
HD finished the analysis and writing of the paper. YC provides data and paper corrections. YL provides thesis data and editing. LW and XC edit papers. ZR and ZiZ offered suggestions for revision. ZoZ and SH corrected the paper.
Funding
This research was supported by the National Natural Science Foundation of China (41807159 and 41877167), and Public Welfare Scientific Institutions of Fujian Province (2022R1002005).
Acknowledgments
The authors are grateful to the Chinese Meteorology Administration (http://data.cma.cn/) for providing precipitation and temperature data.
Conflict of interest
The authors declare that the research was conducted in the absence of any commercial or financial relationships that could be construed as a potential conflict of interest.
Publisher’s note
All claims expressed in this article are solely those of the authors and do not necessarily represent those of their affiliated organizations, or those of the publisher, the editors and the reviewers. Any product that may be evaluated in this article, or claim that may be made by its manufacturer, is not guaranteed or endorsed by the publisher.
Supplementary material
The Supplementary Material for this article can be found online at: https://www.frontiersin.org/articles/10.3389/feart.2022.1004846/full#supplementary-material
References
Cai, D., Fraedrich, K., Sielmann, F., Zhang, L., Zhu, X., Guo, S., et al. (2015). Vegetation dynamics on the Tibetan plateau (1982–2006): An attribution by ecohydrological diagnostics. J. Clim. 28 (11), 4576–4584. doi:10.1175/jcli-d-14-00692.1
Cai, D., You, Q., Fraedrich, K., and Guan, Y. (2017). Spatiotemporal temperature variability over the Tibetan plateau: Altitudinal dependence associated with the global warming hiatus. J. Clim. 30 (3), 969–984. doi:10.1175/jcli-d-16-0343.1
Che, T., Hao, X., Dai, L., Li, H., Huang, X., and Xiao, L. (2019). Snow cover variation and its impacts over the qinghai-tibet plateau. Bull. Chin. Acad. Sci. 34 (11), 1247–1253. doi:10.16418/j.issn.1000-3045.2019.11.007
Chen, D. L., Xu, B. Q., Yao, T. D., Guo, Z. T., Cui, P., Chen, F. H., et al. (2015). Assessment of past, present and future environmental changes on the Tibetan Plateau (in Chinese). Chin. Sci. Bull. 60, 3025–3035. doi:10.1360/N972014-01370
Cuo, L., Zhang, Y., Gao, Y., Hao, Z., and Cairang, L. (2013). The impacts of climate change and land cover/use transition on the hydrology in the upper Yellow River Basin, China. J. Hydrology 502, 37–52. doi:10.1016/j.jhydrol.2013.08.003
Deng, H., Chen, Y., and Chen, X. (2022). Driving factors and changes in components of terrestrial water storage in the endorheic Tibetan Plateau. J. Hydrology. 612, 128225. doi:10.1016/j.jhydrol.2022.128225
Deng, H., Pepin, N., and Chen, Y. (2017). Changes of snowfall under warming in the Tibetan Plateau. J. Geophys. Res. Atmos. 122 (14), 7323–7341. doi:10.1002/2017jd026524
Deng, H., Pepin, N., Liu, Q., and Chen, Y. (2018). Understanding the spatial differences in terrestrial water storage variations in the Tibetan Plateau from 2002 to 2016. Clim. Change 151 (3), 379–393. doi:10.1007/s10584-018-2325-9
Ditmar, P. (2018). Conversion of time-varying Stokes coefficients into mass anomalies at the Earth’s surface considering the Earth’s oblateness. J. Geod. 92, 1401–1412. doi:10.1007/s00190-018-1128-0
Gao, Y., Chen, F., Lettenmaier, D. P., Xu, J., Xiao, L., and Li, X. (2018). Does elevation-dependent warming hold true above 5000 m elevation? Lessons from the Tibetan plateau. npj Clim. Atmos. Sci. 1, 19. doi:10.1038/s41612-018-0030-z
Guo, D., and Wang, H. (2012). The significant climate warming in the northern Tibetan Plateau and its possible causes. Int. J. Climatol. 32 (12), 1775–1781. doi:10.1002/joc.2388
Guo, J., Mu, D., Liu, X., Yan, H., Sun, Z., and Guo, B. (2016). Water storage changes over the Tibetan plateau revealed by GRACE mission. Acta Geophys. 64 (2), 463–476. doi:10.1515/acgeo-2016-0003
Jacob, T., Wahr, J., Pfeffer, W., and Swenson, S. (2012). Recent contributions of glaciers and ice caps to sea level rise. Nature 482 (7386), 514–518. doi:10.1038/nature10847
Kang, S., Guo, W., Wu, T., Zhong, Y. Y., Chen, R. S., Xu, M., et al. (2020). Cryospheric changes and their impacts on water resources in the belt and road regions. Adv. Earth Sci. (in Chinese) 35 (1), 1–17. doi:10.11867/j.issn.1001-8166.2020.002
Kapnick, S. B., Delworth, T. L., Ashfaq, M., Malyshev, S., and Milly, P. C. D. (2014). Snowfall less sensitive to warming in Karakoram than in Himalayas due to a unique seasonal cycle. Nat. Geosci. 7 (11), 834–840. doi:10.1038/ngeo2269
Li, L., Shen, H., Dai, S., Li, H., and Xiao, J. (2013). Response of water resources to climate change and its future trend in the source region of the Yangtze River. J. Geogr. Sci. 23, 208–218. doi:10.1007/s11442-013-1004-z
Li, X., Long, D., Scanlon, B. R., Mann, M. E., Li, X. D., and Tian, F. Q. (2022). Climate change threatens terrestrial water storage over the Tibetan Plateau. Nat. Clim. Chang. 12, 801–807. doi:10.1038/s41558-022-01443-0
Liu, C., Xu, C., Liu, Y., and Xie, X. W. (2020). Terrestrial water storage changes in three-River source region as detected based on GRACE RL06 data (in Chinese). Journal of Geodesy and Geodynamics 40 (10), 1092–1096. doi:10.14075/j.jgg.2020.10.019
Liu, J., Zhang, W., Liu, T., and Li, Q. (2018). Runoff dynamics and associated multi-scale responses to climate changes in the middle reach of the Yarlung Zangbo River Basin, China. Water 10, 295. doi:10.3390/w10030295
Long, D., Longuevergne, L., and Scanlon, B. R. (2015). Global analysis of approaches for deriving total water storage changes from GRACE satellites. Water Resour. Res. 51 (4), 2574–2594. doi:10.1002/2014WR016853
Long, D., Shen, Y., Sun, A., Hong, Y., Longuevergne, L., Yang, Y., et al. (2014). Drought and flood monitoring for a large karst plateau in Southwest China using extended GRACE data. Remote Sensing of Environment 155, 145–160. doi:10.1016/j.rse.2014.08.006
Loomis, B. D., Rachlin, K. E., and Luthcke, S. B. (2019). Improved Earth oblateness rate reveals increased ice sheet losses and mass-driven sea level rise. Geophys. Res. Lett. 46, 6910–6917. doi:10.1029/2019gl082929
Matsuo, K., and Heki, K. (2010). Time-variable ice loss in Asian high mountains from satellite gravimetry. Earth and Planetary Science Letters 290 (1-2), 30–36. doi:10.1016/j.epsl.2009.11.053
Meng, F., Su, F., Li, Y., and Tong, K. (2019). Changes in terrestrial water storage during 2003-2014 and possible causes in Tibetan Plateau. J. Geophys. Res. Atmos. 124, 2909–2931. doi:10.1029/2018jd029552
Neckel, N., Kropáček, J., Bolch, T., and Hochschild, V. (2014). Glacier mass changes on the Tibetan Plateau 2003–2009 derived from ICESat laser altimetry measurements. Environ. Res. Lett. 9, 014009. doi:10.1088/1748-9326/9/1/014009
Peltier, W. R., Argus, D. F., and Drummond, R. (2018). Comment on "An Assessment of the ICE-6G_C (VM5a) Glacial Isostatic Adjustment Model" by Purcell et al. J. Geophys. Res. Solid Earth 123, 2019–2028. doi:10.1002/2016jb013844
Pepin, N., Deng, H., Zhang, H., Zhang, F., Kang, S., and Yao, T. (2019). An examination of temperature trends at high elevations across the Tibetan plateau: The use of MODIS LST to understand patterns of elevation-dependent warming. J. Geophys. Res. Atmos. 124 (11), 5738–5756. doi:10.1029/2018jd029798
Pokhrel, Y., Felfelani, F., Satoh, Y., Boulange, J., Burek, P., Gadeke, A., et al. (2021). Global terrestrial water storage and drought severity under climate change. Nat. Clim. Chang. 11, 226–233. doi:10.1038/s41558-020-00972-w
Rodell, M., and Famiglietti, J. (1999). Detectability of variations in continental water storage from satellite observations of the time dependent gravity field. Water Resour. Res. 35 (9), 2705–2723. doi:10.1029/1999wr900141
Sen, P. K. (1968). Estimates of the regression coefficient based on kendall's tau. Journal of the American Statistical Association 63 (324), 1379–1389. doi:10.1080/01621459.1968.10480934
Shen, M., Piao, S., Jeong, S. J., Zhou, L., Zeng, Z., Ciais, P., et al. (2015). Evaporative cooling over the Tibetan Plateau induced by vegetation growth. Proc. Natl. Acad. Sci. U. S. A. 12 (30), 9299–9304. doi:10.1073/pnas.1504418112
Shen, M., Sun, Z., Wang, S., Zhang, G., Kong, W., Chen, A., et al. (2013). No evidence of continuously advanced green-up dates in the Tibetan Plateau over the last decade. Proc. Natl. Acad. Sci. U. S. A. 110 (26), E2329. doi:10.1073/pnas.1304625110
Song, C., Ke, L., Huang, B., and Richards, K. S. (2015). Can mountain glacier melting explains the GRACE-observed mass loss in the southeast Tibetan Plateau: From a climate perspective? Global and Planetary Change 124, 1–9. doi:10.1016/j.gloplacha.2014.11.001
Sun, Z., Long, D., Yang, W., Li, X., and Pan, Y. (2014). Reconstruction of GRACE data on changes in total water storage over the global land surface and sixty basins. Water Resources Research 56, e2019WR026250. doi:10.1029/2019WR026250
Syed, T. H., Famiglietti, J. S., Rodell, M., Chen, J., and Wilson, C. R. (2008). Analysis of terrestrial water storage changes from GRACE and GLDAS. Water Resour. Res. 44, W02433. doi:10.1029/2006wr005779
Wan, W., Long, D., Hong, Y., Ma, Y., Yuan, Y., Xiao, P., et al. (2016). A lake data set for the Tibetan Plateau from the 1960s, 2005, and 2014. Sci. Data 3, 160039. doi:10.1038/sdata.2016.39
Wang, J., Chen, X., Hu, Q., and Liu, J. (2020). Responses of terrestrial water storage to climate variation in the Tibetan Plateau. Journal of Hydrology 584, 124652. doi:10.1016/j.jhydrol.2020.124652
Wang, J., Song, C., Reager, J., Yao, F., Famiglietti, J. S., Sheng, Y., et al. (2018). Recent global decline in endorheic basin water storages. Nat. Geosci. 11 (12), 926–932. doi:10.1038/s41561-018-0265-7
Wang, N., Yao, T., Xu, B., Chen, A., and Wang, W. (2019). Spatiotemporal pattern, trend, and influence of glacier change in Tibetan Plateau and surroundings under global warming. Bulletin of Chinese Academy of Sciences 34 (11), 1220–1232. doi:10.16418/j.issn.1000-3045.2019.11.005
Xiong, C., Yao, R. Z., Shi, J. C., Lei, Y. H., and Pan, J. M. (2019). Change of snow and ice melting time in High Mountain Asia (in Chinese). Chin Sci Bull 64, 2885–2893. doi:10.1360/TB-2019-0085
Yan, L., Liu, Z., Chen, G., Kutzbach, J. E., and Liu, X. (2016). Mechanisms of elevation‐dependent warming over the Tibetan Plateau in quadrupled CO2 experiments. Climatic Change 135 (3-4), 509–519. doi:10.1007/s10584-016-1599-z
Yang, K., Lu, H., Yue, S., Zhang, G., Lei, Y., La, Z., et al. (2019). Quantifying recent precipitation change and predicting lake expansion in the Inner Tibetan Plateau. Climatic Change 147, 149–163. doi:10.1007/s10584-017-2127-5
Yao, T., Xue, Y., Chen, D., Chen, F., Thompson, L., Cui, P., et al. (2019a). Recent Third Pole’s rapid warming accompanies cryospheric melt and water cycle intensification and interactions between monsoon and environment: Multidisciplinary approach with observations, modeling, and analysis. Bulletin of the American Meteorological Society 100, 423–444. doi:10.1175/bams-d-17-0057.1
Yao, T., Bolch, T., Chen, D., Gao, J., Immerzeel, W., Piao, S., et al. (2022). The imbalance of the Asian water tower. Nat. Rev. Earth Environ. 3, 618–632. doi:10.1038/s43017-022-00299-4
Yao, T., Wu, G., Xu, B., Wang, W., Gao, J., and An, B. (2019b). Asian water tower change and its impacts. Bulletin of Chinese Academy of Sciences 34 (11), 1203–1209. doi:10.16418/j.issn.1000-3045.2019.11.003
You, Q. L., Zhang, Y. Q., Xie, X. Y., and Wu, F. Y. (2019). Robust elevation dependency warming over the Tibetan Plateau under global warming of 1.5°C and 2°C. Climate Dynamics 53, 2047–2060. doi:10.1007/s00382-019-04775-4
You, Q., Chen, D., Wu, F., Pepin, N., Cai, Z., Ahrens, B., et al. (2020a). Elevation dependent warming over the Tibetan plateau: Patterns, mechanisms and perspectives. Earth-Science Reviews 210, 103349. doi:10.1016/j.earscirev.2020.103349
You, Q., Wu, T., Shen, L., Pepin, N., Zhang, L., Jiang, Z., et al. (2020b). Review of snow cover variation over the Tibetan Plateau and its influence on the broad climate system. Earth-Science Reviews 201, 103043. doi:10.1016/j.earscirev.2019.103043
Zhang, G., Yao, T., Chen, W., Zheng, G., Shum, C., Yang, K., et al. (2019). Regional differences of lake evolution across China during 1960s-2015 and its natural and anthropogenic causes. Remote Sensing of Environment 221, 386–404. doi:10.1016/j.rse.2018.11.038
Zhang, G., Yao, T., Piao, S., Bolch, T., Xie, H., Chen, D., et al. (2017). Extensive and drastically different alpine lake changes on Asia's high plateaus during the past four decades. Geophysical Research Letters 44, 252–260. doi:10.1002/2016gl072033
Zhang, G., Zhang, Y., Dong, J., and Xiao, X. (2013). Green-up dates in the Tibetan Plateau have continuously advanced from 1982 to 2011. Proc. Natl. Acad. Sci. U. S. A. 110 (11), 4309–4314. doi:10.1073/pnas.1210423110
Zhang, T., Yang, X., Gu, W., Shu, X., and Jiang, M. (2012). Histological features of the gastric mucosa in children with primary bile reflux gastritis. World J. Surg. Oncol. 32 (1), 27–38. doi:10.1186/1477-7819-10-27
Zhao, D., Wu, S., Yin, Y., and Yin, Z. (2011). Vegetation distribution on Tibetan Plateau under climate change scenario. Reg. Environ. Change 11, 905–915. doi:10.1007/s10113-011-0228-7
Zhao, L., Hu, G., Zou, D., Wu, X., Ma, L., Sun, Z., et al. (2019). Permafrost changes and its effects on hydrological processes on qinghai-tibet plateau. Bulletin of Chinese Academy of Sciences 34 (11), 1233–1246. doi:10.16418/j.issn.1000-3045.2019.11.006
Zhong, L., Ma, Y., Salama, M. S., and Su, Z. B. (2010). Assessment of vegetation dynamics and their response to variations in precipitation and temperature in the Tibetan Plateau. Climatic Change 103, 519–535. doi:10.1007/s10584-009-9787-8
Zhu, L. P., Ju, J. T., Qiao, B. J., Yang, R. M., Liu, C., Han, B. P., et al. (2019). Recent lake changes of the Asia Water Tower and their climate response: Progress, problems and prospects (in Chinese). Chin Sci Bull 64, 2796–2806. doi:10.1360/TB-2019-0185
Keywords: climate change, terrestrial water storage, temperature and precipitation, vegetation change, Tibetan plateau
Citation: Deng H, Chen Y, Chen X, Li Y, Ren Z, Zhang Z, Zheng Z and Hong S (2022) The interactive feedback mechanisms between terrestrial water storage and vegetation in the Tibetan Plateau. Front. Earth Sci. 10:1004846. doi: 10.3389/feart.2022.1004846
Received: 27 July 2022; Accepted: 30 September 2022;
Published: 27 October 2022.
Edited by:
Lei Wang, Institute of Tibetan Plateau Research (CAS), ChinaReviewed by:
Baisha Weng, China Institute of Water Resources and Hydropower Research, ChinaXiangjiang Yu, Jilin University, China
Copyright © 2022 Deng, Chen, Chen, Li, Ren, Zhang, Zheng and Hong. This is an open-access article distributed under the terms of the Creative Commons Attribution License (CC BY). The use, distribution or reproduction in other forums is permitted, provided the original author(s) and the copyright owner(s) are credited and that the original publication in this journal is cited, in accordance with accepted academic practice. No use, distribution or reproduction is permitted which does not comply with these terms.
*Correspondence: Yang Li, bHlfbWx5QDEyNi5jb20=
 Haijun Deng
 Yaning Chen
 Xingwei Chen1,2,3
 Yang Li
 Zhiguo Ren
 Zhiwei Zhang
 Zhouyao Zheng
 Sheng Hong