 Zhou Zhao
 Xing Chen
 Jiangbo Wei
 Jianquan Ma
 Wanjun Ye3
- 1College of Geology and Environment, Xi’an University of Science and Technology, Xi’an, Shaanxi, China
- 2Shaanxi Provincial Key Laboratory of Geological Support for Coal Green Exploitation, Xi’an University of Science and Technology, Xi’an, Shaanxi, China
- 3College of Architecture and Civil Engineering, Xi’an University of Science and Technology, Xi’an, Shaanxi, China
The study of landslide dynamic process and impact damage has important theoretical and practical significance for landslide risk quantitative assessment. Taking Fenghuang Street landslide in Ningqiang County, Shaanxi Province, China as an example, the dynamic process of landslide and its damage to brick-concrete structure buildings are predicted by using discrete element method. Firstly, a three-dimensional numerical landslide model is established by means of the particle flow code system (PFC3D), which is based on landslide investigation, surveying, engineering exploration and geotechnical testing. Secondly, the whole process of landslide deformation, failure, movement and impact damage was simulated, and the velocity, displacement and impact force of the landslide in the motion process were quantitatively studied. Thirdly, the building model (brick-concrete structure) located at the foot of the landslide was constructed by PFC3D and finite element software (Midas/gen), respectively. The characteristics of deformation and displacement of the buildings after the landslide impact are analyzed, and the impact damage of the landslide is predicted. The results show that the rear edge of Fenghuang Street landslide first deforms and fails, and the leading edge is gradually pushed out. After the locking section of the front edge is broken, the landslide begins to slide as a whole, which is a typical push landslide. The main sliding time of the landslide is about 30 s, the maximum average velocity is 3.2 m/s, and the maximum displacement is about 40 m. After the landslide hits the building, the building is displaced in the moving direction of the landslide, and the wall of the building impacted by the landslide is destroyed, resulting in an collapse evident. The relevant research methodologies and findings in this paper can provide a reference for the risk assessment of the same type of landslides, especially the quantitative assessment of the vulnerability for the brick-concrete buildings at risk.
Introduction
The research on quantitative prediction of landslide risk has significant theoretical and practical implications for landslide prevention and reduction. With the rapid advancement of computer technology, the numerical method has become an essential tool for simulating and analyzing the landslide process. In recent years, the numerical approach has been widely used due to its low cost, flexible parameter setting, no size constraint, high compatibility, and repeated calculations, among other benefits (Lo et al., 2016). At present, researchers have developed numerical simulation software based on different theories and constitutive models, which can be used to simulate the deformation, failure, movement, and accumulation of landslides, including the common finite element method (Leshchinsky et al., 2015; Mi and Wang, 2021), discrete element method (Tang et al., 2012; Hu et al., 2019; Chen and Song.2020), Lagrangian method (Zaniboni and Tinti, 2014), material point method (Liu et al., 2020; Ying et al., 2020) and smooth particle hydrodynamics method (Hu et al., 2014; Choi et al., 2020) and other new numerical methods. In contrast, the discrete element method (such as the particle flow discrete element method) is not only suitable for simulating large deformation, large displacement, and crack propagation, but also a powerful tool for simulating the mechanical response characteristics of real materials, allowing for further investigation of the failure mechanism and movement induced hazard process of landslides (Wei et al., 2019; Ma et al., 2020).
In recent years, landslide simulations have extensively used the particle flow code (PFC). For example, the failure behavior of landslide material under different conditions were simulated based on PFC2D software (Tang et al., 2009), the displacement and velocity of particles in key parts of the landslide were monitored and their movement characteristics were analyzed. An in-depth analysis of the movement characteristics and accumulation range of landslides was conducted by using PFC3D (Lo et al., 2011). On the basis of examining the basic parameters of landslide movement, the transformation relationship of energy in the process of landslide movement was discussed by Zou et al. Zou et al. (2017). Compared with the simulation of the landslide movement process, the numerical analysis of landslide impact hazard ability or impact intensity has greater practical value for quantitative prediction of landslide risk. At present, the research on the landslide impact strength is limited to the numerical simulation of ideal slope or simplified model test. For example, Li et al. conducted a series of numerical tests on the impact of an idealized landslide on the retaining wall based on PFC2D, and obtained the effects of slope geometry, sliding distance, wall position, and sliding surface friction on the wall impact force (Li et al., 2017). Based on PFC3D and model test, Gao and Meguid evaluated the impact strength of slope on retaining walls (Gao and Meguid, 2017).
However, in the discrete element study, the retaining wall impacted by a landslide is a rigid body, and there are few discrete element models of masonry related to landslide impact. Most research on masonry structures focus on finite element software. For instance, on the basis of landslide process analysis, the fluid-solid coupling research is conducted and the structural response is evaluated through three-dimensional finite element modeling by Liu et al. (2018). Failure happens initially at the beam column connection, and then the local damage to the impacted column will eventually lead to structural damage. Luo et al. simulated the flow dynamics of a landslide and its impact on reinforced concrete buildings through the explicit time integral analysis of LSDYNA (Luo et al., 2019; Luo et al., 2021), and considered the damage to buildings under three landslide strength levels. Andrewwinner used PLAXIS 3D finite element software to model the original slope and vertical cutting of the slope, analyzed the actual situation of the site prior to its failure, studied the vulnerability of buildings near the slope by using the support vector method, and analyzed the impact of materials on their failure (Andrewwinner et al., 2022).
In mountainous regions such as the southern Shaanxi mountain of China, there are a high number of simple brick concrete masonry buildings. However, it is not difficult to find that the majority of the aforementioned research concentrated on masonry buildings with frame structures. At present, there are few researches on landslide impact damage of brick concrete masonry buildings. At the same time, assessing the response and vulnerability of buildings when affected by landslides remains a weak link in landslide risk analysis. Therefore, the three-dimensional numerical model of landslide and brick-concrete structure building can analyze the impact force of landslide and the damage degree of building, so as to determine the impact strength of landslide more truly and accurately.
Therefore, in order to analyze the dynamic process and predict the impact intensity of landslide, this paper takes Fenghuang Street landslide as an example, and adopts the methods of field investigation, survey and mapping, landslide exploration, geotechnical testing and numerical simulation to study the landslide movement characteristics and the impact damage of brick-concrete buildings. The research results provide a reference for quantitative risk assessment of shallow landslide and have certain theoretical and practical significance.
Geological environment and landslide characteristics
Geological environment
The Fenghuang Street Landslide is located on the southern slope of Fenghuang Mountain, Guangping Town, Ningqiang County, Shaanxi Province, China (Figure 1). Geographical coordinates: 105°42′44″ E longitude, 32°47′44″N latitude. The study area has a north subtropical monsoon climate with four-season and abundant rainfall. The average annual temperature is 12°C–14°C, and the annual average precipitation is 1,178 mm. Caojiagou River flows into Guangping River from east to west at the foot of the landslide. The regional strata are dominated by Middle-Upper Proterozoic (Pt2-3bk), and Quaternary sediments (Q4) overlie the bedrock. The lithology of Middle-Upper Proterozoic is mainly composed of tuff, and the Quaternary strata are dominated by Holocene alluvial deposits (Q4al+pl) and residual slope deposits (Q4el+dl). According to field investigation, the formation of Fenghuang Street landslide was formed in the late Holocene. In addition, a regional fault runs from west to east across Guangping Town, and the Fenghuang Mountain is just located on the north boundary of the fault.
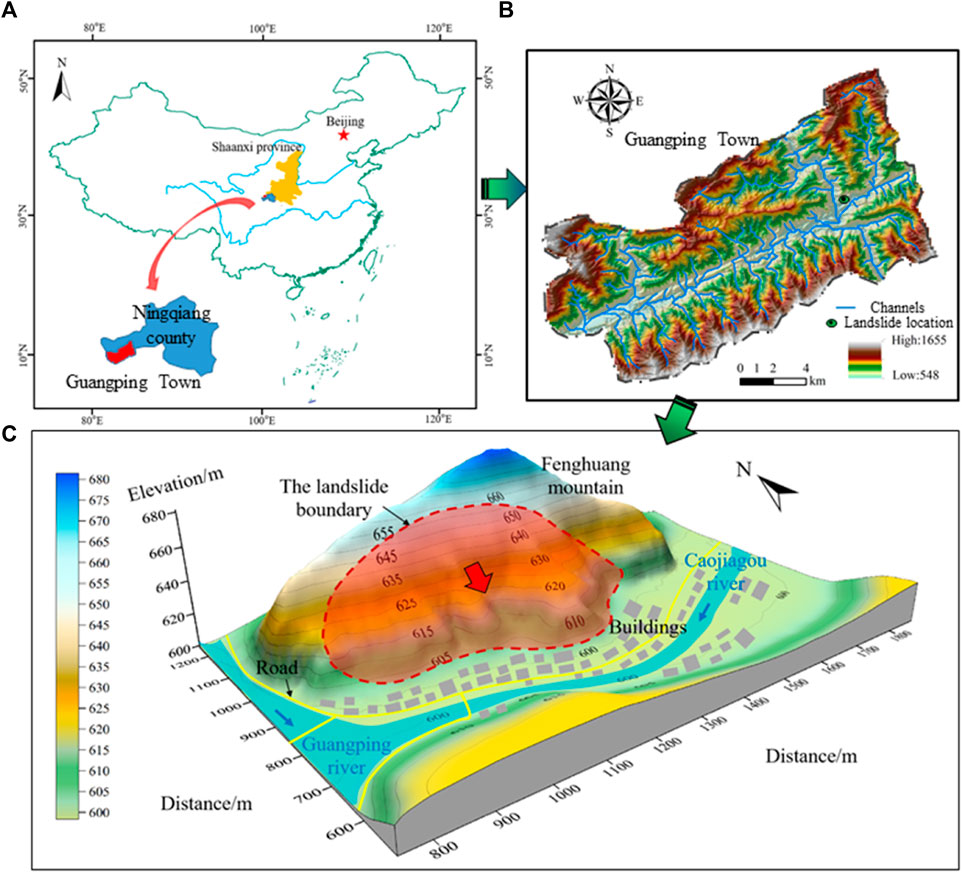
FIGURE 1. Location of Fenghuang Street landslide: (A) the location of Guangping town in China; (B) the elevation distribution of Guangping Town and the location of Fenghuang Street landslide; (C) three-dimensional image of Fenghuang Street landslide.
Landslide characteristics
The Fenghuang Street landslide has an average width of 300 m, a length of 80 m and an estimated volume about 1.15×10⁵ m3. The elevations of the landslide crest and toe are 660 m and 603 m, respectively, and the main sliding direction is 175°. Due to creep deformation, some arc-shaped and polygonal tensile cracks were formed in the rear of the landslide, extending more than 20 m in length and 2–15 cm in width (Figure 2A; Figure 2B). A steep slope is formed at the foot of the slope due to excavation, and there are unloading tension cracks on the top surface of the slope (Figure 2C). Under the influence of precipitation, there is a small-scale collapse deformation towards the leading edge of the eastern end of the landslide (Figure 2D).
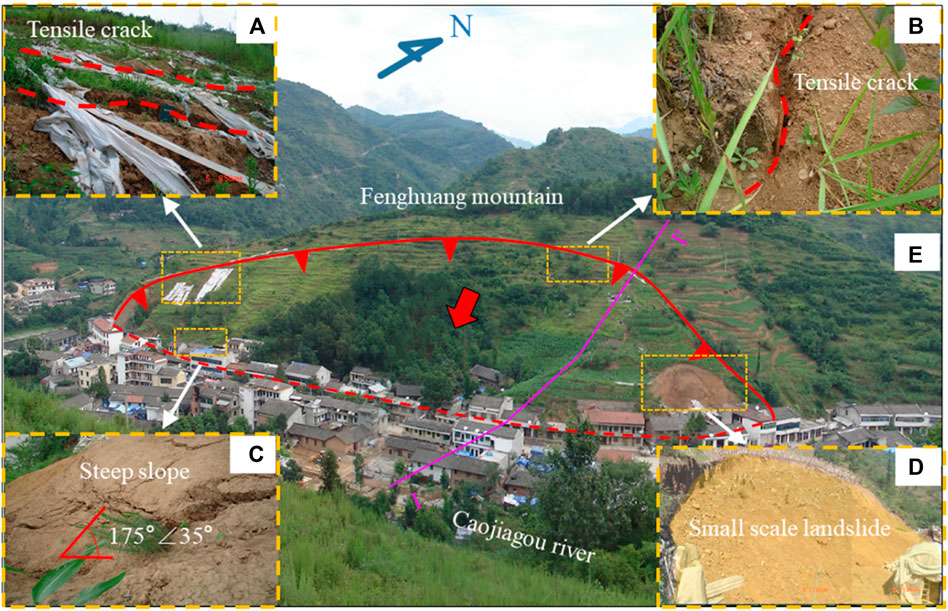
FIGURE 2. Local image of Fenghuang Street landslide: (A) and (B) tensile crack; (C) steep slope; (D) small-scale collapse; (E) image taken by unmanned aerial vehicle (the red line shows the landslide boundary and the purple line shows the location of a cross section I-I').
According to the engineering geological survey and on-site investigation, the main materials of the landslide body are composed of silty clay and have a maximum thickness of about 10 m. The bedrock lithology is mainly Middle-Upper Proterozoic tuff, and a short part of which are Quaternary Holocene residual deposits and alluvial deposits with sandy gravel and detritus (Figure 3).
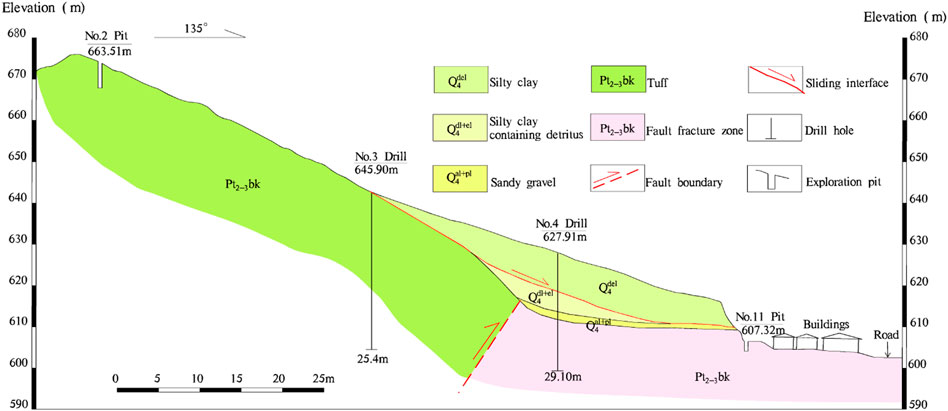
FIGURE 3. Geological profile of section Ⅰ-Ⅰ' (the location of the cross section is shown in Figure 2E).
Modeling and simulation
Landslide model construction
Micro-parameters calibration of landslide material
Before establishing the numerical model of landslide, it is necessary to test the shear-strength of landslide materials, so as to provide the necessary basis for setting the numerical simulation parameters. In this study, through field investigation, material collection, specimen preparation, laboratory testing and analysis (Figure 4A and Figure 4B), the stress-strain curves of landslide material tested in laboratory are shown in Figure 4C (the solid lines in Figure 4C).
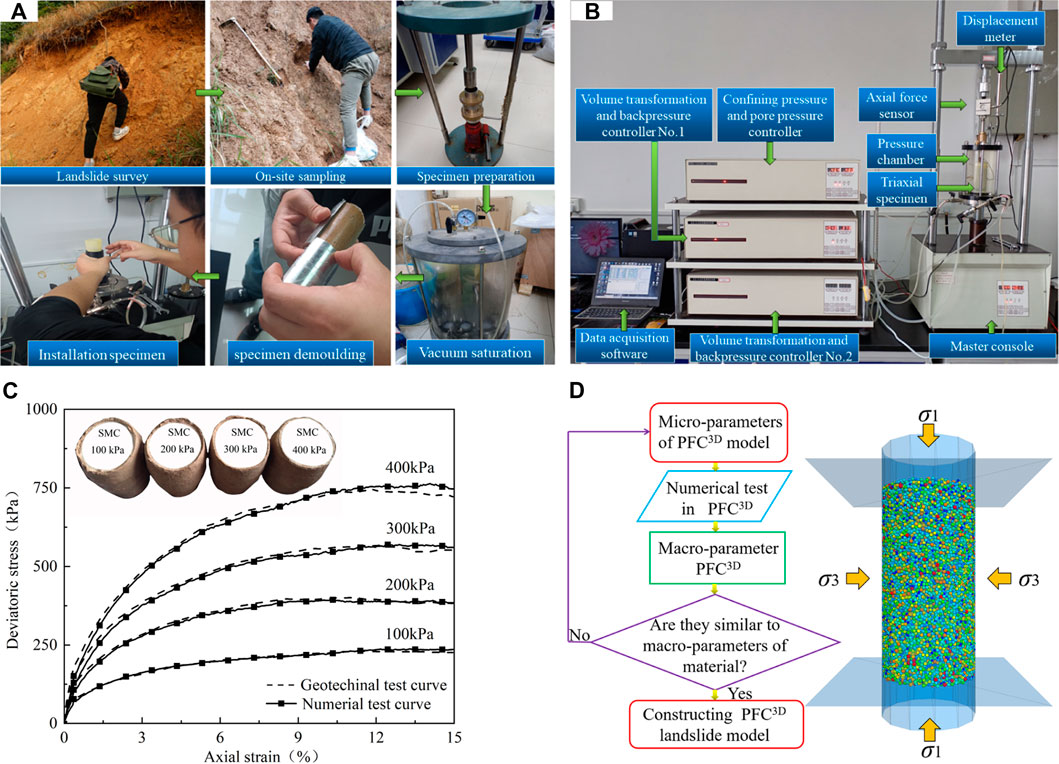
FIGURE 4. The macro-strength test and micro-strength parameters calibration of landslide materials: (A) material collection and specimen preparation; (B) triaxial compression test in laboratory; (C) stress-strain curves of landslide materials; (D) the flow chart of numerical triaxial compression and micro-parameters calibration.
In the PFC numerical model of landslide, the parameters are mainly the micro-strength parameters of particles and the bond properties between particles, namely normal stiffness, tangential stiffness, bond strength, friction coefficient, etc. These values can be calibrated by repeated training and numerical triaxial compression test with the initial values on the basis of research experience (Figure 4D), and the stress-strain curves corresponding to the training results are compared with those measured in laboratory. When the stress-strain curves are close to the geotechnical test curves in laboratory, the current micro-parameter values can applied to the landslide modeling. In this study, the triaxial compression test contains 52986 particle elements. After multi-parameter adjustment and trial calculation, the stress-strain curves of the numerical tests are very consistent with those of the laboratory tests (Figure 4C), and the corresponding micro-parameters results are displayed in Table 1.

TABLE 1. Calibration results of micro-strength parameters of Fenghuang Street landslide model.
In particular, in the particle discrete element method, the constitutive properties of materials are mainly reflected by the contact constitutive model between particles. In general, there are three main types of particle contact constitutive models, namely sliding model, linear contact model and parallel bond model. The sliding model mainly characterizes the relative motion characteristics between particles in contact, and it is mainly used in the simulation of non-viscous materials without considering the normal tension and tensile strength between particles. The linear contact model can define the normal and tangential contact stiffness between two contact entities, and the parallel bond model can consider the constitutive properties of filling materials or cementing materials between particles. Therefore, the latter two models are widely used in the simulation analysis of landslide materials. Similarly, the linear contact model and parallel bond model are applied to construct the numerical model of Fenghuang Street landslide in this paper.
Landslide 3D model construction
After the calibration of the particle micro-parameters of the landslide materials, the PFC3D system is applied to establish the three-dimensional numerical model of Fenghuang Street landslide based on the topographic and geological data obtained from investigation, survey and mapping. The technical flow chart and modeling results are shown in Figure 5 and Figure 6 respectively.
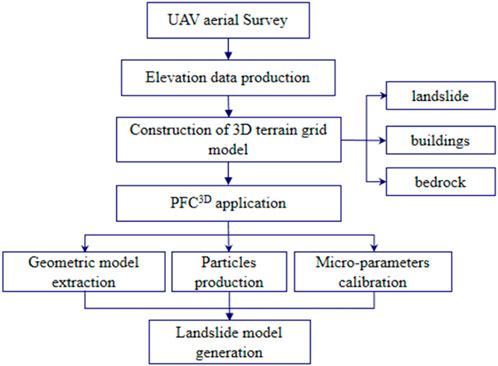
FIGURE 5. The flow chart of landslide 3D modeling.
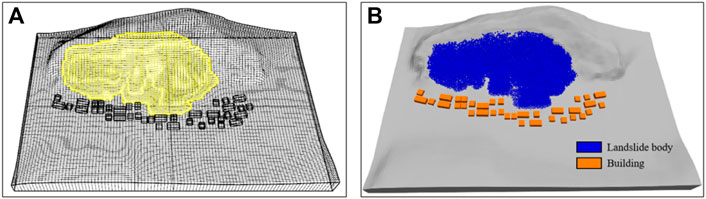
FIGURE 6. Landslide model produced from PFC3D: (A) grid model; (B) geometric model.
Sliding simulation
The whole process of Fenghuang Street landslide from deformation, destruction, movement to accumulation is simulated by using the 3D model (Figure 7). The simulation findings indicate that the main sliding time of the landslide is about 30 s. At the initial stage of the movement, the rear edge of the landslide was destroyed firstly under self-weight, but the leading edge exhibited no discernible displacement (Figure 7A). About 5 s later, the left side of the leading edge begins to move, while the displacement on the right side lags behind. (Figure 7B). With the increase of time, the sliding surface runs through as a whole, and the velocity of the front part of the landslide increases while the rear part decreases, demonstrating the typical push landslide characteristic of “the rear pushes the front” (Figures 7A–C). Due to the friction of the surface and the blocking of the buildings, the majority of the landslide bodies begin to decelerate and gradually accumulate at the foot of the slope of the sliding (Figures 7D–F). Figure 8 shows the threat of landslide to buildings when the movement stops.
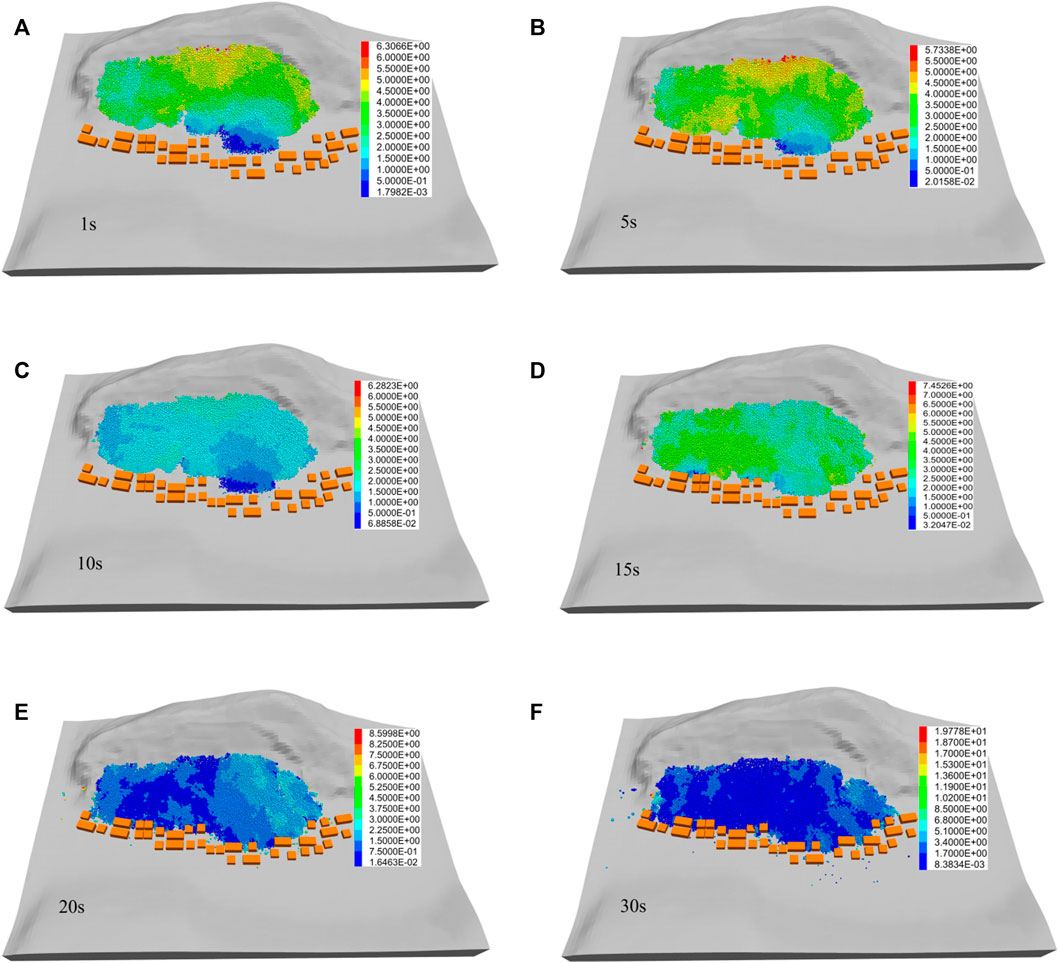
FIGURE 7. Simulation of Fenghuang Street landslide movement.
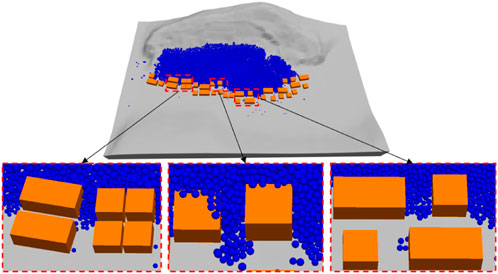
FIGURE 8. Schematic diagram of landslide deposits.
Impact buildings simulation
Considering the limitation of computational performance, the simulation described above only considered the geometric size of the building, but did not consider the material properties. As can be seen from Figure 8, the landslide will cause varying degrees of damage to the houses, especially the last row located in the middle of the slope foot. In order to simulate the actual results of damage, the discrete element model of the brick-concrete structure house in the middle of the slope foot is established in this study, in which the bricks are simplified to the rigid blocks of the same size, and the mortar materials are represented by the adhesion between the blocks.
Most of the houses along the foot of the Fenghuang Street landslide are 8 m high with two floors (Figure 2), and the mortar strength grade are commonly M 7.5. Liang et al. (2014) tested the shear strength of brick masonry joints using M7.5 mortar according to the Standard for test method of basic mechanical properties of masonry (the Chinese standard: GBT50129-2011) in 2014, and calculated the average shear strength of each sample to be 0.482 MPa. In this study, the double shear test model of nine bricks is constructed by r block element in PFC for numerical test calibration (Figure 9), and the shear strength in the displacement-shear stress curve is consistent with the average shear strength in the physical test. Finally, the bond parametersare assigned to the brick model (Table 2), and the buildings model is established and simulated (Figure 10).
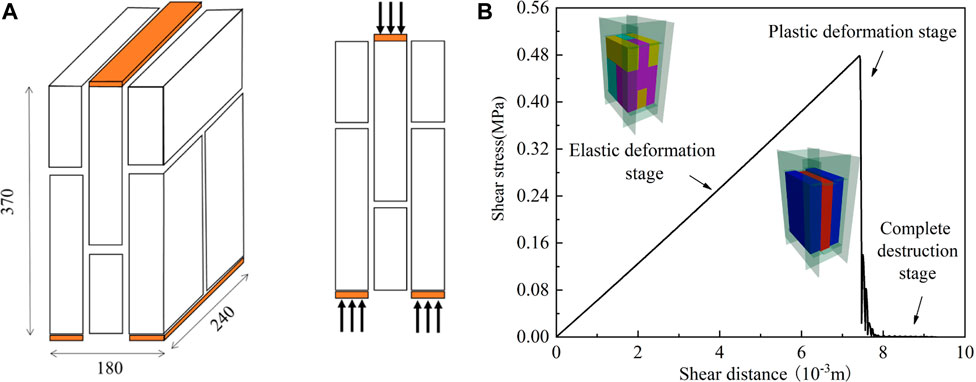
FIGURE 9. Double shear test for brick-concrete buildings simulation: (A) double shear test model (mm); (B) numerical simulation of double shear test.

TABLE 2. Parameter table of masonry building model.
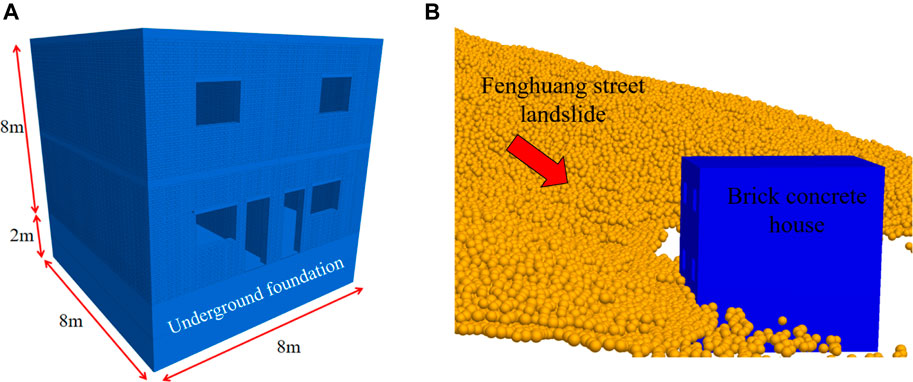
FIGURE 10. Landslide impact simulation: (A) a house model produced from discrete element method; (B) a rendering of the house affected by landslide.
Results and discussion
Results
Velocity and displacement of landslide
According to landslide simulation, the real-time monitoring curves of landslide dynamic characteristics are show in Figure 11 (refers to velocity, displacement and impact force). It can be see that the motion accelerates at 0–7.8 s and decelerates after 7.8 s, the peak velocity reaching 3.2 m/s and the displacement is 40 m ((Figure 11A). This is basically consistent with results calculated by some common statistical formulas (Table 3), refer to Scheidegger formula (Scheidegger, 1973) and Xieson formula (translated by Wang, 1989) here.
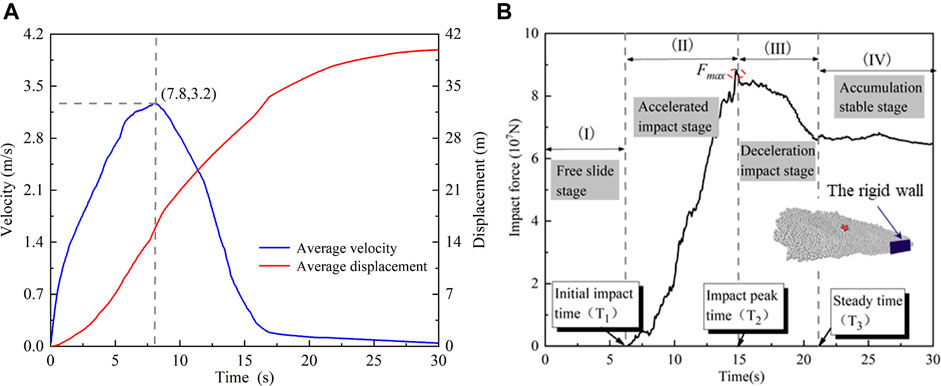
FIGURE 11. Time history curves of landslide dynamic characteristics: (A) velocity and displacement curves; (B) impact force curve.
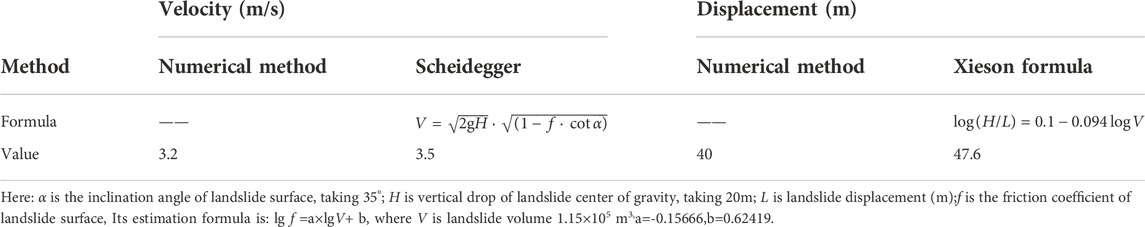
TABLE 3. Landslide velocity and displacement.
Impact force of landslide
The impact force of landslide is a key index to evaluate the vulnerability of the elements at risk. Through the monitoring of the impact force of Fenghuang Street landslide by the rigid wall at the foot of the slope (Figure 11B), the maximum force is about 8.6×10⁷ N. When the landslide stops moving, the impact force is constant at about 6.5×10⁷ N. What else, the numerical simulation results of landslide impact force change with time are basically consistent with the rule derived from the Shen’s test for clastic flow (Shen et al., 2018).
Damage of buildings
Under the impact of landslide, the houses and other elements at risk will suffer different degrees of damage. According to the simulation results of Fenghuang Street landslide impact to the building located in the middle of the slope foot (Figure 12), the deformation damage occurs at the bottom of the back wall after the landslide moves for 5 s. After 10 s, the deformation of the back wall begin to expand, and the side walls also begin to deform, the displacement gradually increases. After 20 s, the displacement of the masonry failure extends to above the second floor, and the wall is further damaged and deformed. After 30 s, some bricks leave the back wall and the displacement is about 0.05–1.00 m. The simulation results show that the Fenghuang Street landslide may cause the collapse of some houses at the foot of the slope, which poses a serious threat to the safety of life and property of residents.
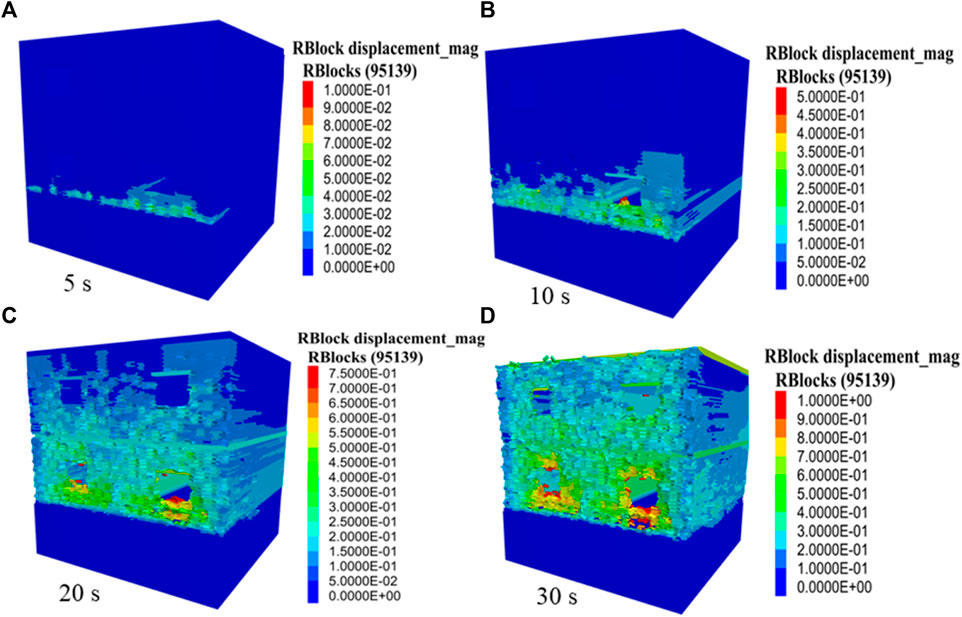
FIGURE 12. Cloud image of displacement of building walls at different times.
Discussion
Discussion for the velocity and displacement
The numerical simulation results of kinematic indexes such as velocity and displacement of landslide are slightly smaller than those statistical formulas (Table 3). We believe that the reason is that the calculation formula abstracts and simplifies the landslide model, and does not consider the energy dissipation caused by collision and friction between the rock and soil particles in the sliding body and sliding surface. As a result, the kinematic indexes are slightly larger than the actual values. However, for numerical simulation, the results of these indexes are more reliable because the friction characteristics between rock and soil particles and the energy dissipation in the sliding process are taken into account. This is also consistent with the understanding of existing related studies (Wei et al., 2019).
Discussion for the impact force
Jiang et al., 2020 completed the test of dry particle flow impact rigid obstacle in the laboratory and obtained the corresponding impact force calculation formula. In their analysis, the normal impact force (
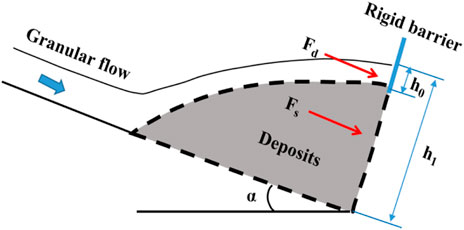
FIGURE 13. Diagram showing rigid barrier impacted by dry granular flow.
The formula is as follows:
here,
However, the numerical simulation monitors the vertical rigid wall on the ground, while the
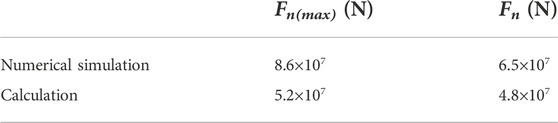
TABLE 4. Comparison of impact forces based on numerical simulation and calculation.
According to the comparison in Table 4, it can be seen that the numerical simulation results are slightly larger than the calculation results. This maybe because the bond strength between particles is considered in the numerical model and its collision energy consumption is less than that of the weak bond of dry particles in the laboratory test. However, they are close in numerical value.
Discussion for the building damage
The discrete element method is used to simulate and predict the damage of the building, and good results are obtained. However, compared with the finite element method, it is difficult for the discrete element method to perfectly consider the strength characteristics of materials such as floor slab, structure column and brick when building the house model. Therefore, it is necessary to establish a finite element model for buildings damage analysis to compare and discuss the effectiveness of the discrete element model. In this study, the finite element system Midas/gen was used to establish the house model, and the landslide impact force obtained from the above was equivalent to the new house model to compare and discuss the effectiveness of the discrete element model.
Firstly, we need to analyze the distribution characteristics of landslide impact force at different heights to determine the load of the wall per unit area. Because the impact force in Figure 11B is a dynamic force, we need to convert it into an equivalent impact force by using Formula 2 and Formula 3.
where:
The impact forces at different heights of rigid walls in Figure 11B are shown in Figure 14A. According to Formula 1 and Formula 2, the fitting curves of the equivalent impact force of landslide at different heights of the wall are shown in Figure 14B.
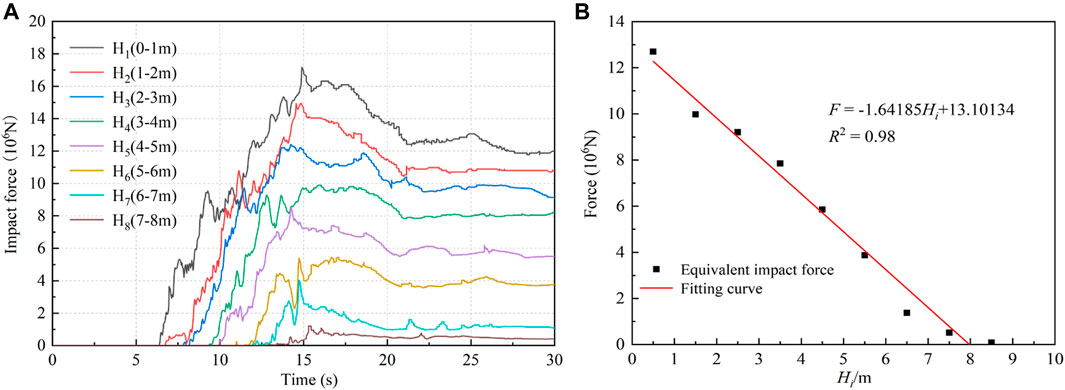
FIGURE 14. Characteristics of landslide impact force in height direction: (A) curves of impact force at different heights; (B) the fitting curve of equivalent impact force and height.
The linear relationship between the equivalent impact force and the height is: F = - 1.64185 Hi + 13.10134 (R2 = 0.98) and the horizontal load is p=-27362.91 H+218356, with the maximum impact load being 2.18×10⁵Pa. The results demonstrate that the equivalent impact force increases with the height of the wall. Figure 15 depicts how the impact load varies with height.
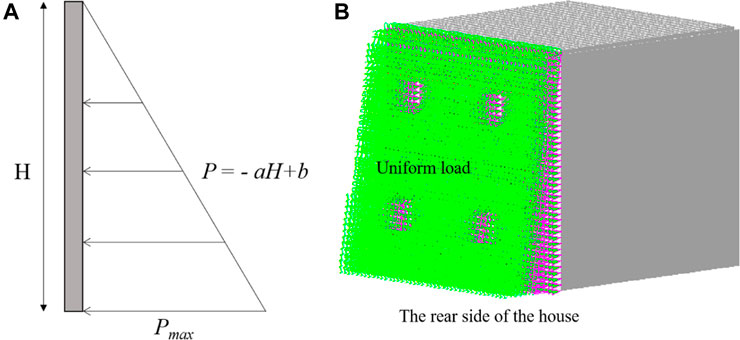
FIGURE 15. Schematic diagram of uniform load distribution on building wall: (A) diagram of uniform load; (B) uniform load on the finite element masonry house model.
Secondly, we use Midas/gen system to establish the finite element model of the middle house at the foot of the landslide. The model employs a cast-in-place concrete floor with a thickness of 100 mm; the masonry wall adopts ordinary sintered brick with a thickness of 240 mm; the width of the building is 8m; and the height of each floor is 4 m. The brick body consisting of sintered ordinary bricks with a strength grade of MU10 and ordinary mortar with an M7.5 mortar grade. According to the elastic modulus table of masonry in the “Code for design of masonry structures” (Chinese Standard: GB5003-2011), the elastic modulus of sintered ordinary brick at mortar strength grade M7.5 is 1600f, and f is the design value of compressive strength of unbored concrete block masonry, which is 2.50 MPa. The Poisson’s ratio for sintered ordinary brick masonry is 0.15, the linear expansion coefficient is 5×10⁻⁶/°C, the elastic modulus is 4×10⁻⁶ kN/m2, and the bulk density is 20 kN/m2.
Thirdly, the landslide equivalent impact force is loaded with the building model. In Midas/gen, the impact load is equivalent to the static load multiplied by the impact factor (impact factor 1.2). The impact force is loaded on the house back wall within 8 m above the ground. The loading mode of house load is self-weight load, roof dynamic load and permanent load, without considering the influence of wind load and other loads.
Figure 16 illustrates the SIG-EFF stress and displacement cloud diagram after the masonry structure is subjected to the impact load of the landslide. From Figure 16A, the overall structural stress of the wall is about 3–8 MPa, the bottom of the masonry structure is constrained by the fixed end, and the structural stress in the middle and bottom of the structural column in the impact surface is high. From Figure 16B, because there is no support at the impact wall but a window on it, the deformation is relatively large, However, the displacement of the structural column and the vertical wall is relatively small, and the outward displacement of the window as the center is reduced, which is similar to the displacement of discrete element house model above. The maximum displacement of 2 m of the impacted wall surface indicates that the masonry structure is severely damaged.
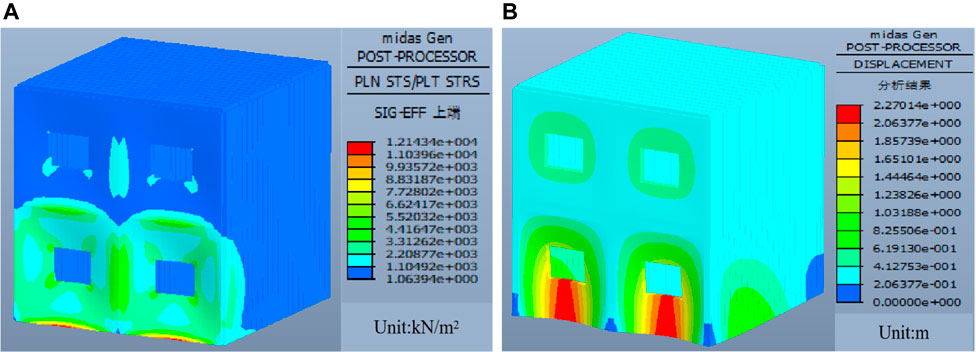
FIGURE 16. The stress and displacement nephogram of building impacted by landslide: (A) stress nephogram; (B) displacement nephogram.
Conclusion
In this paper, the dynamic process of Fenghuang Street landslide in Ningqiang County, Shaanxi Province, China is simulated by discrete element method, and the landslide impact damage to buildings at the foot of the slope is predicted. Through research and comparative analysis, it is concluded that the maximum moving distance of the landslide can reach 40 m, the peak velocity can reach 3.2 m/s, and the maximum horizontal impact force can reach 8.6×10⁷ N. Landslide can causes serious damage to the houses near the foot of the slope, especially those located at the middle position, which should be paid enough attention to. At the same time, this study improves the necessary reference for landslide risk assessment using discrete element method, especially the quantitative prediction of vulnerability for the elements at risk. However, there are some limitations in the study of this paper. For example, the landslide model does not consider the strength difference of landslide materials in the depth direction, and due to the limitation of calculation performance, it fails to establish a complete simulation model for all buildings, no matter the discrete element model or the finite element model. These deficiencies are also the focus of our next research.
Data availability statement
The original contributions presented in the study are included in the article/Supplementary Material, further inquiries can be directed to the corresponding author.
Author contributions
ZZ proposed research ideas and methods. ZZ and XC discussed the research plan, carried out landslide survey, simulated landslide process, wrote and revised the manuscript. JM helped in numerical simulation and discussion; WY carried out landslide exploration and mapping.
Funding
This work was supported by the National Natural Science Foundation of China (41302276) and the Scientific Research Project of Geological Research Institute for Coal Green Mining, Xi’an University of Science and Technology (MTy 2019-22).
Conflict of interest
The authors declare that the research was conducted in the absence of any commercial or financial relationships that could be construed as a potential conflict of interest.
Publisher’s note
All claims expressed in this article are solely those of the authors and do not necessarily represent those of their affiliated organizations, or those of the publisher, the editors and the reviewers. Any product that may be evaluated in this article, or claim that may be made by its manufacturer, is not guaranteed or endorsed by the publisher.
References
Andrewwinner, R., Chandrasekaran, S., and Gobinath, R. (2022). Finite element and vulnerability analyses of a building failure due to landslide in kaithakunda, Kerala, India. Adv. Civ. Eng. 2022, 1–18. doi:10.1155/2022/5297864
Ashwood, W., and Hungr, O. (2016). Estimating total resisting force in flexible barrier impacted by a granular avalanche using physical and numerical modeling. Can. Geotech. J. 53 (10), 1700–1717. doi:10.1139/cgj-2015-0481
Chen, Z., and Song, D. (2020). Numerical investigation of the recent Chenhecun landslide (Gansu, China) using the discrete element method. Nat. Hazards (Dordr). 105 (1), 717–733. doi:10.1007/s11069-020-04333-w
Choi, S. K., Park, J. Y., Lee, D. H., Lee, S. R., Kim, Y. T., and Kwon, T. H. (2020). Assessment of barrier location effect on debris flow based on smoothed particle hydrodynamics (SPH) simulation on 3D terrains. Landslides 18 (1), 217–234. doi:10.1007/s10346-020-01477-5
Gao, G., and Meguid, M. A. (2017). On the role of sphericity of falling rock clusters—Insights from experimental and numerical investigations. Landslides 15 (2), 219–232. doi:10.1007/s10346-017-0874-z
Hu, M., Liu, M. B., Xie, M. W., and Liu, G. R. (2014). Three-dimensional run-out analysis and prediction of flow-like landslides using smoothed particle hydrodynamics. Environ. Earth Sci. 73 (4), 1629–1640. doi:10.1007/s12665-014-3513-1
Hu, X., Fan, X., and Tang, J. (2019). Accumulation characteristics and energy conversion of high-speed and long-distance landslide on the basis of DEM: A case study of sanxicun landslide. J. Geomech. 24 (4), 527–553. doi:10.1007/s12665-014-3513-1
Jiang, Y. J., Fan, X. Y., Su, L. J., Xiao, S. Y., Sui, J., Zhang, R. X., et al. (2020). Experimental validation of a new semi-empirical impact force model of the dry granular flow impact against a rigid barrier. Landslides 18 (4), 1387–1402. doi:10.1007/s10346-020-01555-8
Leshchinsky, B., Vahedifard, F., Koo, H. B., and Kim, S. H. (2015). Yumokjeong landslide: An investigation of progressive failure of a hillslope using the finite element method. Landslides 12 (5), 997–1005. doi:10.1007/s10346-015-0610-5
Li, B., Xing, A., and Xu, C. (2017). Simulation of a long-runout rock avalanche triggered by the lushan earthquake in the tangjia valley, tianquan, sichuan, China. Eng. Geol. 218, 107–116. doi:10.1016/j.enggeo.2017.01.007
Liang, J., Wang, T., and Hong, L. (2014). Comparative study on test methods of shear strength of brick along horizontal bed joints. Build. Struct. 44 (02), 75–78. doi:10.19701/j.jzjg.2014.02.015
Liu, W., Yan, S., and He, S. (2018). Landslide damage incurred to buildings: A case study of shenzhen landslide. Eng. Geol. 247, 69–83. doi:10.1016/j.enggeo.2018.10.025
Liu, X., Wang, Y., and Li, D. Q. (2020). Numerical simulation of the 1995 rainfall-induced fei tsui road landslide in Hong Kong: New insights from hydro-mechanically coupled material point method. Landslides 17 (12), 2755–2775. doi:10.1007/s10346-020-01442-2
Lo, C. M., Huang, W. K., and Lin, M. L. (2016). Earthquake-induced deep-seated landslide and landscape evolution process at Hungtsaiping, Nantou County, Taiwan. Environ. Earth Sci. 75 (8), 645–661. doi:10.1007/s12665-016-5474-z
Lo, C. M., Lin, M. L., Tang, C. L., and Hu, J. C. (2011). A kinematic model of the Hsiaolin landslide calibrated to the morphology of the landslide deposit. Eng. Geol. 123 (1-2), 22–39. doi:10.1016/j.enggeo.2011.07.002
Luo, H. Y., Shen, P., and Zhang, L. M. (2019). How does a cluster of buildings affect landslide mobility: A case study of the shenzhen landslide. Landslides 16 (12), 2421–2431. doi:10.1007/s10346-019-01239-y
Luo, H. Y., Zhang, L. M., Wang, H. J., and He, J. (2021). Process of building collapse caused by the Po Shan Road landslide in Hong Kong on 18 June 1972. Landslides 18 (12), 3769–3780. doi:10.1007/s10346-021-01745-y
Ma, S., Wei, J., Xu, C., Shao, X., Xu, S., Chai, S., et al. (2020). UAV survey and numerical modeling of loess landslides: An example from zaoling, southern shanxi Province, China. Nat. Hazards (Dordr). 104 (1), 1125–1140. doi:10.1007/s11069-020-04207-1
Mi, Y., and Wang, J. (2021). Finite-element modeling of submarine landslide triggered by seismic loading in saturated cohesive soil deposits. Bull. Eng. Geol. Environ. 80 (2), 951–965. doi:10.1007/s10064-020-02005-4
Scheidegger, A. E. (1973). On the prediction of the reach and velocity of catastrophic landslides. Rock Mech. 5, 231–236. doi:10.1007/bf01301796
Shen, W., Zhao, T., Zhao, J., Dai, F., and Zhou, G. (2018). Quantifying the impact of dry debris flow against a rigid barrier by DEM analyses. Eng. Geol. 241, 86–96. doi:10.1016/j.enggeo.2018.05.011
Tang, C. L., Hu, J. C., Lin, M. L., Angelier, J., Lu, C. Y., Chan, Y. C., et al. (2009). The Tsaoling landslide triggered by the Chi-Chi earthquake, Taiwan: Insights from a discrete element simulation. Eng. Geol. 106 (1-2), 1–19. doi:10.1016/j.enggeo.2009.02.011
Tang, C. L., Hu, J. C., Lin, M. L., Yuan, R. M., and Cheng, C. C. (2012). The mechanism of the 1941 tsaoling landslide, taiwan: Insight from a 2D discrete element simulation. Environ. Earth Sci. 70 (3), 1005–1019. doi:10.1007/s12665-012-2190-1
Wang, N. Q. (1989). Geomorphologic prediction of landslide movement distance. Railw. Geol. Subgrade 3, 42∼47.
Wei, J., Zhao, Z., Xu, C., and Wen, Q. (2019). Numerical investigation of landslide kinetics for the recent Mabian landslide (Sichuan, China). Landslides 16 (11), 2287–2298. doi:10.1007/s10346-019-01237-0
Ying, C., Zhang, K., Wang, Z. N., Siddiqua, S., Makeen, G., and Wang, L. (2020). Analysis of the run-out processes of the Xinlu Village landslide using the generalized interpolation material point method. Landslides 18 (4), 1519–1529. doi:10.1007/s10346-020-01581-6
Zaniboni, F., and Tinti, S. (2014). Numerical simulations of the 1963 vajont landslide, Italy: Application of 1D Lagrangian modelling. Nat. Hazards (Dordr) 70(1), 567–592. doi:10.1007/s11069-013-0828-2
Keywords: fenghuang street landslide, dynamic process, brick-concrete buildings, numerical simulation, impact damage
Citation: Zhao Z, Chen X, Wei J, Ma J and Ye W (2023) Numerical study on landslide dynamic process and its impact damage prediction to brick-concrete buildings, a case from Fenghuang street landslide in Shaanxi, China. Front. Earth Sci. 10:1004710. doi: 10.3389/feart.2022.1004710
Received: 29 July 2022; Accepted: 07 November 2022;
Published: 16 January 2023.
Edited by:
Hans-Balder Havenith, University of Liège, BelgiumReviewed by:
Neelima Satyam, Indian Institute of Technology Indore, IndiaGobinath R, SR University, India
Copyright © 2023 Zhao, Chen, Wei, Ma and Ye. This is an open-access article distributed under the terms of the Creative Commons Attribution License (CC BY). The use, distribution or reproduction in other forums is permitted, provided the original author(s) and the copyright owner(s) are credited and that the original publication in this journal is cited, in accordance with accepted academic practice. No use, distribution or reproduction is permitted which does not comply with these terms.
*Correspondence: Zhou Zhao, NTk0NjgyMTU5QHFxLmNvbQ==