 Guanbo Zhou
 Jia Du4
 Jie Cao
- 1National Meteorological Centre, Beijing, China
- 2Key Laboratory of Meteorological Disaster (KLME), Ministry of Education and Collaborative Innovation Center on Forecast and Evaluation of Meteorological Disasters (CIC-FEMD), Nanjing University of Information Science and Technology, Nanjing, China
- 3State Key Laboratory of Severe Weather (LASW), Chinese Academy of Meteorological Sciences, Beijing, China
- 4Institute of Atmospheric Physics, Chinese Academy of Sciences, Beijing, China
- 5Institute of Atmospheric Physics, Chinese Academy of Sciences, Beijing, China
Modification of the divergent wind components and domain of interests can result in obvious changes in the kinetic energy (KE) budget of typhoons and other synoptic systems. Before analyzing the effects of divergent winds on the KE budget of Typhoon Rumbia (2018) during its entire life cycle, especially in its extratropical transition (ET) process, a hybrid integral method to partition the horizontal wind fields in a limited domain with high accuracy is adopted, in comparison with the commonly used iterative method under two sets of domains, that is, the typhoon following domain and the outermost domain that covers the entire typhoon track. The relative importance of the divergent and non-divergent winds in the KE budget is investigated in the three stages of the ET process, namely, the pre-development, re-intensification, and dissipation stages. It is found that the divergent winds computed by the iterative method with a lower accuracy result in sizable errors in spatiotemporal variations of the KE of the typhoon during its ET process, which thus leads to obvious forecasting errors.
Highlights
1) The significant modification of divergent winds could change the kinetic energy variations.
2) Kinetic energy budgets by the divergent winds during the entire extratropical transition of the typhoon are important.
Introduction
Extratropical transition (ET) is a special process by which a tropical cyclone (TC), upon encountering the mid-latitude circulation systems, transforms into an extratropical cyclone. The ET process often makes the meso- and small-scale systems in typhoons develop and dissipate frequently (Meng et al., 2002), resulting in severe weather. When the TC changes into an extratropical cyclone, obvious changes in the wind field structure, moving speed and direction, and precipitation distribution are observed (Knox 1955; Sekioka 1956; Harr et al., 2000; Klein et al., 2000 and 2002; Niu et al., 2005; Chen et al., 2001). Therefore, the accuracy and timeliness of relevant forecasting are required, which thus brings great difficulty to forecasting. Severe weather such as heavy precipitation, strong wind, and storm surge formed during the ET often poses a great threat to life safety and causes great economic losses to coastal areas of mid-latitudes because of low forecasting accuracy and short warning time. Therefore, the ET of TCs has been widely concerned and has become the research focus of meteorologists (Zhong et al., 2009; Li et al., 2008; Klein et al., 2000; Harr et al., 2000a, b; Evans et al., 2004; Han et al., 2005).
The kinetic energy (KE) budget analysis is a powerful tool for studying severe storms in synoptic-scale systems, such as extratropical cyclogenesis, severe wind, southwest vortex, and the associated torrential rainfall (Chen and Wiin-Nielsen 1976; Chen et al., 1978; Fu et al., 2016; Smith et al., 2018; Zhong et al., 2021). In addition, the impacts of divergent winds on the KE budget are mostly used when examining the TC movement, particularly during the period of TC generation or intensification (Dimego and Bosart 1982a, b; Ding and Liu 1985a, b; Sun et al., 2012; Peng et al., 2014a, b). According to Roberson and Smith (1980), the horizontal flux convergence serves as the major source of the upper-level jet and a determinant of its strength, while its rotating component dominates when the upper-level trough increases rapidly (Dimego and Bosart 1982a, b). The asymmetric structure of the TC was poorly reflected in earlier KE budget analyses, which mostly took the targeting systems as a whole. By further dividing the rotational and divergent KE budgets into the axisymmetric and asymmetric components, Wang et al. (2016) took into consideration the asymmetry during TC generation.
The horizontal velocity field can be partitioned into rotational and divergent components represented by the stream function and velocity potential, respectively. This flow decomposition approach has been widely used in studying atmospheric and oceanic circulations, weather analyses, and data assimilations (Haltiner and Williams 1980; Dimego and Bosart 1982; Hollingsworth and LÄonnberg 1986; Allen et al., 1990; Daley 1991; Vallis et al., 1997; Xu and Wei 2001 and 2001; Mewes and Shapiro 2002; Jung and Arakawa 2008; Zhao and Cook 2021). Cao et al. (2022a) reviewed three previous methods, namely, the classical successive over-relaxation (SOR) scheme, which is a commonly used iterative method, the spectral method by Chen and Kuo (1992a), and the integral method by Xu et al. (2011). Although they have been applied to various velocity fields in diagnostic studies of weather systems, they all tend to lose accuracy considerably when used in mesoscale studies of strong and complex flow fields. In order to get a better understanding of the KE budgets and their evolutions during the complicated ET, the newly developed hybrid method (Cao et al., 2022a), which optimally combines the SOR method and the integral approach with high accuracy, is adopted in this study. A comparative analysis is also performed with results obtained from the traditionally used SOR method (Cao et al., 2019; Chen and Kuo, 1992b; Dimego and Bosart, 1982b; Ullah et al., 2020; Ullah et al., 2021; You and Fung, 2019).
With the aim to investigate the characteristics of KE in the ET and the effects of an accurate wind-partitioning solver on the KE budget during the ET under different domains of interests, Typhoon Rumbia (2018) is taken as an example for its record-breaking long durations after landing. Theoretical considerations of the KE equation and wind partitioning methods are reviewed in Methodology and case overview. The synoptic analysis of Typhoon Rumbia and domains of interests are described in Kinetic energy analyses, followed by comparative studies of KE during the three periods of the ET in Kinetic energy analyses. Finally, the conclusions are in the last section.
Methodology and case overview
Kinetic energy budget equations
The kinetic energy K is thus expressed as follows (Chen et al., 1978):
Here, the kinetic energy per unit mass (k) is given as k = v.v/2. According to Helmholtz’s theorem, the horizontal wind (v) is the summation of the rotational component (vr) and the divergent component (vd). The subscripts R and D represent the rotational and divergent components, respectively.
The KE budget equation together with its two components over a limited domain is as follows (Buechler and Fuelberg, 1986; Abdeldym et al., 2019; Cao et al., 2022b):
Among them, T1 =
Here, s is the area of the limited domain. T0, T0r, and T0d represent the temporal variations of KE, Kr, and Kd, respectively. T1r and T1d represent the horizontal flux divergence of total K by vr and vd, respectively. T2 is the vertical divergence of K. T3r and T3d represent conversions between the available potential energy and Kr and Kd through baroclinic processes, respectively. INTR is the interactions between Kd and Kr due to the presence of Kd, and INTD is similar. Af and Az are to satisfy the conservation of angular momentum on the tangential and rotational motions, respectively. Terms B and C are vertical exchanges of rotational and divergent momentums, respectively.
The hybrid method for computing the stream function and velocity potential
The detailed computational procedures of the hybrid integral-SOR method (Cao et al., 2022a) are shown in Figure 1. To be specific, (ψ, χ) is divided into (ψi, χi) and (ψe, χe) for the internally and externally induced components, respectively, in the same way as in the integral method. To retain the strength and related advantages for the integral method, the internally induced component, (ψi, χi), should be calculated in the first step in the same way as that in the integral method. The SOR-based method can be used adaptively for computing the externally induced ψe (with χe = 0) in the second step. This can improve the accuracy of (ψe, χe) computed in the second step. This hybrid method is less sensitive than the integral method to increased variations of original v across or along the domain boundary and their caused errors in solvability conditions and related boundary condition errors. The test results from the hybrid method in computing (ψ, χ) from original v fields with complex flow patterns in mesoscale domains will be shown in the following section in comparison with the results from the SOR method.
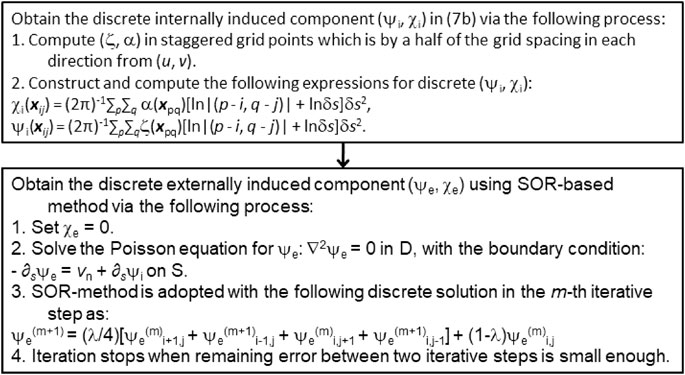
FIGURE 1. Computational procedure of the hybrid integral–SOR method (Modified from Figure 1 in Cao et al., 2022a).
Modifications of divergent winds obtained from two methods
Evaluations and verifications can be performed only by comparing the reconstructed horizontal velocity [denoted by vc ≡ (uc, vc)] with the original velocity [still denoted by v ≡ (u, v)] for the closeness of vc to v. Quantitatively, the closeness of vc to v can be measured in terms of the spatial correlation coefficient (SCC) and relative root mean square difference (RRD) defined by
Here, m and n are the numbers of grid points in x and y directions, respectively, inside of the concerned domain; ∑i,j denotes the summation over i from 1 to m and j from 1 to n; Uc, Vc, U, and V are the mean values of uc, vc, u, and v, respectively, over the concerned domain, and
A high SCC and small RRD indicate a high accuracy of vc and vice versa.
For the TY1818 case (Figure 2), SCC by the hybrid method >0.999 in all levels at all times, while SCC by the relaxation method <0.99. RRD by the hybrid method <0.03 in all levels at all times, while RRD by the relaxation method >0.1. Accuracy of the relaxation method is 1/30 of the hybrid method in most levels at most times. Larger deviations between the original v and reconstructed vc can be seen at lower levels beneath 700 hPa than the results at other vertical levels and during ET in both methods, due to the complexity of the flow patterns. However, the accuracy loss at lower levels by the hybrid method is less than 1%, while that by the relaxation method is more than 10%, which may result in misrepresenting the real features of the partitioned vd during ET. The comparative analysis of the KE budgets computed by partitioned vr and vd from the hybrid and SOR methods will be performed in the following section.
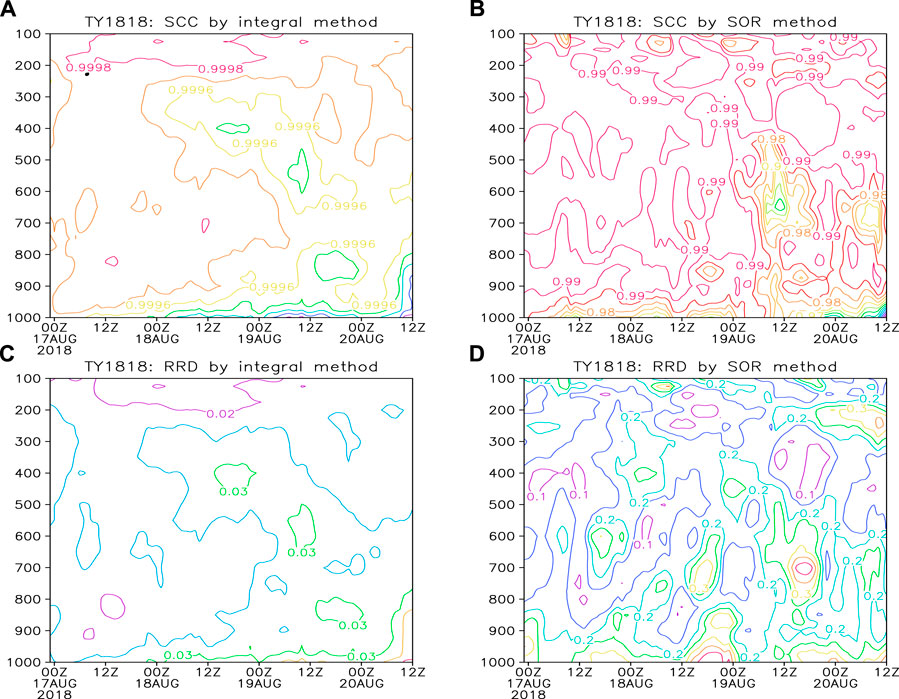
FIGURE 2. SCC (a, interval = 0.0001) and RRD (c, interval = 0.005) by the integral method in all vertical levels from 00 UTC 17 August to 12 UTC 20 August 2018. The lower panels are SCC (interval = 0.005) and RRD (interval = 0.05) by the SOR method, respectively.
Kinetic energy analyses
Case overview
A tropical depression formed over the northwestern Pacific Ocean at 0000 UTC on 15 August 2018, which developed into the tropical storm Rumbia (No. 1818) at 0600 UTC on the same day. At 2000 UTC on August 16, it caused a landfall (force 9 on the Beaufort scale, 23 m s−1, 985 hPa) over the coast of the southern Pudong New District in Shanghai before weakening into a tropical depression within the Henan province in the afternoon of August 18, transforming into an extratropical cyclone in the northern Shandong province and further weakening over the northern Yellow Sea on the night of August 20. On August 21, the National Meteorological Center stopped its numbering.
On the night of August 18 (Figure 3), Rumbia moved slowly in the saddle field at 500 hPa geopotential height, blocked by the weak high-pressure barrier on the north side. Meanwhile, the warm core structure in the upper level was still intact, and the cold air effect was not obvious.
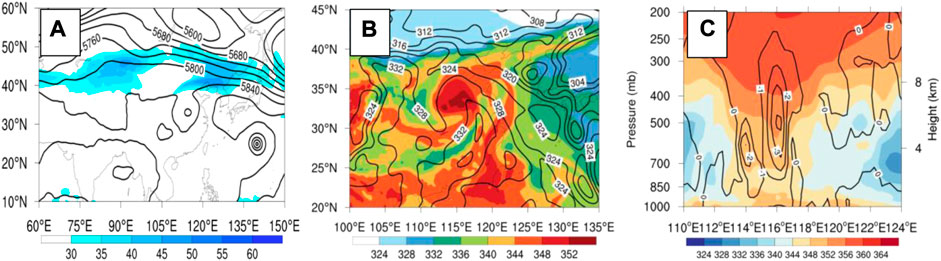
FIGURE 3. (A) 500-hPa height field (contours) with 200-hPa high-altitude rapids (>30 m/s, filled area), (B) 500-hPa pseudo-equivalent potential temperature (filled area, in K) and 500-hPa 336-K contours (solid black line), and (C) vertical distribution of the pseudo-equivalent potential temperature at 1200 UTC on 18 August 2018.
From the night of August 19 to the early morning of August 20 (Figure 4), Rumbia began to merge into the westerly trough. The cold air behind the trough gradually moved from the low level to the left side of Rumbia, and the warm core structures in the middle and upper levels were gradually destroyed.
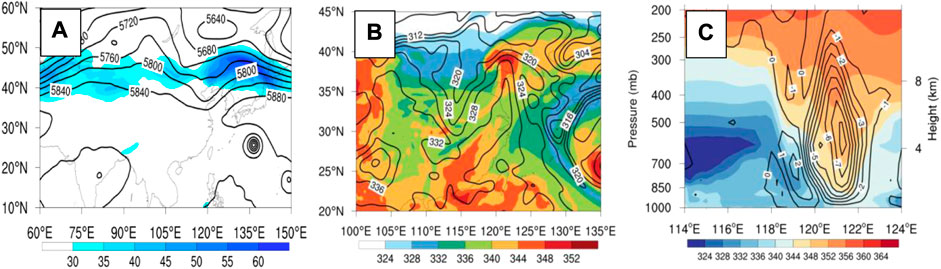
FIGURE 4. (A) 500-hPa height field (contours) with 200-hPa high-altitude rapids (>30 m/s, filled area), (B) 500-hPa pseudo-equivalent potential temperature (filled area, in K) and 500-hPa 336-K contours (solid black line), and (C) vertical distribution of the pseudo-equivalent potential temperature at 0000 UTC on 20 August 2018.
During the daytime on August 20, Rumbia over the Bohai Sea and Yellow Sea was in the process of extratropical transition. On the night of the 20th (Figure 5), the process of transitioning to an extratropical cyclone was basically completed over the northern Yellow Sea. In this process, Rumbia in the low level was quickly surrounded by the cold air from the northwest side, and the warm core structure in the upper level completely disappeared, presenting an obvious frontal structure.
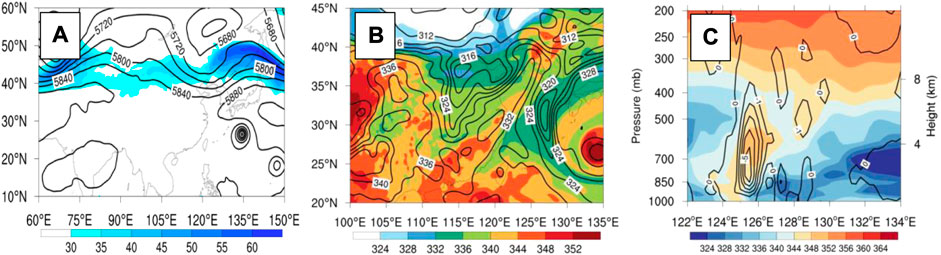
FIGURE 5. (A) 500-hPa height field (contours) with 200-hPa high-altitude rapids (>30 m/s, filled area), (B) 500-hPa pseudo-equivalent potential temperature (filled area, in K) and 500-hPa 336-K contours (solid black line), and (C) vertical distribution of the pseudo-equivalent potential temperature at 1200 UTC on 20 August 2018.
Applications in diagnosing ET
The rotational component of kinetic energy (Kr) of TC following domain vertically integrated by the integral method decreases at the same rate as K0 before the ET and starts to increase ahead of K0 (Figure 6A) at 0000 UTC on August 18. The divergent component of the kinetic energy (Kd) varies less abruptly before the ET and doubles its magnitude suddenly within 12 h, which then decreases since 0000 UTC on August 20. Before the ET, the evolution of Kr by the SOR method (Figure 6B) deviates from that of K0 since 0000 UTC on August 18, while Kd decreases sharply. Their temporal evolutions after the ET are similar to the aforementioned results by the integral method but of different magnitudes. This discrepancy is consistent with the locations of the low accuracy shown in Figures 2B,D. The large error from the SOR method causes the fluctuation of Kd before the ET, but the increasing range of Kd decreases, and the time of increase shortens after the ET. Compared with the divergent wind component (
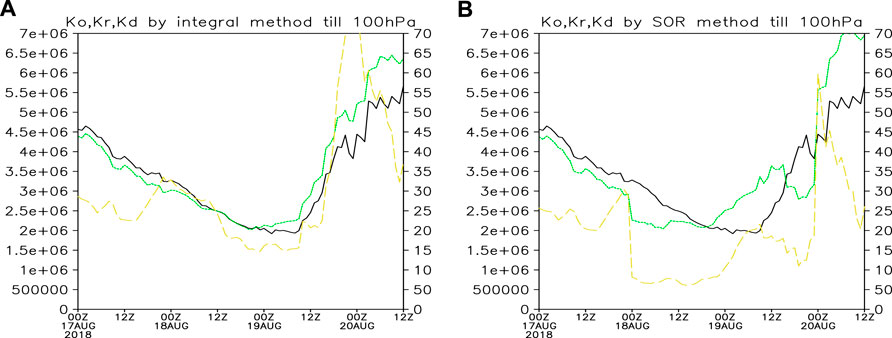
FIGURE 6. K0 (black), Kr (green), and Kd (yellow) by (A) the hybrid method, and (B) the SOR method.
Kinetic energy analyses
Vertical distributions of the temporal mean kinetic energy in different periods of ET
The conversions from PE to Kd and from Kd to Kr are known to be the main source of Kr (Figure 7). The time-averaged KE budgets for TC in its following domain and all domains at each pressure level are depicted in Figure 7. The intense low-level structure of typhoon circulation manifests as the maxima below 800 hPa in the Kr and Kd curves (Figure 7A), while in contrast, only the maxima of Kr and K0 around 200 hPa associated with the subtropical strong jet are retained (Figure 7D). T1 in the typhoon following domain (Figure 7B) plays the role of either a source or sink at different levels, while the corresponding values in the outermost domain (Figure 7E) present identical sink characteristics. The increase in T3r in the upper level and the decrease in T3d in the whole layer (Figure 7C) are not detected in the outermost domain (Figure 7F) due to the influence of the strong upper-level jet.
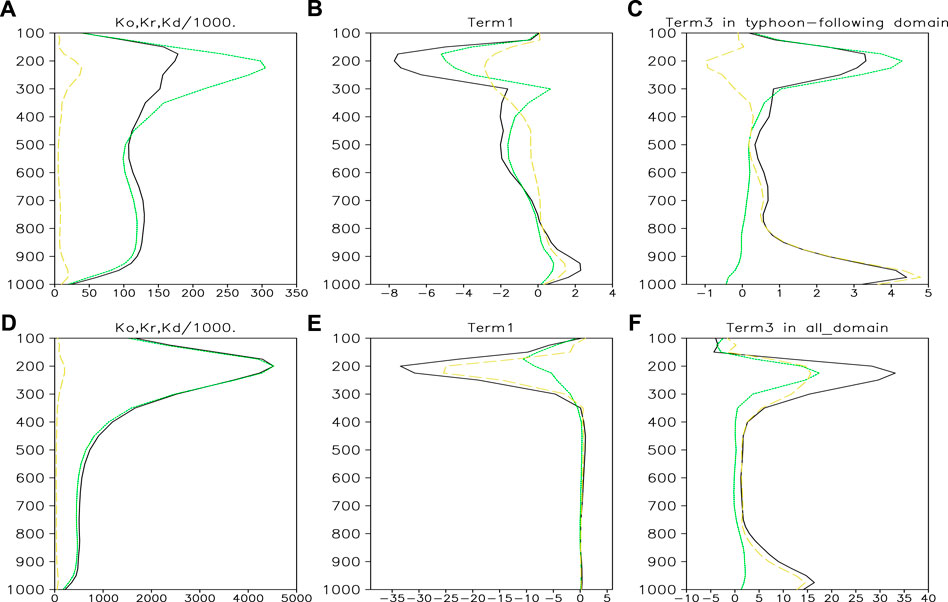
FIGURE 7. (A) K0 (black), Kr (green), and Kd (yellow); (B) T1 (black), T1r (green), and T1d (yellow), and (C) T3 (black),T3r (green), and T3d (yellow) by hybrid method averaged over the entire ET process in the TC following domain. (D–F) are corresponding all domain.
In the outermost domain, only the influence of the upper-level jet at 200 hpa can be found (Figures 8D–F). The large-value center of Kr appears one after another, which represents the southward extension of the 200 hPa jet, while Kd reflects that the divergence center of the 200-hPa jet is close. Figures 8A–C display that K0 in the upper level decreases first, then increases, and gradually transfers to the lower level, while K0 in the lower level decreases first, varies little from 0000 UTC to 1800 UTC on August 19, and then increases. The Kr in the upper level increases in advance, and its intensity is greater than that of K0, but it is transferred to the lower level later than K0, and the change of Kr in the lower level is consistent with that of K0. The time for Kd to weaken and start to increase in the upper level is consistent with that of K0. Kd rapidly weakens after 1800 UTC on August 19 (when the divergence accompanying the typhoon circulation in the upper level disappeared and transitioned into an extratropical cyclone), and the transfer to the lower level stops, after which a large-value center appears in the lower level. Therefore, the results in the TC-following domain are adopted to further analyze the ability to represent the vertical variation of the KE budget. Based on the K0 evolution, the ET process is divided into three stages, namely, the pre-development stage (from 0600 UTC to 2200 UTC on August 18), re-intensification stage (from 2300 UTC on August 18 to 1700 UTC on August 19), and ET stage (from 2000 UTC on August 19 to 1200 UTC on August 20).
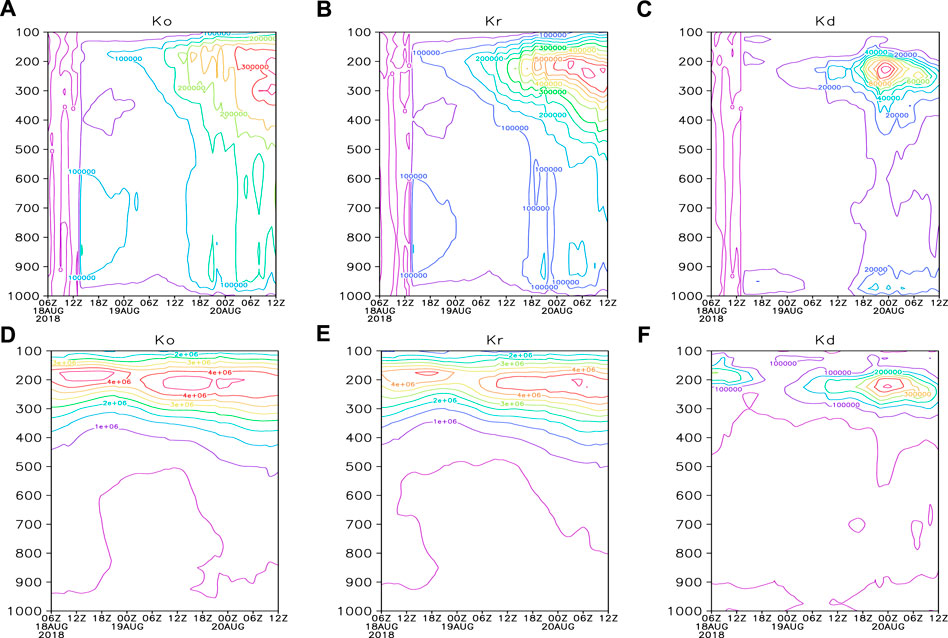
FIGURE 8. K0, Kr, and Kd in the typhoon-following domain (A–C) and outermost domain (D–F).
In terms of the average over the entire TC life cycle, the KE generated by the cross-contour flow (T3 in Figure 7C) is a persistent source with two maxima at 950 hPa and 200 hPa, while T1 acts as the main sink in the middle and upper levels. Known as the major source or sink terms of different levels at different stages of the TC life cycle, T1 and T3 are analyzed in three stages during the ET (Figure 9). As the TC loses its tropical characteristics,
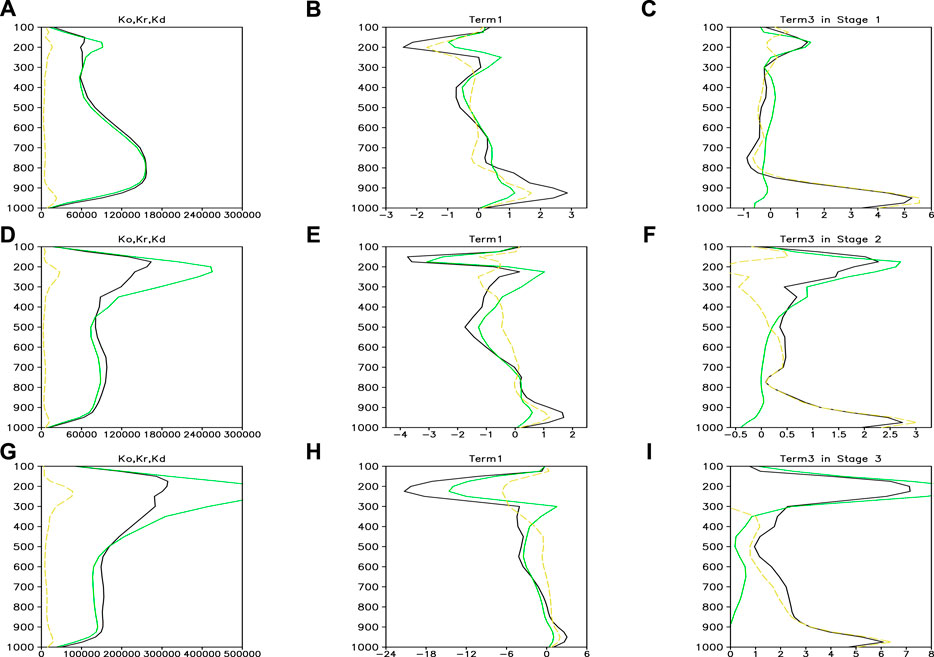
FIGURE 9. Same as Figures 7A–C but averaged over the pre-development stage (A–C), the reintensification stages (D–F) and the ET stage (G–I).
Time–height variations of kinetic budget quantities
Figure 10 distinctly displays the KE budget calculated by the integral method in the TC-following domain during the three stages of ET. Before the occurrence of ET, T1 in the upper and lower layers changes little but decreases in the lower layer (determined by T3d) and gradually increases in the upper layer (determined by T3r). Since the start of the ET, T1 changes little in the lower layer, while T1r in the upper layer presents a strong sub-center and is transferred downward. T1r varies little in the lower layer, which manifests as a sub-center but is not transferred downward obviously in the upper layer. T1d presents a maximum in the lower layer and a sub-center in the upper layer, which is transferred downward obviously. T3 in the lower layer increases first and then decreases, which has a change trend consistent with that of T3d, while its intensity is weaker than that of T3d. Meanwhile, T3 in the upper layer increases first and then decreases. This increase appears later than that in the lower layer, and then, the positive value is transferred downward. However, there is no signal in the lower layer, and the T3 in the upper layer increases first and then decreases without obvious downward transfer. T3d in the lower layer first increases and then decreases, the positive value is transferred to the upper layer, and thus, a sub-center appears in the upper layer. After the ET process, T1 and T3 present opposite changes at the top level, especially because T1 reflects the trend that K0 weakens first and then strengthens in the upper level, as shown in Figure 9A. The ET needs
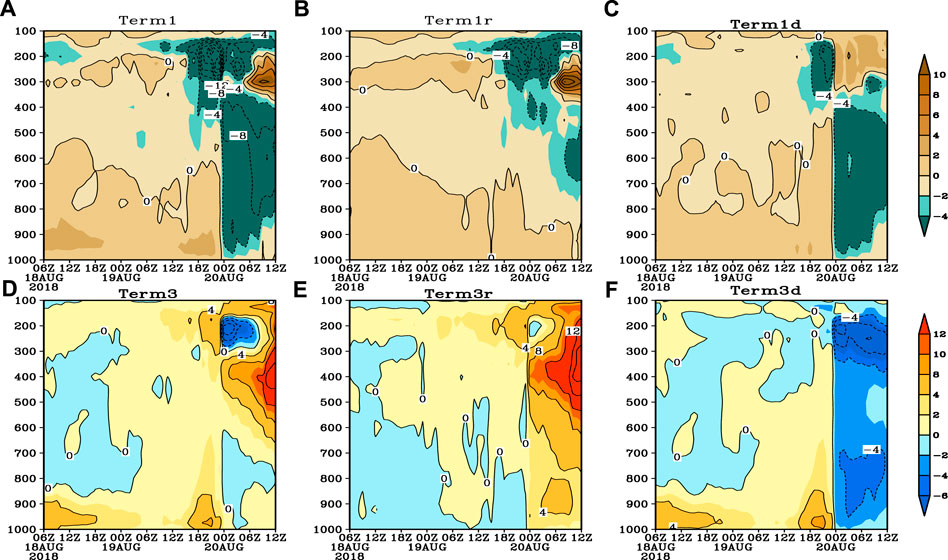
FIGURE 10. (A) T1, (B) T1r, (C) T1d, (D) T3, (E) T3r, and (F) T3d by the hybrid method in the typhoon-following domain.
Figure 11 reveals that T3 calculated by the SOR method shows obvious differences before and after the ET. However, T3d does not reflect the process of storing kinetic energy to stimulate the ET before its occurrence in the lower layer but presents false signals of evolution (first increase and then decrease) in the upper layer, which reflects the delay of ET occurrence time. After the ET, T3d shows a downward transfer of the positive value center, which is contrary to the upward transfer of the positive value center shown in Figure 10F. The results indicate that the SOR method in the TC-following domain performs poorly in T3, T3r, and T3d.
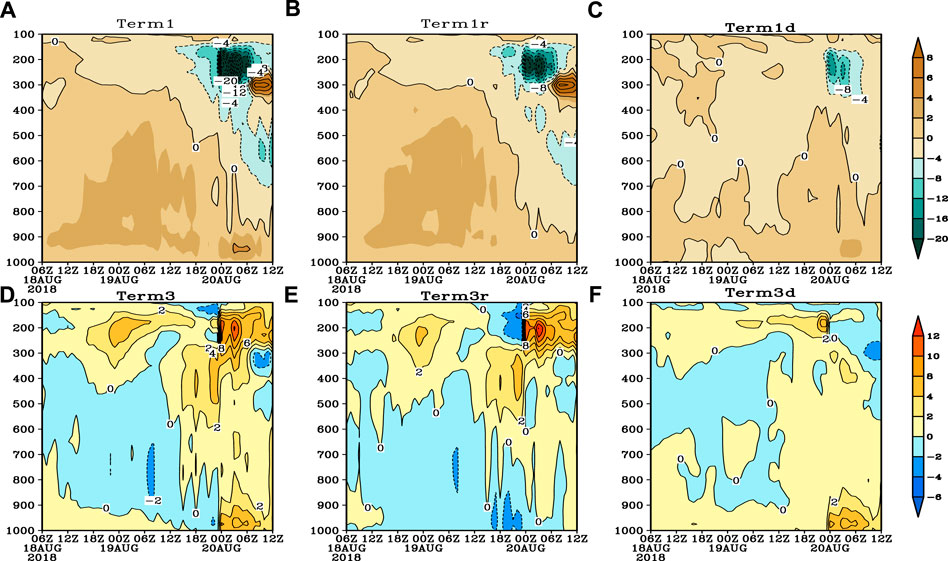
FIGURE 11. (A) T1, (B) T1r, (C) T1d, (D) T3, (E) T3r, and (F) T3d by the SOR method in the typhoon-following domain.
Quantitative analysis of the interaction term between Kd and Kr
Quantitative values for Af, Az, B and C at upper and lower levels are recorded in Table 1. In order to present the specific comparisons during ET of Typhoon Rumbia (2018), the ET from 15 UTC on the 19th to 03 UTC on the 20th is divided into three stages, that is, before the ET(the first 3 hours), at ET time (21 UTC on the 19th), and after the ET (the last 3 hours). Af is to satisfy the conservation of angular momentum on the tangential motion, Az is to satisfy the conservation of angular momentum on the rotational motion, B represents the vertical exchange of rotational momentum, and C represents the vertical exchange of divergent momentum.
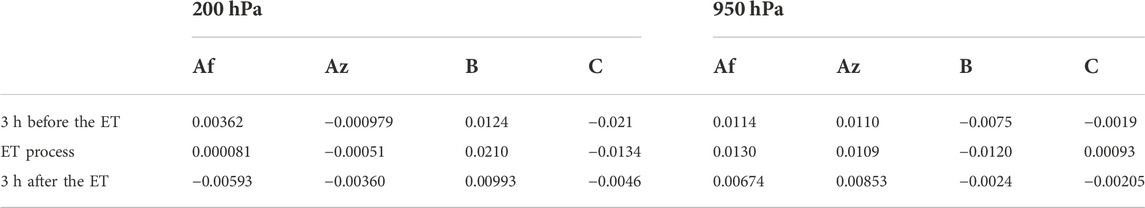
TABLE 1. Af, Az, B, and C at 200 hPa and 950 hPa (unit: Wm−2).
It can be seen from Table 1 that in the ET stage, B in the upper layer is the maximum value and B in the lower layer is the minimum value. After the ET, B in the upper layer decreases significantly and B in the lower layer increases significantly. The value of C is just the opposite. In the ET stage, C in the upper layer is the minimum value and C in the lower layer is the maximum value. After the ET, B in the upper layer obviously increases, while C in the lower layer obviously decreases. Before and after the ET stage, the magnitude of AF and AZ was similar, and AF and AZ decreased significantly after the ET.
It shows that the change trend of the rotational wind energy in the vertical direction before and after the ET stage is opposite to that of the divergent wind energy. After the ET stage, the rotational wind energy in the vertical direction increases significantly, while the divergent wind energy in the vertical direction decreases significantly. In particular, the divergent wind energy in the lower layer shows a positive value in the ET stage, and it is negative before and after the ET stage. This shows that the obvious change of the divergent wind energy has a certain indicative significance for the ET.
Conclusion and discussions
By using a hybrid method to partition the horizontal wind field in a limited domain, this study analyzes the effects of divergent winds on the KE budget of Typhoon Rumbia (1818) during its entire life cycle, especially during the ET in the TC-following domain and the outermost domain that covers the entire typhoon track. Comparisons with the results from the commonly used SOR method have proved the high accuracy of the hybrid method. The roles of Kd in the ET during the life cycle of Typhoon Rumbia are analyzed with the following preliminary results:
1) The KE budget analysis is useful for studying ET. It is found that the KE budgets by the divergent winds are of vital importance during the entire ET of the typhoon.
2) The adoption of the accurate mathematical approach is more appropriate for complex flow patterns such as the one during the ET is proved in this study. It is found that modification of the divergent wind components leads to obvious changes in the spatiotemporal variations of the KE budget. The divergent winds computed by the SOR method with a lower accuracy result in sizable errors in spatiotemporal variations of the KE during the ET, which thus leads to significant forecasting errors. Although the three complicated stages with distinct characteristic flow patterns in the ET period of Rumbia (1818) are investigated with the same conclusions, more cases will be checked to amend limitations to this study in the future.
3) The distribution of the divergent winds in the KE budget is found to be asymmetric after Typhoon Rumbia’s landfall. In our subsequent research, the relationship between the KE budgets in different quadrants and the tremendous precipitation will be explored by using the integral method in the TC-following domain.
Data availability statement
The raw data supporting the conclusions of this article will be made available by the authors, without undue reservation.
Author contributions
Conceptualization, GZ and JC; methodology, JD and JC; analyze data and software, LL and XL; validation, GZ and JC; formal analysis, JD and XL; writing—original draft preparation, GZ; writing—review and editing, JC; funding acquisition, LL.
Funding
This work was supported by the National Key R&D Program of China (2022YFC3004200), the National Natural Science Foundation of China (42175011), the Open Grants of the State Key Laboratory of Severe Weather (2022LASW-B09), and the Key Laboratory of South China Sea Meteorological Disaster Prevention and Mitigation of Hainan Province (SCSF202101).
Acknowledgments
The authors are thankful to the reviewers for their comments and suggestions on the original manuscript that improved the structures and presentations of the results. The computing for this project was performed at the Supercomputing Center for Education and Research at the University of Oklahoma (OU), USA.
Conflict of interest
The authors declare that the research was conducted in the absence of any commercial or financial relationships that could be construed as a potential conflict of interest.
Publisher’s note
All claims expressed in this article are solely those of the authors and do not necessarily represent those of their affiliated organizations, or those of the publisher, the editors, and the reviewers. Any product that may be evaluated in this article, or claim that may be made by its manufacturer, is not guaranteed or endorsed by the publisher.
References
Cao, J., Xu, Q., Chen, H., and Ma, S. (2022a). Hybrid methods for computing the streamfunction and velocity potential for complex flow fields over mesoscale domains. Adv. Atmos. Sci. 39 (9), 1417–1431. doi:10.1007/s00376-021-1280-y
Cao, J., Zhou, G., Zhao, L. Liu W., and Yan, Y. (2022b). Kinetic energy budget analyses among different quadrants during typhoon recurvature: A case study of typhoon Rumbia (2018). Atmos. Res., 106319. doi:10.1016/j.atmosres.2022.106319
Cao, Z., Xu, Q., and Zhang, D. (2019). A new method to diagnose cyclone-cyclone interaction and its influences on precipitation. J. Appl. Meteorol. Climatol. 58, 1821–1851. doi:10.1175/jamc-d-18-0344.1
Chen, Q. S., and Kuo, Y. H. (1992b). A consistency condition for wind-field reconstruction in a limited area and a harmonic-cosine series expansion. Mon. Wea. Rev. 120, 2653–2670. doi:10.1175/1520-0493(1992)120<2653:accfwf>2.0.co;2
Chen, T. C., Alpert, J. C., and Schlatter, T. W. (1978)., 106. TEODAN>2.0.CO, 458–468. doi:10.1175/1520-0493The effects of divergent and nondivergent winds on the kinetic energy budget of amid latitude cyclone: A case studyMon. Wea. Rev.
Chen, T. C., and Wiin-Nielsen, A. (1976). On the kinetic energy of the divergent and nondivergent flow in the atmosphere. Tullus 28, 486–498. doi:10.3402/tellusa.v28i6.11317
Dimego, G. J., and Bosart, L. F. (1982a). The transformation of tropical storm agnes into an extratropical cyclone. Part I: The observed fields and vertical motion computations. Mon. Wea. Rev. 385–411. doi:10.1175/1520-0493(1982)110<0385:TTOTSA>2.0.CO;2
Dimego, G. J., and Bosart, L. F. (1982b). The transformation of tropical storm agnes into an extratropical cyclone. Part II: Moisture, vorticity and kinetic energy budgets. Mon. Wea. Rev. 110 (5), 412–433. doi:10.1175/1520-0493(1982)110<0142:TTOTSA>2.0.CO;2
Ding, Y. H., and Liu, Y. Z. (1985a). On the analysis of typhoon kinetic energy, PartI Budget of total kinetic energy and eddy kinetic energy. Sci. China B 10, 956–966. (in Chinese).
Ding, Y. H., and Liu, Y. Z. (1985b). On the analysis of typhoon kinetic energy, PartII Conversion between divergent and nondivergent wind. Sci. China B 11, 1045–1054. (in Chinese).
Fu, S. M., Wang, H. J., Sun, J. H., and Zhang, Y. (2016). Energy budgets on the interactions between the mean and eddy flows during a persistent heavy rainfall event over the Yangtze River valley in summer 2010. J. Meteorol. Res. 30 (4), 513–527. doi:10.1007/s13351-016-5121-3
Peng, J., Peng, M. S., Li, T., and Hendricks, E. (2014b). Effect of baroclinicity on vortex axisymmetrization. PartII: Baroclinic basic vortex. Adv. Atmos. Sci. 31, 1267–1278. doi:10.1007/s00376-014-3238-9
Peng, M. S., Peng, J., Li, T., and Hendricks, E. (2014a). Effect of baroclinicity on vortex axisymmetrization. Part I: Barotropic basic vortex. Adv. Atmos. Sci. 31, 1256–1266. doi:10.1007/s00376-014-3237-x
Sun, Y., Zhong, Z., and Wang, Y. (2012). Kinetic energy budget of Typhoon Yagi (2006) during its extratropical transition. Meteorol. Atmos. Phys. 118, 65–78. doi:10.1007/s00703-012-0200-1
Ullah, W., Wang, G., Gao, Z., Tawia Hagan, D. F., Bhatti, A. S., and Zhua, C. (2020). Observed linkage between Tibetan plateau soil moisture and South asian summer precipitation and the possible mechanism. J. Clim. 34, 361–377. doi:10.1175/jcli-d-20-0347.1
Ullah, W., Wang, G., Lou, D., Ullah, S., Bhatti, A. S., Ullah, S., et al. (2021). Large-scale atmospheric circulation patterns associated with extreme monsoon precipitation in Pakistan during 1981–2018. Atmos. Res. 232, 105489. doi:10.1016/j.atmosres.2021.105489
Vallis, G. K., Shutts, G. J., and Gray, M. E. B. (1997). Balanced mesoscale motion and stratified turbulence forced by convection. Q. J. R. Meteorol. Soc. 123, 1621–1652. doi:10.1002/qj.49712354209
Wang, Y., Cui, X., Li, X., Zhang, W., and Huang, Y. (2016). Kinetic energy budget during the Genesis period of tropical cyclone durian (2001) in the South China Sea. Mon. Weather Rev. 144, 2831–2854. doi:10.1175/MWR-D-15-0042.1
Xu, Q., Cao, J., and Gao, S. (2011). Computing streamfunction and velocity potential in a limited domain of arbitrary shape. Part I: Theory and integral formulae. Adv. Atmos. Sci. 28, 1433–1444. doi:10.1007/s00376-011-0185-6
You, C., and Fung, J. (2019). Characteristics of the sea-breeze circulation in the pearl river delta region and its dynamical diagnosis. J. Appl. Meteorol. Climatol. 58, 741–755. doi:10.1175/jamc-d-18-0153.1
Zhao, S., and Cook, K. (2021). Influence of walker circulations on east african rainfall. Clim. Dyn. 7, 2127–2147. doi:10.1007/s00382-020-05579-7
Keywords: typhoon, kinetic energy, extratropical transition, divergent winds, typhoon-following domain
Citation: Zhou G, Du J, Cao J, Liu L and Li X (2023) Comparative analyses of the effects of divergent winds on the kinetic energy budget with the adoptions of two methods during the extratropical transition of Typhoon Rumbia (1818). Front. Earth Sci. 10:1004350. doi: 10.3389/feart.2022.1004350
Received: 27 July 2022; Accepted: 31 October 2022;
Published: 12 January 2023.
Edited by:
Kevin Cheung, Independent Researcher, Sydney, AustraliaReviewed by:
Fan Ping, Institute of Atmospheric Physics (CAS), ChinaShouting Gao, Institute of Atmospheric Physics (CAS), China
Copyright © 2023 Zhou, Du, Cao, Liu and Li. This is an open-access article distributed under the terms of the Creative Commons Attribution License (CC BY). The use, distribution or reproduction in other forums is permitted, provided the original author(s) and the copyright owner(s) are credited and that the original publication in this journal is cited, in accordance with accepted academic practice. No use, distribution or reproduction is permitted which does not comply with these terms.
*Correspondence: Jie Cao, MDAzNTQyQG51aXN0LmVkdS5jbg==