 Zhengrui Jin
 Fei Ge1,2,3*
 Quanliang Chen
95% of researchers rate our articles as excellent or good
Learn more about the work of our research integrity team to safeguard the quality of each article we publish.
Find out more
ORIGINAL RESEARCH article
Front. Earth Sci. , 10 January 2023
Sec. Atmospheric Science
Volume 10 - 2022 | https://doi.org/10.3389/feart.2022.1003748
This article is part of the Research Topic AI-Based Prediction of High-Impact Weather and Climate Extremes under Global Warming: A Perspective from The Large-Scale Circulations and Teleconnections View all 21 articles
Southwest China (SWC) is located in the eastern part of Tibetan Plateau (TP) with large elevation differences and complex topography, which has always been a challenge to the simulation of precipitation in climate modeling community. In this study, the differences in the simulation of precipitation over the SWC are evaluated using the lower and higher resolution models (LR and HR) from the High–Resolution Model Intercomparison Project (HighResMIP) protocol in Coupled Model Intercomparison Project Phase 6 (CMIP6). Our results indicate that the spatial patterns of annual precipitation over the SWC for the period 1985–2014 are well reproduced in most of the HR and LR models, with an increasing tendency from the northwest to southeast. Compared with LR models, the wet biases over the eastern TP and the dry biases over the Sichuan Basin are significantly reduced in HR models. The bias for annual precipitation of the multi–model ensemble mean (MME) has been reduced from 0.97 mm/day (LR) to 0.72 mm/day (HR). In addition, the simulation of extreme precipitation is significantly improved in the finer horizontal resolution models, showing effectively reduced simulation biases in the Sichuan Basin compared with the LR models. The frequency and intensity of extremes are represented by heavy precipitation days (R10 mm) and maximum consecutive 5 days precipitation (Rx5day), which the relative changes have been decreased from 66% (LR) to 47% (HR) in R10 mm and decreased from 23% (LR) to 19% (HR) in Rx5day. We further examine the possible reasons for the difference between LR and HR models in precipitation simulation, showing that the HR models could generate “additional” cyclonic circulation and promote more upward motion with the water vapor convergence, thus correcting the dry biases of precipitation simulation over the Sichuan Basin. This indicates that atmospheric circulation and moisture conditions could be simulated more realistically in climate model with a finer resolution, further improving precipitation simulation performance.
Precipitation, as an indispensable part of climate and hydrological cycle, has long been the hotspot of research in meteorology and hydrology (Cheng et al., 2019; Zhao et al., 2021; Zhao and Zhou 2021; Cao et al., 2022). Large greenhouse gas emissions contribute to global warming, with concomitant changes in atmospheric circulation and the water cycle, which could affect the spatiotemporal distribution of precipitation. Heterogeneity of precipitation could bring about a massive drought and flood under the warming scenario, which in turn, affect regional, and global climate (IPCC 2021). Accordingly, for the perspectives of water resources management, hydrological disaster protection and agricultural production, it is worthwhile to identify the variations of precipitation (Ge et al., 2019, 2021; Zhao et al., 2022).
Southwest China (SWC) is adjacent to the Tibetan Plateau (TP), considered as one of the most complex terrains over China, with plenty of mountains, basins, hills and other landforms (Figure 1). With fragile ecosystems and drastically varying elevation, the frequent occurrence of precipitation extremes in the SWC can not only directly induce flooding, but also can cause secondary disasters, for instance, landslides and debris flows, resulting in enormous loss of human lives and economic damage (Zhang et al., 2012; Jiang et al., 2014; Liu et al., 2015; Wang et al., 2017). Hydrological cycle over the SWC is critical to utilization of water resources throughout the middle and lower reaches in East and Southeast Asia (Zhang et al., 2013a; Yan et al., 2018; Miao et al., 2019). Meanwhile, the variability of the spatiotemporal distribution of precipitation has been regarded by some studies as one of the major factors dominating the hydrological cycle and ecology over the SWC (Gao et al., 2020; Nie and Sun, 2020; Zhang, 2020). Consequently, precipitation remains a key and valuable predictive variable from natural hazard prevention and socioeconomic perspectives.
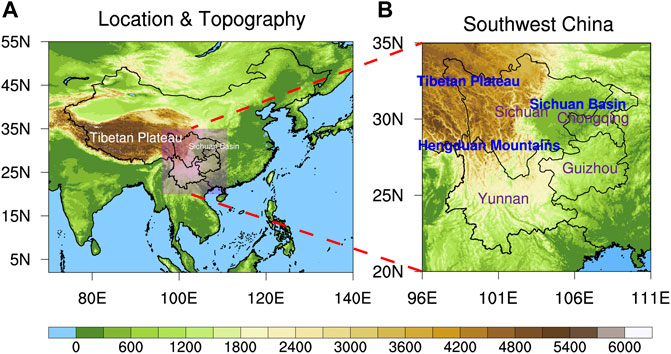
FIGURE 1. Geographic location, topography (surface elevation; shaded; unit: m) of the study domain (on the left), (A), and the area covered by purple shadow is SWC (20–35°N, 96–111°E), which includes Chongqing, Sichuan, Yunnan, and Guizhou (zoomed and shown on the right), (B).
Observations have recorded, in recent decades, an increasing trend of annual precipitation at high–elevation areas over the western part of the SWC, such as the TP and the Hengduan Mountains, but a decreasing trend over the Sichuan Basin (Chen and Xie, 2012; Qin et al., 2015; He and Zhai, 2018; Tang et al., 2018). Previous studies have also shown that precipitation extremes become more dominant as the frequency and intensity tend to increase over the SWC (Ma et al., 2013; Naveendrakumar et al., 2019; Zhang and Zhou, 2020). It indicates that under the rapid global warming, intensified precipitation extremes would induce more frequent floods and droughts, and increase the risk of severe secondary disasters over the SWC (Zhang et al., 2013b; Tang et al., 2016; Wang et al., 2017; Deng et al., 2018). Hence, it is necessary to assess precipitation variations in the SWC to identify current climate change and make robust predictions. Although there have been lots of improvements on the simulation of precipitation over the SWC, it is still challenging to accurately reproduce the atmospheric general circulation and moisture conditions due to the deficiency of model resolution and the complex topography.
Nowadays, benefiting from the Coupled Model Intercomparison Project (CMIP) established and promoted by the World Climate Research Program (WCRP), global climate models (GCMs) have become available tools for understanding current and future climate change variations (Li et al., 2013; Sillmann et al., 2013; Stanfield et al., 2016; Sun et al., 2022). Previous studies have shown that the models commonly overestimate precipitation in mountainous areas relative to observed data, especially in the eastern of the TP (Su et al., 2013; Lin et al., 2018; Luo et al., 2022). Also, the precipitation intensity is generally underestimated in the Sichuan Basin (He et al., 2017; Tao et al., 2020; Hu and Yuan, 2021). This indicates that the uncertainty of simulated precipitation is still relatively large over the SWC. In addition, the model resolution is considered as the one of primary elements influencing the performance in simulating precipitation (Sun and Ao, 2013; Kim et al., 2019; Xie and Wang, 2021). The resolution is too coarse to reproduce the important processes and features within the regional scale (Xu et al., 2017; Bonekamp et al., 2018), and precipitation events related to complex terrain could not be captured (Ménégoz et al., 2013; Liu et al., 2018; Schneider et al., 2018; Duan et al., 2019). Some studies also report that the simulation performance on regional precipitation characteristics can be improved with increasing resolution, but the improvement depends on the precipitation properties and the complexity of terrain (Mahoney et al., 2013; Feng et al., 2018; Vanden Broucke et al., 2019). Therefore, further studies ought to be intended to investigate whether the uncertainty in simulating precipitation over the SWC can be reduced by using the finer resolution models.
As one of the CMIP6–Endorsed Model Intercomparison Projects (MIPs), the High–Resolution Model Intercomparison Project (HighResMIP) is launched for the first time, providing a timely research platform to determine the improvement in simulation performance resulting from the increase in horizontal resolution of the models (Eyring et al., 2016). Detailed model assessment is performed by designing high–resolution climate simulations with the same requirements, including the specific effects of improved resolution on model dynamics and physical processes (Haarsma et al., 2016). Simulations involving the finer resolution model of HighResMIP may shed more lights on climate change. Recently, related works based on HighResMIP models have reported that the enhancement of horizontal resolution can significantly improve the performance of models for the diurnal variation of tropical cyclones and the resulting precipitation (Bao et al., 2020; Zhang et al., 2021). However, there is a lack of studies on evaluation of precipitation simulation over the complex terrain by using CMIP6 HighResMIP models. This study is aim to evaluate the performance in precipitation simulation of CMIP6 HighResMIP models over the SWC, and to address the following questions: 1) How do the CMIP6 HighResMIP models perform in simulating precipitation and precipitation extremes over the SWC? 2) To what extent the models differ in simulating precipitation at higher and lower spatial resolutions over this complex terrain?
The HighResSST–present experiments (Tier 1) in HighResMIP protocol are the forced–atmosphere runs historically covered the period of 1950–2014. We select this historical simulation outputs in this study, including daily precipitation, monthly horizontal wind, vertical velocity and specific humidity. Six modelling groups from different institutions, each of the group which contains model of different horizontal resolutions (at least with a higher and a lower resolution version), 12 models in total are adopted in this study (Table 1). To ensure the evaluating consistency the models with different horizontal resolutions, the outputs from models are converted to a common grid of 0.5° longitude by 0.5° latitude before analyses and focused on the period of 1985–2014, which is consistent with the precipitation observations and reanalysis datasets described in next section.
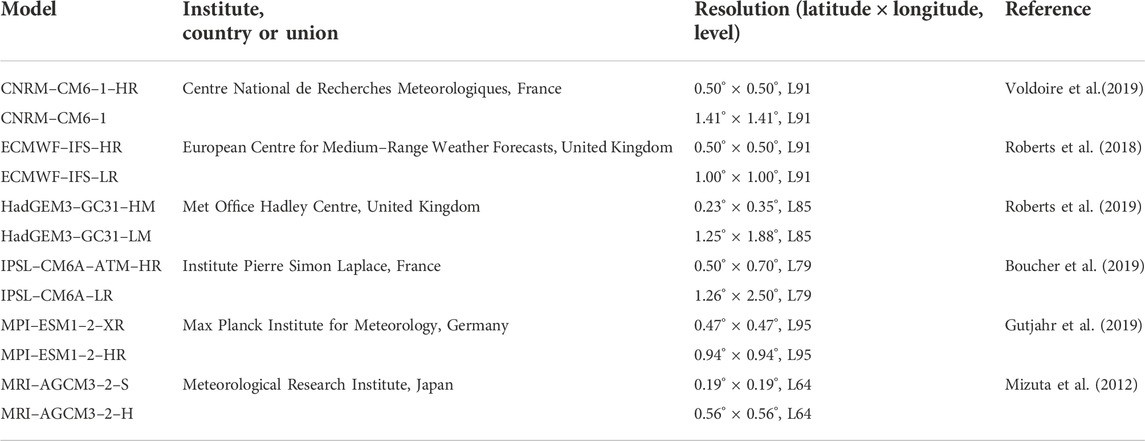
TABLE 1. The basic information of 12 CMIP6 HighResMIP models used in this study.
A daily precipitation gridded dataset, called CN05.1, is used in this study. As the reference for precipitation, it is generated by the National Climate Center (NCC) of China Meteorological Administration (CMA) from more than 2,400 national observation stations through optimal interpolation approach based upon the climate background field (Wu and Gao, 2013). It can remarkably reduce the analysis errors due to precipitation heterogeneity (Wu et al., 2017; Yang et al., 2017). At present, this dataset has been extensively adopted in the evaluation of climate models in China (Lun et al., 2021; Veiga and Yuan, 2021; Guo et al., 2022). Moreover, the ERA5 reanalysis dataset from the European Center for Medium–Range Weather Forecasts (ECMWF), is also adopted as the reference for upper atmosphere variables, including the monthly vertical velocity, horizontal wind and specific humidity, with 17 vertical pressure levels from 1,000 hPa to 100 hPa (Hersbach et al., 2020).
To evaluate the performance of models in simulating precipitation extremes over the SWC, six extreme precipitation indices recommended by the ETCCDI (Expert Team on Climate Change Detection and Indices) are used in this study (details listed in Table 2), which are as follows: Consecutive dry days (CDD), Consecutive wet days (CWD), Heavy precipitation days (R10mm), Very wet days precipitation (R95p), Maximum consecutive 5 days precipitation (Rx5day), Simple daily intensity (SDII). Detailed introduction about ETCCDI and climate indices could be found on the website of the ETCCDI: http://etccdi.pacificclimate.org.
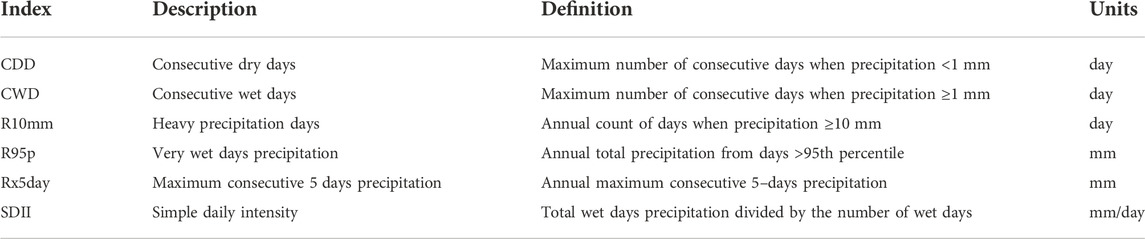
TABLE 2. List of the extreme precipitation indices used in the study.
In this study, Taylor diagram and Taylor Skill Scores (TS) are used to quantitatively evaluate the ability of models in simulating precipitation and precipitation extremes over the SWC (Taylor, 2001). The Taylor diagram could illustrate the statistics of spatial correlation coefficient (SCC), the ratio of spatial standard deviation (RSD), and centered root–mean–square error (RMSE). The TS is calculated as follows:
where
The spatial distributions of climatological precipitation over the SWC from CMIP6 HighResMIP simulations and CN05.1 observations are shown in Figure 2. The observed climatological precipitation is spatially inhomogeneous over the SWC, showing an increasing tendency from northwest to southeast. Overall, the CMIP6 HighResMIP models captured the characteristics of the climatological precipitation well during the period of 1985–2014. Compared with observation, the precipitation is generally overestimated in the LR models over the eastern part of TP and the Hengduan Mountain (Figures 2A–H). The locations of heavy rainfall belts simulated in CNRM–CM6–1, MPI–ESM1–2–HR, and IPSL–CM6A–LR are generally shifted northward compared with the observed data. The HadGEM3–GC31–LM performs relatively weak, with large overestimations over the Yunnan and Guizhou. In contrast, the HR models are substantially improved the simulations of precipitation (Figure 2I–P), especially showing more accurate distribution of rainfall belts associated with abruptness terrain around 31 °N over the SWC. Additionally, the spatial distribution of the multi–model ensemble mean (MME) precipitation in the HR models (MME–HR, Figure 2G) is better than the MME–LR (Figure 2O), which also reveals that the reproducibility of precipitation in HR models have been improved.
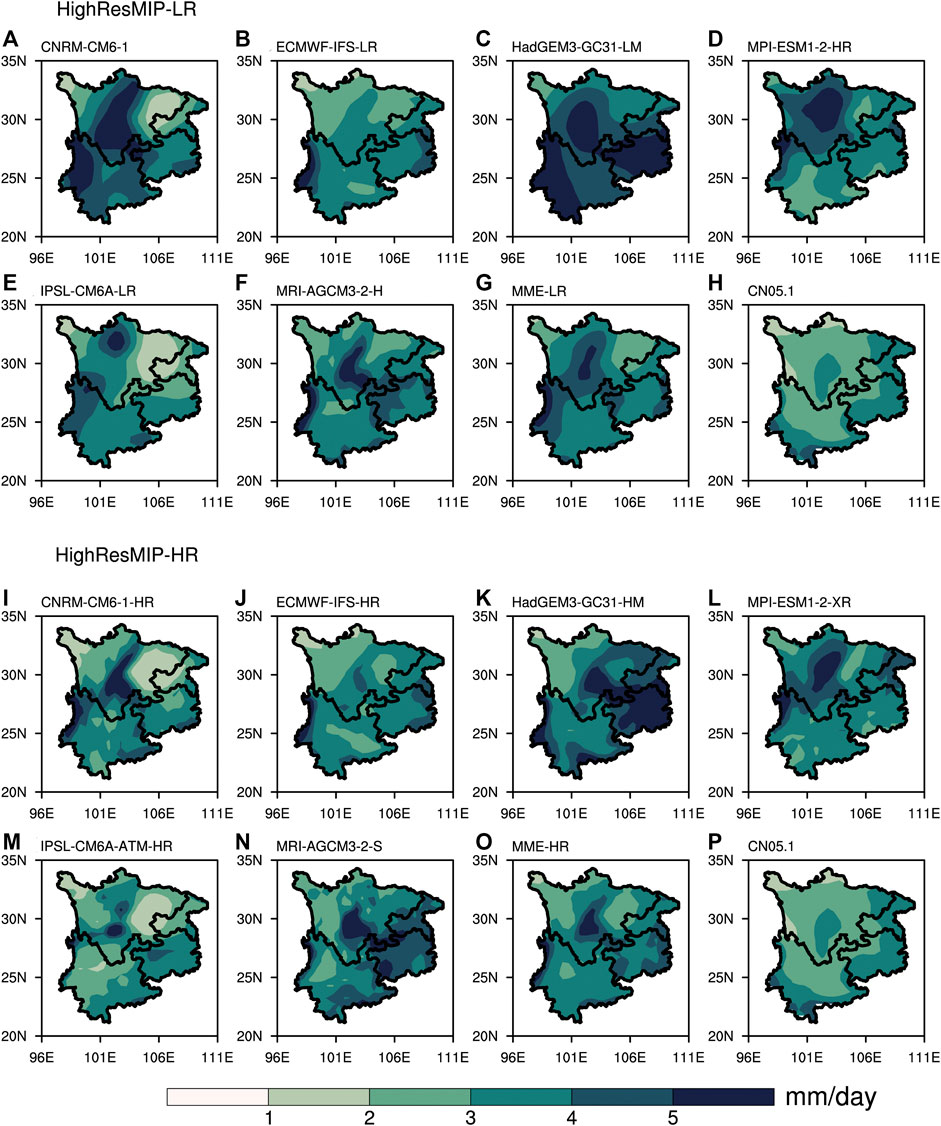
FIGURE 2. Climatological annual precipitation over SWC for the period from 1985 to 2014 based on the observation and CMIP6 HighResMIP models simulation (unit: mm/day), (A–F) Low–resolution models simulation, (I–N) High–resolution models simulation, which MME (G,O) and CN05.1 (H,P) represent multi–model ensemble means and observation respectively.
The spatial distribution of the differences between the simulated and observed precipitation for LR and HR models are presented in Figure 3. Models in the LR groups (Figures 3A–F) show wet biases in most plateau regions over the SWC, while the dry biases can be found at lower elevations such as the Sichuan Basin and the southern of the Yunnan and Guizhou. The HR models show moderate biases (Figure 3H–M, areal–mean absolute biases of 0.49–1.29 mm/day), which are much lower than the LR models (areal–mean absolute biases of 0.51–1.78 mm/day). Furthermore, the ECMWF–IFS and MPI–ESM1–2 models show lower biases, while the models from HadGEM3–GC31 and IPSL–CM6A show relatively higher biases. It is indicated that the modelling groups have different parameterization schemes and adjustment methods for climate models, which lead to some differences in precipitation simulation. However, the HR models significantly reduce the wet bias over the TP and the Hengduan Mountains compared to the LR models, and the bias in MME is reduced from 0.97 mm/day (LR) to 0.72 mm/day (HR). It exhibits that the resolution is a factor that plays an important role in simulating precipitation. Although the increase of model resolution reduces the bias of precipitation simulation over the SWC, there is still uncertainty between the eastern edge of TP and the elevation transition zone near 31°N. This means that precipitation simulations over complex terrain areas remain a challenge for the CMIP6 HighResMIP model.
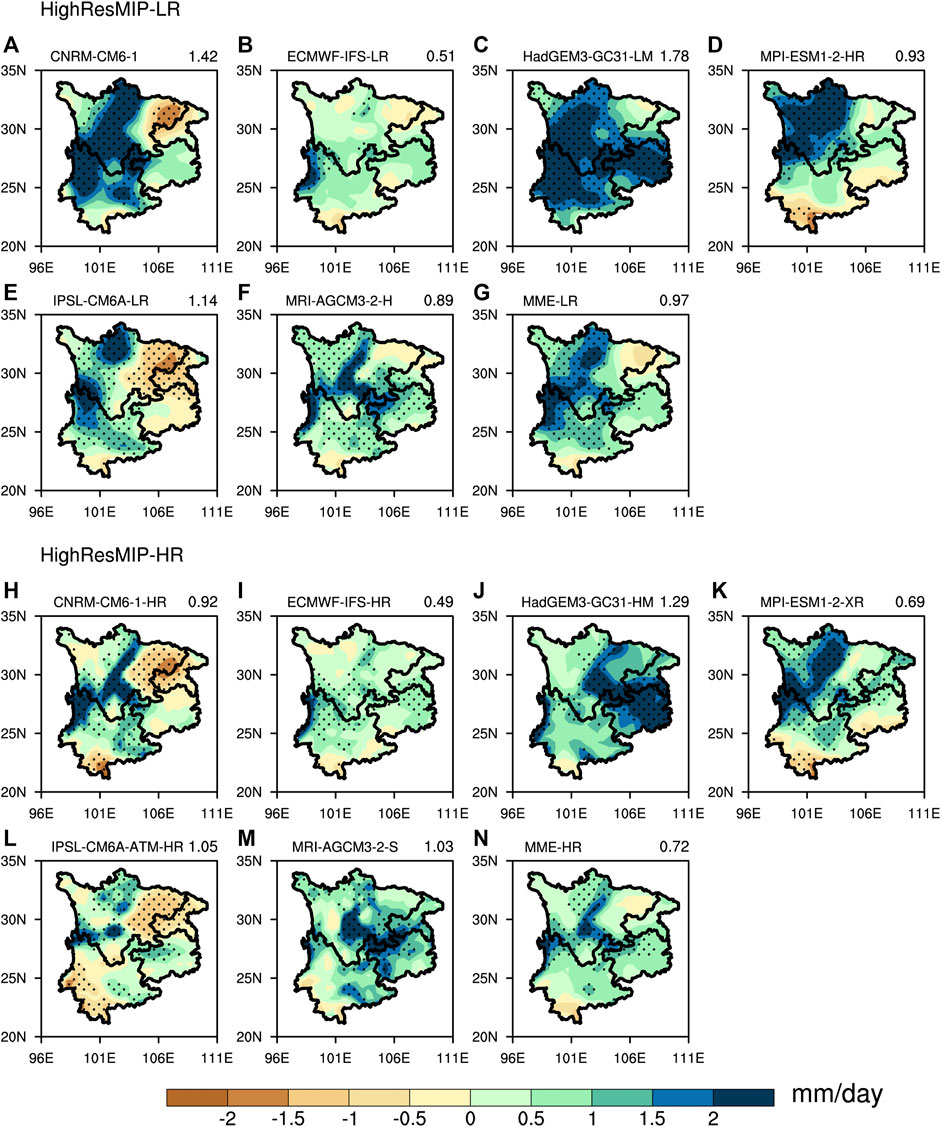
FIGURE 3. Same as Figure 2, but for the spatial distribution of precipitation difference between each model and observation. The areal–mean absolute bias (unit: mm/day) over SWC are given on the top–right of each panel. Black dots denote the regions of precipitation differences statistical significance at the 95% confidence level using a two–tailed Student’s t–test.
Figure 4A shows the Taylor diagram for the simulated spatial distribution of climatological precipitation over the SWC. For the simulation of precipitation, there is considerable variation in the models of different modeling groups. ECMWF–IFS–HR, MPI–ESM1–2–XR, HadGEM3–GC31–HM, and ECMWF–IFS–LR with spatial correlation coefficients (SCC) above 0.5, and the ratios of standard deviations (RSD) are mostly close to 1, showing relatively better modeling performance. Figure 4B shows the Taylor skill scores (TS) for each model, in general, the TS of HR models are higher than the corresponding LR models. The MME–HR (0.6) is also higher than MME–LR (0.4), indicating that the increase of horizontal resolution can improve the performance in simulating precipitation. Since the purpose of this study is to examine the simulation differences of the high and low horizontal resolution models over the SWC. We adopt the MME to investigate the differences precipitation extremes simulation in the following subsections.
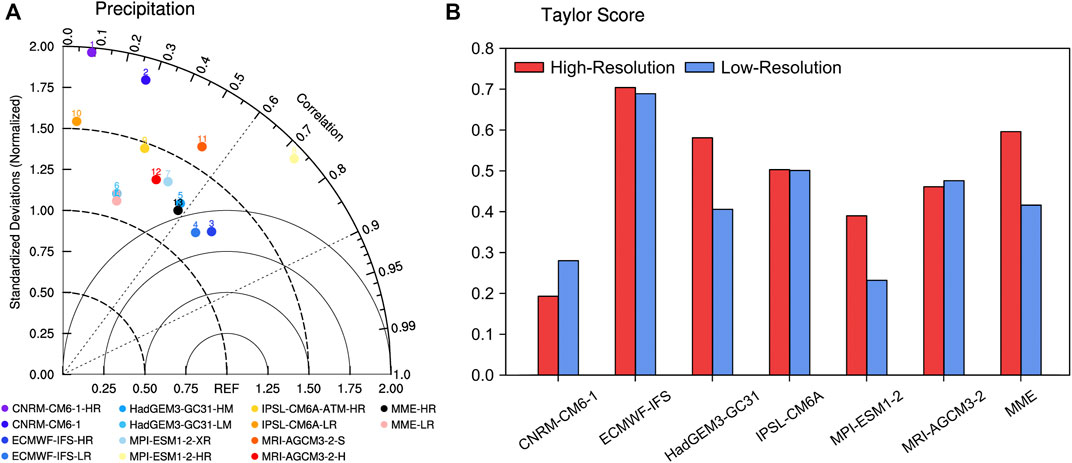
FIGURE 4. Taylor diagram (A) and Taylor Skill Scores (B) of climatological annual precipitation simulated over SWC. Angular axes show spatial correlation coefficients between simulated and observed pattern; radial axes show the spatial centered RMSE (normalized against the observed). Each dot represents a model, identified by its color on the bottom.
Figure 5 shows the spatial distributions of the extreme precipitation indices from the CN05.1 observation for the climatological period 1985–2014. Large number of consecutive dry days (CDD) are observed over the Hengduan Mountains, while more consecutive wet days (CWD) can be found in the eastern of the TP (Figures 5A,B). In terms of the heavy precipitation days (R10mm), very wet days precipitation (R95p), maximum consecutive 5 days precipitation (Rx5day), and simple daily intensity (SDII) show an increasing tendency from northwest to southeast, which is similar to precipitation climatology (Figures 5C–F). It can be seen that more precipitation extremes mostly occur in the western and northern of the Sichuan Basin, but with fewer sustained rainfall days than in the highlands. This suggests that precipitation extremes could be more frequent, shorter in duration and higher in intensity in the steep transition regions over the SWC.
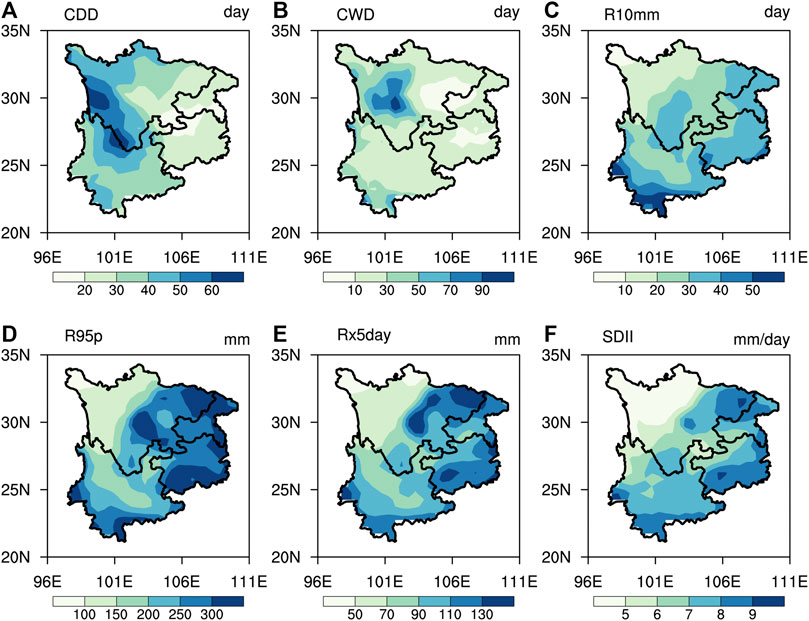
FIGURE 5. Spatial patterns of the precipitation extreme indices, (A) CDD, (B) CWD, (C) R10mm, (D) R95p, (E) Rx5day, (F) SDII, (units: day, day, day, mm, mm, mm/day), during 1985–2014 from the observation over the SWC.
The differences in the spatial distribution of extreme precipitation indices for the LR and HR models relative to CN05.1 are shown in Figure 6. The CDD and CWD are generally underestimated by the LR and HR models in the eastern of TP (Figures 6A–D). However, the models exhibit overestimation of CWD simulations mainly concentrated in the Hengduan Mountain (Figures 6C,D). In addition, for the simulations of R10mm, R95p, Rx5day and SDII, large wet biases exist over the eastern TP and dry biases occur in Sichuan Basin, which are similar to the climatological mean precipitation simulation (Figures 6E–I). In terms of the areal–mean relative changes (absolute bias as percentage of observation), the HR models have lower biases compared to the LR models, decreasing in CDD (7%), CWD (22%), R10mm (19%), R95p (7%), Rx5day (4%), and SDII (3%), respectively. Generally, the HR models show some advancements in simulating precipitation extremes, with more moderate biases in extent and magnitude compared with the LR models.
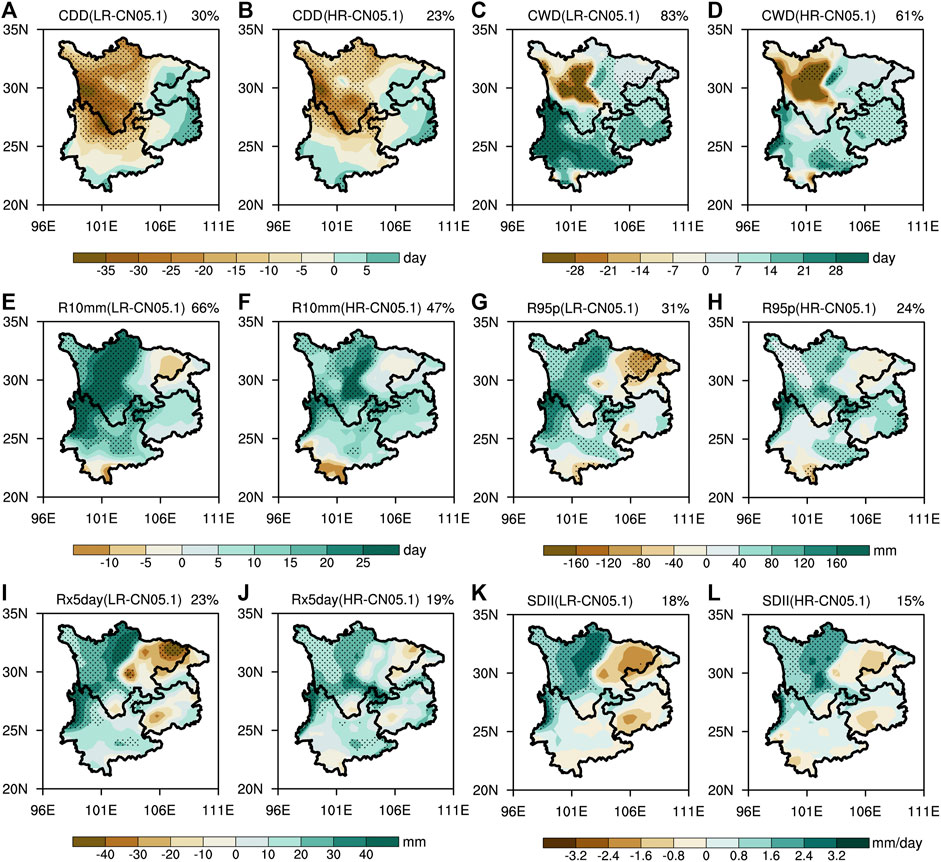
FIGURE 6. The spatial distribution difference of precipitation extreme indices between the MME (from LR and HR models) simulation and observation, (A,B) CDD, (C,D) CWD, (E,F) R10mm, (G,H) R95p, (I,J) Rx5day, (K,L) SDII, (units: day, day, day, mm, mm, mm/day), for the period from 1985 to 2014. The areal–mean relative changes (absolute bias as percentage of observation; unit: %) over SWC are given on the top–right of each panel. Black dots indicate the region of indices differences statistical significance at the 95% confidence level using a two–tailed Student’s t–test.
Figure 7A shows the Taylor diagram for the simulation of the extreme precipitation indices by HR and LR models versus the CN05.1 observation. Compared with the LR models, the HR indicate a good performance in reproducing the precipitation extremes, with the higher SCCs and lower centered RMSEs. Moreover, the TS of MME increase significantly in the HR models (Figure 7B). The TS for CDD, R10mm, R95p, Rx5day and SDII increased by 0.23, 0.17, 0.17, 0.29, and 0.20, respectively. However, for CWD the TS is reduced by 0.09. By comparing the spatial distribution (Figures 6C,D), it can be found that although the HR model greatly corrected the overestimates of CWD in the Hengduan Mountains, the underestimates over the eastern of TP also increased. This indicates that improving resolution of the models could overcorrect the CWD simulation biases while correcting the wet biases in precipitation simulation. It is noteworthy that the biases of the frequency and intensity of precipitation extremes are considerably reduced in the HR models simulations, which indicates that the finer resolution models generally have the superiority of the simulation ability of the precipitation extremes over the SWC.
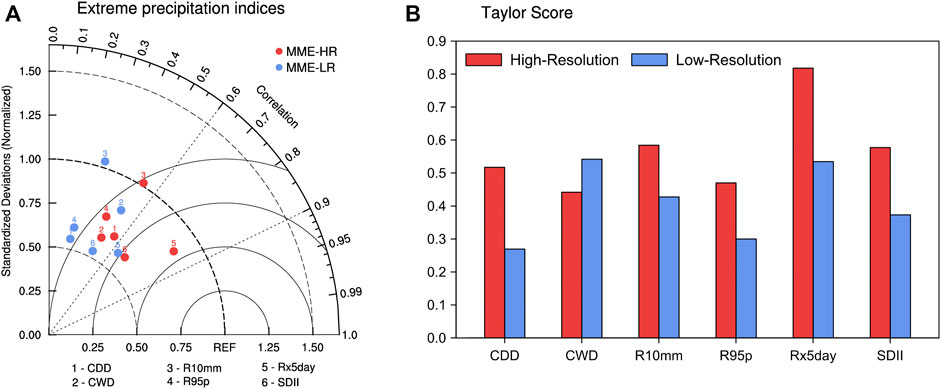
FIGURE 7. Same as Figure 4, but for the Taylor diagram and Taylor Skill Scores of precipitation extreme indices with the MME.
Large–scale circulation and water vapor content are two dominant elements that directly affect the precipitation amount in SWC. To further explore the possible causes for the improvement of precipitation simulation in different horizontal resolutions, we calculate the simulated differences in atmospheric circulation and specific humidity between the CMIP6 HighResMIP models and ERA5 reanalysis. As shown in Figures 8A,B, the horizontal wind simulated difference from models at low–level (850 hPa) can be clearly found in the Sichuan Basin, where the LR models mainly show an anti–cyclone, indicating the weakened precipitation due to the mean divergent atmospheric flows. The horizontal winds in the HR models are characterized by the cyclone, which favors more precipitation around the Sichuan Basin. In addition, differences between the HR and LR models show that the extensive southwesterly wind over the southern SWC (Figure 8C), which enhance the transport of abundant moisture inland from the tropical ocean. The upper–level circulation is shown by 500 hPa wind field, both the LR and HR models indicate relatively similar wind shears over the SWC (Figures 8D,E). It can be seen that the cyclone and wind convergence occur in eastern TP and Hengduan Mountains where overestimated precipitation exists in the LR and HR models. However, as shown in Figure 8F, the HR models exhibit the strong northerly wind over the transitional region between the TP and the Sichuan Basin. And there is an anti–cyclone over the TP. This suggests that the added value of the HR models for suppressing the rainfall bias over steep elevations by reducing the convergence conditions in simulation of mean atmospheric circulation.
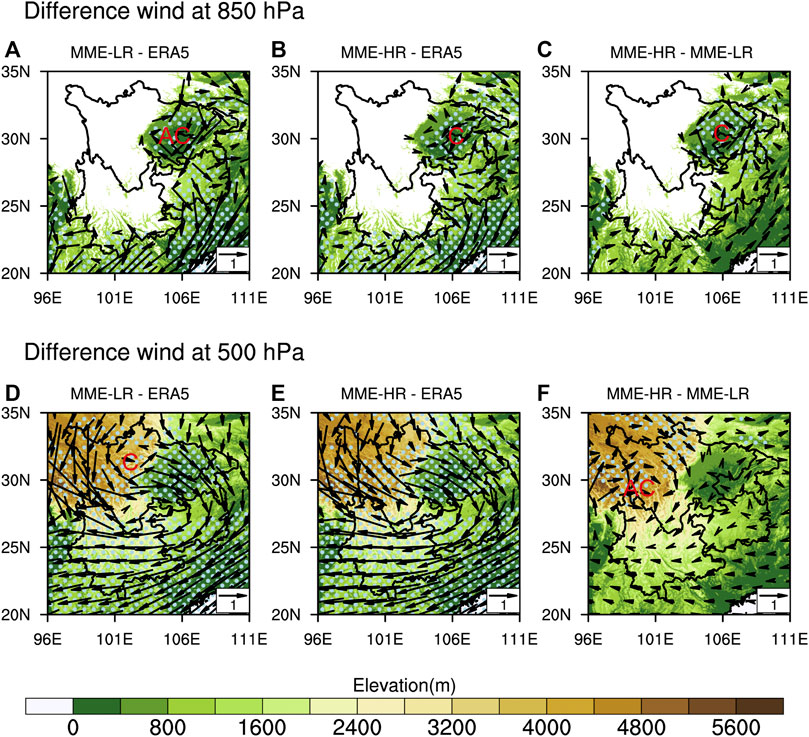
FIGURE 8. The climatological horizontal wind difference between MME and ERA5 for the period 1985–2014 over SWC (unit: m/s), (A–C) at 850 hPa, (D–F) at 500 hPa, color–shaded areas show terrain elevation below the corresponding barometric surface (unit: m). The blue dots denote the regions of horizontal wind speed differences statistical significance at the 95% confidence level using a two–tailed Student’s t–test.
On the other hand, Figure 9 presents MME difference for the zonal circulation and specific humidity with the ERA5 reanalysis. The MME–LR (Figure 9A), shows strong ascending motion in the edges of TP around 102°E, and the descending motion in Sichuan Basin around 108°E. Meanwhile, there are significantly negative biases of specific humidity at lower levels over plains, indicating the weakened precipitation due to the mean flow of moisture divergence in the LR models. The MME–HR (Figure 9B), exhibits strong descending motion with less moisture over the eastern TP, which indicates the wet bias have been reduced in the HR models. The difference in the MME between the HR and LR models (Figure 9C), presents less specific humidity over the TP accompanied with strong descending motion and more moisture conditions in the Sichuan Basin and the surrounding transition zone (about 103°E) accompanied with ascending motion, suggesting that the HR models added value to the reduction of precipitation bias. With the increase of resolution, the HR models perform better in simulations of atmospheric circulation and moisture content in the complex terrain, thus reducing the biases of precipitation over the SWC.
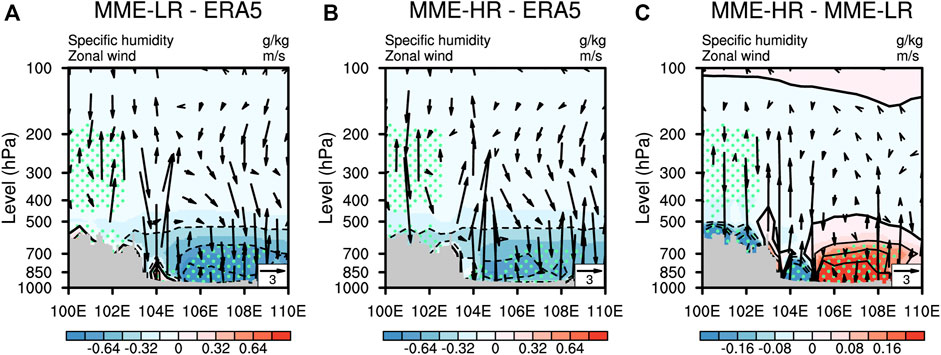
FIGURE 9. Differences in zonal wind (vectors; units: m/s) and specific humidity (shading; units: g/kg), cross section along 31°N (A) MME–LR minus ERA5, (B) MME–HR minus ERA5, (C) MME–HR minus MME–LR, and the green dots denote the regions of specific humidity differences statistical significance at the 95% confidence level using a two–tailed Student’s t–test.
In this study, the performance of the latest multi–resolution models from the CMIP6 HighResMIP protocol in simulating climatological precipitation and extreme precipitation indices have been quantitatively evaluated over the SWC. The differences in precipitation simulations due to the models with low and high resolution (LR and HR) are analyzed and the possible reasons for the differences are discussed.
1) Both of the LR and HR models can reasonably simulate the observational spatial distribution of precipitation well, which capture characteristics that the region of more precipitation in the area of Hengduan Mountains, with less in Sichuan Basins. However, the models show the dry biases in the Sichuan Basin, and wet biases in the eastern edges of the TP. The MME areal–mean absolute biases have been reduced from 0.97 mm/day (LR) to 0.72 mm/day (HR), suggesting some improvements of in simulation of the climatological precipitation in the HR models over SWC.
2) The LR and HR models show underestimate the CDD and CWD in the Hengduan Mountains and eastern TP, but overestimate in Sichuan Basin. For the R10mm, R95p, Rx5day and SDII, more wet biases exist over the plateau of western SWC, while moderate dry biases occur in Sichuan Basin. The spatial extents and magnitudes of simulation biases are significantly reduced in the HR models. The areal–mean relative changes decreasing in CDD (7%), CWD (22%), R10mm (19%), R95p (7%), Rx5day (4%), and SDII (3%), respectively, indicating that the finer, high–resolution models have added value in simulating extreme precipitation.
3) The dry and wet bias of the LR and HR models in simulating precipitation in the plateau and basin over the SWC are attributed to the simulation of atmospheric circulation and water vapor content. Compared with the LR models, the HR models have more reasonable moisture transport from the tropical ocean and convergence conditions to reduce the dry bias over the Sichuan Basin. Less water vapor content simulation with local descending motion reduces the wet biases over the higher altitude complex terrain. With the improvement of horizontal resolution, models can simulate more accurate atmospheric circulation pattern in complex terrain, so as to simulate precipitation more realistically.
The HR models exhibit superiority in simulating mean precipitation and precipitation extremes compared with the LR models. Especially over the TP and Hengduan mountains, the HR models substantially reduce the wet bias and the overestimation of the intensity and frequency of precipitation extremes. It can be responsible for the better simulation of atmospheric circulation and topographic forcing in the plateau and basin by the HR models, which leads to a reasonable estimation of moisture transport and convergence conditions. While the systematic precipitation biases that existed in the LR models seem to persist in the HR models, further analysis indicates that the intensity and extents covered by the dry biases over the Sichuan Basin and wet biases over the TP have reduced in the HR models. Moreover, the biases reduction in lower altitude areas (below 2000 m) is not as significantly as that in higher altitude areas (above 2000 m), indicating a certain elevation dependency exists in this improvement. It also indicates that the current state–of–the–art climate models may still be inadequate for describing meso–and micro–scale complex topography, and the considerable role of orography in water vapor transport and condensation cannot be simulated well by enhancing the horizontal resolution of the models (Collier and Immerzeel, 2015; Wang et al., 2020; Chen et al., 2021; Liang et al., 2021). By using the same parameterization, the climate models participating in the HighResMIP protocol are only tuned for their resolution. In order to obtain the more realistic simulation results, it is also important to adjust the cloud physical parameterization and aerosol emission factors of the model. Following the development of convection–permitting model (CPM), and regional climate model (RCM) dynamical downscaling can be as relatively beneficial tools to simulate the precipitation phenomenon. These models can show some advantages in simulating precipitation in complex terrains (Zou and Zhou, 2013; Shi et al., 2018; Li et al., 2021). Additionally, reducing the uncertainty in precipitation simulations appears to be achieved by the weighted average multi–model groups approach (Abramowitz et al., 2019; Merrifield et al., 2020). At the same time, the resolution of the weighted multi-model ensemble for the LR and HR groups should be paid more attention. However, considering the limitations of the models available from the HighResMIP protocol in this study, subsequent studies on systematic biases in precipitation simulations over complex terrain regions should be conducted by additional updated climate models or by the above–mentioned tools. Thus, we can gain insight into more dynamic and physical processes related to precipitation, identify more critical causes of uncertainty in climate models, and ultimately improve the confidence in projections.
The original contributions presented in the study are included in the article/Supplementary Material, further inquiries can be directed to the corresponding author.
FG contributed to the development and planning of the study. ZJ performed the data analysis and wrote the manuscript. ZL assisted with data pre-processing and figure enhancement. QC supervised this work and provided project administration. All authors contributed to the article and approved the submitted version.
This study has been funded by the National Natural Science Foundation of China (U20A2097).
We acknowledge to the climate modeling groups for their data and resources (listed in Table 1), the German Climate Computation Centre (DKRZ), and the ETCCDI. We appreciate the NCC of CMA for affording the CN05.1 observational datasets as the precipitation reference, and the ECMWF for affording the ERA5 reanalysis datasets as the for upper atmosphere variables reference. We also grateful to the Chengdu Plain Urban Meteorology and Environment Observation and Research Station of Sichuan Province for supporting.
The authors declare that the research was conducted in the absence of any commercial or financial relationships that could be construed as a potential conflict of interest.
All claims expressed in this article are solely those of the authors and do not necessarily represent those of their affiliated organizations, or those of the publisher, the editors and the reviewers. Any product that may be evaluated in this article, or claim that may be made by its manufacturer, is not guaranteed or endorsed by the publisher.
Abramowitz, G., Herger, N., Gutmann, E., Hammerling, D., Knutti, R., Leduc, M., et al. (2019). ESD reviews: Model dependence in multi–model climate ensembles: Weighting, sub–selection and out–of–sample testing. Earth Syst. Dyn. 10 (1), 91–105. doi:10.5194/esd-10-91-2019
Bao, Q., Liu, Y., Wu, G., He, B., Li, J., Wang, L., et al. (2020). CAS FGOALS–f3–H and CAS FGOALS–f3–L outputs for the high–resolution model intercomparison project simulation of CMIP6. Atmos. Ocean. Sci. Lett. 13 (6), 576–581. doi:10.1080/16742834.2020.1814675
Bonekamp, P., Collier, E., and Immerzeel, W. (2018). The impact of spatial resolution, land use, and spinup time on resolving spatial precipitation patterns in the Himalayas. J. Hydrometeorol. 19 (10), 1565–1581. doi:10.1175/JHM-D-17-0212.1
Boucher, O., Denvil, S., Levavasseur, G., Cozic, A., Caubel, A., Foujols, M., et al. (2019). IPSL IPSL–CM6A–ATM–HR model output prepared for CMIP6 HighResMIP. Earth System Grid Federation. doi:10.22033/ESGF/CMIP6.2361
Cao, B., Lyu, S., Zhang, Y., Yang, X., Li, B., Yuan, L., et al. (2022). Factors influencing diurnal variations of cloud and precipitation in the Yushu area of the Tibetan Plateau. J. Meteorol. Res. 36 (2), 311–325. doi:10.1007/s13351-022-1167-6
Chen, Y., Sharma, S., Zhou, X., Yang, K., Li, X., Niu, X., et al. (2021). Spatial performance of multiple reanalysis precipitation datasets on the southern slope of central Himalaya. Atmos. Res. 250, 105365. doi:10.1016/j.atmosres.2020.105365
Chen, Y., and Xie, S. (2012). Temporal and spatial visibility trends in the Sichuan Basin, China, 1973 to 2010. Atmos. Res. 112, 25–34. doi:10.1016/j.atmosres.2012.04.009
Cheng, Q., Gao, L., Zuo, X., and Zhong, F. (2019). Statistical analyses of spatial and temporal variabilities in total, daytime, and nighttime precipitation indices and of extreme dry/wet association with large–scale circulations of Southwest China, 1961–2016. Atmos. Res. 219, 166–182. doi:10.1016/j.atmosres.2018.12.033
Collier, E., and Immerzeel, W. (2015). High–resolution modeling of atmospheric dynamics in the Nepalese Himalaya. J. Geophys. Res. Atmos. 120 (19), 9882–9896. doi:10.1002/2015JD023266
Deng, Y., Jiang, W., He, B., Chen, Z., and Jia, K. (2018). Change in intensity and frequency of extreme precipitation and its possible teleconnection with large-scale climate index over the China from 1960 to 2015. J. Geophys. Res. Atmos. 123 (4), 2068–2081. doi:10.1002/2017JD027078
Duan, W., Hanasaki, N., Shiogama, H., Chen, Y., Zou, S., Nover, D., et al. (2019). Evaluation and future projection of Chinese precipitation extremes using large ensemble high–resolution climate simulations. J. Clim. 32 (8), 2169–2183. doi:10.1175/JCLI-D-18-0465.1
Eyring, V., Bony, S., Meehl, G. A., Senior, C. A., Stevens, B., Stouffer, R. J., et al. (2016). Overview of the coupled model intercomparison project Phase 6 (CMIP6) experimental design and organization. Geosci. Model Dev. 9 (5), 1937–1958. doi:10.5194/gmd-9-1937-2016
Feng, Z., Leung, L., Houze, R., Hagos, S., Hardin, J., Yang, Q., et al. (2018). Structure and evolution of mesoscale convective systems: Sensitivity to cloud microphysics in convection-permitting simulations over the United States. J. Adv. Model. Earth Syst. 10 (7), 1470–1494. doi:10.1029/2018MS001305
Gao, Y., Chen, F., Miguez–Macho, G., and Li, X. (2020). Understanding precipitation recycling over the Tibetan Plateau using tracer analysis with WRF. Clim. Dyn. 55 (9), 2921–2937. doi:10.1007/s00382-020-05426-9
Ge, F., Zhu, S., Luo, H., Zhi, X., and Wang, H. (2021). Future changes in precipitation extremes over southeast Asia: Insights from CMIP6 multi–model ensemble. Environ. Res. Lett. 16 (2), 024013. doi:10.1088/1748-9326/abd7ad
Ge, F., Zhu, S., Peng, T., Zhao, Y., Sielmann, F., Fraedrich, K., et al. (2019). Risks of precipitation extremes over southeast Asia: Does 1.5° C or 2° C global warming make a difference? Environ. Res. Lett. 14 (4), 044015. doi:10.1088/1748-9326/aaff7e
Guo, J., Wang, X., Xiao, C., Liu, L., Wang, T., and Shen, C. (2022). Evaluation of the temperature downscaling performance of PRECIS to the BCC–CSM2–MR model over China. Clim. Dyn. 59, 1143–1159. doi:10.1007/s00382-022-06177-5
Gutjahr, O., Putrasahan, D., Lohmann, K., Jungclaus, J., von Storch, J., Brüggemann, N., et al. (2019). Max planck institute Earth system model (MPI–ESM1.2) for the high–resolution model intercomparison project (HighResMIP). Geosci. Model Dev. 12 (7), 3241–3281. doi:10.5194/gmd-12-3241-2019
Haarsma, R., Roberts, M., Vidale, P., Senior, C., Bellucci, A., Bao, Q., et al. (2016). High resolution model intercomparison project (HighResMIP v1.0) for CMIP6. Geosci. Model Dev. 9 (11), 4185–4208. doi:10.5194/gmd-9-4185-2016
He, B., and Zhai, P. (2018). Changes in persistent and non-persistent extreme precipitation in China from 1961 to 2016. Adv. Clim. Change Res. 9 (3), 177–184. doi:10.1016/j.accre.2018.08.002
He, J., Yu, Y., Yu, L., Liu, N., and Zhao, S. (2017). Impacts of uncertainty in land surface information on simulated surface temperature and precipitation over China. Int. J. Climatol. 37, 829–847. doi:10.1002/joc.5041
Hersbach, H., Bell, B., Berrisford, P., Hirahara, S., Horányi, A., Muñoz-Sabater, J., et al. (2020). The ERA5 global reanalysis. Q. J. R. Meteorol. Soc. 146 (730), 1999–2049. doi:10.1002/qj.3803
Hu, X., and Yuan, W. (2021). Evaluation of ERA5 precipitation over the eastern periphery of the Tibetan plateau from the perspective of regional rainfall events. Int. J. Climatol. 41 (4), 2625–2637. doi:10.1002/joc.6980
IPCC (2021). Climate change 2021: The physical science basis contribution of working group I to the sixth assessment report of the intergovernmental panel on climate change. Cambridge: Cambridge University Press.
Jiang, Z., Lian, Y., and Qin, X. (2014). Rocky desertification in Southwest China: Impacts, causes, and restoration. Earth. Sci. Rev. 132, 1–12. doi:10.1016/j.earscirev.2014.01.005
Kim, I., Oh, J., Woo, S., and Kripalani, R. (2019). Evaluation of precipitation extremes over the asian domain: Observation and modelling studies. Clim. Dyn. 52 (3), 1317–1342. doi:10.1007/s00382-018-4193-4
Li, J., Zhang, Q., Chen, Y., Xu, C., and Singh, V. (2013). Changing spatiotemporal patterns of precipitation extremes in China during 2071–2100 based on Earth System Models. J. Geophys. Res. Atmos. 118 (22), 12, 537–612, 555. doi:10.1002/2013JD020300
Li, P., Furtado, K., Zhou, T., Chen, H., and Li, J. (2021). Convection-permitting modelling improves simulated precipitation over the central and eastern Tibetan Plateau. Q. J. R. Meteorol. Soc. 147 (734), 341–362. doi:10.1002/qj.3921
Liang, Y., Yang, B., Wang, M., Tang, J., Sakaguchi, K., Leung, L., et al. (2021). Multiscale simulation of precipitation over East Asia by variable resolution CAM–MPAS. J. Adv. Model. Earth Syst. 13. 163477. doi:10.1029/2021ms002656
Lin, C., Chen, D., Yang, K., and Ou, T. (2018). Impact of model resolution on simulating the water vapor transport through the central himalayas: Implication for models’ wet bias over the Tibetan plateau. Clim. Dyn. 51 (9), 3195–3207. doi:10.1007/s00382-018-4074-x
Liu, M., Xu, X., Sun, A., Wang, K., Yue, Y., Tong, X., et al. (2015). Evaluation of high–resolution satellite rainfall products using rain gauge data over complex terrain in southwest China. Theor. Appl. Climatol. 119 (1), 203–219. doi:10.1007/s00704-014-1092-4
Liu, Z., Liu, Y., Wang, S., Yang, X., Wang, L., Baig, M., et al. (2018). Evaluation of spatial and temporal performances of ERA–Interim precipitation and temperature in mainland China. J. Clim. 31 (11), 4347–4365. doi:10.1175/JCLI-D-17-0212.1
Lun, Y., Liu, L., Cheng, L., Li, X., Li, H., and Xu, Z. (2021). Assessment of GCMs simulation performance for precipitation and temperature from CMIP5 to CMIP6 over the Tibetan Plateau. Int. J. Climatol. 41 (7), 3994–4018. doi:10.1002/joc.7055
Luo, N., Guo, Y., Chou, J., and Gao, Z. (2022). Added value of CMIP6 models over CMIP5 models in simulating the climatological precipitation extremes in China. Int. J. Climatol. 42 (2), 1148–1164. doi:10.1002/joc.7294
Ma, Z., Liu, J., Zhang, S., Chen, W., and Yang, S. (2013). Observed climate changes in southwest China during 1961–2010. Adv. Clim. Change Res. 4 (1), 30–40. doi:10.3724/SP.J.1248.2013.030
Mahoney, K., Alexander, M., Scott, J., and Barsugli, J. (2013). High–resolution downscaled simulations of warm-season extreme precipitation events in the Colorado Front Range under past and future climates. J. Clim. 26 (21), 8671–8689. doi:10.1175/JCLI-D-12-00744.1
Ménégoz, M., Gallée, H., and Jacobi, H. (2013). Precipitation and snow cover in the himalaya: From reanalysis to regional climate simulations. Hydrol. Earth Syst. Sci. 17 (10), 3921–3936. doi:10.5194/hess-17-3921-2013
Merrifield, A., Brunner, L., Lorenz, R., Medhaug, I., and Knutti, R. (2020). An investigation of weighting schemes suitable for incorporating large ensembles into multi-model ensembles. Earth Syst. Dyn. 11 (3), 807–834. doi:10.5194/esd-11-807-2020
Miao, C., Duan, Q., Sun, Q., Lei, X., and Li, H. (2019). Non–uniform changes in different categories of precipitation intensity across China and the associated large–scale circulations. Environ. Res. Lett. 14 (2), 025004. doi:10.1088/1748-9326/aaf306
Mizuta, R., Yoshimura, H., Murakami, H., Matsueda, M., Endo, H., Ose, T., et al. (2012). Climate simulations using MRI–AGCM3. 2 with 20–km grid. J. Meteorological Soc. Jpn. 90, 233–258. doi:10.2151/jmsj.2012-A12
Naveendrakumar, G., Vithanage, M., Kwon, H., Chandrasekara, S., Iqbal, M., Pathmarajah, S., et al. (2019). South asian perspective on temperature and rainfall extremes: A review. Atmos. Res. 225, 110–120. doi:10.1016/j.atmosres.2019.03.021
Nie, Y., and Sun, J. (2020). Evaluation of high–resolution precipitation products over southwest China. J. Hydrometeorol. 21 (11), 2691–2712. doi:10.1175/JHM-D-20-0045.1
Qin, N., Wang, J., Yang, G., Chen, X., Liang, H., and Zhang, J. (2015). Spatial and temporal variations of extreme precipitation and temperature events for the Southwest China in 1960–2009. Geoenvironmental Disasters 2 (1), 4–14. doi:10.1186/s40677-015-0014-9
Roberts, C., Senan, R., Molteni, F., Boussetta, S., Mayer, M., and Keeley, S. (2018). Climate model configurations of the ECMWF integrated forecasting system (ECMWF–IFS cycle 43r1) for HighResMIP. Geosci. Model Dev. 11 (9), 3681–3712. doi:10.5194/gmd-11-3681-2018
Roberts, M., Baker, A., Blockley, E., Calvert, D., Coward, A., Hewitt, H., et al. (2019). Description of the resolution hierarchy of the global coupled HadGEM3–GC3.1 model as used in CMIP6 HighResMIP experiments. Geosci. Model Dev. 12 (12), 4999–5028. doi:10.5194/gmd-12-4999-2019
Schneider, L., Barthlott, C., Barrett, A., and Hoose, C. (2018). The precipitation response to variable terrain forcing over low mountain ranges in different weather regimes. Q. J. R. Meteorol. Soc. 144 (713), 970–989. doi:10.1002/qj.3250
Shi, Y., Wang, G., and Gao, X. (2018). Role of resolution in regional climate change projections over China. Clim. Dyn. 51 (5), 2375–2396. doi:10.1007/s00382-017-4018-x
Sillmann, J., Kharin, V., Zhang, X., Zwiers, F., and Bronaugh, D. (2013). Climate extremes indices in the CMIP5 multi model ensemble: Part 1. Model evaluation in the present climate. J. Geophys. Res. Atmos. 118 (4), 1716–1733. doi:10.1002/jgrd.50203
Stanfield, R., Jiang, J., Dong, X., Xi, B., Su, H., Donner, L., et al. (2016). A quantitative assessment of precipitation associated with the ITCZ in the CMIP5 GCM simulations. Clim. Dyn. 47 (5), 1863–1880. doi:10.1007/s00382-015-2937-y
Su, F., Duan, X., Chen, D., Hao, Z., and Cuo, L. (2013). Evaluation of the global climate models in the CMIP5 over the Tibetan Plateau. J. Clim. 26 (10), 3187–3208. doi:10.1175/JCLI-D-12-00321.1
Sun, J., and Ao, J. (2013). Changes in precipitation and extreme precipitation in a warming environment in China. Chin. Sci. Bull. 58 (12), 1395–1401. doi:10.1007/s11434-012-5542-z
Sun, X., Ge, F., Fan, Y., Zhu, S., and Chen, Q. (2022). Will population exposure to heat extremes intensify over Southeast Asia in a warmer world? Environ. Res. Lett. 17 (4), 044006. doi:10.1088/1748-9326/ac48b6
Tang, J., Niu, X., Wang, S., Gao, H., Wang, X., and Wu, J. (2016). Statistical downscaling and dynamical downscaling of regional climate in China: Present climate evaluations and future climate projections. J. Geophys. Res. Atmos. 121 (5), 2110–2129. doi:10.1002/2015JD023977
Tang, J., Sun, X., Hui, P., Li, Y., Zhang, Q., and Liu, J. (2018). Effects of spectral nudging on precipitation extremes and diurnal cycle over CORDEX–East Asia domain. Int. J. Climatol. 38 (13), 4903–4923. doi:10.1002/joc.5706
Tao, W., Huang, G., Lau, W., Dong, D., Wang, P., and Wen, G. (2020). How can CMIP5 AGCMs’ resolution influence precipitation in mountain areas: The hengduan mountains? Clim. Dyn. 54 (1), 159–172. doi:10.1007/s00382-019-04993-w
Taylor, K. (2001). Summarizing multiple aspects of model performance in a single diagram. J. Geophys. Res. 106 (D7), 7183–7192. doi:10.1029/2000JD900719
Vanden Broucke, S., Wouters, H., Demuzere, M., and van Lipzig, N. (2019). The influence of convection-permitting regional climate modeling on future projections of extreme precipitation: Dependency on topography and timescale. Clim. Dyn. 52 (9), 5303–5324. doi:10.1007/s00382-018-4454-2
Veiga, S., and Yuan, H. (2021). Performance-based projection of precipitation extremes over China based on CMIP5/6 models using integrated quadratic distance. Weather Clim. Extrem. 34, 100398. doi:10.1016/j.wace.2021.100398
Voldoire, A., Saint-Martin, D., Sénési, S., Decharme, B., Alias, A., Chevallier, M., et al. (2019). Evaluation of CMIP6 DECK experiments with CNRM-CM6-1. J. Adv. Model. Earth Syst. 11, 2177–2213. doi:10.1029/2019MS001683
Wang, G., Zhang, J., Jin, J., Weinberg, J., Bao, Z., Liu, C., et al. (2017). Impacts of climate change on water resources in the Yellow River basin and identification of global adaptation strategies. Mitig. Adapt. Strateg. Glob. Chang. 22 (1), 67–83. doi:10.1007/s11027-015-9664-x
Wang, Y., Yang, K., Zhou, X., Chen, D., Lu, H., Ouyang, L., et al. (2020). Synergy of orographic drag parameterization and high resolution greatly reduces biases of WRF–simulated precipitation in central Himalaya. Clim. Dyn. 54 (3), 1729–1740. doi:10.1007/s00382-019-05080-w
Wu, J., and Gao, X. (2013). A gridded daily observation dataset over China region and comparison with the other datasets. Chin. J. Geophys. 56 (4), 1102–1111. doi:10.6038/cjg20130406
Wu, J., Gao, X., Giorgi, F., and Chen, D. (2017). Changes of effective temperature and cold/hot days in late decades over China based on a high–resolution gridded observation dataset. Int. J. Climatol. 37, 788–800. doi:10.1002/joc.5038
Xie, Y., and Wang, J. (2021). Preliminary study on the deviation and cause of precipitation prediction of GRAPES kilometer scale model in southwest complex terrain area. Acta. Meteorol. Sin. 79 (5), 732–749. doi:10.11676/qxxb2021.053
Xu, J., Gao, Y., Chen, D., Xiao, L., and Ou, T. (2017). Evaluation of global climate models for downscaling applications centred over the Tibetan Plateau. Int. J. Climatol. 37 (2), 657–671. doi:10.1002/joc.4731
Yan, Y., Dai, Q., Yuan, Y., Peng, X., Zhao, L., and Yang, J. (2018). Effects of rainfall intensity on runoff and sediment yields on bare slopes in a karst area, SW China. Geoderma 330, 30–40. doi:10.1016/j.geoderma.2018.05.026
Yang, Y., Tang, J., Xiong, Z., and Dong, X. (2017). Evaluation of high–resolution gridded precipitation data in arid and semiarid regions: Heihe River Basin, Northwest China. J. Hydrometeorol. 18 (12), 3075–3101. doi:10.1175/JHM-D-16-0252.1
Zhang, C. (2020). Moisture sources for precipitation in Southwest China in summer and the changes during the extreme droughts of 2006 and 2011. J. Hydrol. X. 591, 125333. doi:10.1016/j.jhydrol.2020.125333
Zhang, Q., Li, J., Singh, V., and Xiao, M. (2013a). Spatio–temporal relations between temperature and precipitation regimes: Implications for temperature–induced changes in the hydrological cycle. Glob. Planet. Change 111, 57–76. doi:10.1016/j.gloplacha.2013.08.012
Zhang, Q., Li, J., Singh, V., and Xu, C. (2013b). Copula-based spatio-temporal patterns of precipitation extremes in China. Int. J. Climatol. 33 (5), 1140–1152. doi:10.1002/joc.3499
Zhang, W., Villarini, G., Scoccimarro, E., Roberts, M., Vidale, P., Vanniere, B., et al. (2021). Tropical cyclone precipitation in the HighResMIP atmosphere–only experiments of the PRIMAVERA Project. Clim. Dyn. 57 (1), 253–273. doi:10.1007/s00382-021-05707-x
Zhang, W., and Zhou, T. (2020). Increasing impacts from extreme precipitation on population over China with global warming. Sci. Bull. (Beijing). 65 (3), 243–252. doi:10.1016/j.scib.2019.12.002
Zhang, Y., Zhang, S., Zhai, X., and Xia, J. (2012). Runoff variation and its response to climate change in the three rivers source region. J. Geogr. Sci. 22 (5), 781–794. doi:10.1007/s11442-012-0963-9
Zhao, P., Xiao, H., Liu, C., Zhou, Y., Xu, X., and Hao, K. (2021). Evaluating a simple proxy for climatic cloud–to–ground lightning in Sichuan Province with complex terrain, Southwest China. Int. J. Climatol. 42, 3909–3927. doi:10.1002/joc.7451
Zhao, P., Xiao, H., Liu, J., and Zhou, Y. (2022). Precipitation efficiency of cloud and its influencing factors over the Tibetan Plateau. Int. J. Climatol. 42 (1), 416–434. doi:10.1002/joc.7251
Zhao, Y., and Zhou, T. (2021). Interannual variability of precipitation recycle ratio over the Tibetan Plateau. Geophys. Res. Atmos. 126 (2), e2020JD033733. doi:10.1029/2020JD033733
Keywords: CMIP6, HighResMIP, model evaluation, precipitation, Southwest China
Citation: Jin Z, Ge F, Chen Q and Lin Z (2023) To what extent horizontal resolution improves the simulation of precipitation in CMIP6 HighResMIP models over Southwest China?. Front. Earth Sci. 10:1003748. doi: 10.3389/feart.2022.1003748
Received: 26 July 2022; Accepted: 29 September 2022;
Published: 10 January 2023.
Edited by:
Jingyu Wang, Nanyang Technological University, SingaporeReviewed by:
Jianping Tang, Nanjing University, ChinaCopyright © 2023 Jin, Ge, Chen and Lin. This is an open-access article distributed under the terms of the Creative Commons Attribution License (CC BY). The use, distribution or reproduction in other forums is permitted, provided the original author(s) and the copyright owner(s) are credited and that the original publication in this journal is cited, in accordance with accepted academic practice. No use, distribution or reproduction is permitted which does not comply with these terms.
*Correspondence: Fei Ge, ZmVpLmdlQG1waW1ldC5tcGcuZGU=
Disclaimer: All claims expressed in this article are solely those of the authors and do not necessarily represent those of their affiliated organizations, or those of the publisher, the editors and the reviewers. Any product that may be evaluated in this article or claim that may be made by its manufacturer is not guaranteed or endorsed by the publisher.
Research integrity at Frontiers
Learn more about the work of our research integrity team to safeguard the quality of each article we publish.