- 1Hebei Key Laboratory of Optoelectronic Information and Geo-detection Technology, Hebei GEOUniversity, Shijiazhuang, China
- 2Guangdong Hualu Transport Technology Co, Ltd., Guangzhou, China
- 3Hebei Technology Innovation Center for Intelligent Development and Control of Underground BuiltEnvironment, Hebei GEO University, Shijiazhuang, China
- 4College of Urban Geology and Engineering, Hebei GEO University, Shijiazhuang, China
- 5Beijing Municipal Engineering Research Institute, Beijing, China
- 6College of Civil Engineering and Mechanics, Lanzhou University, Lanzhou, China
The load displacement curve model of bolt is of great significance to estimate the ultimate uplift bearing capacity of bolt and analyze the force transmission of bolt. Therefore, it is particularly necessary to establish a high-precision load displacement curve model of bolt. In this paper, the statistical damage theory is introduced to establish a new stiffness degradation model of bolt load displacement curve, and a model which is more consistent with the test data and has higher accuracy in predicting the ultimate uplift capacity is proposed. The influence of model parameters on the model curve is analyzed. It can be concluded that the key to the load displacement curve of the anchor and the prediction of the uplift bearing capacity of the anchor is to determine the statistical random distribution characteristics of the micro element strength of the anchor interface.
Introduction
Bolt support is widely used in foundation pit, slope, tunnel and roadway engineering. The ultimate uplift bearing capacity and stress characteristics of bolt have always been an important issue concerned by scholars and engineering designers (Li, 1999; Li et al., 2012; Wang et al., 2019; Wang et al., 2021a; Wang et al., 2021b; Zhang et al., 2022). The ultimate pullout bearing capacity of the bolt is usually determined by the pull-out test of the bolt. In order to study the ultimate pullout bearing capacity of bolt, some scholars analyze the ultimate bearing capacity of bolt from the perspective of limit equilibrium and limit analysis (Serrano et al., 2000; As and Co, 2002; Serrano and Olalla, 2002; Wang et al., 2013). Some scholars estimate the ultimate bearing capacity of the anchor rod from the load displacement curve of the anchor rod pull-out test. This method can not only estimate the bearing capacity of the anchor rod, but also describe the load displacement curve, which lays a foundation for further analysis of the stress distribution of the anchor rod along the rod length (Huang et al., 2014; Zou and Zhang, 2019). The load displacement curve was first used in the estimation of the ultimate bearing capacity of the pile.
Van er veen C (1953) described the load displacement curve of the pile with an exponential function model and predicted the ultimate bearing capacity of the pile. Xu et al. (2000) described the load displacement curve of uplift pile with power function model and predicted the ultimate bearing capacity. Deng and Lu (2002) described the pile load displacement curve with the adjusted hyperbolic model and exponential model, and predicted the ultimate bearing capacity of the pile. Jiang et al. (2009) uses Weibull mathematical model (
Based on the exponential function of bolt load displacement curve proposed in reference (Ying et al., 2005), a modified exponential function model is proposed by introducing statistical damage mechanics (Rinaldi et al., 2007; Chen, 2020; Xie et al., 2020). By analyzing the deterioration law of the pullout stiffness of the exponential function model, it is found that the pullout stiffness of the bolt in the model decreases exponentially with the displacement. This law essentially reflects the assumption that the micro element strength of the anchorage interface follows a certain random exponential distribution, but the exponential distribution is not accurate enough to describe the random distribution of micro element strength of the anchorage interface. Therefore, the prediction of the ultimate pullout resistance of the anchor bolt is inaccurate and the deviation between the fitting curve and the test data points is large. In view of this, a modified exponential function bolt load displacement curve model is proposed by using the higher-order statistical distribution of exponential distribution modified Weibull distribution (Lai et al., 2003) and combined with the principle of statistical damage mechanics, and the accuracy of the modified model is verified by six groups of pull-out test data.
Stiffness deterioration law of exponential function model
According to the principle of damage mechanics, accurately describing the change law of nonlinear curve stiffness is an important premise for establishing a more accurate model. Therefore, the key to improve the accuracy of constitutive curve model is to accurately describe and predict the deterioration and change law of curve stiffness. Based on this principle, the load displacement curve model of exponential function bolt is improved. The model built in this paper applies to anchor bar is pulled out and anchor solid is pulled out these two cases.
Ying et al. (2005) proposed an exponential function model for describing the load displacement curve of anchor rod and predicting the ultimate uplift bearing capacity. The expression is as follows.
Where,
The slope of the curve is defined as the uplift stiffness of the anchor rod, hereinafter referred to as the stiffness. The expression of uplift stiffness in the load displacement curve of anchor bolt can be obtained from Eq. 1 as follows.
From Eq. 2, it can be known that the ratio of stiffness and initial stiffness under a certain displacement is:
Where, the ratio (
Stiffness change correction method based on statistical damage mechanics
According to the principle of strain equivalence (Voyiadjis and Kattan, 2016; Xu et al., 2017; Chen et al., 2018a; Chen et al., 2018b), the damage factor can generally be defined as:
From the above formulas, the load displacement curve expression of anchor rod with damage factor can be obtained.
Statistical damage mechanics considers the heterogeneity of the medium from the microscopic point of view, and considers that the micro damage of the medium is caused by the failure of the internal micro elements after reaching a certain strength. Therefore, statistical damage mechanics is used to reflect the essential law of curve stiffness degradation.
It is assumed that the micro element strength random distribution characteristics of the anchor bolt anchorage interface obey the modified Weibull distribution (Sun et al., 2015), and the displacement is taken as the strength criterion parameter.
Firstly, the probability density function expression of the modified Weibull function is as follows.
Where,
Assuming that the failure occurs when the shear displacement of the interface micro element reaches a certain value, the number of failure of the anchor bolt anchoring interface micro element under a certain displacement can be expressed by modifying the probability distribution density function of Weibull statistical distribution:
Where,
The damage factor is defined as by the proportion of the number of damaged micro elements to the total number of micro elements (Chen et al., 2018b):
By combining the above two formulas
By substituting Eq. 9 into Eq. 5, the modified load displacement curve expression of anchor rod is as follows:
Engineering case verification and parameter analysis
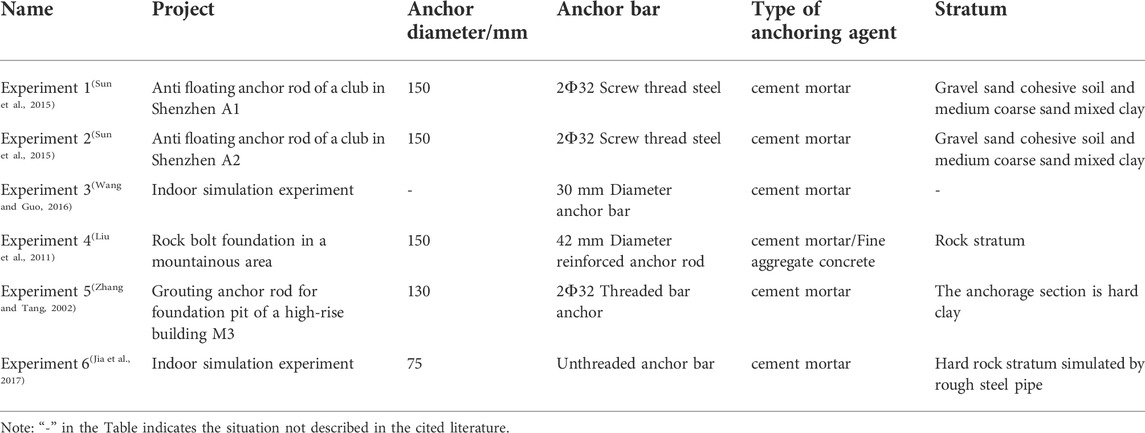
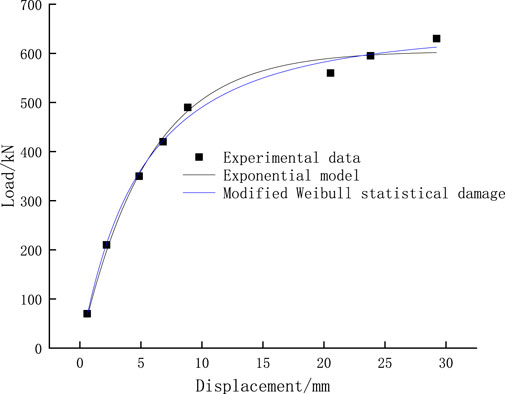
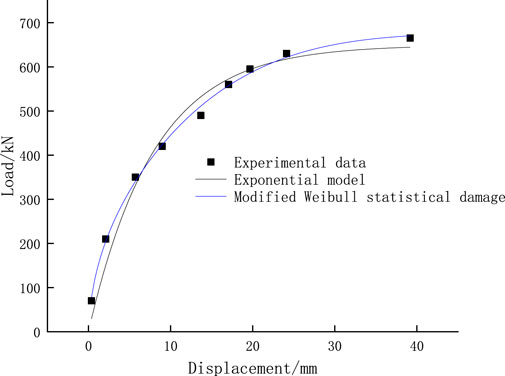
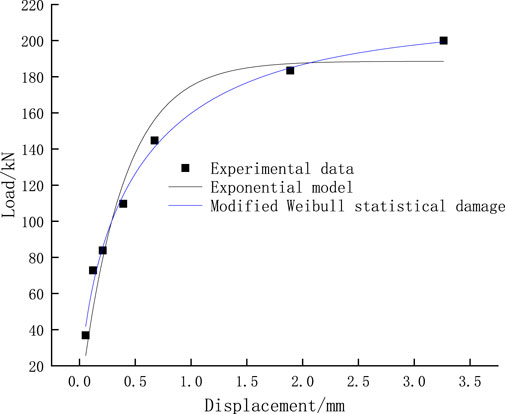
The bolt pull-out test in reference (Zhang and Tang, 2002; Rinaldi et al., 2007; Liu et al., 2011; Wang and Guo, 2016; Jia et al., 2017) is recorded as experiment 1∼experiment 6 respectively. The overview of each experiment is shown in Table 1.
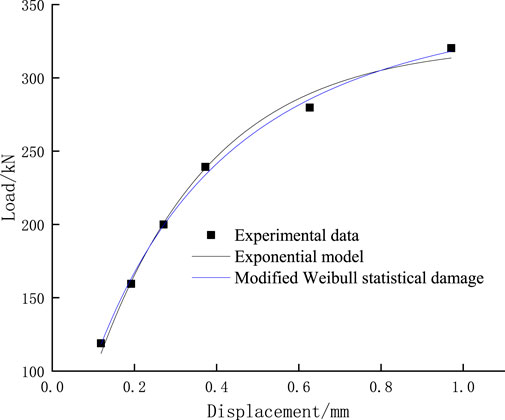
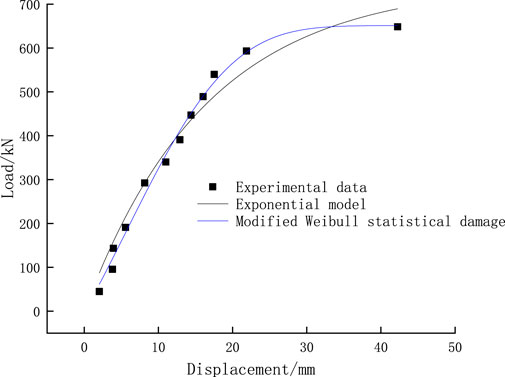
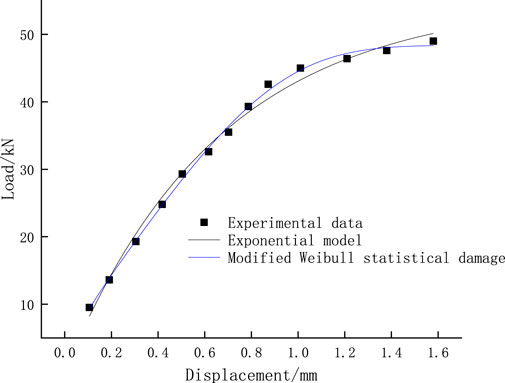
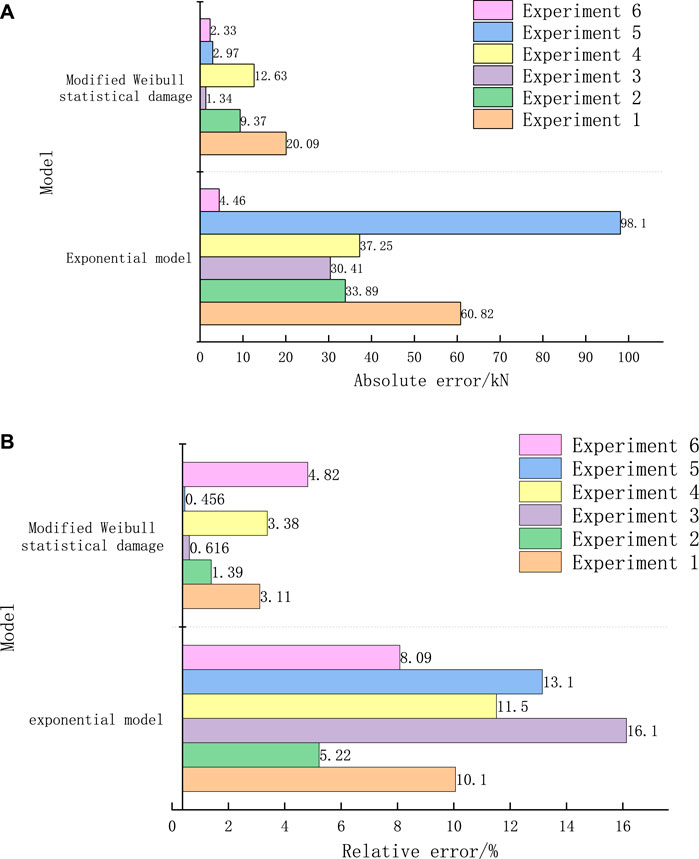
Figures 1–6, it can be seen that the modified model in this paper is more consistent with the experimental data than the exponential function model. The modified model is more accurate in describing the random distribution characteristics of micro element strength at the anchorage interface, and can more accurately represent the law of the deterioration of bolt pullout stiffness with displacement, so it can be more consistent with the experiment data of load displacement curve in pullout experiment. It can be seen from Table 2; Figure 7 that in terms of the accuracy of predicting the ultimate bearing capacity, the absolute error range of the modified Weibull model is 1.34–20.9 kN, and the relative error rate is 0.456%–4.82%. The absolute error range of the exponential function model is 4.46–98.1 kN, and the relative error rate is 5.22%–16.1%. The error of the modified model is basically within 5%, which is obviously better than the exponential function model. This is because the modified model can more accurately reflect the macro deterioration law of bolt pullout stiffness, so as to predict the load (ultimate pullout capacity) under the “asymptote” limit state more accurately.
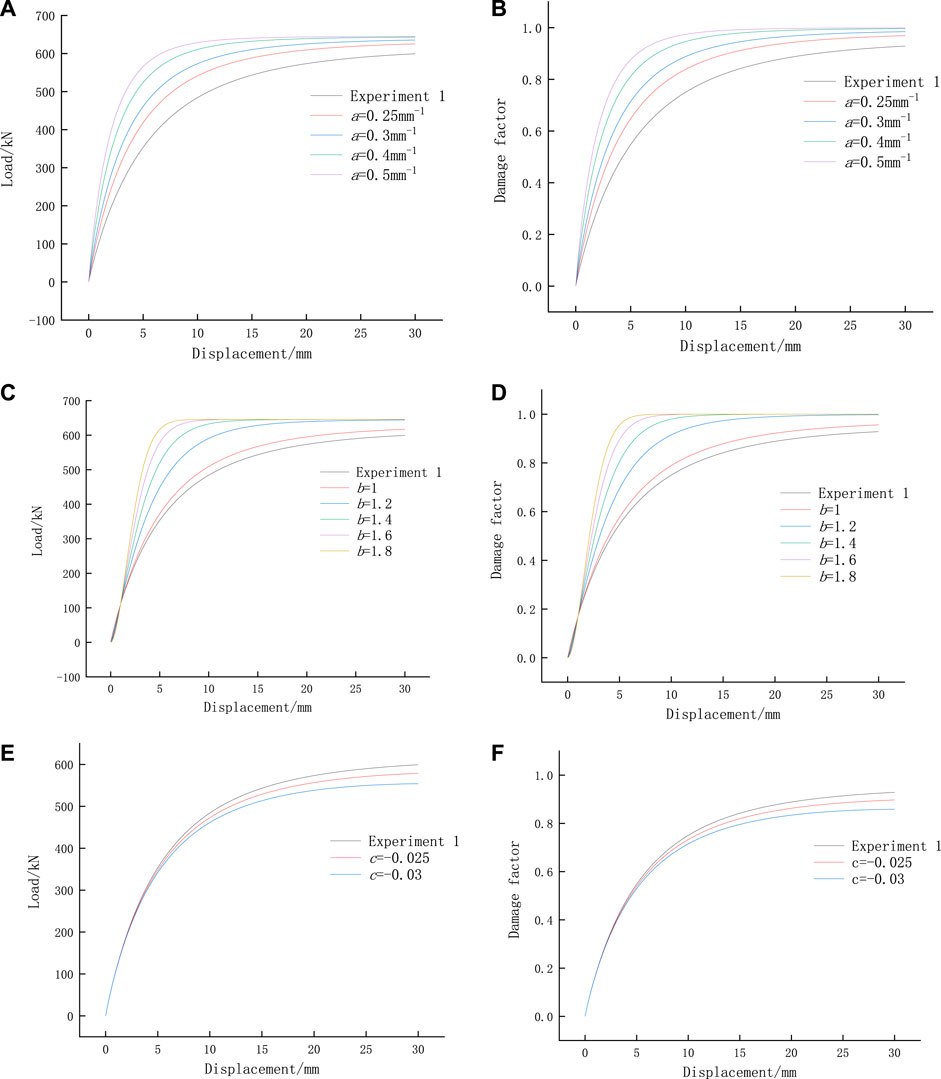
Taking the model parameters of the experiment as an example, the control variable method is used for parameter analysis. The influence of each parameter is shown in Figure 8.
It can be seen from Figure 8 that when the ultimate pullout force of anchor bolt is certain, the three model parameters have a great impact on the slope of load displacement curve. Here, it is proved that it is important to accurately describe the slope change of load displacement curve. With the increase of the value
Conclusion
(1) Based on the principle of statistical damage mechanics, a correction method of load displacement curve is proposed in this paper. Through the comparison of cases and experiments, the modified model can more accurately describe the load displacement curve of anchor rod and predict the ultimate uplift bearing capacity of anchor rod, which has certain engineering application value.
(2) Through the damage mechanics analysis, the random distribution characteristics of micro element strength at the anchorage interface are assumed to be the modified Weibull distribution, which better optimizes the accuracy of the function model method in estimating the uplift bearing capacity of anchor bolts.
(3) Through parameter analysis, it is found that the modified Weibull statistical damage mechanics method can better adapt to the complex load displacement curve. Compared with the damage evolution curve, describing the damage characteristics of the anchorage interface can well characterize the stress change process of the anchor.
Data availability statement
The original contributions presented in the study are included in the article/supplementary material, further inquiries can be directed to the corresponding author.
Author contributions
ZY and SC: Writing of the whole manuscript and data processing. SC: Technical guidance for the entire manuscript and the production of tables. JS: Some drawing and table making and manuscript typesetting. YZ: Language editing and polishing of the entire manuscript. LL: Draw some Figures in the manuscript and data processing. YY: Guide the revision and verification of the manuscript.
Funding
This research is sponsored by the Doctoral research start-up fund of Hebei GEO University and Hebei University Youth Fund Project (QN202105) and Key research and development projects in Hebei Province (22371701D) and Hebei Province Innovation Ability Promotion Program (21567628H).
Conflict of interest
Author ZY was employed by Guangdong Hualu Transport Technology Co., Ltd.
The remaining authors declare that the research was conducted in the absence of any commercial or financial relationships that could be construed as a potential conflict of interest.
Publisher’s note
All claims expressed in this article are solely those of the authors and do not necessarily represent those of their affiliated organizations, or those of the publisher, the editors and the reviewers. Any product that may be evaluated in this article, or claim that may be made by its manufacturer, is not guaranteed or endorsed by the publisher.
References
As, A., and Co, B. (2002). Ultimate bearing capacity at the tip of a pile in rock—part 2: Application. Int. J. Rock Mech. Min. Sci. 39 (7), 847–866. doi:10.1016/s1365-1609(02)00053-9
Chen, K. (2020). Constitutive model of rock triaxial damage based on the rock strength statistics. Int. J. Damage Mech. 29 (1), 1487–1511. doi:10.1177/1056789520923720
Chen, S., Qiao, C., Ye, Q., and Khan, M. U. (2018b). Comparative study on three-dimensional statistical damage constitutive modified model of rock based on power function and Weibull distribution. Environ. Earth Sci. 77 (3), 108. doi:10.1007/s12665-018-7297-6
Chen, S., Qiao, C. S., and Ye, Q. (2018a). Composite damage constitutive model of rock mass with intermittent joints based on Mohr-Coulomb criterion. Rock Soil Mech. 39 (10), 3612–3622. doi:10.1007/s12517-018-3643-y
Deng, Z. Y., and Lu, P. Y. (2002). Comparative analysis of several prediction models of vertical ultimate bearing capacity of single pile. Rock Soil Mech. (04), 428–431. + 464. doi:10.11113/jt.v61.1777
Huang, M. H., Zhou, Z., and Ou, J. P. (2014). Nonlinear full process analysis of the pulling force in the anchorage section of tensile anchor. J. rock Mech. Eng. 33 (11), 2190–2199. doi:10.13722/j.cnki.jrme.2014.11.004
Jia, Y., Zhao, R. D., and Li, F. H. (2017). Experimental study on the influence of high temperature and surrounding rock roughness on the pull-out strength of bolt grouting material. J. Railw. 39 (06), 141–149.
Jiang, J. P., Gao, G. Y., and Liu, W. B. (2009). Weibull mathematical model describing the uplift load displacement curve of PHC pile. J. Sichuan Univ. Eng. Sci. Ed. 41 (04), 82–88.
Lai, C. D., Xie, M., and Murthy, D. N. P. (2003). A modified Weibull distribution. IEEE Trans. Reliab. 52 (1), 33–37. doi:10.1109/tr.2002.805788
Li, B., Qi, T., Wang, Z., and Longwei, Y. (2012). Back analysis of grouted rock bolt pullout strength parameters from field tests. Tunn. Undergr. Space Technol. 28, 345–349. doi:10.1016/j.tust.2011.11.004
Li, C., and Stillborg, B. (1999). Analytical models for rock bolts. Int. J. Rock Mech. Min. Sci. (1997). 36 (8), 1013–1029. doi:10.1016/s1365-1609(99)00064-7
Li, J. L. (2009). Modeling and prediction of ultimate bearing capacity based on Generalized Grey Model. Wuhan: Wuhan University of technology.
Liu, B., Li, D., Duan, Y., Jin, G., and Tian, N. (2011). Experimental study and failure process analysis of bond slip relationship between bolt and mortar interface. J. Rock Mech. Eng. (S1), 2790–2797. doi:10.1155/2018/6960285
Rinaldi, A., Krajcinovic, D., and Mastilovic, S. (2007). Statistical damage mechanics and extreme value theory. Int. J. Damage Mech. 16 (1), 57–76. doi:10.1177/1056789507060779
Serrano, A., Olalla, C., and González, J. (2000). Ultimate bearing capacity of rock masses based on the modified Hoek–Brown criterion. Int. J. Rock Mech. Min. Sci. (1997). 37 (6), 1013–1018. doi:10.1016/S1365-1609(00)00028-9
Serrano, A., and Olalla, C. (2002). Ultimate bearing capacity at the tip of a pile in rock—part 1: Theory. Int. J. Rock Mech. Min. Sci. (1997). 39 (7), 833–846. doi:10.1016/s1365-1609(02)00052-7
Sun, X. Y., Zhang, T., Wang, M. M., and Wang, Z. D. (2015). Study on prediction method of anchor bearing capacity based on improved exponential power mixed function model. J. rock Mech. Eng. (08), 135–143. doi:10.13722/j.cnki.jrme.2014.1106
Van er veen C (1953). The bearing capacity of a pile[C]//proceedings of the third international conference of soil mechanical and foundation engineering. [s. n., 84–90.
Voyiadjis, G. Z., and Kattan, P. I. (2016). Elasticity of damaged graphene: A damage mechanics approach. Int. J. Damage Mech. 25, 1184–1213. doi:10.1177/1056789516656747
Wang, G., Han, W., Jiang, Y., Luan, H., and Wang, K. (2019). Coupling analysis for rock mass supported with CMC or CFC rock-bolts based on viscoelastic method. Rock Mech. Rock Eng., 1–24. doi:10.1007/s00603-019-01840-6
Wang, H., and Guo, Y. C. (2016). Debonding analysis of single anchor based on catastrophe theory. Rock Soil Mech. 37 (10), 2833–2838. doi:10.16285/j.rsm.2017.11.004
Wang, H. T., Wang, Q., You, C. A., Li, S. C., Wang, D. C., and Wang, X. (2013). Study on ultimate pullout force of anchor cable considering soil heterogeneity and anisotropy. Rock Soil Mech. 34 (08), 2204–2210.
Wang, L. Q., Wu, J. H., Zhang, W. G., and Cui, W. (2021b). Efficient seismic stability analysis of embankment slopes subjected to water level changes using gradient boosting algorithms. Front. Earth Sci. (Lausanne). 9, 807317. doi:10.3389/feart.2021.807317
Wang, L. Q., Zhang, Z. H., Huang, B. L., Hu, M., and Zhang, C. (2021a). Triggering mechanism and possible evolution process of the ancient Qingshi landslide in the Three Gorges Reservoir. Geomatics, Nat. Hazards Risk 12 (1), 3160–3174. doi:10.1080/19475705.2021.1998230
Xie, S., Lin, H., Wang, Y., Chen, Y., Xiong, W., Zhao, Y., et al. (2020). A statistical damage constitutive model considering whole joint shear deformation. Int. J. Damage Mech. 29 (4), 988–1008. doi:10.1177/1056789519900778
Xu, H. F., Qian, Q. H., and Jin, F. N. (2000). Power function model for describing load displacement curve of uplift pile. J. Geotechnical Eng. (05), 622–624. doi:10.3321/j.issn:1000-4548.2000.05.026
Xu, X., Gao, F., and Zhang, Z. (2017). Thermo-mechanical coupling damage constitutive model of rock based on the Hoek–Brown strength criterion. Int. J. Damage Mech. 27, 1213–1230. doi:10.1177/1056789517726838
Ying, Z. M., Zhang, J., and Shang, Y. Q. (2005). Study on exponential function model of load displacement curve of anchor. Rock Soil Mech. (08), 158–161. doi:10.3969/j.issn.1000-7598.2005.08.028
Zhang, J., Shang, Y. Q., and Ye, B. (2005). Analytical method of load transfer on P-S curve of anchor. J. Rock Mech. Eng. 24 (06), 1072–1076. doi:10.25103/jestr.113.05
Zhang, J. R., and Tang, B. F. (2002). Hyperbolic function model for analysis of load transfer mechanism of anchor. J. Geotechnical Eng. (02), 188–192.
Zhang, K. Q., Wang, L. Q., Dai, Z. W., Huang, B., and Zhang, Z. (2022). Evolution trend of the Huangyanwo rock mass under the action of reservoir water fluctuation. Nat. Hazards (Dordr).. doi:10.1007/s11069-022-05359-y
Keywords: bolt, load displacement curve, statistical damage mechanics, modified Weibull statistical distribution, curve model
Citation: Yang Z, Chen S, Sun J, Zheng Y, Li L and Yuan Y (2022) Bar load-displacement curve model based on statistical damage mechanics. Front. Earth Sci. 10:1001777. doi: 10.3389/feart.2022.1001777
Received: 24 July 2022; Accepted: 22 August 2022;
Published: 15 September 2022.
Edited by:
Chong Xu, Ministry of Emergency Management, ChinaCopyright © 2022 Yang, Chen, Sun, Zheng, Li and Yuan. This is an open-access article distributed under the terms of the Creative Commons Attribution License (CC BY). The use, distribution or reproduction in other forums is permitted, provided the original author(s) and the copyright owner(s) are credited and that the original publication in this journal is cited, in accordance with accepted academic practice. No use, distribution or reproduction is permitted which does not comply with these terms.
*Correspondence: Song Chen, Y2hlbm5zb25nZ0AxNjMuY29t
 Zhao Yang1,2,3
 Song Chen
 Liufang Li