 Menglei Li1,2*
 Chaomo Zhang1,2
- 1College of Geophysics and Petroleum Resources, Yangtze University, Wuhan, China
- 2Key Laboratory of Exploration Technologies for Oil and Gas Resources, Ministry of Education, Yangtze University, Wuhan, China
In order to accurately evaluate the shale reservoir of the Lower Carboniferous Luzhai Formation in the central Guangxi area, in view of the influence of the low resistivity of the reservoir and the complex mineral composition on the logging response, taking Well A1 as an example, a method to improve the calculation accuracy of reservoir parameters is studied. The reasons for the low resistance in the study area are analyzed from the aspects of minerals, geochemistry and geology. An improved △log R method based on borehole correction and natural gamma spectroscopy logging was proposed to calculate the total organic carbon content. A calcium-corrected HERRON method is proposed to calculate porosity. The P/S time difference ratio-density neutron log overlap difference is proposed to calculate saturation. Calculation of adsorbed gas content based on organic matter correction. The results show that the improved method greatly improves the prediction accuracy, and has high consistency with the core analysis results, and can accurately evaluate the shale reservoirs of the Lower Carboniferous Luzhai Formation in the central area of Guangxi. The improved new method has good applicability and can be further used in the evaluation of this kind of source rock reservoir.
1 Introduction
With the deepening of exploration and development, shale gas reservoirs have gradually attracted the attention of scholars from all over the world (Kim et al., 2019; Owusu et al., 2019; Zhao et al., 2019). Gas content is one of the important parameters for evaluating shale gas reservoirs (Wang and Guo, 2019). Shale gas is mainly composed of adsorbed gas and free gas (Curtis, 2002). The factors affecting the gas content of shale gas reservoirs include: total organic carbon (TOC) content (Yang et al., 2019), porosity (Ge et al., 2016; Sun et al., 2016; Zhu et al., 2020), gas saturation (Liu et al., 2018; Pandey et al., 2019; Zhou et al., 2019), adsorbed gas content (Ghazy et al., 2016; Sultan et al., 2018) and total gas content (Guo and Peng, 2019), etc. At present, there are relatively few related studies on the shale of the Lower Carboniferous Luzhai Formation in the central Guangxi area, the gas-bearing characteristics are not yet clear, and there is a lack of quantitative research on the corresponding influencing factors. Accurate calculation and evaluation of the physical parameters of free gas and adsorbed gas plays a significant role in determining the physical properties of the reservoir, and the calculation of reservoir parameters is also of great significance (Jiang et al., 2016; Zhou et al., 2016). Based on a variety of data such as isothermal adsorption experiments and well logging, an accurate calculation method for gas-bearing parameters of the Lower Carboniferous Luzhai Formation shale reservoir in the central area of Guangxi is studied.
In shale gas exploration, the influence of low resistance phenomenon on the log response value will produce unsatisfactory results in the calculation of other parameters (Ayadiuno et al., 2017). Kadkhodaie and Rezaee (2016) believed that special clay minerals produce high additional conductivity and bound water content leading to low resistance. Kethireddy et al. (2014) believed that graphitization of high-mature organic matter leads to low resistance. Sun et al. (2018) believes that pyrite conducts electricity resulting in low resistance. Yu et al. (2012) believed that tectonic action would lead to low resistance. In this study, after analyzing a large number of core samples and electron microscope pictures, the main cause of the low resistance in the study area was identified. Including geochemical, physical, geological and other reasons.
The total organic carbon content (TOC) effectively reflects the hydrocarbon generation potential. Core Experiments Can Accurately Determine TOC. However, due to the very high cost of coring, it is not possible to conduct continuous coring experiments over the entire reservoir depth interval for each well. In 1990, Passey et al. proposed to predict the organic carbon content by overlapping the acoustic time difference curve and the resistivity in the non-source rock interval (Passey et al., 1990). However, this method needs to determine the thermal maturity or vitrinite reflectance of the source rock first, and for some formations containing specific minerals, the calculation accuracy of the simple overlay method will be reduced. According to the characteristics of the study area, this paper proposes an improved △log R method based on caliper correction and natural gamma spectroscopy logging, which greatly improves the accuracy of the overlapping method.
Porosity is a key parameter for evaluating oil and gas reservoirs, especially when determining pore space and geological reserves. Shale is dominated by micro- and nano-scale pores with complex pore structure. Therefore, it is difficult to accurately measure shale porosity. Baneshi et al. (2015) used log data to calculate porosity. Mohaghegh et al. (2002) calculated porosity by using neural network algorithm based on conventional logging data. However, due to the problems of borehole expansion and low resistance in the study area, the logging data used by the above methods are prone to distortion, which will lead to inaccurate calculated porosity. Based on the complex lithology, strong heterogeneity and high carbonate content in the study area, a calcium-corrected HERRON porosity calculation method is proposed to improve the conventional porosity model.
In the calculation of free gas, saturation is a key parameter, and it is necessary to establish an accurate and reliable evaluation method. Laboratory measurements are the most accurate and reliable method for determining water saturation, but samples are limited and measurement costs are high. The resistivity method mainly uses the Archie formula (Archie, 1942). Kadkhodaie and Rezaee (2016) developed an Archie model based on a kerogen-clay joint conductivity correction. Tan et al. (2015) proposed the use of nuclear magnetic resonance logging to calculate the gas saturation. However, the conduction mechanism of shale is complex, and the calculation of formation water salinity and electrical parameters is difficult. Resistivity-based methods are not ideal for estimating saturation in shale gas reservoirs rich in organic matter and conductive minerals. Therefore, developing non-resistivity-based methods is crucial for estimating free gas saturation in shale gas reservoirs. In this paper, a method for calculating the saturation is established by using the overlap difference value of P/S time difference ratio density neutron logging.
In this study, based on the core isotherm adsorption experiments of the Lower Carboniferous Luzhai Formation in central Guangxi, the formation pressure, temperature and other data were combined. The formation adsorbed gas content was studied using the corrected Langmuir equation. The calculation model of adsorbed gas content is established through experiments and logging data. Use improved porosity and saturation models to improve free gas calculation accuracy. The gas content evaluation results are of great significance to the evaluation of high-quality reservoirs and are helpful for the exploration and development of shale gas reservoirs.
2 Geological background
The Guangxi Depression is located on the southwestern margin of the South China Plate (Figure 1). The north is adjacent to the Xuefeng uplift, the east is bounded by the Longsheng-Yongfu fault and the Dayaoshan uplift, the west is bounded by the Nandan-Du’an fault and adjacent to the Nanpanjiang depression, and the northwest is bounded by the Sandu fault zone. The Qiannan Depression is adjacent, with an area of 4.6×10⁴km2. Four groups of fault systems of different scales in the NNE-NE, NW, near-EW and near-SN trending development in the Guangxi depression. NE and near EW trending faults are the main faults in the depression. The study area is located in the northern slope zone, and the main body is the Yizhou north syncline. The strata in the syncline are relatively wide and gentle, the structural deformation is relatively weak, and the faults are not developed.
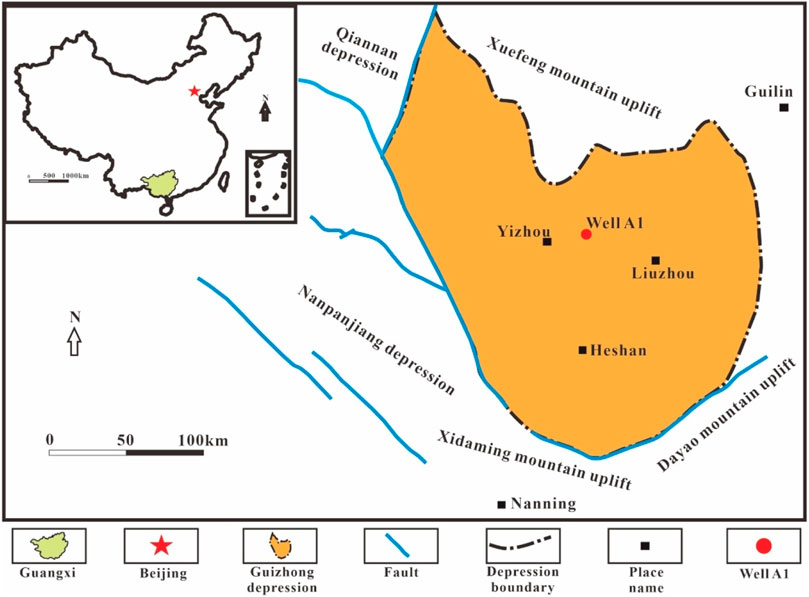
FIGURE 1. Regional geological location of the study area.
The upper and middle strata of the Luzhai Formation in the study area are dominated by brownish gray lime mudstone and argillaceous limestone. The lithology of the lower strata is dominated by lime mudstone, grey-black lime shale and shale. In Well A1, 3073.5–3077.5m, mainly calcite, and shale carbonization is relatively heavy. From 3077.5 to 3095.13m, it is dominated by mudstone, with high clay mineral content. From 3095.13 to 3109.0m, calcite is the main, followed by mudstone, clay mineral content is high, and the carbonization degree is high. On the whole, the permeability change and organic matter content of lime mudstone have a large vertical distribution range, and the reservoir heterogeneity is strong.
3 Theory and method
3.1 Core test
The research in this paper needs to combine data from a large number of different core experiments. A total of 254 rock samples from Well A in central Guangxi were selected for experiments. The study horizon is located in the Lower Carboniferous Luzhai Formation, which is a typical marine shale gas reservoir. 77 rock flakes data (3069.80–3120.65 m) using Imager A2m polarized fluorescence microscope.46 TOC data (3069.80–3110.43 m) determined using CS-230 carbon and sulfur analyzer (Table. 1). 35 whole rock X-ray diffraction data (3069.80–3110.43 m) were determined using D8 Advance X-ray diffractometer (Table. 2). 20 pieces of water saturation data (3070.00–3119.78 m) were measured using the ap-608 instrument of American Core Company. 14 conventional porosity and permeability data (3069.80–3100.45 m) measured using QK-98 gas porosimeter and GDS-90F gas permeability tester. 14 clay X-ray diffraction data (3077.67–3107.31 m) determined using D8 Advance X-ray diffractometer (Table. 3). 11 Argon ion scanning electron microscope data (3073.97–3107.31 m) determined using a Helios 65 focused ion beam scanning electron microscope. 11 vitrinite reflectance data (3077.67–3107.31 m) measured using MSP200 microphotometer. 11 kerogen microscopic data (3077.67–3107.31 m) were determined using a DM4500P polarized fluorescence microscopy. 5 rock pyrolysis data (3077.67–3091.85 m) were determined using Rock-EVAL6 pyrolysis instrument and XP205 electronic balance. 5 adsorption isotherm data (3077.67–3091.85 m) were determined using Rubotherm adsorption isotherm.
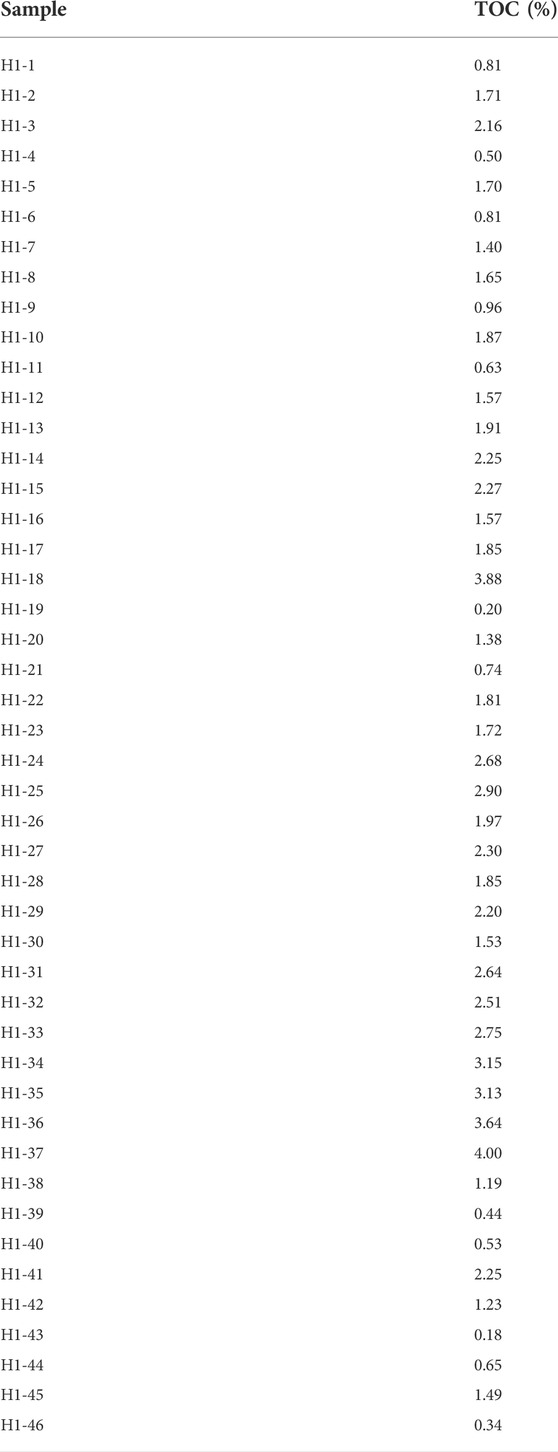
TABLE 1. TOC data of cores from Luzhai Formation in the study area.
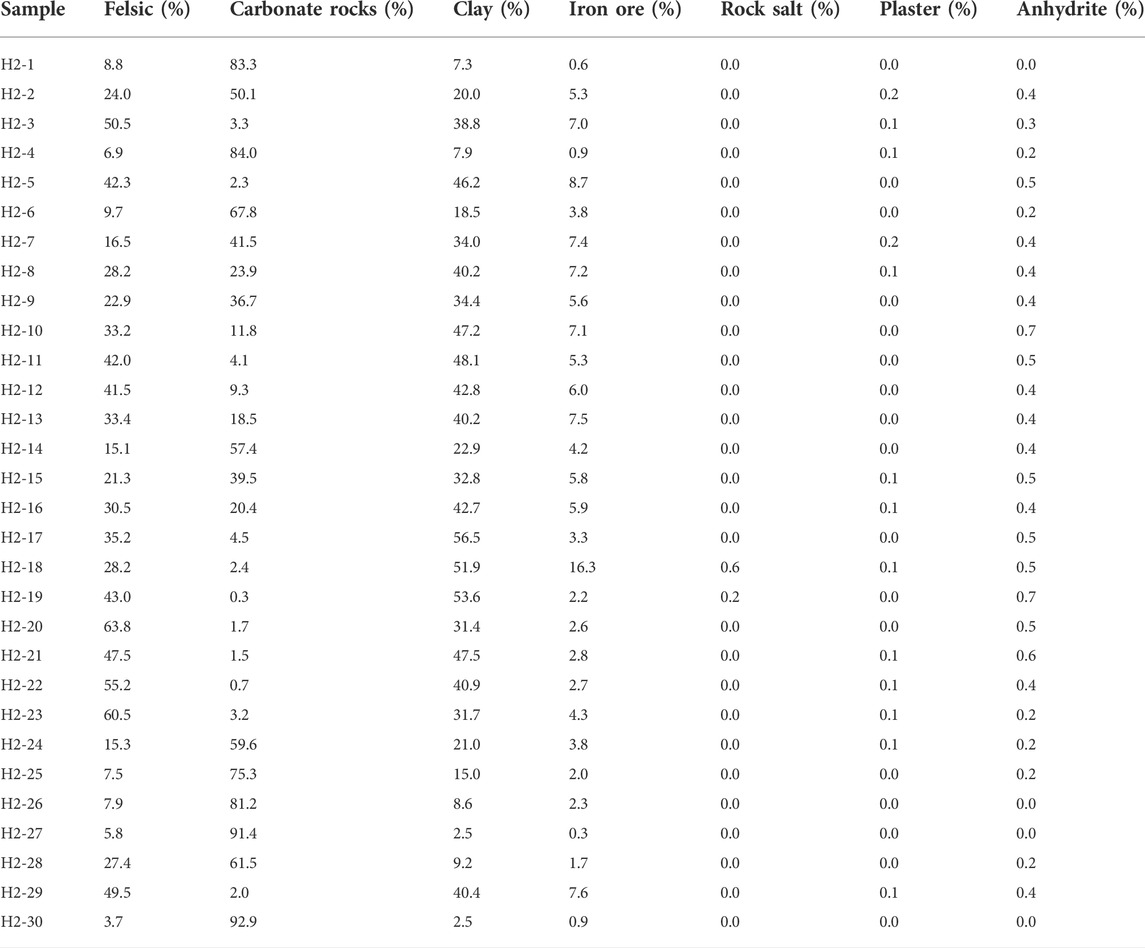
TABLE 2. Whole-rock X-ray diffraction data of the Luzhai Formation in the study area.
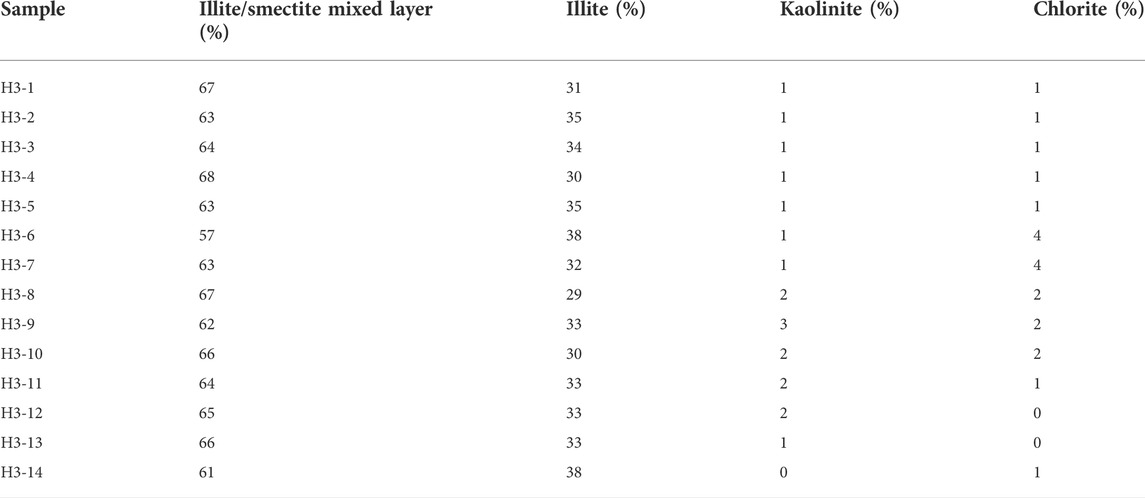
TABLE 3. X-ray diffraction data of the clay of the Luzhai Formation in the study area.
3.2 Low resistance analysis
There is a low resistance phenomenon in the study area. In the low resistance state, the log response relationship of the reservoir will also change accordingly (Zhao et al., 2007; Kinley et al., 2008). In this study, well A1 of the Luzhai Formation in the central area of Guangxi was selected. The relationship between low resistivity and mineral content, organic matter, pore structure and geology is systematically sorted out and analyzed. The clay X-ray diffraction data (Figure 2A), rock thin section and argon ion scanning electron microscope from Well A1 were used to support the analysis of the main controlling factors of low resistivity. Identify the minerals in the shale that are primarily responsible for low resistivity. By establishing the correlation between different maturity and TOC and resistivity, the relationship between maturity and resistivity, TOC and resistivity was analyzed. The relationship between pore structure and resistivity in the reservoir was observed by argon ion scanning electron microscopy. The effect of mineral content on resistivity was analyzed by whole-rock X-ray diffraction data (Figure 2B). The effect of lamina on resistivity was analyzed by polarizing micrographs. Through these experimental data, it is fully proved that the low resistance of the reservoir is affected by minerals, maturity, pore structure and so on.
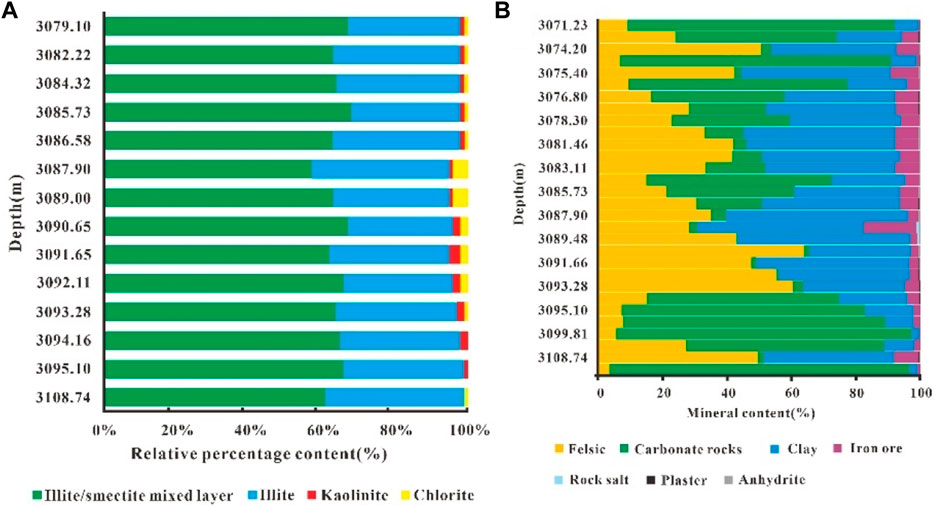
FIGURE 2. (A) Mineral content distribution in the study area. (B) Distribution of clay minerals in the study area.
3.3 Improved △logR method based on borehole correction and natural gamma spectroscopy logging
The △logR method has good application effect in North American marine shale reservoirs (Fertl and Chilngar, 1988). However, for the shale gas reservoirs in the study area, the phenomenon of well diameter expansion and low resistivity generally occurs in the source rock interval, and the amplitude difference between the resistivity and the acoustic transit time curve sometimes cannot reflect the real total organic carbon mass fraction. The study area has a complex geological background and strong heterogeneity, and has a high degree of maturity. The degree of conversion of organic matter to hydrocarbons is different, which has a great influence on the value of the conversion coefficient of acoustic transit time. Therefore, this paper proposes an improved △logR method based on caliper correction and natural gamma spectroscopy to calculate TOC content.
1) Borehole correction
By calculating the relationship between the borehole expansion value and the logging response value, the influence degree of the borehole expansion on each logging response parameter is determined, and the correction amount is determined.
Borehole correction formula:
In the formula,
Correct the acoustic logging curve of the expanding section. First, a linear formula is fitted between the acoustic logging value and the difference in borehole diameter (CAL-BITS), and the intercept is the acoustic value ACC without diameter expansion (Figure 3A). Second, use the unexpanded acoustic log value minus the original acoustic log value. Finally, by fitting with the diameter expansion ratio (that is, the percentage of the difference between the well diameter and the diameter of the drill bit), the calculation formula of the diameter expansion correction amount of the acoustic logging can be obtained (Figure 3B).
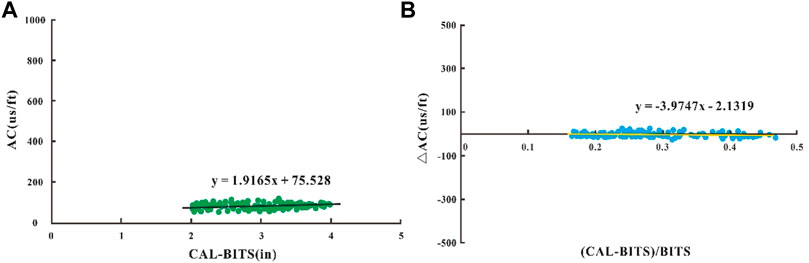
FIGURE 3. (A) Correlation of sonic log values with borehole diameter difference (CAL-BITS). (B) Correlation of unexpanded sonic value minus original sonic value and expansion ratio (percentage of hole diameter difference to bit diameter).
According to the query data, the diameter of the drill bit in Well A1 is 8.5 (in).
After screening, the acoustic logging value is divided into 3 types according to the size of the expansion value:1–2(in), 2–4(in), greater than 4(in). Calculate the diameter expansion range of 3 acoustic loggings in turn.
2) Natural gamma spectroscopy logging
Well A logging shows that the total formation natural radioactive intensity (GRSL) gradually increases from top to bottom (Figure 4). Comparing the GRSL curve with the uranium-free gamma, uranium, thorium, and potassium curves, it is found that the high GRSL is caused by the enrichment of uranium. The GRSL and uranium curve shapes are very similar. Both U/K and Th/U are affected by the content of uranium, clay and quartz to varying degrees. While uranium enrichment and mineral composition have the least effect on Th/K. According to the GRSL value, the reservoir 3073.8–3110 m is divided into 4 parts. 3073.8–3080m, U gradually increased and then stabilized, with an average of 4.63ppm. The clay content averaged 34.96% and the quartz content averaged 35.21%. GRSL gradually increased, with an average of 75.18API. 3080–3086m, U increased with an average of 5.04ppm. The clay content averaged 26.69% and the quartz content averaged 25.24%. GRSL changed significantly, and thorium and potassium decreased slightly. 3086–3093m, U first increases and then decreases. The clay content averaged 37.62% and the quartz content averaged 39.55%. GRSL increased. 3093–3100m, U first increases and then decreases. The clay content averaged 15.90% and the quartz content averaged 18.80%. GRSL gradually decreased.
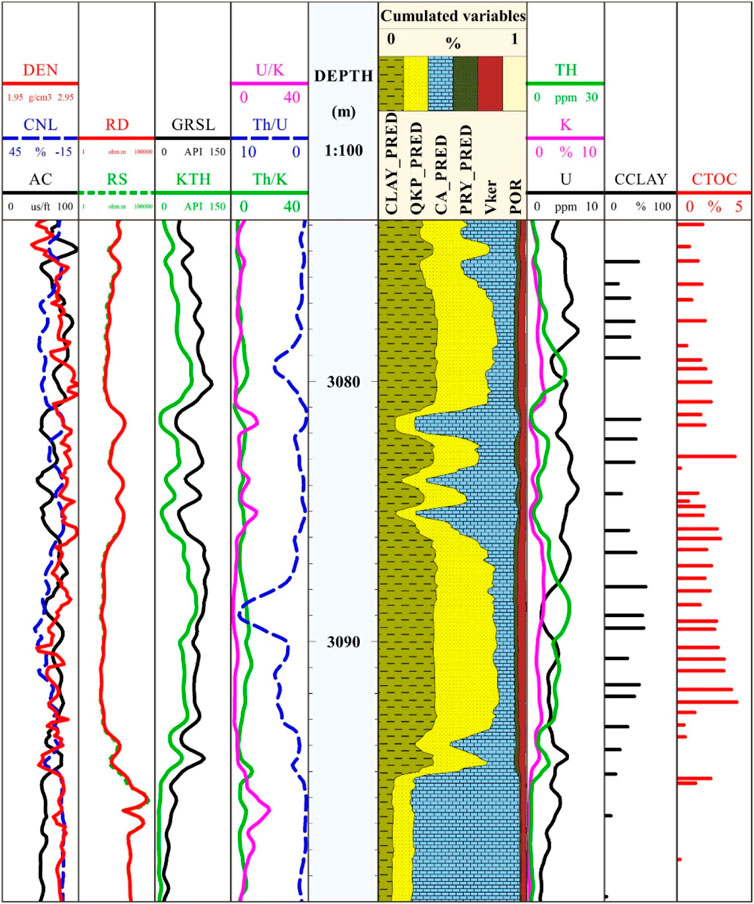
FIGURE 4. Radioactive logging curve of well A.
The clay content in the study area is high. Generally, clay minerals contain large amounts of thorium and kalium. Uranium content is relatively low. At the same time, the reservoir heterogeneity in the study area is strong, and there is no obvious correlation between TOC and U. Th is a chemically stable element among radioactive elements in nature, and is generally not affected by post-diagenetic transformation and geochemical effects (Tribovillard et al., 2006; Wu et al., 2021). Th/K value instead of U concentration can eliminate the influence of other conditions to a certain extent, thereby improving the relationship with organic carbon content (Yan et al., 2002; Korun et al., 2013). According to the measured TOC, the multivariate fitting relationship between C△log R and TH/K was established.
3.4 Improved herron porosity calculation method based on calcium correction
Affected by carbonate rocks, the calcium content increases, which generally shows a relatively high resistivity log value on the logging curve. The density log value becomes relatively high. The resistivity and density log values increase with increasing reservoir calcium content. Therefore, the density and resistivity log curves were used to establish the calculation model of calcium content.
1) Establishment of calcium content calculation model
The mass content of clay, pyrite, siliceous and calcareous in whole rock X-ray diffraction data was converted into volume content.
In the formula,
Organic matter (
Mathematical model was established using the converted calcium content, density and resistivity. Select the ratio of deep lateral resistivity and density to the ratio of calcium content and porosity to establish a cross plot, and obtain the calculation model of calcium content (Figure 5).
2) Linear equations were established for the corrected calcareous and clay, siliceous, pyrite and skeletal densities.
3) The rock is equivalent to two parts, skeleton and pores, and the apparent density porosity is established.
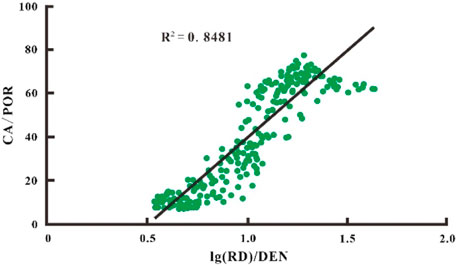
FIGURE 5. Log(RD)/DEN and Ca/POR cross plot.
In the formula,
3.5 P/S time difference ratio—density neutron log overlap difference calculation saturation
Xie et al. (2003) study the relationship between residual oil saturation and acoustic elastic parameters. Shi et al. (2022) studied the relationship between gas saturation and dipole array acoustic wave parameters. The P/S time difference ratio (RMSC) decreases when the reservoir contains gas, and it decreases significantly with the increase of gas saturation. There is a good correlation between the core analysis saturation and the P/S time difference ratio. A method is established to combine the ratio of the P/S time difference ratio and the overlap difference value of the density neutron log. The formula is:
In the formula,
Establish the correlation between
In the formula,
3.6 Gas content calculation based on organic matter correction
The shale adsorbed gas content will vary with the depth of the well and the total organic carbon content (Ross and Bustin, 2008; Alexander et al., 2011). Generally, the adsorbed gas content accounts for 20%–80% of the total gas content. Cluff and Miller (2010) believe that the shale pressure in the shallow layer has a greater impact on the adsorbed gas content, and the temperature of the deep shale has a greater impact on the adsorbed gas content. The adsorption isotherm is obtained by experimental means using a specific sample at a certain temperature. Therefore, for shale of different depths, the total organic carbon and temperature must be corrected to obtain the isothermal adsorption parameters when calculating the adsorbed gas content from logging.
Schlumberger (Lewis et al., 2004) established an empirical method for the calculation of isotherm adsorption parameters based on a large number of North American gas-bearing shale adsorption isotherms. First, through a large number of isotherm adsorption lines, it is obtained that the Langmuir volume, pressure and temperature difference (The difference between the temperature of the isothermal adsorption experiment and the temperature of shale at different depths) are approximately exponentially related. The Langmuir volume is linearly related to the total organic carbon content. According to these two relationships, the temperature and total organic carbon content of the adsorption isotherm are corrected to obtain the isothermic adsorption parameters of shale with different depths and properties. Temperature correction method:
In the formula,
Wu et al. (2011) believed that the Langmuir adsorbed gas volume and TOC had a good correlation. When the Langmuir isotherm is applied to the logging evaluation of adsorbed gas reservoirs, in order to avoid errors caused by the large difference between the
TOC Correction Formula:
In the formula,
After the Langmuir parameters are corrected for temperature and total organic carbon content, the Langmuir equation is used to calculate the adsorbed gas content:
In the formula,
The total gas content is calculated using the method of adsorbed gas plus free gas.
The adsorption gas content was calculated using the organic carbon linear model. Use the organic matter-corrected saturated adsorbed gas content data and TOC to establish a calculation formula:
In the formula,
The free gas content is related to the total porosity (
In the formula,
According to the occurrence state of shale gas, the total gas content of shale gas is the sum of free gas content and adsorbed gas content:
In the formula,
4 Results
4.1 Low resistance causes
Clay Minerals. The clay X-ray diffraction data show (Figure 2A) that the clay minerals are mainly illite/smectite mixed layer, illite, chlorite and kaolinite. These minerals are common in fine-grained sedimentary rocks (Abedini and Calagri, 2012; Abedini, 2017; Abedini and Calgari, 2017). When the clay content in the study area increases, the resistivity decreases significantly. Among them, illite/smectite mixed layer and illite are the main minerals, with an average content of 64.0% and 33.1%, respectively. Chlorite and kaolinite are minor minerals, with an average content of 1.5% and 1.4%, respectively. Taking the Luzhai Formation shale reservoir as an example, at 3093–3107 m, the clay content is relatively low, the average content is 13.56%, and the average resistivity is 4329 Ω m. However, at 3086–3093 m, the clay content increased, the average content is 37.52%, and the average resistivity was 41 Ω m. The content of illite/smectite mixed layer will increase with the increase of burial depth, temperature and pressure, and has strong water sensitivity (Barrenechea et al., 1992; Merriman, 2002). Montmorillonite and illite have microporous structures and large specific surface areas, which have a significant impact on the distribution of water in shale. The water absorption capacity of illite is between montmorillonite and kaolinite, and its hydrophilicity is second only to montmorillonite. The increase of clay minerals will lead to the increase of shale micropores, which will increase the irreducible water saturation, enhance the electrical conductivity, and decrease the resistivity (Zhang et al., 2011; Sima et al., 2017).
Organic matter is overripe. The correlation between the logging resistivity and TOC and Ro of Well A1 was compared and analyzed (Figure 6). The results show that the resistivity is negatively correlated with TOC. The higher the Ro, the more obvious the low resistivity phenomenon. When the TOC is low, the shale resistivity is high and the resistivity variation range corresponding to the similar TOC is large. However, when the TOC increased to about 2.0%, the resistivity rapidly decreased to below 60 Ω m, and gradually approached or fell below 40 Ω m. The resistivity corresponding to the similar TOC changed in a small range and gradually became stable. Current core data indicate that the higher the Ro of the shale, the stronger the conductivity per unit of organic matter.
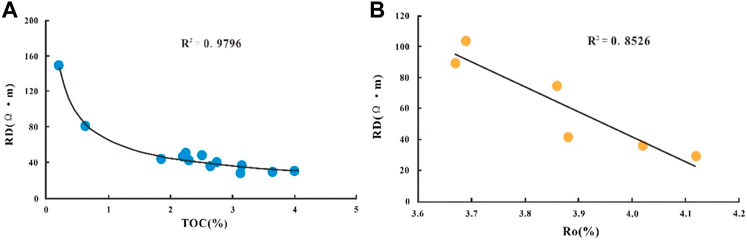
FIGURE 6. (A) TOC and resistivity correlation. (B) Vitrinite reflectance (Ro) and resistivity correlation.
Pore Structure. The dark gray shale at a depth of 3087.9 m in the Luzhai Formation has a measured resistivity of 46 Ω m, and the organic matter is mainly distributed in clasts form. Shale thin section data show that there are a lot of illite/smectite mixed layer and illite (Figures 7A,B), and a small amount of pyrite. Microfracture are well developed at the edge of mineral particles, microfracture are developed between clay mineral layers, and the clays are filled with organic matter. This provides the basis for the conductivity of the clay layer. The vitrinite reflectance of the core is Ro=3.86%, and the organic matter maturity is relatively high, indicating that the organic matter has been partially graphitized (Mastalerz et al., 2013; Wang et al., 2018).
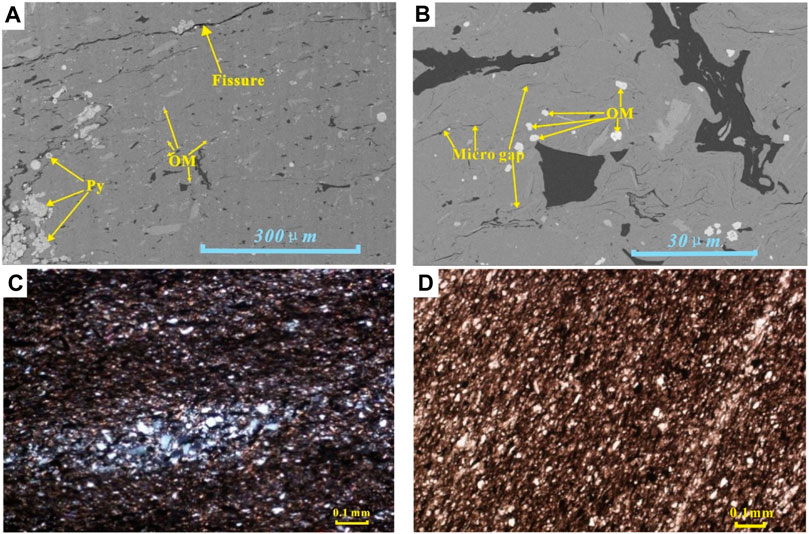
FIGURE 7. (A) Sample A1-1–1. The organic matter is mainly distributed in the form of clasts, with developed fissure, and there are many pyrites in the local area. (B) Sample A1-1–2. The microfracture between the clays are well developed, and a small amount of organic matter is filled between the clays. (C) Sample A1-2–1. The banded are rich in laminae, which are quartz, feldspar, and a small amount of muscovite. Pyrite is granular, with tiny spots or agglomerate distribution. (D) Sample A1-2–2. It is composed of fine scaly hydromica mixed with cryptocrystalline clay minerals and amorphous carbonaceous. The hydromica is oriented along the long axis. The organic matter is slightly parallel band-like, and is mixed with clay enrichment, forming a laminae structure.
Geological reasons. Chlorite film cementation. Chlorite is widely distributed in the Luzhai Formation. Whole rock X-ray diffraction data show (Figure 2B) that the chlorite content is between 1% and 4%, with an average of 1.75%. Chlorite is mainly distributed in flakes. Further analysis of the correlation between the mass content of chlorite and the breakthrough pressure in clay minerals found that the mass content of chlorite was negatively correlated with the breakthrough pressure. As the chlorite content increased, the breakthrough pressure showed a decreasing trend (Durand et al., 2001; Wang et al., 2017). bound water. At the same time, the micropore connectivity of the Luzhai Formation in the study area is relatively good, and the reservoir can form a better conductive network, resulting in a decrease in resistivity.
Rock salt. The Luzhai Formation contains rock salt locally (Figure 2B). The rock salt act as catalysts for the dissolution of calcite, and the ionic strength of the solution increases with the increase of the NaCl concentration in the fusion state. Inhibits the activity coefficient and activity of calcite in solution, which increases the solubility of calcite mineral components and complicates the pore structure. On the other hand, the existence of calcite denudation pores leads to the increase of water content in the pores, which strengthens the conductivity of the solution and reduces the resistivity.
Contains laminae of organic matter. From shallow to deep, the content of clay minerals gradually increases, the TOC value gradually increases, but the porosity value remains basically unchanged. The type of laminae changes regularly in the longitudinal direction. At 3074.2m, clay minerals and carbonaceous account for 50%. At 3075.4m, clay minerals and carbonaceous account for 72%; At 3087.1m, clay minerals and carbonaceous account for 85%; At 3087.48m, clay minerals and carbonaceous account for 86%。Laminae development in many cases represents the periodic turbulent changes in deposition rate and hydrodynamic conditions, and the water environment is unstable. The changes in the redox environment and deposition rate of the water during the deposition period are not conducive to the enrichment and preservation of organic matter (Lazar et al., 2015; Shi et al., 2018). The strong development of shale laminae reflects the frequent changes in hydrodynamics during the depositional period, which is not conducive to the preservation of organic matter, and will affect the development of shale pores, especially the development of organic matter pores. Argon ion scanning electron microscope observation (Figure 7C, D):In the laminae-developed section, the shale has an enhanced degree of development of inorganic pores, and the organic matter is mainly distributed in clastic form. Well-developed microfracture at the edge of mineral grains. Microfissures are developed between clay mineral layers, the development of organic pores is significantly weakened, and pores in organic matter are not developed.
4.2 TOC calculation
Use the method mentioned in step 1) of Section 3.3. The correction formulas of acoustic waves under different expansion ranges are obtained, and these abnormal values are corrected. Acoustic correction formulas for different diameter expansion ranges in the study area:
The expansion range is 1–2(in):
The expansion range is 2–4(in):
The expansion range is greater than 4(in):
By calculation, the correction value of the acoustic wave in the study area is determined. The correction effect of well A1 is shown in the figure (Figure 8A). At the same time, in order to verify the universality of the method, well B1 was also corrected using the above formula, and a good correction effect was also obtained (Figure 8B).
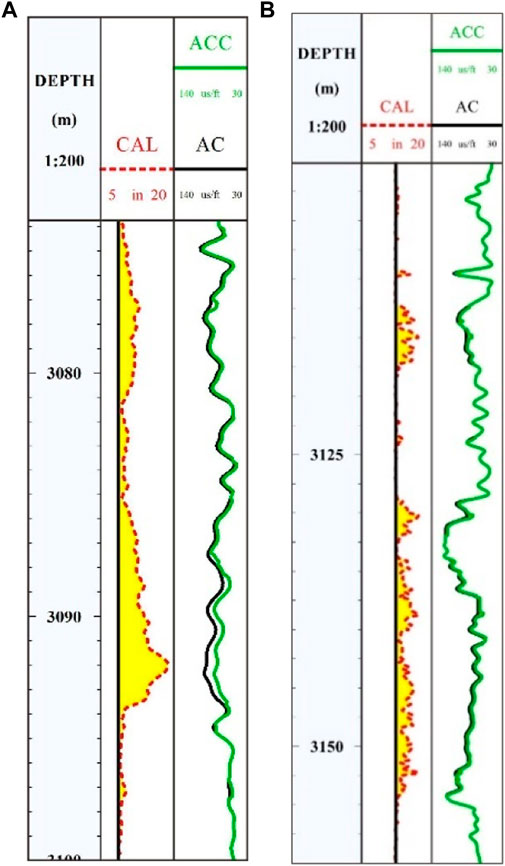
FIGURE 8. (A) Effect diagram of expansion correction of Well A1. (B) Effect diagram of expansion correction of Well B1.
Using the method mentioned in step 2) of Section 3.3, calculate the C△logR result:
Using the method mentioned in step 3) of Section 3.3, calculate the TOC result (Figure 9):
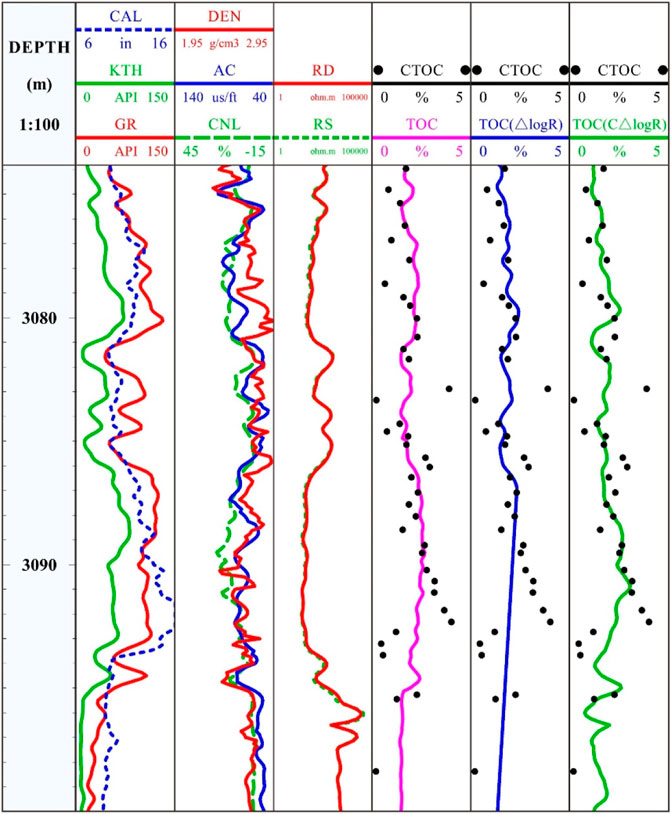
FIGURE 9. TOC calculation results of well A1.
The TOC in Figure 9 is the calculation result of the multivariate fitting data. TOC(△logR)is the calculated result using the original △logR method. TOC(C△logR) is an improved △log R(C△logR) calculation result based on expansion correction and natural gamma spectroscopy logging.
4.3 Porosity calculation
Using the method mentioned in Section 3.4, the calculation model for calcium content is:
In the formula,
The corrected calcium content was brought into the skeletal density formula based on the core analysis of the study area.
In the formula,
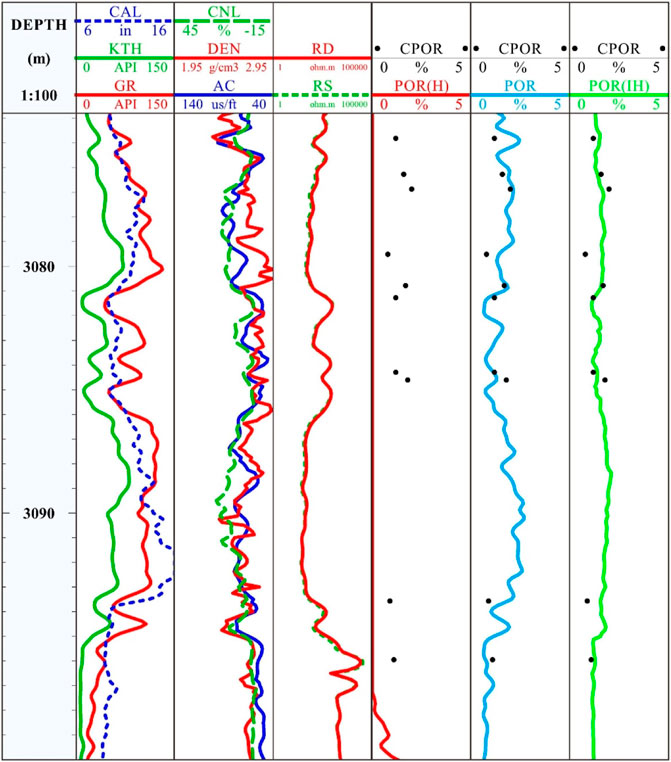
FIGURE 10. Calculation result of porosity in Well A1.
4.4 Saturation calculation
Using the saturation calculation method mentioned in Section 3.5, the calculation result is shown in Figure 11. SW-Archie is the saturation calculated using the original Archie formula. SW-MR is the saturation calculated using multiple regression. SW-Edn is the saturation calculated using the neutron and density log overlap difference method. SW-CEdn is the saturation calculated using P/S Time difference ratio - density neutron log overlap difference calculation saturation.

FIGURE 11. Calculation results of saturation in Well A1.
4.5 Total gas content
1) gas-bearing reservoir
The shale of the Luzhai Formation has high clay content, high thermal evolution degree, low TOC content and poor reservoir physical properties. The TOC content of the core is between 0.36% and 3.38%, with an average of 1.68%. The organic matter components are mainly vitrinite and exinite, which account for more than 90%. Mainly type III kerogen. The high thermal evolution has entered the over-mature stage, and the Ro is 3.64%-4.12%. XRD analysis results show that the mineral components of the Luzhai Formation shale are mainly clay and quartz minerals, with less content of calcite, feldspar and pyrite. The clay content ranges from 2.5% to 56.5%, with an average of 33.6%. The quartz content is between 5.8% and 63.1%, with an average of 30.2%.
The porosity and permeability of the Luzhai Formation shale are relatively low. The measured porosity of the core is between 0.5% and 2.2%, with an average of 1.24%. The permeability measured by the core is in the range of 0.0008–15.5mD, with an average of 1.21mD. Scanning electron microscope observed that pores in shale organic matter were hardly developed. Well-developed microfractures in the interior and edges of organic matter. The microfractures on the edge of mineral particles in the inorganic pores are well developed. In addition, cotton wool-like microscopic pores and strawberry-like pyrite were also observed.
2) Gas content determined by isothermal adsorption experiments
Isotherm adsorption experiments are commonly used to evaluate the adsorbed gas content of shale (Sima et al., 2007). Experimental results show that: The Langmuir volume of the five shale samples in Well A1 is between 1.13% and 2.11 m3/t, with an average of 1.59 m3/t. The adsorption capacity is general.
3) Calculate gas content
Using the method in Section 3.6, the results of gas content in the Luzhai Formation were obtained (Figure 12). The content of adsorbed gas is 0.81–2.53 m3/t, with an average value of 1.85 m3/t. The free gas content ranges from 0.69 to 1.48 m3/t, with an average value of 1.10 m3/t. The total gas content ranges from 2.15 to 3.62 m3/t, with an average value of 2.95 m3/t.
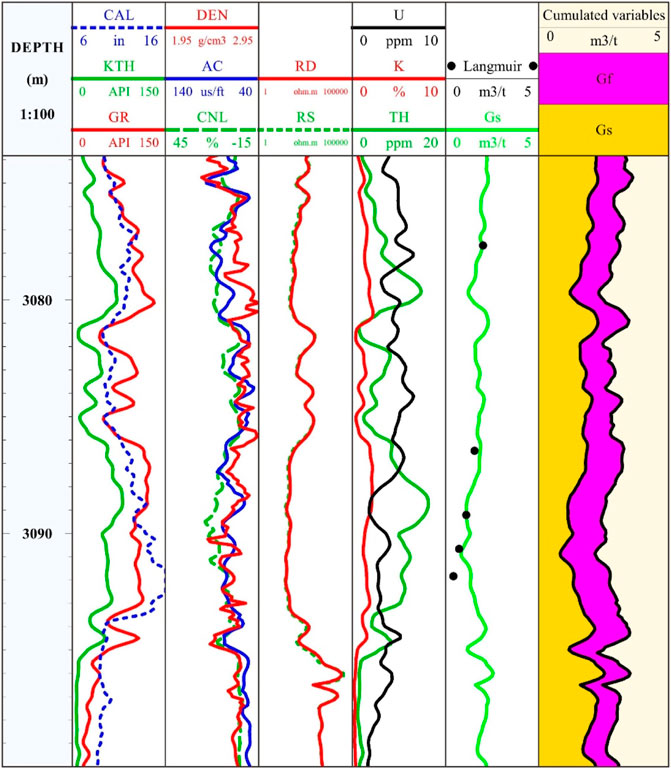
FIGURE 12. Calculation result of total gas content in Well A1.
5 Discussion
5.1 The effect of minerals on gas content
The gas content is positively correlated with both quartz (Figure 13C) and clay (Figure 13B), and the correlation is more pronounced with quartz, with an R2 of about 0.55. The reason is that the change of quartz content in marine shale is generally synchronized with the change of TOC content (Figure 13A). The formation environment of marine biogenic quartz is also suitable for the enrichment of organic matter. The development of biogenic quartz implies the prosperity of biological activities and provides the material basis for the enrichment of organic matter. The gas storage space in shale mainly comes from quartz organic matter (Milliken et al., 2016; Dowey and Taylor, 2017).
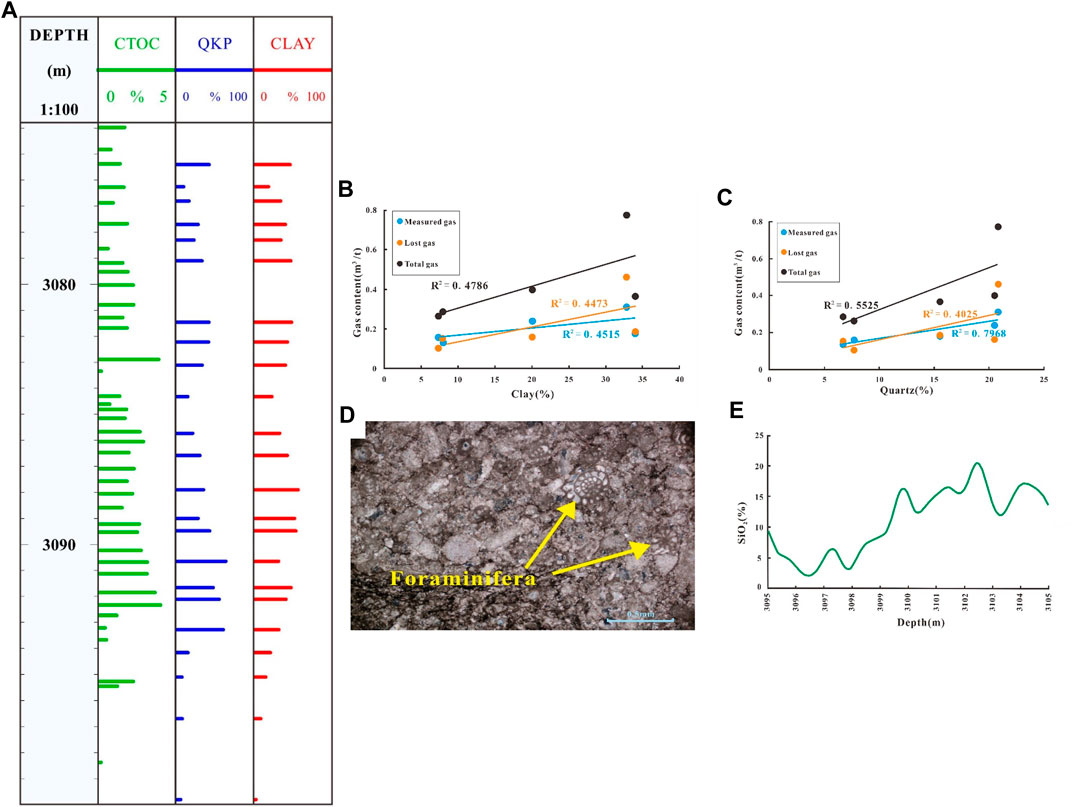
FIGURE 13. (A) Quartz, clay and TOC contents of the Luzhai Formation in the study area. (B) Correlation between clay content and gas content in Well A1 in the study area. (C) Correlation between quartz content and gas content in Well A1 in the study area. (D) Sample A1-3-1. The grained clasts varies from 0.1-2mm. Mainly bioclasts, such as algae, foraminifera, brachiopods, echinoderms, etc., with strong crystallization and residual shape. The crystal powder dolomite is locally distributed with carbonaceous bands. (E) SiO2 content varies with depth.
The correlation between clay content and total gas content of shale is slightly weaker. The reason is that the depth range where the data of total gas content and clay content of shale belong topelagic deposits. Pelagic deposit sediments are mainly composed of ooze and clay. The main basis for the classification of ooze and clay is the genesis and the content of biological residues and material components. The volume content of biological components in clay is less than 30%, and the volume content of biological components in ooze is more than 30% (Macquaker et al., 2003; Liu et al., 2014). In the thin-section identification data of Well A1 (Figure 13D), most of the structural components (44/77) of the detected samples were composed of microbial remains (more than 30%), among which the main foraminifera (23/44). In addition, there are fragments of coccolithophores, radiolarian shells, diatoms, etc. It is preliminarily inferred that the sediments in the study area have a certain content of Coccidioides ooze. Coccidioides ooze belongs to the marl ooze. The siliceous content increases with depth (Figure 13E), and carbonate dissolution increases, causing their content to decrease, gradually and be replaced by more and more siliceous ooze (mainly composed of SiO2).
5.2 Application of natural gamma spectrum logging
Quickly identify low resistivity reservoirs. Montmorillonite has a strong cation exchange capacity and will form a conductive network on the rock matrix. Illite and illite/smectite mixed layer have super strong ability to adsorb formation water and coexist with them, thus changing the occurrence state of formation water in pores. Water molecules are wrapped around the particles, forming a perfect clay-water film conductive network, which improves the conductivity of the reservoir (additional conductivity), resulting in an increase in the saturation of bound water in the pores (Liu et al., 2006; Cui et al., 2022). High bound water saturation is caused by factors such as fine rock particles and large specific surface area. The bound water saturation of the core increases as the rock particles become finer. Thorium content is relatively high in the shale in the study area. More than 90% of thorium in sediments is adsorbed by clay particles, and less than 10% of thorium is mixed in saline minerals. The presence of SiO2 has no significant effect on Th (Ye et al., 2014). The correlation analysis between the thorium content and the porosity, saturation and TOC in the study area was carried out, and the correlations were as high as 0.93, 0.83, and 0.98, respectively. Kalium content is closely related to clay (Merriman, 2002; Zheng et al., 2017). If the Th/K is between 3.5 and 12.0 and the kalium value is less than 2.0, it is montmorillonite, if it is between 3.5 and 12.0 and the kalium value is greater than 2.0, it is illite/smectite mixed layer, and if it is between 2.0 and 3.5, it is illite. Based on this, we can use Th/K to distinguish the content of clay minerals and the represented rock particle size, so as to quickly judge low-resistance reservoirs. According to the data of clay mineral content in the study area, when Th/K is between 4.0 and 12.0, and 1.5<K<2.2, the reservoir shows low resistance (Figure 14).
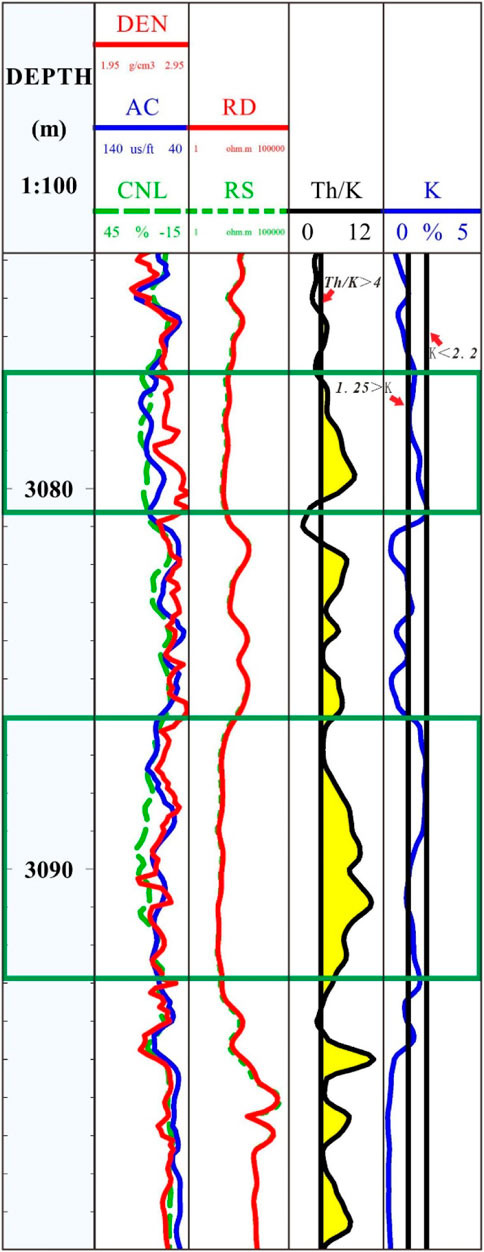
FIGURE 14. Rapid identification of low resistivity reservoirs.
The disadvantage of the quick identification method is that if the clay type is mainly montmorillonite, it will expand when it encounters water during the drilling process, and it is easy to cause serious collapse of the borehole. This will cause the distortion of the logging curve, which will affect the identification of oil and water layers and the calculation of reservoir parameters. The intrinsic relationship between low resistance and gas content of shale.
The limit value of Ro corresponding to the extremely low resistivity response is 3.5%, the hydrocarbon generation capacity is depleted, the organic matter pores and specific surface area are also greatly reduced, the adsorption performance is reduced, and the gas-bearing property is sharply reduced. Therefore, the extremely low resistivity response indicates that the shale organic matter has “graphitized”, indicating that the shale reservoir is likely to have suffered considerable damage, and there is a great risk in shale gas exploration in related areas. By quickly identifying low-resistivity reservoirs, the range of extremely low resistivity can be delineated, high-risk areas of “organic graphitization” can be excluded, and areas with high resistivity can be selected as favorable target areas for shale gas exploration. At the same time, rapid identification of low-resistance reservoirs, timely use of improved calculation methods, and elimination of errors caused by low-resistance can make parameter calculation more accurate.
5.3 Relationship between TOC and adsorbed gas
There is a negative correlation between TOC and isotherm adsorption gas content in the study area, which may be due to the fact that organic carbon contains more ineffective carbon. Organic carbon includes effective carbon and ineffective carbon. Organic carbon is the carbon element related to organic matter in sedimentary rocks, and it is the material basis for generating oil and gas from source rocks (Dembicki, 2009; Georg et al., 2020). Available carbon refers to the carbon that can be converted into oil and gas and discharged from source rocks under the action of sufficient temperature and time. Ineffective carbon, also called “dead carbon”, does not participate in hydrocarbon generation reactions during the thermal evolution of source rocks and cannot be converted into hydrocarbons (Peters, 1986). The organic carbon content measured by the current experiment is actually the residual organic carbon content. Based on the rock pyrolysis data, a histogram of pyrolysis organic carbon and available carbon was established (Figure 15). The Ro of Well A1 in the study area is 3.64–4.12%, and most of them are type III kerogens, which belong to overmature source rocks The overall organic carbon content is low, and the proportion of effective carbon is very small. The extremely high ineffective carbon content indicates that the residual organic carbon of the overmature source rocks is almost all “dead carbon” that cannot be pyrolyzed, and the adsorption capacity decreases sharply, which is inversely proportional to the isothermal adsorption gas.
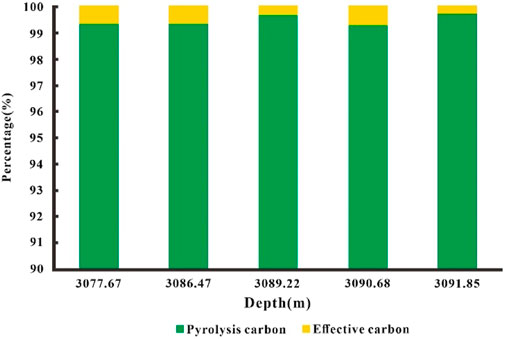
FIGURE 15. The ratio of effective carbon and residual carbon.
6 Conclusion
1) There are three main types of low resistance in the study area. The first is minerals. Clay minerals lead to an increase in shale micropores and an increase in bound water saturation. Next is organic matter, where high maturity results in lowering the minimum TOC threshold needed to achieve very low resistivity. In addition, pore-filled organic matter provides the basis for electrical conduction. Lastly is geology. Chlorite film cementation, calcite porous cementation, the presence of halite and organic laminae.
2) The borehole correction method based on the classification of the expansion correction value fully considers the problem of the large diameter expansion of the A1 well. The new method only needs to classify the logging values according to the expansion amplitude, and then it can be corrected according to the corresponding formula. Moreover, this method is also applicable to other wells, which improves the accuracy and applicability of the correction and shortens the calculation time. The △logR method based on natural gamma spectroscopy logging makes up for the lack of obvious correlation between TOC and uranium content. The HERRON porosity calculation model based on calcium correction fully takes into account the geological conditions with high carbonate content in Well A1. The method of calculating saturation by using the P/S Time difference ratio-density neutron log overlap difference avoids the influence of low resistance.
3) The Lower Carboniferous Luzhai Formation shale in central Guangxi is characterized by high clay and quartz content, high thermal evolution, and low porosity and permeability. It is calculated that the adsorbed gas content of the Luzhai Formation shale is between 0.81 and 2.53 m³/t, the free gas content is between 0.69 and 1.48 m³/t, and the total gas content is between 2.15 and 3.62 m³/t. The adsorption capacity of the reservoir is average, mainly due to the high content of ineffective carbon and over-mature organic matter. The vertical distribution of gas content is also affected by TOC and quartz content (Sima et al., 2007).
Data availability statement
The original contributions presented in the study are included in the article/Supplementary Material, further inquiries can be directed to the corresponding author.
Author contributions
ML contributed to editing, data analysis, data curation, graphing, and writing-original draft. CZ contributed to the review and editing.
Funding
This project was funded by the Ministry of Education's Key Laboratory of Oil and Gas Resources and Exploration Technology (Yangtze University) Open Fund Project (K2021-08); National Science and Technology Major Project (2016ZX05038-006); Open Fund of the Key Laboratory of Oil and Gas Resources and Exploration Technology of the Ministry of Education (Yangtze University) (K2021-03).
Acknowledgments
The author expresses his sincere thanks to the editor. Thanks to the editors for their enthusiasm, patience and tireless efforts. The authors thank the reviewers for their constructive suggestions on how to improve the paper.
Conflict of interest
The authors declare that the research was conducted in the absence of any commercial or financial relationships that could be construed as a potential conflict of interest.
Publisher’s note
All claims expressed in this article are solely those of the authors and do not necessarily represent those of their affiliated organizations, or those of the publisher, the editors and the reviewers. Any product that may be evaluated in this article, or claim that may be made by its manufacturer, is not guaranteed or endorsed by the publisher.
References
Abedini, A., and Calagri, A. A. (2017). Geochemistry of claystones of the ruteh formation, NW Iran: Implications for provenance, source-area weathering, and paleo-redox conditions. Neues. Jahrb. Min. Abh. 194, 107–123. doi:10.1127/njma/2017/0040
Abedini, A., and Calagri, A. A. (2012). The mineralogy and geochemistry of permian lateritic ores in east of shahindezh, west-azarbaidjan province. J. Cryst. Min. 20 (3), 59–72.
Abedini, A. (2017). Mineralogy and geochemistry of the hizeh-jan kaolin deposit, northwest of varzaghan, east-azarbaidjan province, NW Iran. Iran. J. Cryst. Min. 24 (4), 647–660.
Alexander, T., Baihly, J., and Boyer, C. (2011). Shale gas revolution. Oil. Rev. Aut. 23 (3), 40–45.
Archie, G. E. (1942). The electrical resistivity log as an aid in determining some reservoir characteristics. Trans. AIME 146 (1), 54–62. doi:10.2118/942054-G
Ayadiuno, C. B., Khan, S., Alabbad, A. A., and AlMohsen, F. (2017). “Investigating low resistivity-low contrast resistivity pay in a permo-carboniferous reservoir, central Saudi Arabia,” in Proceeding of the Abu Dhabi International Petroleum Exhibition & Conference, Abu Dhabi, UAE, November 2017 (Dallas, TX: SPE. 188887-MS). doi:10.2118/188887-MS
Baneshi, M., Behzadijo, M., Rostami, M., Schaffie, M., and Nezamabadi-pour, H. (2015). Using well logs to predict a multimin porosity model by optimized spread RBF networks. Energy Sources Part A Recovery Util. Environ. Eff. 37 (22), 2443–2450. doi:10.1080/15567036.2011.628362
Barrenechea, J. F., Rodas, M., and Arche, A. (1992). Relation between graphitization of organic matter and clay mineralogy, Silurian black shales in Central Spain. Mineral. Mag. 56, 477–485. doi:10.1180/minmag.1992.056.385.04
Cluff, B., and Miller, M. (2010). “Log evaluation of gas shale: A 35-year perspective,” in SPWLA 52nd annual logging symposium (Denver: DWLS Luncheon).
Cui, R. K., Sun, J. M., and Liu, X. J. (2022). Major controlling factors of low-resistance shale gas reservoirs. Geophys. Geochem. Explor. 46 (1), 150–159. doi:10.11720/wtyht.2022.1123
Curtis, J. B. (2002). Fractured shale gas systems. AAPG. Am. Assoc. Pet. Geol.) Bull. 86 (11), 1921–1938. doi:10.1306/61EEDDBE-173E-11D7-8645000102C1865D
Dembicki, H. (2009). Three common source rock evaluation errors made by geologists during prospect or play appraisals. Am. Assoc. Pet. Geol. Bull. 93 (63), 341–356. doi:10.1306/10230808076
Dowey, P. J., and Taylor, K. G. (2017). Extensive authigenic quartz overgrowths in the gas-bearing Haynesville-Bossier Shale, USA. Sediment. Geol. 356, 15–25. doi:10.1016/j.sedgeo.2017.05.001
Durand, C., Brosse, E., and Cerepi, A. (2001). Effect of pore-lining chlorite on petrophysical properties of low-resistivity sandstone reservoirs. Spe. Reserv. Eval. Eng. 4 (3), 231–239. doi:10.2118/72179-PA
Fertl, W. H., and Chilingar, G. V. (1988). Total organic carbon content determined from well logs. Spe. Form. 3 (02), 407–419. doi:10.2118/15612-PA
Ge, X., Fan, Y., Cao, Y., Li, J., Cai, J., Liu, J., et al. (2016). Investigation of organic related pores in unconventional reservoir and its quantitative evaluation. Energy fuels. 30 (6), 4699–4709. doi:10.1021/acs.energyfuels.6b00590
Georg, S., Philipp, W., and Martin, B. (2020). Geochemical implications from direct rock-eval pyrolysis of Petroleum. Org. Geochem. 146, 104051–104111. doi:10.1016/j.orggeochem.2020.104051
Ghazy, M., Harby, K., Askalany, A., and Saha, B. (2016). Adsorption isotherms and kinetics of activated carbon/difluoroethane adsorption pair: Theory and experiments. Int. J. Refrig. 70, 196–205. doi:10.1016/j.ijrefrig.2016.01.012
Guo, S., and Peng, Y. (2019). Determination method of shale gas content: A case study in the ordos basin, China. J. Pet. Sci. Eng. 173, 95–100. doi:10.1016/j.petrol.2018.10.013
Jarvie, D. M., Hill, R. J., and Pollastro, R. M. (2005). Asscssment of the gas potential and yields from shales; the barnett shale model. Okla. Geol. Surv. Circ. 110, 9–10.
Jiang, R. Z., Qiao, X., and He, J. X. (2016). A new method to calculate shale gas geological reserves. Nat. Gas. Geosci. 27 (4), 699–705. doi:10.11764/j.issn.1672-1926.2016.04.0699
Kadkhodaie, A., and Rezaee, R. (2016). A new correlation for water saturation calculation in gas shale reservoirs based on compensation of kerogen-clay conductivity. J. Pet. Sci. Eng. 146, 932–939. doi:10.1016/j.petrol.2016.08.004
Kethireddy, N., Chen, H., and Heidari, Z. (2014). Quantifying the effect of kerogen on resistivity measurements in organic-rich mud rocks. Petrophys 55 (2), 136–146. doi:10.13175/swjpcc143-14
Kim, G., Lee, H., Chen, Z., Athichanagorn, S., and Shin, H. (2019). Effect of reservoir characteristics on the productivity and production forecasting of the montney shale gas in Canada. J. Pet. Sci. Eng. 182, 106276–106316. doi:10.1016/j.petrol.2019.106276
Kinley, T. J., Cook, L. W., Breyer, J. A., Jarvie, D. M., and Busbey, A. B. (2008). Hydrocarbon potential of the barnett shale (mississippian), Delaware basin, west Texas and southeastern new Mexico. Am. Assoc. Pet. Geol. Bull. 92 (8), 967–991. doi:10.1306/03240807121
Korun, M., Vodenikb, B., and Zorko, B. (2013). Evaluation of gamma-ray spectrometric results near the decision threshold. Appl. Radiat. Isot. 73, 1–8. doi:10.1016/j.apradiso.2012.11.005
Lazar, O. R., Bohacs, K. M., Macquaker, J. H. S., Schieber, J., and Demko, T. M. (2015). Capturing key attributes of fine-grained sedimentary rocks in outcrops, cores, and thin sections: Nomenclature and description guidelines. J. Sediment. Res. 85, 230–246. doi:10.2110/jsr.2015.11
Lewis, R., Ingraham, D., and Sawyer, W. (2004). New evaluation techniques for gas shale reservoirs. Houston: Res. Symp. Schlumberger.
Liu, F., Zhou, W., and Li, X. H. (2006). Analysis of characteristics of the clay minerals in the upper paleozoic sandstone reservoir of hangjinqi area in North ordos basin. J. Min. Pet. 26 (103), 92–97. doi:10.19719/j.cnki.1001-6872.2006.01.017
Liu, Q., Yuan, X. J., and Lin, S. H. (2014). The classification and sedimentary environment of lacustrine clay rock of yanchang Formation in ordos basin. Acta. Sediment. Sin. 32 (6), 1016–1025. doi:10.14027/j.cnki.cjxb.2014.06.003
Liu, J., Liu, S., Zhang, F., Su, B., Yang, H., Xu, Y., et al. (2018). A method for evaluating gas saturation with pulsed neutron logging in cased holes. J. Nat. Gas. Sci. Eng. 59, 354–362. doi:10.1016/j.jngse.2018.09.018
Macquaker, J. H. S., Adams, A. E., and Macquaker, J. H. (2003). Maximizing information from fine-grained sedimentary rocks: An inclusive nomenclature for mudstones. J. Sediment. Res. 73 (5), 735–744. doi:10.1306/012203730735
Mastalerz, M., Schimmelmann, A., Drobniak, A., and Chen, Y. (2013). Porosity of devonian and mississippian new albany shale across a maturation gradient: Insights from organic petrology, gas adsorption, and mercury intrusion. Am. Assoc. Pet. Geol. Bull. 97 (10), 1621–1643. doi:10.1306/04011312194
Merriman, R. J. (2002). Contrasting clay mineral assemblages in British lower palaeozoic slate belts: The influence of geotectonic setting. Clay Min. 37 (1), 207–219. doi:10.1180/0009855023720041
Milliken, K. L., Ergene, S. M., and Ozkan, A. (2016). Quartz types, authigenic and detrital, in the upper cretaceous eagle ford formation, South Texas, USA. Sediment. Geol. 339, 273–288. doi:10.1016/j.sedgeo.2016.03.012
Mohaghegh, S. D., Goddard, C., and Popa, A. (2002). “Reservoir characterization through synthetic logs,” in Proceeding of the SPE Eastern Regional Meeting, Morgantown, West Virginia, October 2000. SPE. 65675.
Owusu, E., Tsegab, H., Sum, C., and Padmanabhan, E. (2019). Organic geochemical analyses of the belata black shale, peninsular Malaysia; implications on their shale gas potential. J. Nat. Gas. Sci. Eng. 69, 102945–103013. doi:10.1016/j.jngse.2019.102945
Pandey, L., Sain, K., and Joshi, A. (2019). Estimate of gas hydrate saturations in the krishna-godavari basin, eastern continental margin of India, results of expedition NGHP-02. Mar. Pet. Geol. 108, 581–594. doi:10.1016/j.marpetgeo.2018.12.009
Passey, Q. R., Creaney, S., Kulla, J. B., Moretti, F. J., and Stroud, J. D. (1990). A practical model for organic richness from porosity and resistivity logs. Aapg. Bull. 74 (12), 1777–1794. doi:10.1029/JB095iB13p22073
Peters, K. E. (1986). Guidelines for evaluating Petroleum source rock using programmed pyrolysis. Am. Assoc. Pet. Geol. Bull. 70 (3), 318–329. doi:10.1306/94885688-1704-11D7-8645000102C1865D
Ross, D. J., and Bustin, R. M. (2008). Characterizing the shale gas resource potential of Devonian–Mississippian strata in the Western Canada sedimentary basin: Application of an integrated formation evaluation. Am. Assoc. Pet. Geol. Bull. 92 (1), 87–125. doi:10.1306/09040707048
Shi, Z. H., Qiu, Z., Dong, D. Z., Lu, B., Liang, P., and Zhang, M. (2018). Lamina characteristics of gas-bearing shale fine-grained sediment of the silurian longmaxi formation of well wuxi 2 in sichuan basin, SW China. Petroleum Explor. Dev. 45 (2), 358–368. doi:10.1016/S1876-3804(18)30040-5
Shi, W. R., Zhang, Z. S., and Huang, Z. S. (2022). Study on calculation method of gas saturation in low-resistivity shale gas reservoir: A case study of jiaoshiba block in fuling area. Fault. block. Oil. Gas. Field. 29 (2), 183–188. doi:10.6056/dkyqt202202007
Sima, L. Q., Wu, F., and Lai, W. R. (2007). The causing mechanism of flow-resistivity stratum in xujiahe Formation in guang'an area. NGI 27 (6), 12–14. doi:10.3321/j.issn:1000-0976.2007.06.004
Sima, L. Q., Wang, C., Wu, F., Wang, L., Ma, L., and Wang, Z. J. (2017). Calculation of Mobile Water Water Saturation in Tight Sandstone Reservoirs of Penglaizhen Formation, Western Sichuan Basin. Well. Logging. Techno. 41 (2), 199–204.
Sultan, M., Miyazaki, T., and Koyama, S. (2018). Optimization of adsorption isotherm types for desiccant air-conditioning applications. Renew. Energy 121, 441–450. doi:10.1016/j.renene.2018.01.045
Sun, J., Dong, X., Wang, J., Schmitt, D., Xu, C., Mohammed, T., et al. (2016). Measurement of total porosity for gas shales by gas injection porosimetry (GIP) method. Fuel 186, 694–707. doi:10.1016/j.fuel.2016.09.010
Sun, J. M., Xiong, Z., and Luo, H. (2018). Mechanism analysis and logging evaluation of low resistance in lower paleozoic shale gas reservoirs of yangtze region. J. China. Univ. Pet. 42 (5), 47–56. doi:10.3969/j.issn.1673-5005.2018.05.005
Tan, M., Mao, K., Song, X., Yang, X., and Xu, J. (2015). NMR petrophysical interpretation method of gas shale based on core NMR experiment. J. Pet. Sci. Eng. 136, 100–111. doi:10.1016/j.petrol.2015.11.007
Tribovillard, N., Algeo, T. J., Lyons, T., and Riboulleau, A. (2006). Trace metals as paleoredox and paleoproductivity proxies: An update. Chem. Geol. 232 (1-2), 12–32. doi:10.1016/j.chemgeo.2006.02.012
Wang, F., and Guo, S. (2019). Shale gas content evolution in the ordos basin. Int. J. Coal Geol. 211, 103231–103313. doi:10.1016/j.coal.2019.103231
Wang, W. B., Guo, D. K., and Chen, X. F. (2017). Genesis analysis and identification methods of chang 6-1 low resistivity oil pays in yanchang Formation in wuqi area, ordos basin. Pet. Geol. recov. Effic. 24 (2), 38–45. doi:10.13673/j.cnki.cn37-1359/te.2017.02.006
Wang, P. F., Jiang, Z. X., and Lu, P. (2018). Organic matter pores and evolution characteristics of shales in the lower silurian longmaxi formation and the lower cambrian niutitang Formation in periphery of chongqing. Nat. Gas. Geosci. 29 (7), 997–1008. doi:10.11764/j.issn.1672-1926.2018.06.012
Wu, Q. H., Li, X. B., and Liu, H. L. (2011). Log interpretations and the application of core testing Technology in the shale gas taking the exploration and development of the sichuan basin as an example. Acta. Pet. Sin. 32 (3), 484–487. doi:10.1007/s12182-011-0118-0
Wu, X. G., Miao, X. X., Wang, Z. W., and Kang, J. Y. (2021). Application of natural gamma spectrometry logging in mineral resources exploration in sichuan basin. Spec. Oil. Gas. Reserv. 28 (5), 45–52. doi:10.3969/j.issn.1006-6535.2021.05.007
Xie, J. Z., Chu, Z. H., and Li, Y. H. (2003). Discussion on the method of determining residual oil saturation with sonic elasticity parameters. Log. Technol. 27 (3), 181–184. doi:10.16489/j.issn.1004-1338.2003.03.003
Yan, Z., Anderson, R. F., Geen, A. V., and Fleisher, M. Q. (2002). Preservation of particulate non-lithogenic uranium in marine sediments. Geochim. Cosmochim. Acta 66 (17), 3085–3092. doi:10.1016/S0016-7037(01)00632-9
Yang, R., Hu, Q., Yi, J., Zhang, B., He, S., Guo, X., et al. (2019). The effects of mineral composition, TOC content and pore structure on spontaneous imbibition in lower jurassic dongyuemiao shale reservoirs. Mar. Pet. Geol. 109, 268–278. doi:10.1016/j.marpetgeo.2019.06.003
Ye, C. Y., Wang, Z. M., and Hao, W. L. (2014). Geochemical characteristics of uranium and thorium in sediments from gasikule salt lake in western qinghai province. Mineral. Depos. 33 (5), 1081–1090. doi:10.16111/j.0258-7106.2014.05.016
Yu, H. Y., Li, H. Q., and Guo, B. (2012). Low-resistance oil layers fine evaluation approaches based on mechanics. J. Jilin. Univ. 42 (2), 335–343. doi:10.13278/j.cnki.jjuese.2012.02.007
Zhang, H. T., Ren, Z. L., and Shi, Z. (2011). The causing mechanism of flow resistance gas zone in the east of sulige gasfield. J. Northwest. Univ. 41 (4), 663–668. doi:10.16152/j.cnki.xdxbzr.2011.04.021
Zhao, H., Givens, N. B., and Curtis, B. (2007). Thermal maturity of the barnett shale determined from well-log analysis. Am. Assoc. Pet. Geol. Bull. 91 (41), 535–549. doi:10.1306/10270606060
Zhao, J., Jin, Z., Hu, Q., Liu, K., Liu, G., Gao, B., et al. (2019). Geological controls on the accumulation of shale gas: A case study of the early cambrian shale in the upper yangtze area. Mar. Pet. Geol. 107, 423–437. doi:10.1016/j.marpetgeo.2019.05.014
Zheng, Y., Cui, Y. J., and Lu, Y. L. (2017). Application of clay mineral analysis and low resistance identification based on potassium content correction. Well. Log. Technol. 41 (6), 671–675. doi:10.3969/j.issn.1671-5888.2012.02.007
Zhou, S. W., Wang, H. Y., and Xue, H. Q. (2016). Difference between excess and absolute adsorption capacity of shale and a new shale gas reserve calculation method. Nat. Gas. Ind. 36 (11), 12–20. doi:10.3787/j.issn.1000-0976.2016.11.002
Zhou, X., Zhang, C., Zhang, Z., Zhang, R., Zhu, L., and Zhang, C. (2019). A saturation evaluation method in tight gas sandstones based on diagenetic facies. Mar. Pet. Geol. 107, 310–325. doi:10.1016/j.marpetgeo.2019.05.022
Keywords: low resistivity shale reservoir, well logging, gas content evaluation, organic carbon content, porosity, saturation, luzhai formation
Citation: Li M and Zhang C (2022) An improved method for improving the calculation accuracy of marine low-resistance shale reservoir parameters. Front. Earth Sci. 10:1001287. doi: 10.3389/feart.2022.1001287
Received: 23 July 2022; Accepted: 15 August 2022;
Published: 06 September 2022.
Edited by:
Ali Abedini, Urmia University, IranReviewed by:
Maryam Khosravi, Isfahan University of Technology, IranMahdi Behyari, Urmia University, Iran
Copyright © 2022 Li and Zhang. This is an open-access article distributed under the terms of the Creative Commons Attribution License (CC BY). The use, distribution or reproduction in other forums is permitted, provided the original author(s) and the copyright owner(s) are credited and that the original publication in this journal is cited, in accordance with accepted academic practice. No use, distribution or reproduction is permitted which does not comply with these terms.
*Correspondence: Menglei Li, MjAxOTczMDE4QHlhbmd0emV1LmVkdS5jbg==