- 1Faculty of Land Resources Engineering, Kunming University of Science and Technology, Kunming, China
- 2Faculty of Surveying and Mapping, Kunming Metallurgy College, Kunming, China
- 3West Yunnan University of Applied Sciences, Dali, China
Dongchuan District is one of the most densely distributed regions of geological disasters in the world. Geological disasters such as debris flows and landslides are serious threats to the lives and property safety of local people. Slope deformation monitoring and early identification of geological disasters in debris flow source areas are of great significance for disaster prevention and reduction. In this study, the time-series Synthetic Aperture Radar Interferometry (InSAR) technique was used to detect the deformation in the source area of the Baini river debris flow. The deformation rate in the middle part of the three-sided mountain is the largest, the average deformation rate is about 30 mm/year. The deformation rate of the lower and upper part of the mountain is slightly lower, but the deformation is creeping constantly, and obvious tensile cracks faced the river valley in the upper. The production and living areas of residents in 8 villages around the debris flow source area are constantly deformed, and there are different degrees of landslide risk. This study provides a scientific basis and reference for early identification, deformation analysis, disaster prevention and mitigation of geological disasters in the Xiaojiang Basin.
1 Introduction
With the frequent occurrence of extreme weather, and the continuous strengthening of geological tectonic activities and human activities, the incidence of natural disasters is increasing rapidly all over the world (Li et al., 2021). Dongchuan District of Kunming City is located in the transitional zone of the Sichuan-Yunnan meridional tectonic belt and Northeast Cathaysian tectonic belt, which belongs to the world’s deep large fault zone (Shen et al., 2012; Zhu et al., 2017a). In the territory, Geological disasters such as debris flow, landslides, collapses, and earthquakes occur frequently, because there are many mountains, valleys, active tectonic movement, loose rock structures and sparse vegetation. It is one of the most densely distributed regions of geological disasters in the world, and a key area for geological disaster observation and prevention work in China (Zhang et al., 2021). Geological disasters are seriously threaten to the lives and property safety of local people (Guo et al., 2020). Therefore, effective monitoring of surface deformation in the region plays a vital role in evaluating potential geological disasters, analyzing the genetic mechanism and preventing disaster.
The traditional geological disaster monitoring method is to lay monitoring points, and then use Level Instrument, Clinometer, Total Station and GNSS to observe the settlement and horizontal displacement of monitoring points regularly or irregularly. Although these methods have high measurement accuracy, they all need to reach the field measurement with a large workload and high cost, and the monitoring range is small. At the same time, the observation points are easy to be destroyed and cannot be continuously monitored, thus weakening the overall reliability of deformation monitoring (Calcaterra et al., 2010; Wang et al., 2018; Zhao et al., 2019a; Zhou et al., 2021). Optical remote sensing technology can be used to identify obvious landslides, but it is difficult to obtain deformation variables and deformation rules of the landslide. InSAR technology has the ability for all-weather, all-time, large-scale and high-resolution earth observation. It can detect surface micro-deformation with high precision and play an important role in geological disaster monitoring and early identification (Dong et al., 2018; Yun et al., 2020; Li et al., 2022).
Time-series InSAR technology is developed based on classical D-InSAR technology. D-InSAR technology utilizes the Synthetic Aperture Radar (SAR) on the satellite to observe the same area twice and obtain surface deformation information through differential interference processing (Ferretti et al., 2000). D-InSAR technology only uses one interference pair image in the data processing process, and the reliability of the processing results cannot be guaranteed. At the same time, the interference data are easily affected by the decoherence in time and space, offering inaccurate deformation information (Zhu et al., 2017b). To improve the accuracy and reliability of deformation monitoring results, redundant observations can be formed on the stable scatter target by using multiple repeated orbits to realize the mutual separation of the deformation phase and other phase components. The time-series InSAR method is based on this idea (Yang et al., 2014; Wang et al., 2019a). The most classical time-series InSAR methods are PS-InSAR and SBAS-InSAR. PS-InSAR method is mainly applicable to urban scenes and is widely used in urban land subsidence monitoring. SBAS-InSAR method is more suitable for deformation detection in natural scenes than the PS-InSAR method. Later, scholars continued to improve the time-series InSAR method based on two methods. For example, the SBAS-InSAR method is mainly applicable to small-scale continuous deformation monitoring, Huang et al. introduced Pixel offset tracking technology to monitor large-scale hazards, and used time-series SBAS Pixel offset tracking method for monitoring three-dimensional deformation in a mining area (Huang et al., 2020). SBAS-InSAR method has been widely applied in regional geological disaster investigation and monitoring (Wasowski and Bovenga, 2014). Zhao et al. (2012) have detected the distribution of landslides with ALOS/PALSAR data in Northern California and Southern Oregon, United States. Ng et al. (2015) have assessed the land subsidence in the Gippsland Basin of Australia by InSAR technology. Pour and Hashim (2017) applied Landsat-8 and ALOS data for structural and landslide hazard mapping in Kelantan, Malaysia. In China, SBAS-InSAR technology has been successfully applied in the investigation of landslide disasters in the upper and middle reaches of the Bailong River Basin, the middle reaches of the Yalong River, the Three Gorges Reservoir Area, and the upper reaches of the Jinsha River (Zhang et al., 2015; Shi et al., 2016; Shi et al., 2017; Zhang et al., 2018a; Wang et al., 2019b; Yang et al., 2021).
At present, a small number of scholars have conducted research on landslide disasters in Dongchuan District based on InSAR technology. For example, Zhang et al. (2021) used the D-InSAR method to early identify landslide geological disasters around Dongchuan urban areas. Liu and Wang used the SBAS-InSAR method to study the surface deformation of Dongchuan District, identified potential landslides, and analyzed the spatial distribution, without a detailed analysis of the deformation characteristics of landslides (Liu, 2019; Wang et al., 2020). Debris flow, as a very destructive geological disaster, poses a serious threat to social security. However, there are few studies on monitoring the surface deformation and revealing the time series change characteristics of debris flow source area in Dongchuan District. Therefore, slope deformation monitoring and time series change characteristics analysis in debris flow source areas are of great significance for the protection of life and property safety of residents in the region.
In this paper, based on SBAS-InSAR technology and Sentinel-1A descending SAR data from March 2018 to December 2020, the time series topographic deformation monitoring and feature analysis of the debris flow source area in Baini River were carried out, and the stability of surrounding villages was analyzed, which provides research methods and data reference for relevant departments to carry out the prevention and mitigation of geological disasters and the management of the emergency.
2 Overview of the study area
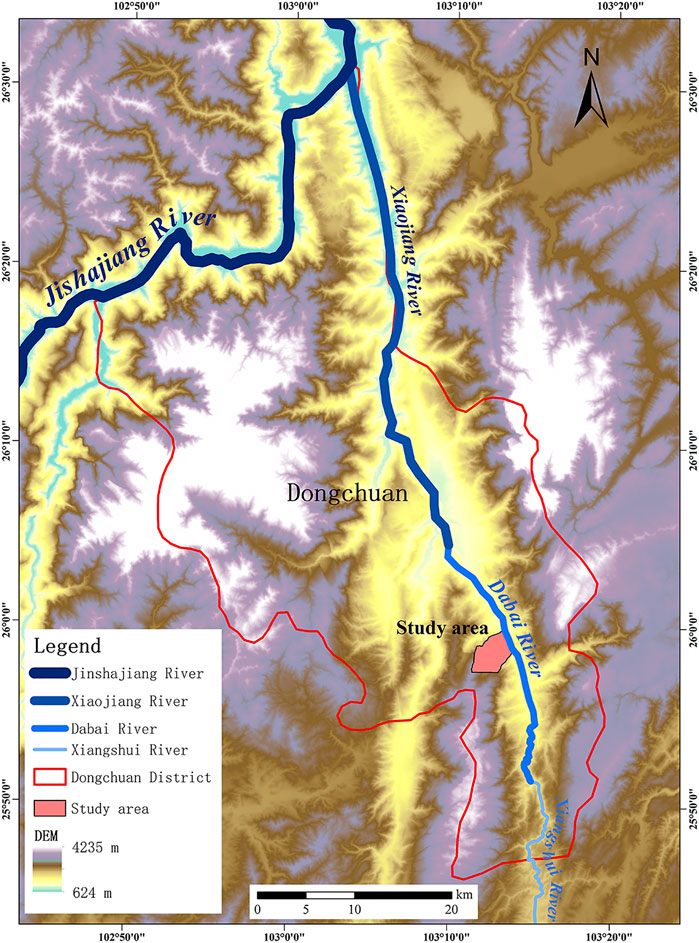
Dongchuan District belongs to Kunming City, Yunnan Province, China, which is located in the northernmost part of Kunming City. It is located at 102°47′-103°18′ E, 25°46′-26°32′ N, with a maximum north-south vertical distance of 84.6 km and a maximum east-west horizontal distance of 51.2 km. There are high mountains, deep valleys, and steep terrains in this area. The highest elevation of 4,344 m is located in the highest peak of Gongwang Mountain, while the lowest elevation is only 695 m, which is located at the intersection of Jinsha River and Xiaojiang River. The Xiaojiang River runs through the whole area of Dongchuan District from the south to the north. The upstream is called Xiangshui River, the middle reach is called Dabai River, and the downstream is called Xiaojiang River. The rock structure on both sides of the river is loose, the vegetation is sparse, and the deep-cutting valley is heavily eroded. It is easy to form large-scale debris flows. The Xiaojiang River Basin is a typical debris flow area in the world and is called the “Debris Flow Natural Museum.” Dry red soil as well as red soil are the most widely distributed soil. The annual average temperature is 14.9°C, and the annual average rainfall is about 1,000 mm. The rainfall is mainly concentrated from May to October. Due to the complex terrain and huge height difference, a typical three-dimensional climate is formed (Zhang et al., 2022). The natural disasters of debris flow in the Xiaojiang River Basin of Dongchuan are well-known in the world. There are 113 debris flow gullies. Six major debris flow disasters in the past half-century have taken more than 200 lives. An average M ≥3.0 earthquake, affected by tectonic activities, occurred annually in Dongchuan. Affected by continuous rainfall, nine people were missing due to landslides in Dongchuan District on 28 October 2014, and five people were killed due to landslides in Awang Town on 26 September 2016.
The Baini River debris flow provenance area (12 km south of Dongchuan City, as shown in Figure 1) is selected as the study area. The Baini River is a tributary of the Dabai River in the middle reaches of Xiaojiang River Basin, Which flows into the Dabai River from the high mountains in the southwest to the northeast, with an elevation of about 2,600 m in the upstream and an elevation of about 1,600 m in the starting point of debris flow source convergence. The elevation difference of nearly 1,000 m provides convenient terrain conditions for debris flow source convergence. The whole debris flow source area of Baini River presents a “concave” structure. The bottom of the debris flow gully is low, and the three sides mountains are tall. The river water flows into the bottom of the gully from the rear mountains along the slope. In this region, the temperature difference between day and night is large, the vegetation is sparse, the soil erosion is serious, and the ecological environment is very fragile.
3 Data and methods
3.1 Experimental data
In this paper, the Sentinel-1A descending data launched by the European Space Agency (ESA) from March 2018 to December 2020 are used to estimate the deformation of the radar Line of Sight (LOS) direction in the study area. Sentinel-1A image has good interference performance, the revisit period is 12 days, and the time resolution is high, which is conducive to the extraction of time series deformation information. The specific image data parameters are shown in Table 1.
In the study, SRTM DEM data with a resolution of 30 m is used to eliminate the terrain phase and assist subsequent SAR images for geocoding. The Precise Orbit Ephemeris Data (POD) of the Sentinel-1A satellite is used for auxiliary data preprocessing and baseline error correction. Precipitation data launched by the University of East Anglia Climatic Research Unit (CRU) from 2018 to 2020 are used to study the effect of rainfall on surface deformation in the study area.
3.2 Research methods
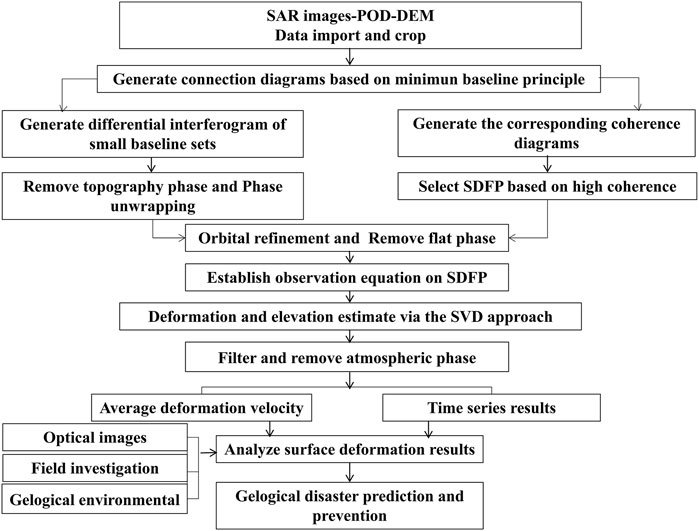
According to the principle of short spatio-temporal baseline, SBAS-InSAR technology can still combine more differential interference pairs of multi-main images to improve spatio-temporal coherence in the case of less original image data. First of all, SBAS-InSAR technology combines and produces sequence interferograms of multi-master images according to the principle of short time-space baseline, and then spatially filters the differential interference phase (multi-view processing). Secondly, according to the average spatial coherence, the slow decor relating to filtered phase pixels (SDFP) are identified, which are the ground target points with relatively high coherence. The observation equation is established on the identified SDFP points, and the three-dimensional phase unwrapping and singular value decomposition are performed to solve the single-master image phase sequence (Zhang et al., 2018b). Finally, spatio-temporal filtering is used to estimate and remove the atmospheric delay phase, and the topographic elevation error and time series deformation information are obtained. SDFP points obtained by SBAS-InSAR technology are ubiquitous in the natural environment, such as sand, bare soil, rock, grassland, etc. This method is more suitable for the mountainous environment (Zhao et al., 2018; Zhao et al., 2019b; Solari et al., 2020). Therefore, in this study, SBAS-InSAR technology is used to obtain the temporal deformation and annual average deformation rate of the study area.
3.3 Technical route
In this paper, the technical route scheme as shown in Figure 2, the main processing steps are as follows.
Step 1. Data preprocessing. The raw SAR images were decompressed and imported. The POD data were used to refine the orbit of each SAR image to generate Single Look Complex (SLC) images. The SLC images of the study area were obtained by cutting processing.
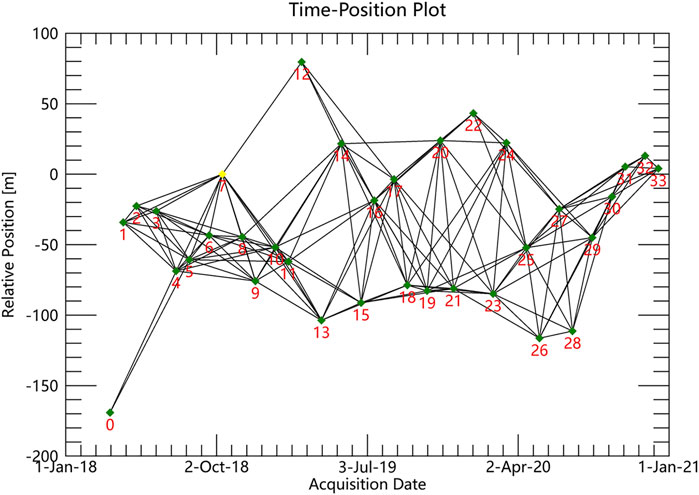
Step 2. Connection diagram generation and interference image pairs combination. With the maximum spatial baseline threshold of 2% and maximum time baseline of 180 days as conditions, the SAR image of 20181012 was automatically selected as the super master image. The connection diagram (shown in Figure 3) was generated according to the principle minimum baseline, 149 interference image pairs were combined.
Step 3. Interferometric process. The coherence of 149 interference image pairs was enhanced by filtering and multi-look methods. To increase the number of differential interferograms, multiple images were selected as master images and others as slave images. The master and slave images were, respectively registered and resampled to obtain a small baseline set. SRTM DEM data were used to remove the flat phase, and the wrapped interference phase was unwrapped. The interferograms were filtered according to the coherence, and the slow decor relating to filtered phase pixel (SDFP) was identified according to the average spatial coherence. In this study, the Minimum Cost Flow (MCF) method was used for unwrapping, the threshold of unwrapping coherence coefficient was set as 0.35, and the Goldstein method was used for filtering.
Step 4. Refinement and re-flattening. Ground Control Points (GCP) can be used to correct SAR data due to inaccurate satellite orbits or inaccurate DEM geographic positioning. 57 points with good coherence and stability were selected as GCPs, and GCPs were used for refining and re-flattening.
Step 5. Inversion. The observation equation was established on the identified SDFP points, and the deformation rate and residual terrain phase were estimated by the singular value decomposition (SVD). Then, the interferograms were optimized by re-unwrapping to obtain a better interference effect. In order to estimate and remove the atmospheric phase and obtain more accurate time series displacement results, a customized atmospheric filter was performed. The time filter window was set to 365 days, and the spatial filter window was set to 500 m × 500 m.
Step 6. Geocoding. The time series deformation results and average deformation rate in the LOS direction of the study area were obtained by geocoding.
Step 7. Monitoring results were analyzed. Combined with regional characteristics, optical remote sensing images, and field investigation data, the surface times deformation characteristics of the debris flow source area and surrounding residential areas were analyzed from two aspects of space and time.
4 Results and analysis
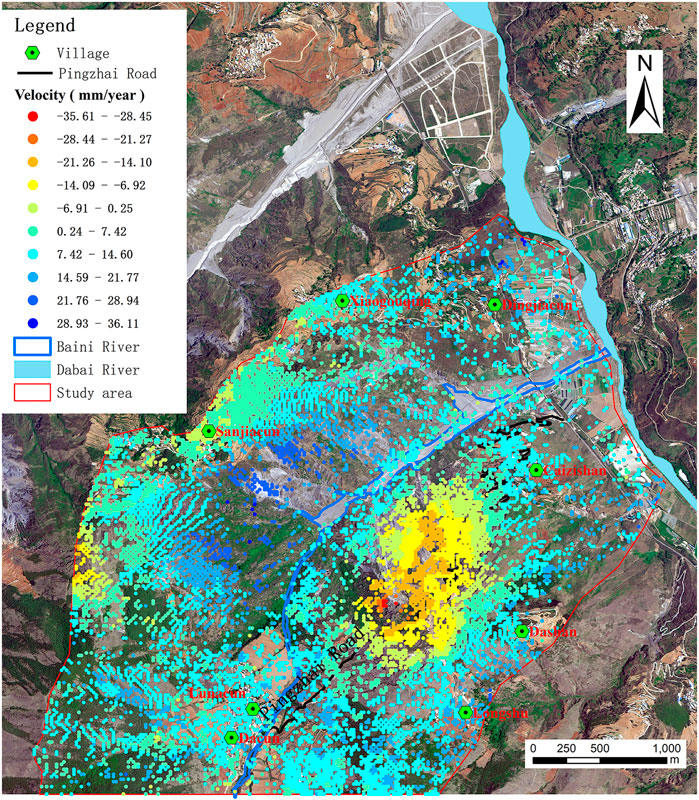
In this thesis, based on the SBAS-InSAR technology, a total of 10,904 point targets were detected in the source area of Baini debris flow, with a point density of 788 points/km2. The annual average deformation rate in the radar line of sight (LOS) direction of debris flow provenance from March 2018 to December 2020 is illustrated in Figure 4. For a better visibility, the deformation results were superimposed on the remote sensing image. The deformation rate ranges from −35.61–36.12 mm/year. The red color (negative value) shows that the landslide displacement of the target points is far away from the satellite direction, and the blue color (positive value) indicates that the landslide displacement of the target points is close to the satellite direction. The whole debris flow source area of Baini River is covered by deformation monitoring results.
The stability of the slope in the region can be determined according to the deformation rate and point aggregation of the target points on the slope. The standard deviation of the deformation rate of the output coherent pixels is used as the threshold in most existing studies. In this study, the influence of monitoring results error, the observation of deformed slope in the field, and the activity of the landslide were taken into consideration. Based on the standard deviation of the deformation rate of all coherent pixels in the region (9.2 mm/year), −10–10 mm/year was taken as the relatively stable threshold, and the deformation rate within this range is considered to be a stable region. Combined with field investigation and optical remote sensing image observation, when the regional deformation rate is greater than 10 mm/year, cracks of different widths appear on the surface. When the regional deformation rate is greater than 30 mm/year, there are different degrees of collapse and gravel scratches on the slope.
From a time perspective, in the study area, the annual average deformation rate in 2018 ranges from 18.53 to 62.35 mm/year. The annual average deformation rate in 2019 ranges from −31.61 to 27.64 mm/year. The annual average deformation rate in 2020 ranges from −32.56 to 31.66 mm/year. In the 3 years, the average deformation rate in 2018 changed to the smallest range and gradually increased in 2019 and 2020. The change interval of the annual average deformation rate was gradually increased, indicating that the surface deformation in the study area was gradually increasing, and the risk of geological disasters such as landslides and debris flows was also increasing year by year.
During the rainy season from May to October, the deformation rate in 2018 ranges from 8.3 to 58.88 mm/year. The deformation rate in 2019 ranges from −21.84–32.6 mm/year. The deformation rate in 2020 ranges from −35.02 to 29.3 mm/year. By comparison, it is found that the variation range of the deformation rate of each rainy season is similar to that of the annual deformation rate, and the influence of rainfall on regional deformation needs to be analyzed in depth.
In the following research, a detailed analysis is conducted on the initial formation of debris flow source convergence area, mountain landslide around debris flow valley, and village deformation in the basin.
4.1 Analysis of longitudinal section and cross-section deformation in the source area of debris flow
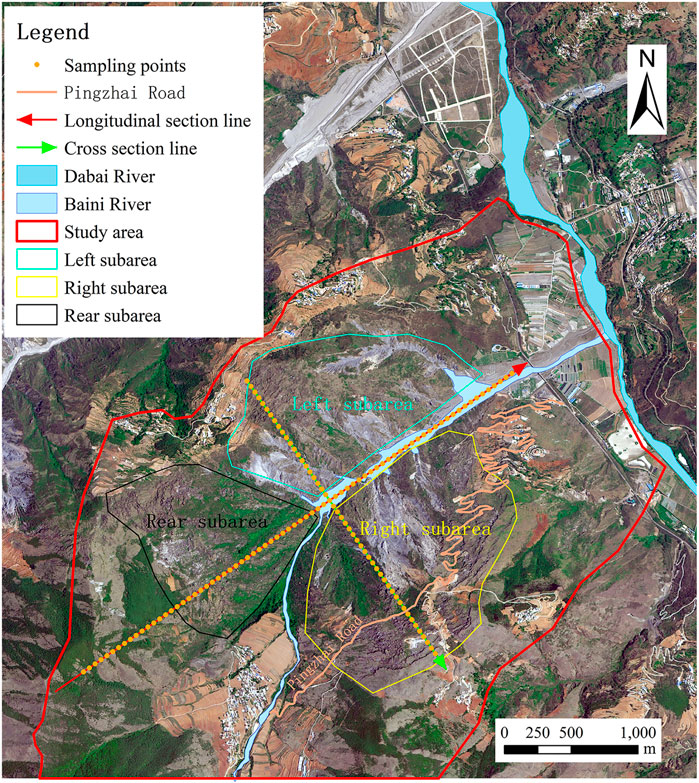
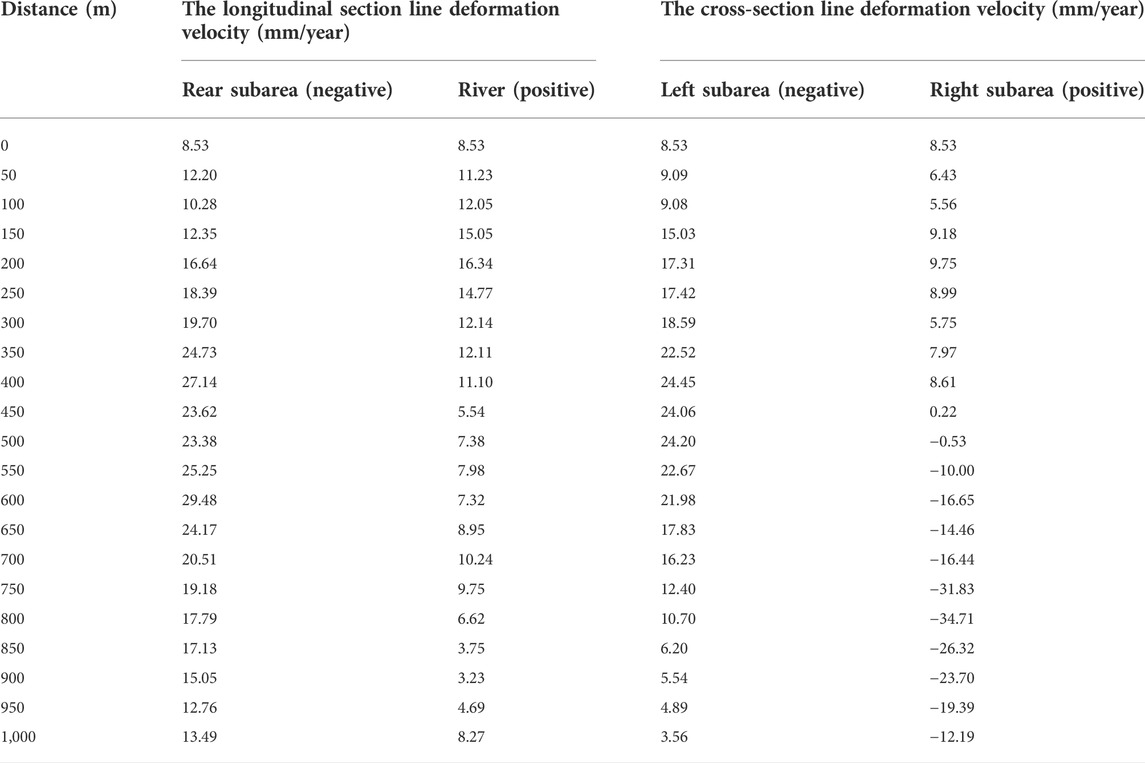
In this research, taking the valley area where the debris flows first formed in Baini River as the central point, that is, the convergence center of debris flow source. The longitudinal section line of the debris flow source area is established along the river flow direction of the debris flow valley, the flow direction toward the river (northeast) is positive, and the backward is negative. The cross-section line is established in the vertical direction, the distance in the right mountain direction (southeast) is positive, and the distance in the left mountain direction is negative. The longitudinal and cross-section position are shown in Figure 5. The deformation rate was recorded by sampling a point at an interval of 50 m on the longitudinal and cross-sectional line (shown in Table 2), and the longitudinal and cross-sectional deformation rate map of the debris flow source area is illustrated in Figure 6.
The longitudinal section analysis shows that there is a large deformation rate between 350 and 650 m from the debris flow source convergence center in the rear mountain in the southwest direction, where the deformation rate is more than 20 mm/year along the LOS direction, and the maximum deformation rate is 29.48 mm/year. Due to the continuous accumulation of debris flow sources around the valley, the valley within the range of fewer than 400 m from the convergence center is constantly uplifting in the direction of river flow. The uplift rate is greater than 10 mm/year. The width of the valley greater than 400 m from the convergence center is gradually widening, and the uplifting rate is gradually slowing down. The deformation rate tends to be flat in the region more than 900 m away from the convergence center, where the deformation rate fluctuates up and down 5 mm/year.
The cross-sectional analysis shows that the left mountain in the northwest has a large deformation rate between 350–600 m from the convergence center of the debris flow source, where the deformation rate exceeds 20 mm/year along the LOS direction, and the maximum deformation rate reaches 24.20 mm/year. The right mountain in the southeast has a large deformation rate between 750–900 m from the convergence center of the debris flow source, where the deformation rate exceeds 20 mm/year along the LOS direction. The maximum deformation rate reaches -34.71 mm/year.
Further observation of optical remote sensing images revealed that the vegetation on both sides of the mountain is scarce and the rocks are severely weathered. There are obvious ground fissures on the exposed surface in the source area of debris flow. Although the back mountain is covered with sparse vegetation, the vegetation is small and the mountain height difference is large. The terrain and surface cover provide natural conditions for landslides. The surface deformation of the left and right sides and the rear mountains cause large-scale landslides, which provide a rich source for the formation of debris flows. The entire debris flow source area is in the shape of a “concave” funnel, and the surrounding mountains continue to slide. The rock fragments are transported downward with the upstream river flow forming a perennial debris flow valley.
4.2 Time series deformation analysis of mountains around debris flow valley
4.2.1 Analysis of left mountain landslide
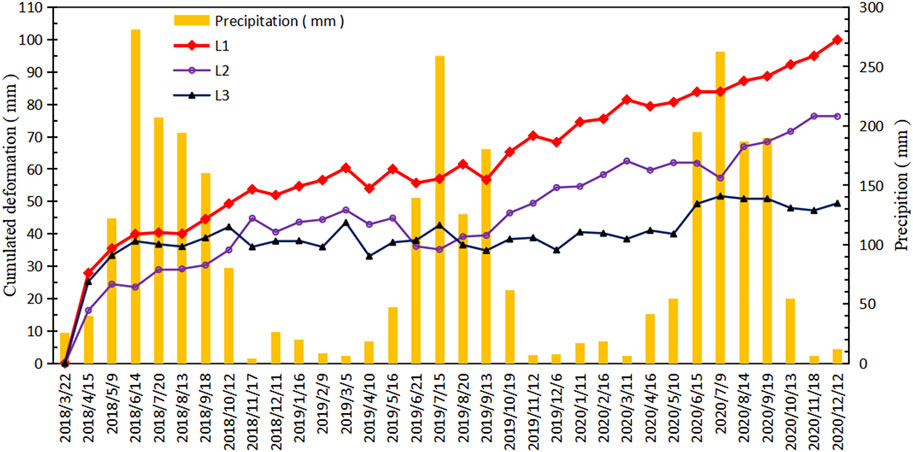
As shown in Figure 7, the mountain on the left side of the debris flow valley is a large landslide group. The whole landslide area is about 1,500 m long and 900 m wide, with an elevation of 1,950 m at the crown of the landslide and 1,500 m at the front foot of the landslide. The slope is about 45°. It can be seen from the optical image (shown in Figure 7A) that there are 3 large landslide traces, 1 small landslide trace in the middle of the mountain, and 1 large surface crack area in the upper part of the mountain. Three characteristic points L1, L2, and L3 are selected on the landslides group (shown in Figure 7B). L1 is located in the large landslide trace area in the middle of the mountain, with an average deformation rate of 24 mm/year and a cumulative deformation of 72 mm. L2 is located in the small landslide trace area in the middle of the mountain, with an average deformation rate of 17 mm/year and a cumulative deformation of 60 mm. L3 is located in the surface crack area in the upper part of the mountain, with an average deformation rate of 7 mm/year and a cumulative deformation of 24 mm. It can be inferred that the signs of landslides on the left mountain are clear and the deformation is obvious. The deformation of the landslides is mainly concentrated in the middle, upper part and the rear edge. The deformation rate of the middle part of the mountain is greater than that of the rear and front edges. The rear push leads to the collapse and rockfall of the front edge (shown in Figure 7C).

FIGURE 7. Remote sensing image and time-series deformation monitoring results of the left mountain. (A) Optical remote sensing image; (B) Deformation velocity; (C) Field investigation picture.
From the perspective of time, the annual deformation variable and the rainy season deformation variable of the left mountain are analyzed (shown in Figure 8). The deformation variables of the three characteristic points are shown in Table 3. The analysis found that: the deformation variable was largest in 2018, followed by 2020, and the smallest in 2019. We calculated the precipitation in these 3 years and found that the precipitation was the largest in 2018 and the smallest in 2019. On the temporal level, the deformation variable is proportional to precipitation. The deformation variable in 2020 is greater than that in 2019, which means that there may be a greater risk of geological disasters in the region in the future. In this area, the deformation variable in the rainy season is greater than half of the annual deformation variable, especially in the rainy seasons of 2019 and 2020. It shows that the rainfall accelerates the surface deformation and induces geological disasters. In particular, heavy rainfall strongly scours the shallow surface in the middle of the slope, destroys the stability of the shallow surface, and is easy to cause landslides.
4.2.2 Analysis of right mountain landslide
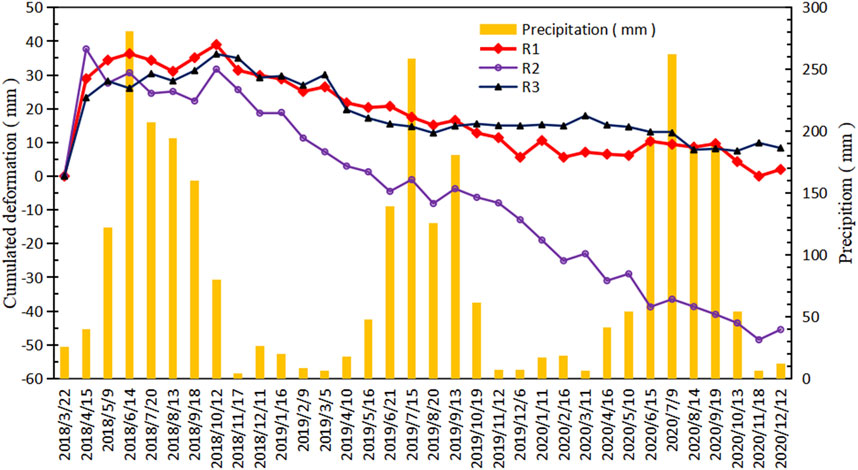
As shown in Figure 9, the landslide area on the right side of the mountain of the debris flow valley is about 1,900 m long and 1,000 m wide, with an elevation of 2,100 m at the rear edge of the landslide and 1,500 m at the front foot of the landslide, and the slope is about 40°. Three characteristic points R1, R2, and R3 are selected in the landslide area (shown in Figure 9B). R1 is located in the upper part of the mountain, and there are obvious sliding cracks on the surrounding surface (shown in Figure 9A), with an average deformation rate of −11 mm/year and a cumulative deformation of 27 mm. R2 is located in the middle of the mountain, which is the largest deformation area in the whole region, with an average deformation rate of −30 mm/year and a cumulative deformation of 80 mm. R3 is located in the lower part of the mountain. There are obvious slip marks and rock debris around it, with an average deformation rate of −7 mm/year and a cumulative deformation of 20 mm. From the observation of time series deformation monitoring results, it is found that the three feature points are declining in the LOS direction, the deformation rate and deformation in the middle of the mountain are the largest. The deformation of the upper is greater than the lower. From the optical images, it is also found that the vegetation on the right side of the mountain is rare, and there are large areas of landslide traces, rock debris and surface tension cracks (shown in Figure 9C). Therefore, the surface vegetation coverage and topographic features provide favorable conditions for landslides. The Pingzhai road on the upper part of the mountain and the road leading to Longshu Village have been in a wide range of subsidence areas and collapse areas for a long time, which brings potential dangers to the roads and pedestrians.
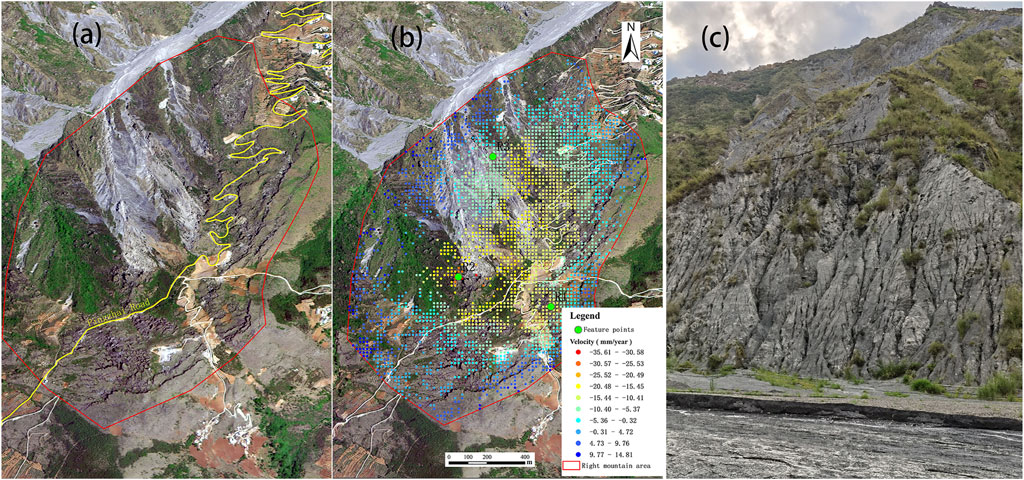
FIGURE 9. Remote sensing image and time series deformation monitoring results of the right mountain. (A) Optical remote sensing image; (B) Deformation velocity; (C) Field investigation picture.
The analysis of Table 4 shows that: the deformation variable of the upper and lower parts of the right slope decreased gradually, while the deformation variable of the middle part increased gradually.
R1 was uplifted in 2018, sharply declined in 2019, and declined at a slower variable in 2020. It shows that in the upper part of the right mountain, the surface uplift first appeared, stability of the original surface was destroyed. Then the shallow surface formed landslides along the slope. With the gradual loss of soil, the surface tended to be stable (shown in Figure 10). R2 was in an accelerated decline in 2019 and 2020, and the annual deformation variables were significantly larger than those in rainy seasons. It indicates that the deformation was accelerated in the dry season, and the downward trend in the region was gradually increasing. R3 is close to the valley, and its change trend is similar to that of R1. Surface uplift occurred in 2018, which may be caused by the downward accumulation of upper stone and soil. A decline occurred in 2019, indicating that the stability of the deposits was destroyed, collapse or landslide occurred in the process of accumulation. Still declining in 2020, the decline variable is significantly less than in 2019. It indicated that the deformation of R3 may be greatly affected by the upper sliding roller, and the deformation rate is gradually decreasing.
The deformation variables of the rainy seasons in 2018 and 2019 were less than half the annual deformation variables, indicating that the dry seasons in 2018 and 2019 were accelerating deformation. The deformation variable in the rainy season in 2020 was greater than half the annual deformation variable, indicating that the rainfall intensified the surface deformation.
4.2.3 Analysis of rear mountain landslide
As shown in Figure 11, the landslide area at the rear of the debris flow valley is fan-shaped. The widest part of the landslide is about 1,300 m, and the height difference between the rear edge of the landslide body and the front debris flow source convergence center is about 650 m. The slope is about 45°. According to the observation of optical images, the landslide surface is mainly composed of gravel soil, and there are obvious horizontal fractures at the rear edge and vertical gullies at the front edge. The time-series InSAR technology detected that the maximum deformation rate of this landslide area reached 34 mm/year and the deformation amount reached 90 mm. Here, we also selected three characteristic points: B1, B2, and B3 in the landslide area (shown in Figure 11B). Point B1 is located in the middle and lower part of the landslide. Due to the influence of terrain slope and the extrusion deformation of the rear edge landslide, vertical tensile cracks were formed. Under the erosion of rainwater and rivers, the cracks continue to expand to form vertical gullies. The annual average deformation rate in this region is about 30 mm/year. Points B2 and B3 are located in the upper part of the landslide body, and the mountain surface moves forward to the slope, forming obvious horizontal cracks (shown in Figure 11C). The average deformation rate of the upper part is about 10 mm/year, and the deformation is constantly creeping. Through the analysis of time-series deformation monitoring results, it is found that the deformation rate in the middle and lower parts of the rear mountain is larger, and the deformation in the upper part is obvious. The surface of the region is sliding as a whole.
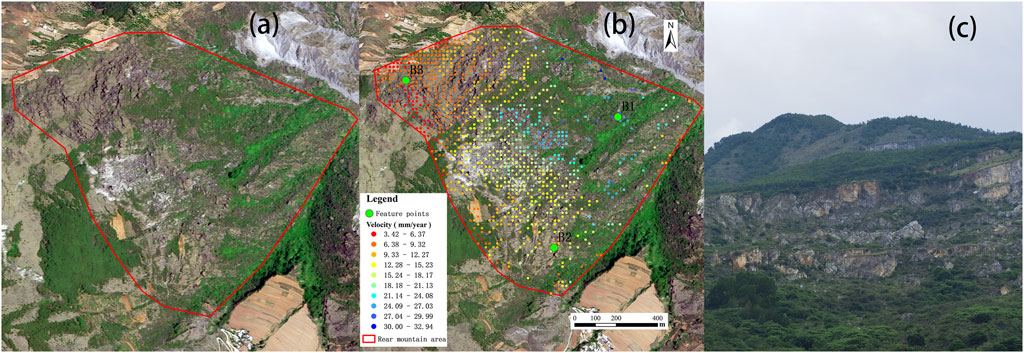
FIGURE 11. Remote sensing image and time series deformation monitoring results of the rear mountain. (A) Optical remote sensing image; (B) Deformation velocity; (C) Field investigation picture.
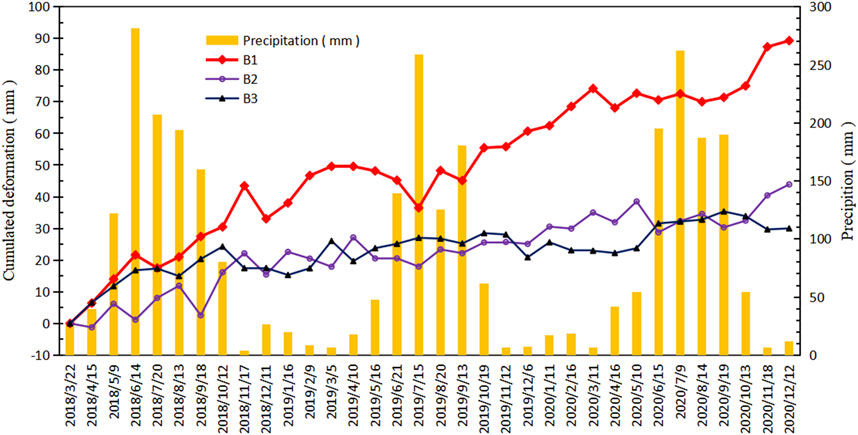
The deformation variable in 2018 was relatively large in the 3 years (as shown in Table 5 and Figure 12). The deformation variable in the rainy season in 2018 was significantly higher than half the annual deformation variable, indicating that the surface deformation was accelerated by rainfall in 2018. B1 is located in the middle and lower part of the hillside, and the deformation variables had been high for 3 years, which is highly likely to be transformed into a landslide. B2 is located on the upper left side of the mountain slope, and the surface is continuously deformed. In the 3 years, the rainy season deformation variable was relatively large, which indicated that the deformation of this region may be affected by rainfall. The deformation variable of B3 in the rainy season is significantly higher than that in each year, indicating that rainfall had an accelerating effect on surface deformation in this small area, and protection should be strengthened in the rainy season.
Through the analysis of the above results, it may be concluded that the debris flow source area is a “concave” distribution, and the two sides of the valley and the rear mountain are in the landslide area. The closer to the center of the debris flow source, the greater the deformation rate is. The deformation rate in the middle of the three sides of the mountain is the largest. The average deformation rate is about 30 mm/year, and the landslide traces are obvious. The deformation rates of the lower and upper parts of the mountain are slightly lower, but the deformation is constantly peristaltic, and obvious tension cracks are facing the valley in the upper parts.
The deformation variable of the left hillside in 2020 is close to that in 2018, which is significantly larger than that in 2019. There may be a greater risk of geological disasters in the future. In this area, the deformation variable in the rainy season is larger than half the deformation variable of each year. It shows that the rainfall accelerates the surface deformation and induces geological disasters. The deformation variable of the right hillside in 2019 is relatively large in the 3 years, which is significantly larger than that in 2018 and 2020. The upper part of the slope was in an accelerated decline in the 3 years. In the upper and lower parts of the slope, the surface uplift first appeared. Then the shallow surface formed landslides along the slope. With the gradual loss of soil, the surface tended to be stable. The deformation variable of the rear mountain in the rainy season in 2018 was significantly larger than half the annual deformation variable, indicating that the surface deformation was accelerated by rainfall in 2018. In the middle and lower part of the hillside, the deformation variable had been large for 3 years, which is highly likely to be transformed into a landslide. The deformation variable near Luna village during the rainy season is significantly larger than that in each year, indicating that rainfall had an accelerating effect on surface deformation in this small area, and protection should be strengthened during the rainy season.
4.3 Time-series deformation analysis of each village in the region
In the previous discussion, the surface deformation information of the debris flow source convergence area of Baini River and the mountains around the debris flow valley was analyzed. It was found that there were many obvious landslides in the debris flow source area and surrounding villages. There were obvious tensile cracks in the upper part of the mountains towards the valley, and the surface deformation of the whole debris flow source area was obvious. Next, the surface deformation of residential areas around the debris flow source area is analyzed to provide a reference for disaster prevention and mitigation of residents in the basin.
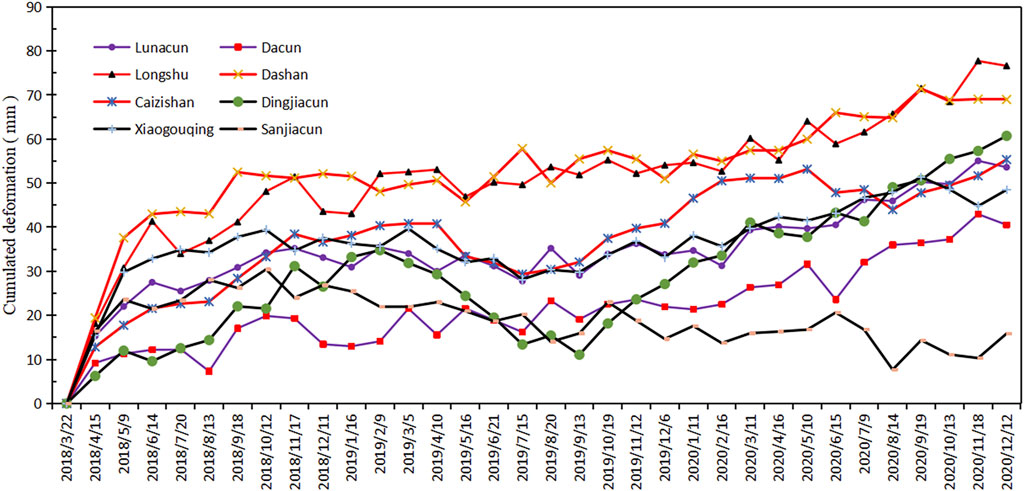
There are eight villages around the debris flow source area of Baini River, and the time-series deformation of each village is shown in Figure 13 and Table 6. There are two villages in the upper part of the mountain behind the debris flow valley, Lunacun and Dacun. Lunacun is located below the Dacun, closer to the debris flow source convergence center, and the time series deformation is significantly greater than that of Dacun. The average deformation rate of Lunacun is 12 mm/year, and the average deformation rate of Dacun is 11 mm/year, so both Lunacun and Dacun in the upper part of the rear mountain have topographic deformation and potential landslide risk.
There are three villages, Longshu, Dashan and Caizishan, in the upper part of the right mountain in the debris flow valley. Through the time series deformation information, it is found that the deformation variables of the three villages are significantly greater than those of other villages in the basin, especially the two villages of Longshu and Dashan, which are adjacent to the tensile cracks of the landslide. The average deformation rate is 16 mm/year and 13 mm/year, respectively. The average deformation rate of Caizishan located on the right side of the debris flow gully near the outlet of Baini River downstream also reached 13 mm/year, which indicated that the whole mountain on the right side of the debris flow valley was unstable, and residents living in this area should have the awareness of disaster prevention at any time.
There are three villages, Dingjiacun, Xiaogouqing and Sanjiacun, in the upper part of the left mountain in the debris flow valley. The deformation of Dingjiacun is significant after September 2019, and the deformation reaches 50 mm. It is gradually increasing. Dingjiacun also has the largest deformation rate of the three villages on the left mountain, and the deformation rate reaches 15 mm/year, which has a great risk of landslide. Although Xiaogouqing and Sanjiacun are located at the top of the left mountain, the average deformation rates are 8 mm/year and −4 mm/year, respectively. The overall deformation rate of the small area where the two villages are located is small, but the high altitude and surrounding landslides may bring potential dangers to the production and living conditions of residents.
There are large areas of significant deformation in the entire debris flow source area and its surrounding area. Residents here should always maintain safety risk awareness and avoid the impact of natural disasters, landslides and debris flow and other secondary disasters on the safety of their lives and property. Especially three villages: Longshu, Dashan and Dingjiacun, are more dangerous because the overall deformation rate of the region is greater, the mountains are high and steep, and the villages are at greater risk of landslides.
Based on the above results and analysis, we recognize that there are obvious landslide traces and tensile cracks in areas with large surface deformation, which will verify the reliability of InSAR monitoring results. The annual average deformation rate range of debris flow source area is −35.61–36.12 mm/year. The debris flow source area is in the shape of a “concave”, and there are obvious landslides or crack traces on the surrounding slopes. The deformation rate in the middle of the slope is the largest. There are obvious differences in deformation rule in different slope directions. The deformation variable in the rainy season in 3 years was larger than that in each year, indicating that rainfall increased surface deformation. There are 8 villages in the study area, and the annual average deformation rate of 6 villages is greater than 10 mm/year, indicating that the surface of the village is unstable. In the future, the time series monitoring and early identification of geological disasters in residential areas should be strengthened, in order to provide a scientific basis for disaster prevention and mitigation.
5 Discussions
In this study, the SBAS-InSAR method was used to monitor the time series of debris flow source area, analyze the slope stability from the perspective of space and time, identify geological disasters in the early stage, and analyze the stability of villages in the region. For the monitoring of surface deformation by the SBAS-InSAR method, SBAS-InSAR method has been proved by previous studies that the accuracy of monitoring can achieve centimeter or even millimeter, so it is feasible to directly analyze and study the rule of surface deformation by SBAS-InSAR monitoring results (Zhao et al., 2018; Zhao et al., 2019b). Many scholars have used the InSAR method for landslide stability analysis (Froude and Petley, 2018; Rehman et al., 2020; Solari et al., 2020). More researchers are early identification of regional potential landslides and studying the spatial distribution of potential landslides (Ali et al., 2019; Liu et al., 2021). Few studies on slope stability in debris flow source areas (Yang et al., 2011; Yang et al., 2016). This study provides an important scientific reference for disaster prevention and mitigation in high-incidence areas of debris flow, and to some extent fills the gaps in monitoring and prevention ideas.
From the perspective of spatial analysis of slope stability in the debris flow source area, it is found that the annual average deformation velocity of the longitudinal and cross sections of the debris flow source convergence center appears a peak on the three sides of the mountain, indicating that the maximum deformation area is distributed in the central part of the surrounding slope. With the continuous decline of the central part of the slope, a large depression area will appear in the central part. A good analysis of why the central region has been accelerating from a time perspective. In 2018, during the decline in the central region, accumulations were accumulated in the lower region, causing the lower region to rise continuously. By 2019, when there was too much accumulation in the bottom area, it was difficult to carry, the accumulation area collapsed or landslide, and the surface decreased significantly. The lower was sinking, and the upper was uplifting, so the stability of the middle was further unbalanced, the middle would fall sharply. Due to the continuous decline in the middle, the upper accumulation moved downward, which was causing a sharp decline in the upper. In 2020, with the upper accumulation gradually decreasing and further approaching equilibrium, the decline rate gradually decreased. The middle part was still falling, which was affected by the upper part of the continuous decline. The lower part was constantly piled up in the middle during the sliding process, and the deformation rate was decreasing. This study clearly reveals the time series deformation rule of the slope in the debris flow source area, which is also consistent with the results of spatial analysis.
Through the analysis of slope stability in debris flow source area from time and space, we also found that: 1) The annual deformation rate of the three characteristic points of the right mountain in 2019 is the largest in 3 years, and the annual deformation rate of the three characteristic points of the left mountain in 2019 is the smallest in 3 years. It shows that the surface deformation rate may be related to the slope aspect. 2) On the three slopes of the debris flow valley, the deformation variable of the left mountain in the rainy season in 2018 and 2019 was larger than half the annual deformation variable, while the deformation variable of the right mountain and the rear mountain was larger than half annual deformation variable in the rainy season only in 2018. It suggests that not every rainy season’s deformation rate is greater than the annual, rainfall is not the main cause of landslide surface deformation, and rainfall may be one of the factors causing ground deformation. 3) The annual deformation velocity of the central area of the three slopes has a large deformation velocity, and has always maintained a large deformation rate. It shows that landslides mainly occur in the central part of the mountain, while the terrain in the central area is relatively steep, which further indicates that the slope may affect the surface deformation velocity.
In the future research, the influence degree of natural conditions such as slope aspect, slope and rainfall on landslides in debris flow source areas will be deeply analyzed, which will provide more data support for geological disaster prevention.
6 Conclusion
In this paper, we have used the time series InSAR technology to detect the land deformation in the debris flow source area of Baini River, and analyzed the slope stability from the perspective of space and time. identified geological disasters in the early stage. We also monitored and analyzed the villages around the debris flow source area. This study provides an important scientific reference for disaster prevention and mitigation in high-incidence areas of debris flow. The main conclusions we have reached are as follows:
Firstly, the annual average deformation rate in the direction of radar line of sight (LOS) in the debris flow source area of Baini River from March 2018 to December 2020 is −35.61–36.12 mm/year, and the deformation rate −10–10 mm/year is used as the relative stability threshold to determine the stable area and the landslide area. Combined with field investigation and optical remote sensing image observation, when the regional deformation rate is more than 10 mm/year, the surface appears unequal tensile cracks. When the regional deformation rate is more than 30 mm/year, the slope appears different degrees of collapse, gravel scratches and vertical gully. This all verified the effectiveness of time series InSAR technology in regional surface deformation monitoring.
Secondly, the debris flow source area is a “concave” distribution; both sides of the debris flow valley and the mountains behind are in the landslide area. The closer to the debris flow source center, the greater the deformation rate is, and the deformation rate in the middle of the three mountains is the largest, with an average deformation rate of about 30 mm/year, showing obvious landslide traces. The deformation rates of the lower and upper parts of the mountain are slightly lower, but in the continuous creep deformation, obvious tensile cracks are facing the valley in the upper region. From the perspective of spatial analysis of slope stability in the debris flow source area, it is found that the annual average deformation velocity of the longitudinal and cross sections of the debris flow source convergence center appears a peak on the three sides of the mountain, indicating that the maximum deformation area is distributed in the central part of the surrounding slope. A good analysis of why the central region has been accelerating from rainy season velocity and each year deformation velocity. The results of time perspective analysis coincide with that of space perspective analysis. This study clearly reveals the time series deformation rule of the slope in the debris flow source area.
Thirdly, there are eight villages around the debris flow source area of Baini River, among which the annual average deformation rate of six villages is greater than 10 mm/year. The deformation rates of Longshu, Dashan and Dingjiacun are 16, 13, and 15 mm/year, respectively. The overall deformation rate of the three villages is relatively high. The surrounding surface has obvious cracks, and the mountain slope is steep. There is a large risk of landslides. The surface deformation of Luna, Dacun and Caizishan is obvious, and the three villages are close to the landslide area of the debris flow source area. Therefore the three villages have potential landslide danger. Although the average deformation rate of the two villages of Xiaogouqing and Sanjiacun is less than 10 mm/year, the high altitude, the surrounding loose soil and sparse vegetation, and the surrounding landslides may bring potential dangers to the production and living of residents.
Finally, through the analysis of slope stability in debris flow source area from time and space, it is found that the surface deformation velocity in the study area may be related to slope, slope aspect and rainfall. Next step, the influence degree of natural conditions such as slope aspect, slope and rainfall on landslides in debris flow source area will be deeply analyzed, which will provide more data support for geological disaster prevention. In the future study, we will identify the hidden dangers of geological disasters in the whole area of Dongchuan District, conduct in-depth research on the distribution patterns, influencing factors and development characteristics of disasters, and conduct sequence analysis and inducement analysis of key geological disaster areas. That is how we can provide the scientific basis for regional geological disaster investigation and prevention.
Data availability statement
The original contributions presented in the study are included in the article/supplementary material, further inquiries can be directed to the corresponding author.
Author contributions
Writing-original draft preparation, XZ; writing-review and editing, SG and XY; investigation, XZ and HZ; data curation, XW.
Funding
This study was supported by the National Natural Science Foundation of China (Grant No. 41861054), Scientific Research Foundation of Yunnan Education Department (Grant No. 2019J0889), and Science Foundation of Kunming Metallurgy College (Grant No. 2021XJZK13). The Sentinel-1A images (https://scihub.copernicus.eu/) and DEM were provided by the European Space Agency (ESA) and the United States Geological Survey (USGS), respectively. Precipitation data were provided by the University of East Anglia Climatic Research Unit (CRU).
Conflict of interest
The authors declare that the research was conducted in the absence of any commercial or financial relationships that could be construed as a potential conflict of interest.
Publisher’s note
All claims expressed in this article are solely those of the authors and do not necessarily represent those of their affiliated organizations, or those of the publisher, the editors and the reviewers. Any product that may be evaluated in this article, or claim that may be made by its manufacturer, is not guaranteed or endorsed by the publisher.
References
Ali, S., Biermanns, P., Haider, R., and Reicherter, K. (2019). Landslide susceptibility mapping by using a geographic information system (GIS) along the China–Pakistan Economic Corridor (Karakoram Highway), Pakistan. Nat. Hazards Earth Syst. Sci. 19 (5), 999–1022. doi:10.5194/nhess-19-999-2019
Calcaterra, S., Cesi, C., Di Maio, C., Gambino, P., Merli, K., Vallario, M., et al. (2010). Surface displacements of two landslides evaluated by GPS and inclinometer systems: A case study in southern apennines, Italy. Nat. Hazards (Dordr). 61 (1), 257–266. doi:10.1007/s11069-010-9633-3
Dong, J., Liao, M. S., Xu, Q., Zhang, L., Tang, M., and Gong, J. Y. (2018). Detection and displacement characterization of landslides using multi-temporal satellite SAR interferometry: A case study of danba county in the dadu River Basin. Eng. Geol. 240, 95–109. doi:10.1016/j.enggeo.2018.04.015
Ferretti, A., Prati, C., and Rocca, F. (2000). Nonlinear subsidence rate estimation using permanent scatterers in differential SAR interferometry. IEEE Trans. Geosci. Remote Sens. 38 (5), 2202–2212. doi:10.1109/36.868878
Froude, M. J., and Petley, D. N. (2018). Global fatal landslide occurrence from 2004 to 2016. Nat. Hazards Earth Syst. Sci. 18 (8), 2161–2181. doi:10.5194/nhess-18-2161-2018
Guo, Z., Chen, L., Yin, K., Shrestha, D. P., and Zhang, L. (2020). Quantitative risk assessment of slow-moving landslides from the viewpoint of decision-making: A case study of the three Gorges Reservoir in China. Eng. Geol. 273, 105667. doi:10.1016/j.enggeo.2020.105667
Huang, J. L., Bai, Y., Lei, S. G., and Deng, K. Z. (2020). Time-series SBAS Pixel offset tracking method for monitoring three-dimensional deformation in a mining area. IEEE Access 8, 118787–118798. doi:10.1109/access.2020.3004460
Li, H., He, Y., Xu, Q., Deng, j., Li, W., and Wei, Y. (2022). Detection and segmentation of loess landslides via satellite images: A two-phase framework. Landslides 19, 673–686. doi:10.1007/s10346-021-01789-0
Li, Y. X., Zhang, Y., Su, X. J., Zhao, F. M., Liang, Y. W., Meng, X. M., et al. (2021). Early identification and characteristics of potential landslides in the Bailong River Basin using InSAR technique. Natl. Remote Sens. Bull. 25 (2), 677–690. doi:10.11834/jrs.20210094
Liu, H. (2019). Surface deformation monitoring based on time series InSAR technique in Dongchuan Distinct, Kunming. Kunming: Kunming University of Science and Technology.
Liu, X., Zhao, C., Zhang, Q., Lu, Z., Li, Z., Yang, C., et al. (2021). Integration of Sentinel-1 and ALOS/PALSAR-2 SAR datasets for mapping active landslides along the Jinsha River corridor, China. Eng. Geol. 284, 106033. doi:10.1016/j.enggeo.2021.106033
Ng, A. H.-M., Ge, L., and Li, X. (2015). Assessments of land subsidence in the Gippsland Basin of Australia using ALOS PALSAR data. Remote Sens. Environ. 159, 86–101. doi:10.1016/j.rse.2014.12.003
Pour, A. B., and Hashim, M. (2017). Application of Landsat-8 and ALOS-2 data for structural and landslide hazard mapping in Kelantan, Malaysia. Nat. Hazards Earth Syst. Sci. 17 (7), 1285–1303. doi:10.5194/nhess-17-1285-2017
Rehman, M. U., Zhang, Y., Meng, X., Su, X., Catani, F., Rehman, G., et al. (2020). Analysis of landslide movements using interferometric synthetic aperture radar: A case study in hunza-nagar valley, Pakistan. Remote Sens. 12 (12), 2054. doi:10.3390/rs12122054
Shen, Y. H., Zhang, J. G., Mao, Y., Zheng, D. C., Pang, W. D., and Liu, W. X. (2012). The character of tectonic stress in Xiaojiang fault zone and surrounding areas. J. Yunnan Univ. Nat. Sci. Ed. 34 (3), 308–314.
Shi, X. G., Liao, M. S., Li, M. H., Zhang, L., and Cory, C. (2016). Wide-area landslide deformation mapping with multi-path ALOS PALSAR data stacks: A case study of three Gorges area, China. Remote Sens. 8 (2), 136. doi:10.3390/rs8020136
Shi, X., Jiang, H., Zhang, L., and Liao, M. (2017). Landslide displacement monitoring with split-bandwidth interferometry: A case study of the shuping landslide in the three Gorges area. Remote Sens. 9 (9), 937. doi:10.3390/rs9090937
Solari, L., Del Soldato, M., Raspini, F., Barra, A., Bianchini, S., Confuorto, P., et al. (2020). Review of satellite interferometry for landslide detection in Italy. Remote Sens. 12 (8), 1351. doi:10.3390/rs12081351
Wang, G. J., Wang, Y. L., Zang, X. S., Zhu, J., and Wu, W. (2019). Locating and monitoring of landslides based on small baseline subset interferometric synthetic aperture radar. J. Appl. Remote Sens. 13 (4), 1. doi:10.1117/1.jrs.13.044528
Wang, S. Y., Lu, X. P., Liu, X. B., and Fu, S. N. (2019). A SBAS InSAR time series ground deformation extraction approach considering permanent scatters. Bull. Surv. Mapp. 2, 58–62. doi:10.13474/j.cnki.11-2246.2019.0044
Wang, Y. F., Gan, S., Yuan, X. P., and Zhang, J. M. (2020). SBAS technology applied to surface deformation monitoring in dongchuan area. Softw. Guide 19 (9), 165–168. doi:10.11907/rjdk.201066
Wang, Y., Hong, M., Shao, D. S., and Wang, Z. M. (2018). Study on dynamic characteristics of crustal deformation in Yunnan area using GPS. J. Seismol. Res. 41 (3), 368–374.
Wasowski, J., and Bovenga, F. (2014). Investigating landslides and unstable slopes with satellite Multi-Temporal Interferometry: Current issues and future perspectives. Eng. Geol. 174, 103–138. doi:10.1016/j.enggeo.2014.03.003
Yang, C. S., Dong, J. H., Zhu, S. N., and Xiong, G. H. (2021). Detection, identification and deformation characteristics of landslide groups by InSAR in batang section of Jinsha River convergence zone, China[J]. J. Earth Sci. Environ. 43 (02), 398–408. doi:10.19814/j.jese.2020.12034
Yang, C. S., Zhang, Q., Zhao, C. Y., and Ji, L. Y. (2014). Small baseline subset InSAR technology used in datong basin ground subsidence, fissure and fault zone monitoring. Geomatics Inf. Sci. Wuhan Univ. 39 (8), 945–950. doi:10.13203/j.whugis20130656
Yang, Z., Zhu, Y., and Qian, S. (2016). Types and spatial distribution characteristics of debris flow disasters along China-Pakistan highway. Electron J. Geotech. Eng. 21, 191–200.
Yang, Z. Q., Zhu, Y. Y., Zou, D. H. S., and Liao, L. P. (2011). Activity degree evaluation of glacial debris flow along international karakorum highway (KKH) based on fuzzy theory. Adv. Mat. Res. 261-263, 1167–1171. doi:10.4028/www.scientific.net/amr.261-263.1167
Yun, Y., Lv, X. L., Fu, X. K., and Xue, F. Y. (2020). Application of spaceborne interferometric synthetic aperture radar to geohazard monitoring. J. Radars 9 (1), 73–85. doi:10.12000/JR20007
Zhang, L., Liao, M. S., Dong, J., Xu, Q., and Gong, J. Y. (2018). Early detection of landslide hazards in mountainous areas of west China using time series SAR interferometry-A case study of danba, sichuan. Geomatics Inf. Sci. Wuhan Univ. 43 (12), 2039–2049. doi:10.13203/j.whugis20180181
Zhang, X. L., Gan, S., Yuan, X. P., Zong, H. L., Liang, C. X., and Zhao, Z. F. (2022). Integrated space-air-ground time series monitoring and analysis for Shaba landslide in Dongchuan District. Kunming: Journal of Yunnan University: Natural Sciences Edition. doi:10.7540/j.ynu.20210390
Zhang, X. L., Yang, Y. P., Chen, Z., Shao, Y. Y., Chen, G. P., Wan, B. F., et al. (2021). The identification of landslide disasters around Dongchuan city based on D-InSAR. J. Kunming Metallurgy Coll. 37 (1), 38–44. doi:10.3969/j.issn.1009-0479.2021.01.007
Zhang, Y., Meng, X., Chen, G., Qiao, L., Zeng, R., and Chang, J. (2015). Detection of geohazards in the Bailong River Basin using synthetic aperture radar interferometry. Landslides 13 (5), 1273–1284. doi:10.1007/s10346-015-0660-8
Zhang, Y., Meng, X., Jordan, C., Novellino, A., Dijkstra, T., and Chen, G. (2018). Investigating slow-moving landslides in the Zhouqu region of China using InSAR time series. Landslides 15 (7), 1299–1315. doi:10.1007/s10346-018-0954-8
Zhao, C., Kang, Y., Zhang, Q., Lu, Z., and Li, B. (2018). Landslide identification and monitoring along the Jinsha River catchment (wudongde Reservoir area), China, using the InSAR method. Remote Sens. 10 (7), 993. doi:10.3390/rs10070993
Zhao, C. Y., Liu, X. J., Zhang, Q., Peng, J. B., and Xu, Q. (2019). Research on loess landslide identification, monitoring and failure mode with InSAR technique in heifangtai, gansu. Geomatics Inf. Sci. Wuhan Univ. 44 (7), 996–1007. doi:10.13203/j.whugis20190072
Zhao, C. Y., Lu, Z., Zhang, Q., and de la Fuente, J. (2012). Large-area landslide detection and monitoring with ALOS/PALSAR imagery data over Northern California and Southern Oregon, USA. Remote Sens. Environ. 124, 348–359. doi:10.1016/j.rse.2012.05.025
Zhao, F., Meng, X., Zhang, Y., Chen, G., Su, X., and Yue, D. (2019). Landslide susceptibility mapping of karakorum highway combined with the application of SBAS-InSAR technology. Sensors 19 (12), 2685. doi:10.3390/s19122685
Zhou, J., Wei, J., Yang, T., Zhang, P., Liu, F., and Chen, J. (2021). Seepage channel development in the crown pillar: Insights from induced microseismicity. Int. J. Rock Mech. Min. Sci. 145, 104851. doi:10.1016/j.ijrmms.2021.104851
Zhu, J. J., Li, Z. W., and Hu, J. (2017). Research progress and methods of InSAR for deformation monitoring. Acta Geod. Cartogr. Sinica 46 (10), 1717–1733. doi:10.11947/j.AGCS.2017.20170350
Keywords: SBAS-InSAR, debris flow source area, time series deformation monitoring, Dongchuan District, slope deformation
Citation: Zhang X, Gan S, Yuan X, Zong H and Wu X (2022) Slope deformation monitoring and early identification of disasters in debris flow source area of Baini River, Dongchuan District, China. Front. Earth Sci. 10:1000736. doi: 10.3389/feart.2022.1000736
Received: 22 July 2022; Accepted: 18 August 2022;
Published: 08 September 2022.
Edited by:
Yusen He, Grinnell College, United StatesReviewed by:
Jilei Huang, Henan University of Economic and Law, ChinaJia Lu, China Non-Ferrous Metals Resource Geological Survey, China
Copyright © 2022 Zhang, Gan, Yuan, Zong and Wu. This is an open-access article distributed under the terms of the Creative Commons Attribution License (CC BY). The use, distribution or reproduction in other forums is permitted, provided the original author(s) and the copyright owner(s) are credited and that the original publication in this journal is cited, in accordance with accepted academic practice. No use, distribution or reproduction is permitted which does not comply with these terms.
*Correspondence: Shu Gan, MTM3OTk1MjU0MUBxcS5jb20=
 Xiaolun Zhang
 Shu Gan1*