Abstract
In present paper, the mineral and fluid compositions of shale oil from the Songliao Basin are analyzed systematically using core samples, X-ray diffractometer (XRD), and gas chromatography (GC). The effects of shale mineral composition, pore size, temperature, and pressure on the mass density of the adsorbed layers are then studied utilizing molecular dynamics simulation. The results show that illite and quartz are predominant in the micro petrological components of the shale, and nC19 is the main carbon peak. The fluid consists primarily of n-alkane molecules, and nC19 is found to be representative of the shale oil composition. Moreover, the adsorbing effect of quartz-illite mixed wall is between that of a pure mineral wall (illite and quartz), indicating that the selection of a mixed wall is similar to the actual shale composition. If the pores are inorganic, the minimum pore size of only adsorption oil is smaller than the organic pores. The critical adsorption point of shale oil in inorganic pores is less than 3.2 nm. Furthermore, compared to pressure, the temperature has a more significant effect on fluid adsorption due to the correlation with the kinetic energy of alkane molecules. This research shows the oil occurrence status in inorganic matter nanopore with a mixed solid wall, and provides theoretical support for shale oil exploration.
Introduction
A continuous decline in conventional oil reserves has led to increasing attention to unconventional oil resources (Awan et al., 2021), especially shale oil, due to its vast number of resources and considerable production rate after fracturing (Zhou et al., 2020a; Zhou et al., 2020b). The output of shale oil in the United States has reached 60% of the total output of crude oil (Dong et al., 2011). The geological resources of continental shale oil achieved approximately 3,700 × 108 tons in the major continental basins in China (Yang et al., 2018), especially the Gulong Shale oil in the Daqing Oilfield, reported having nearly 1.3 billion tons of oil (Liu et al., 2021a; Jin et al., 2021; Sun et al., 2021). Shale oil is stored in an organic-rich source rock with ultralow porosity (Zou et al., 2015). Pores consist of interparticle pores, intraparticle pores, and organic matter pores (Loucks et al., 2012; Liu et al., 2021b). The diameters of the pores range from 5 to 200 nm and can be measured using field emission scanning electron microscopy (FE-SEM) and nano-CT techniques (Zou et al., 2010). In such nanopores, the interactions between fluid molecules and the substrate surface are dominant (Li et al., 2019). Significant shale heterogeneity and widespread nanopores led to different occurrence states of hydrocarbons and fluid transport compared to conventional reservoirs. Due to surface adsorption, uneven fluid distribution, and transport, the resource estimation, total volume flux, and economic evaluation are affected. They are also affected by other various factors, such as temperature, pressure, and pore size. X-ray diffraction (XRD) analysis shows that shales are typically composed of diverse amounts of inorganic minerals (Loucks et al., 2012). These materials in various combinations can affect the occurrence and distribution of shale oil. Kelly studied the pore size distribution of unconnected, fabricated silica and borosilicate glass nanochannels and showed a positive correlation between the saturation of the imbibing fluid and unique disjoining pressure of the fluid (Kelly 2013). Guo et al. (2015) studied gas flow behavior in nanomembranes, utilizing the advection-diffusion model while considering slip flow and Knudsen diffusion. A new formula for apparent permeability and flow rate was theoretically derived.
Molecular dynamics simulation methods (MD) have been applied broadly in studying the surface of minerals and organic matter (Beckers and Leeuw, 2000; Martic et al., 2002; Jin and Firoozabadi, 2015). Severson and Snurr (2007) evaluated single-component adsorption of alkanes (C5 and C15) in carbon slit pores. They summarized the adsorption of long alkanes and short alkanes at different temperatures. Wang et al. (2015a), Wang et al. (2015b), Wang et al. (2016) studied the adsorption of liquid alkanes (C5 and C8) in shale nanopores using molecular dynamics. Periodic fluctuation of density distribution in organic (six-layer graphene) and inorganic (quartz) slits were found. Li et al. (2019) simulated oil-water two-phase flow in graphite pore. They concluded that the total oil-water flow rate depended on the mixture composition. Zhang et al. (2021) studied the occurrence state and flow behavior of water-nC8 in calcite nanopores. It was concluded that Darcy’s law could describe nC8 when the water content was large enough. Dong et al. (2021) constructed “organic matter-oil-water,” “quartz-oil-water,” and “kaolinite-oil-water” models, studied the morphological changes of different oil components (C6, C12, C14, and C18) and water on different surfaces. Cao et al. (2020) evaluated the adsorption of saturated hydrocarbon, aromatic hydrocarbons, and resin in the slits of clay minerals. Although previous numerical simulation studies provided essential insights into the occurrence state and liquid flow mechanisms in shale nanopores, most focused on the single composition pore wall. Furthermore, the fluid model selection was mainly based on literature or hypothesis rather than experiment. No documented study has been found that investigated the effect of temperature, pressure, and pore size on the occurrence states of liquid alkane under the condition of a mixed shale wall. Therefore, in present study, we focus on the experiment result of XRD and GC on the Songliao Basin shale, using equilibrium molecular dynamics simulation to investigate the adsorption characteristics of oil in the inorganic matter mixed solid wall and single mineral solid wall of shale. The effect of pore size, temperature, and pressure on the mass density in mixed shale walls are discussed. Finally, the radial distribution function and intermolecular force are analyzed. In this paper, the composition of shale wall is further close to the actual situation, which will provide theoretical guidance for the development of shale oil reservoir.
Mineral Composition and Fluid Component of Shale
The mineral composition is an essential factor in the development of shale oil resources. It affects the brittleness of the shale, the pore structure distribution in a shale reservoir, and the seepage characteristics. The most widely used method of mineral percentages determination is XRD (Cody and Thompson, 1976). The principle behind XRD is to obtain the characteristics of X-ray signal using the diffraction phenomenon of an X-ray interacting with the crystalline structure of a material; the crystal structure is analyzed according to the spectrum information (Han et al., 2019; Ibrahim et al., 2020). Shale oil is rich in alkanes, arenes, nitrogen-, sulfur-, and oxygen-containing non-hydrocarbons (Ibrahim et al., 2020). The physical and chemical properties of the oil composition significantly impact the subsequent exploitation; hence, it is critical to understand the components and their contents in shale oil.
The mineral composition and fluid composition are studied taking the organic-rich shale in the first member of Qingshankou Formation in the Songliao Basin. The shale oil resource in the Qingshankou Formation is a new resource target for shale oil exploration in Northeast China. Shale oil in the Qingshankou Formation represents the typical continental shale oil reservoirs, the average total organic carbon (TOC) content exceeding 2%, the organic matter is mostly type I kerogen, Ro ranges from 0.5 to 1.2% (Liu et al., 2017). Ten shale samples from the first member of Qingshankou Formation in the Songliao Basin are measured using XRD, the composition of the whole shale and clay minerals are shown in Figure 1; the fluid composition of shale oil is measured by gas chromatograph (GC), analysis results are shown in Figure 2 and Table 1.
FIGURE 1
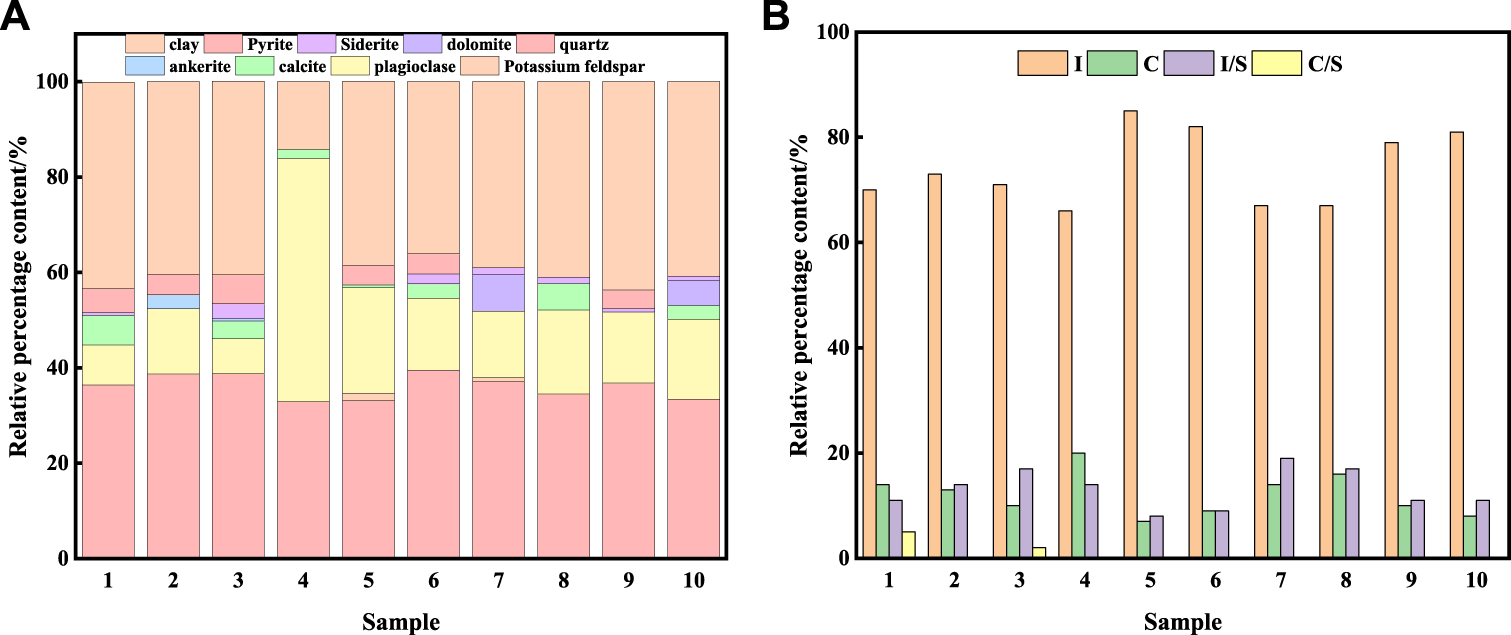
Shale mineral composition. (A) Composition of the whole shale; (B) Clay mineral composition.
FIGURE 2
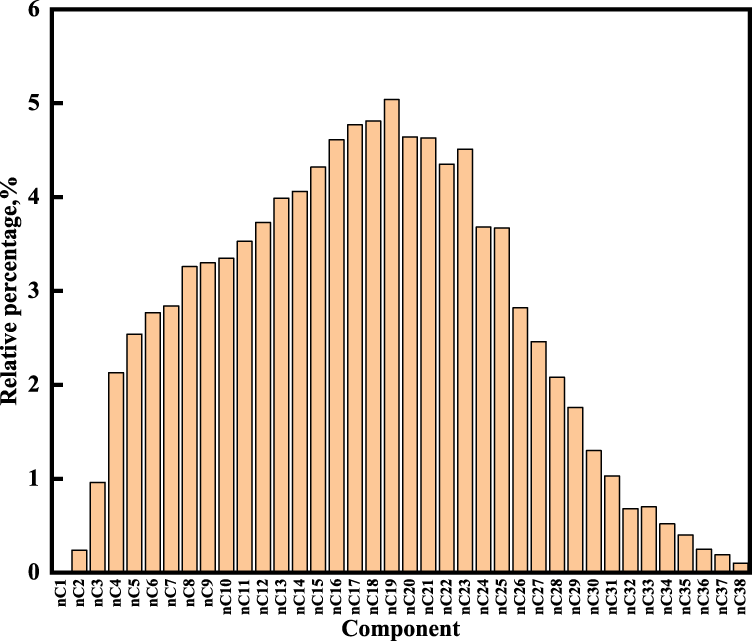
Fluid component analysis results.
TABLE 1
| Main carbon peak | Pr/Ph | Pr/nc17 | Ph/nc18 | OEP | ∑C21−/C22+ | C21 + C22/C28 + C29 | Range of carbon number |
|---|---|---|---|---|---|---|---|
| nC19 | 0.96 | 0.13 | 0.13 | 1.05 | 2.28 | 2.34 | nC2-nC38 |
Analysis results of total hydrocarbon gas chromatography.
The mineral components of ten shale core samples varied, although mainly consisting of clay minerals, quartz, plagioclase, calcite, pyrite, and siderite. Overall, the shale is mainly composed of quartz and clay minerals. The main clay minerals are illite (I), chlorite I, mixed-layer minerals of illite and smectite (I/S), and a very small amount of mixed-layer minerals of chlorite and smectite (C/S). The average contents of I, C, I/S are 74.1, 12.1, 13.1%, respectively. Illite accounts for 83.1% in the (I/S) and is the main component in clay minerals. It can be concluded that the main components in shale samples are quartz and illite, with average contents of 37.7% clay minerals and 36.12% quartz.
The GC analysis showed that the carbon numbers of n-alkane ranged from C2 to C38. The main fraction of the shale sample is the neutral fraction with 87.08%, which chiefly consists of C8∼C33, with a maximum at C19. The ∑C21−/C22+ ratio is 2.28, indicating a weak predominance of long-chain n-alkanes. The pristane/phytane (Pr/Ph) ratio is 0.96, implying that the shale oil derived from source rock is deposited under a reducing environment (Wang et al., 2018). The value of OEP is 1.05, indicating that the sediment consists of mature organic matter.
Models and Simulations
Models Information
The shale pore and shale oil were denoted by the illite-quartz mixed substrate and nC19, respectively, based on experiments analysis results. The illite unit cell was imported from the AMCSD (American Mineralogist Crystal Structure Database) (Downs and Hall-Wallace, 2003). The original lattice parameters were a = 5.2021Å, b = 8.9797 Å, c = 10.226 Å, α = 90°, β = 101.57°, γ = 90°. A quartz model was built using the software Materials Studio using the α-quartz crystal from the database with lattice parameters of a = 4.91 Å, b = 4.91 Å, c = 5.402 Å, α = 90°, β = 90°, γ = 120°. The illite-quartz mixed unit cell was constructed (Figure 3), then expanded to a supercell of 10 × 2×2 to obtain a substrate surface with a size of 5.3 × 4.8 × 1.8 nm3. A slit-shaped pore was built using two mixed sheets, nC19 was the major component of the shale oil in the Songliao Basin; therefore, nC19 was used to represent the oil.
FIGURE 3
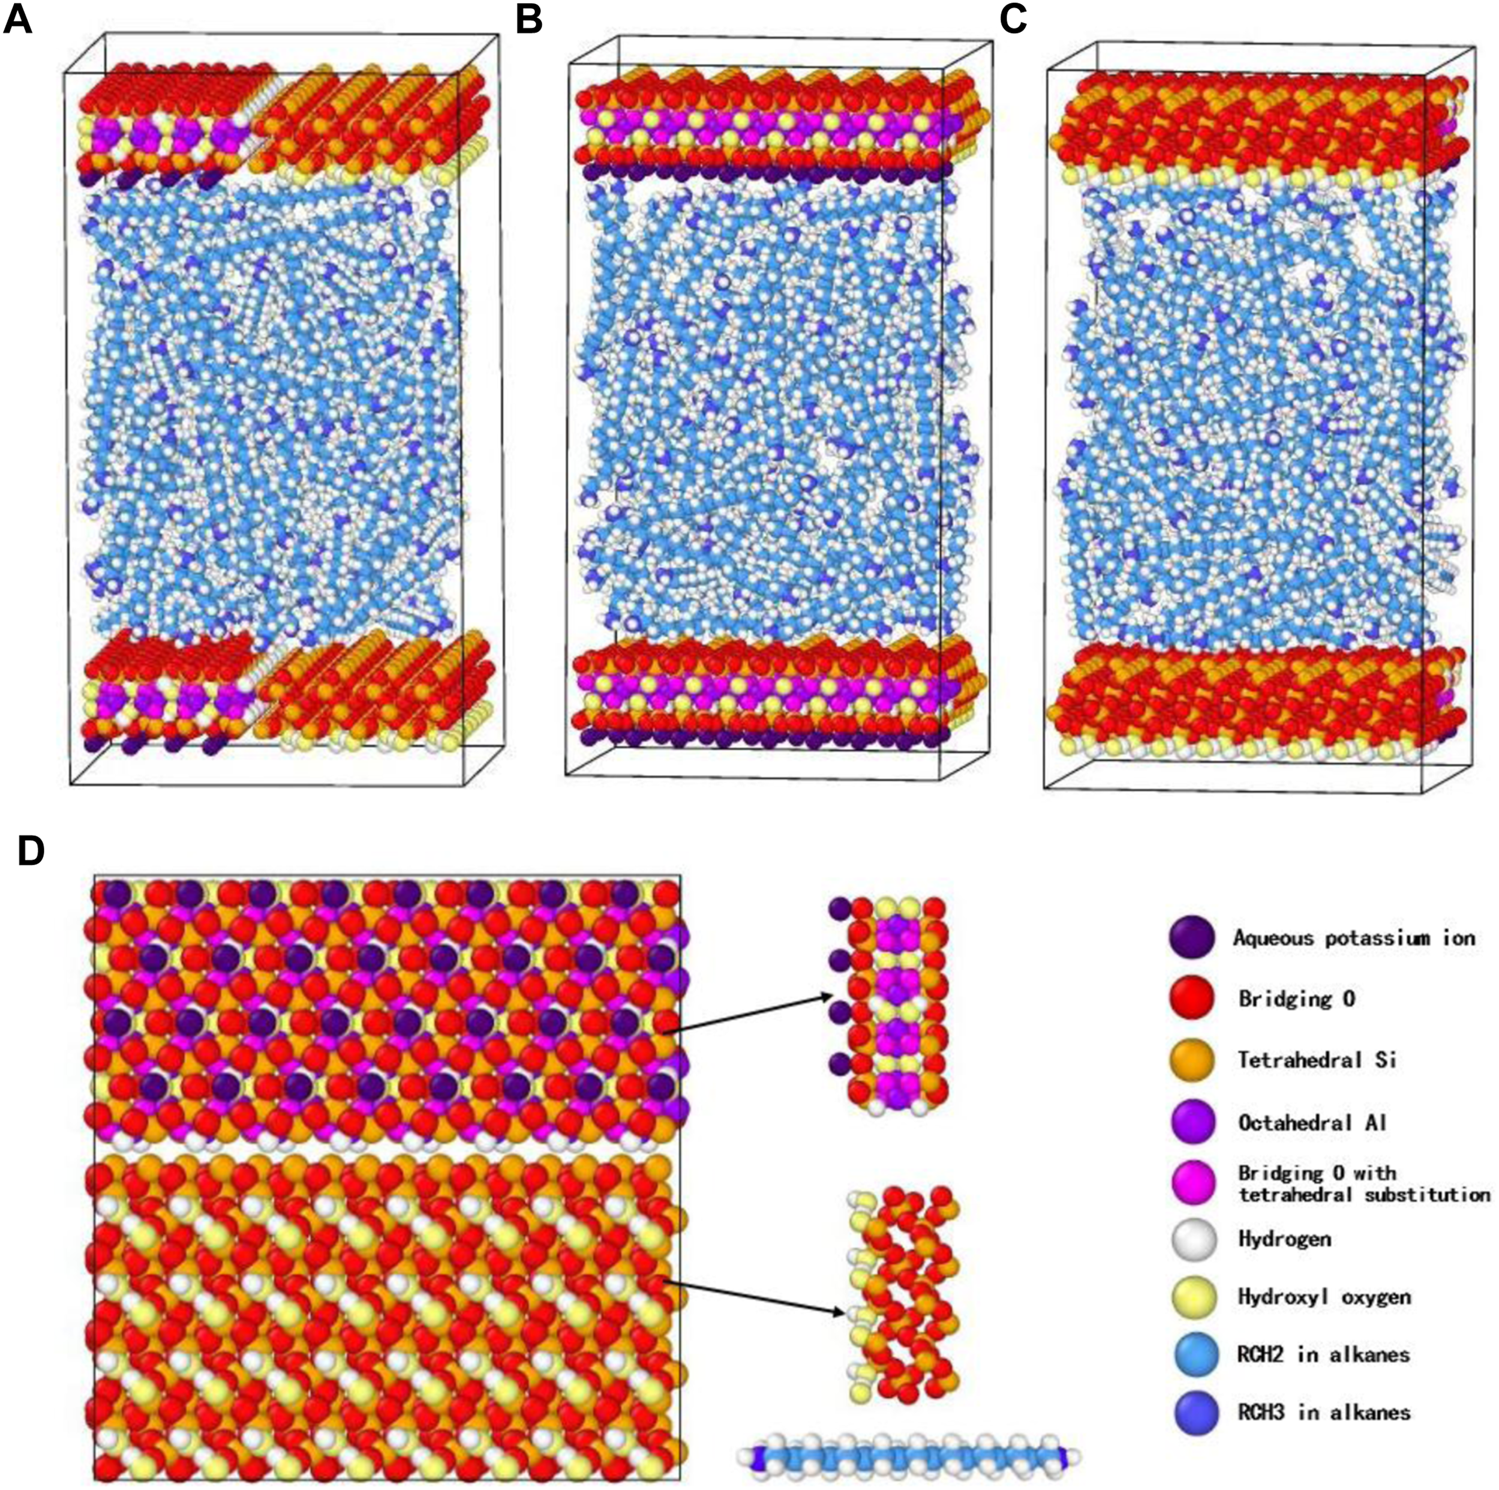
Snapshot (front view) of the initial system for nC19 in a 5 nm pore. (A) Front view; (B) Left view-illite; (C) Right view-quartz; (D) Top view.
The conjugate gradient algorithm was applied to minimize the initial configuration to prevent molecular overlap or the distance being too short. Periodic boundary conditions were applied in all three directions. A vacuum with a thickness of 1 Å was added in the z-direction to minimize the boundary effects. The force field of a mixed surface was developed by Cygan et al. (2004) and used here. The CLAYFF explicitly described the atomic interaction of T-O-T structure clay and cations. Meanwhile, it considered only angle bend and bond stretch terms for water molecules, hydroxyls. Hence, this potential model was used to characterize the illite-quartz mixed substrate. The Lorentz-Berthelot mixing rules were used to calculate the interaction parameters between the unlike atoms ij (Cygan et al., 2004). OPLS All-Atom force field was employed to mimic the nC19 molecules, and geometric mixing rules solved the parameters of Lennard Jones interaction between different atoms. The mixing rules of the CLAYFF force field and OPLS were different. Sun et al. (2018), Zhao et al. (2018), Li et al. (2019) have documented the use of the Lorentz-Berthelot mixing rule to obtain the interaction parameters between clay and organic materials. Ye et al. (2013) stated that a scaling factor of 0.5 (default) for the 1-4 intramolecular interactions in the OPLS All-Atom force field is appropriate for linear alkane chains with less than 10 carbon atoms. It yields quasi-crystalline structures when the alkane chain has 12 or more carbon atoms. Therefore, a scaling factor of 0.3 was used here for the 1-4 intramolecular interactions in all nC19 molecules.
Simulation Details
The EMD simulations were performed with the Large-scale Atomic-Molecular Massively Parallel Simulator (LAMMPS) package. The cutoff distance was set to 12 Å, as the cutoff distance cannot be greater than half of the minimum simulated box size. Long-range electrostatic interactions were calculated by the Fourier-based Ewald summation method. The accuracy of the particle-to-particle mesh method was set to a precision value of 10−6, nC19 molecules were initially randomly placed in the illite-quartz mixed nanopores. The number of nC19 molecules was calculated by the density and pore size of a sample. A time step of 1 fs was used for 5,000 ps to reach simulation equilibrium in the NPT ensemble. The pressure was maintained by the Parrinello-Rahman barostat (Parrinello and Rahman, 1981) while the temperature was controlled at a constant level by the Nose Hoover thermostat (Nosé, 1984). The system equilibration and the trajectory were collected for data analysis. The initial simulations were run at 373 K, 322 atm in the 5 nm slab spacing. The results were then evaluated to determine the influence of pore size under a pressure of 322 atm and a temperature of 373 K. The pore size of the systems varied from 2.0 to 7.2 nm. The impact of temperature was assessed by varying from 363 to 383 K. The effect of pressure was varied from 272 to 372 atm. The occurrence state under different conditions of nC19 in the slit-shaped illite-quartz mixed nanopores was studied by EMD. Figure 4 shows that the system’s energy, temperature, and pressure eventually stabilized, indicating that the simulation time was enough to reach equilibrium. The simulation snapshots were created by OVITO 3.0.0 (Stukowski, 2010).
FIGURE 4
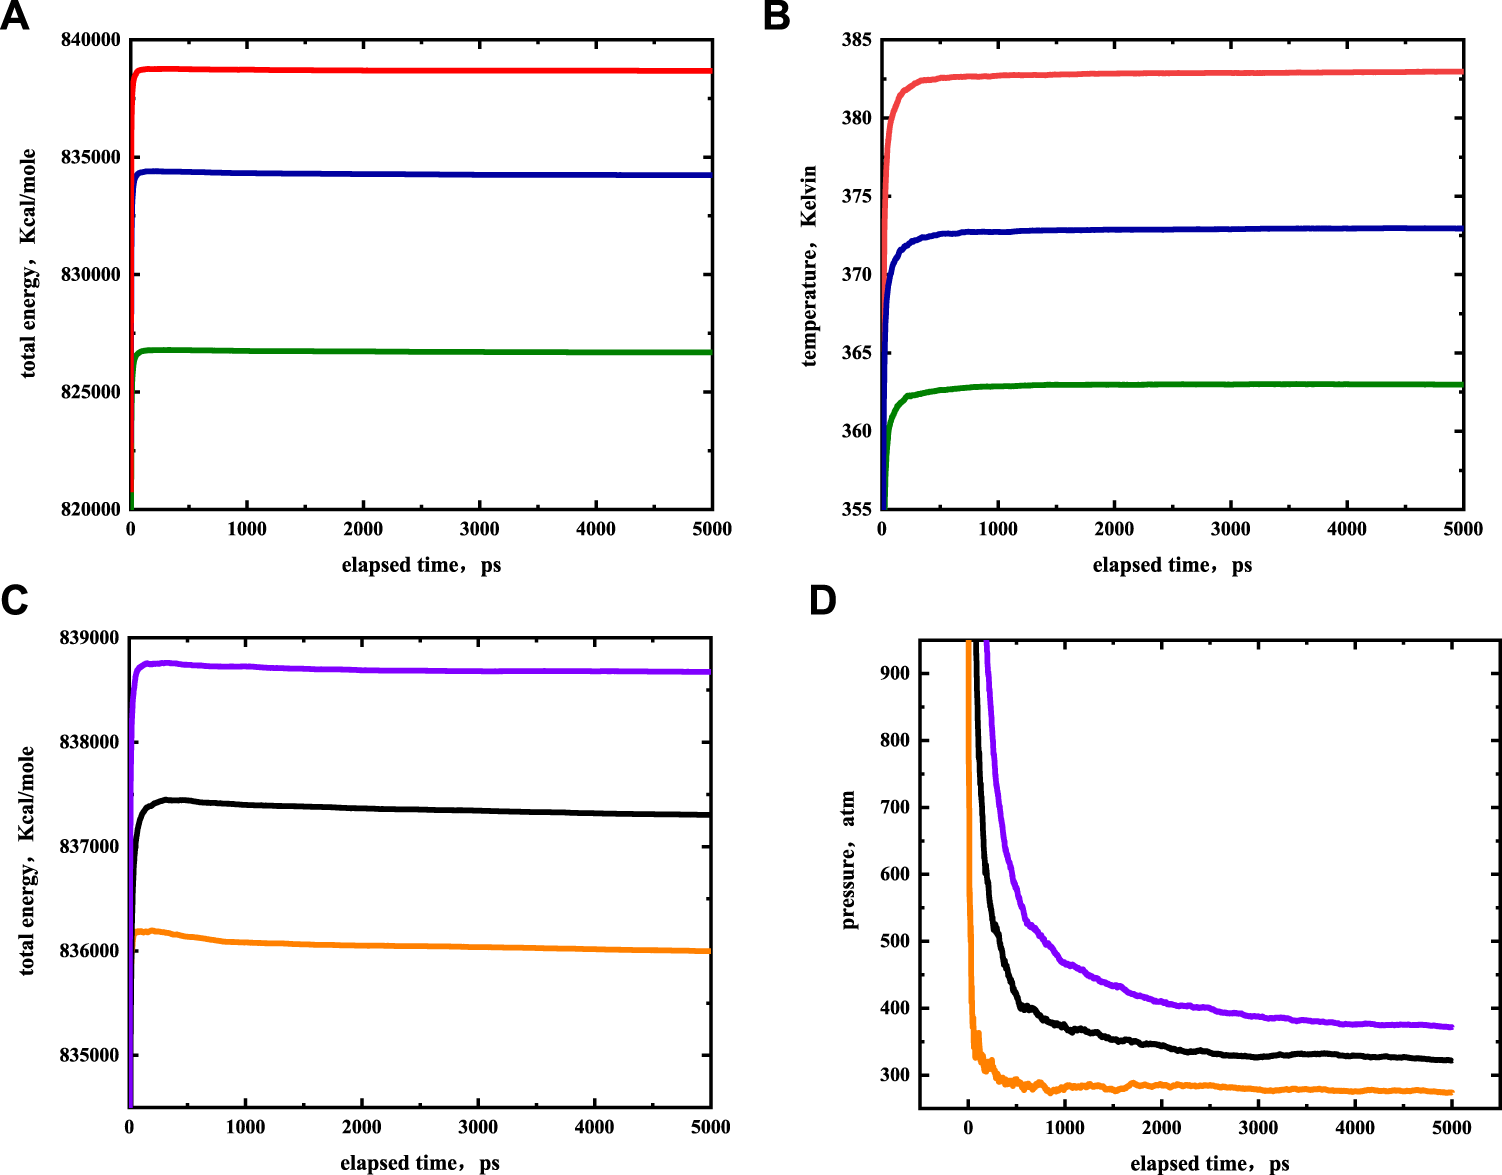
Simulation results of nC19H40 in equilibrium stage at different temperatures (A,B) and pressure (C,D). The red, blue, green colors represent temperatures of 383, 373, 363 K, the purple, black and orange colors represent pressures of 372, 322, 272 atm, respectively.
Results and Discussion
Effect of Shale Composition on Adsorption
Figure 5 shows the density distributions of the fluid in a single-component pore and multi-component mixture pore. The red curve is the result for quartz, the green curve is the result of illite, and the black curve is the result of the quartz-illite mixed solid wall. Four ordered adsorbed layers lie parallel to the multi-component solid wall, three adsorbed layers lie parallel to the single-component solid wall. The average mass density of each adsorbed layer for quartz, quartz-illite mixed, and illite are 1.205, 1.055, and 0.894 g/cm3. In contrast to illite, the quartz is easier to adsorb the alkane molecules. In addition, the adsorption effect of the quartz-illite mixed wall is between that of the pure mineral walls, indicating that the selection of a mixed wall is closer to actual shale samples.
FIGURE 5
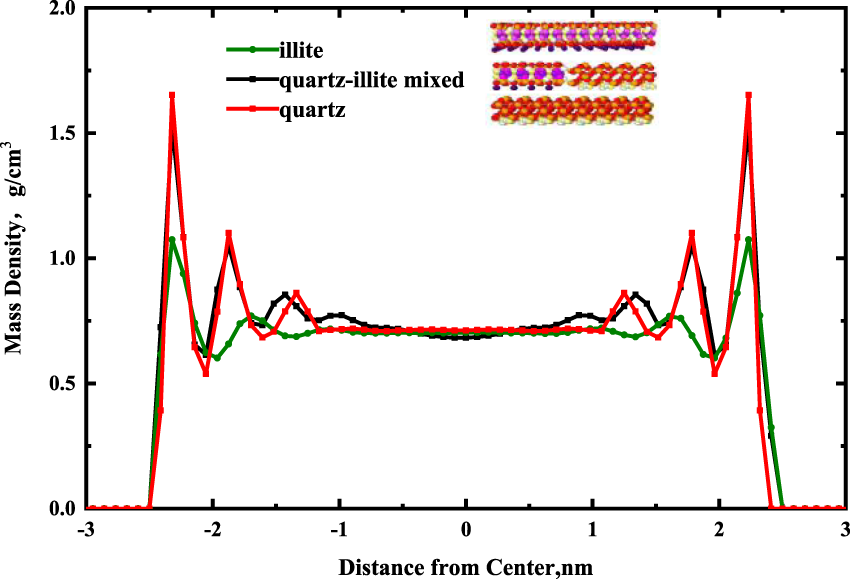
Effects of single-component pore and multi-component mixtures pore on the mass density profiles for alkanes in a 5 nm pore.
Effect of Pore Size on n-Alkanes Adsorption
In Figure 6A, we presented the continuous mass density profiles of nC19 in mixed nanopores at pore sizes of 2, 3.2, 5, and 7.2 nm. As it depicted in Figure 6A, there are only two adsorbed layers in a 2.0 nm pore. The pore is entirely occupied by adsorbed phase, and no bulk phase is present. Four symmetric adsorbed layers form in other nanopores. The peak density of the adsorbed layer increases with distance from the pore center. Compared with the density distribution curve of chain alkanes in other pores (such as graphene, silica, calcite, montmorillonite), the adsorption layer of alkanes molecules near the pore wall is a common phenomenon (Ledyastuti et al., 2012; Le et al., 2015). The difference is the adsorption layer density value is associated with the composition of the pore wall. Figure 7 shows the equilibrium configurations snapshots of nC19 in a 5 nm pore. The alkane molecules in the near-wall region aggregate together at a high density. The distribution of the bulk fluid molecules is relatively scattered with a low molecular density. In the 3.2 nm pore, the density of the first adsorbed layer (0.770 g/cm3) is approximately 1.11 times that of the bulk phase. The density of the second adsorbed layer (0.835 g/cm3) is approximately 1.20 times that of the bulk phase. The density of the third and the fourth adsorbed layer (1.051, 1.430 g/cm3) are approximately 1.51 times and 2.06 times that of the bulk phase; the average density of adsorbed layer is 1.022 g/cm3. In the 5 nm pore size, the mass density ratios between the first, second, third, fourth adsorbed layer and the bulk phase range from 1.13 to 2.21. In the 7.2 nm pore size, the mass density ratios range from 1.20 to 2.45. The average density of each adsorption layer increased with the pore size. The density of bulk fluid under each pore size was about 0.691 g/cm3, which was close to the experimental result (0.724 g/cm3). The spacing between two adjacent crests estimated the thickness of each adsorbed layer. The adsorbed layers of different pore sizes were then compared. The thicknesses of the first and second adsorbed layers are about 4.4 and 5.6 Å in a 2.0 nm pore. The thicknesses of the first adsorbed and other adsorbed layers are about 2 and 3.5 Å in a 3.2 nm pore. The values in a 5 nm pore are 3.5 and 5.5 Å. In 7.2 nm pore, the thicknesses are 5.5 and 7.5 Å. The thickness of the first adsorbed layer is smaller than the other three adsorbed layers. The interactions between the mixed solid surface and nC19 molecules gradually decreased, and the intermolecular interactions among nC19 molecules were enhanced. Figure 6B depicts the total thickness of the adsorbed phase and bulk phase. All adsorption phases are present in 2 nm pores; the thickness of adsorbed phase is 20 Å. The thicknesses of the adsorbed phase are 26 Å (3.2 nm), 40 Å (5 nm), and 55 Å (7.2 nm). The thicknesses of the bulk phase are 6 Å (3.2 nm), 10Å (5 nm), and 17 Å (7.2 nm). The value “a/b” represented the ratio of the thickness of the adsorbed phase to the bulk phase. With an increase in pore size, the value “a/b” decreases.
FIGURE 6
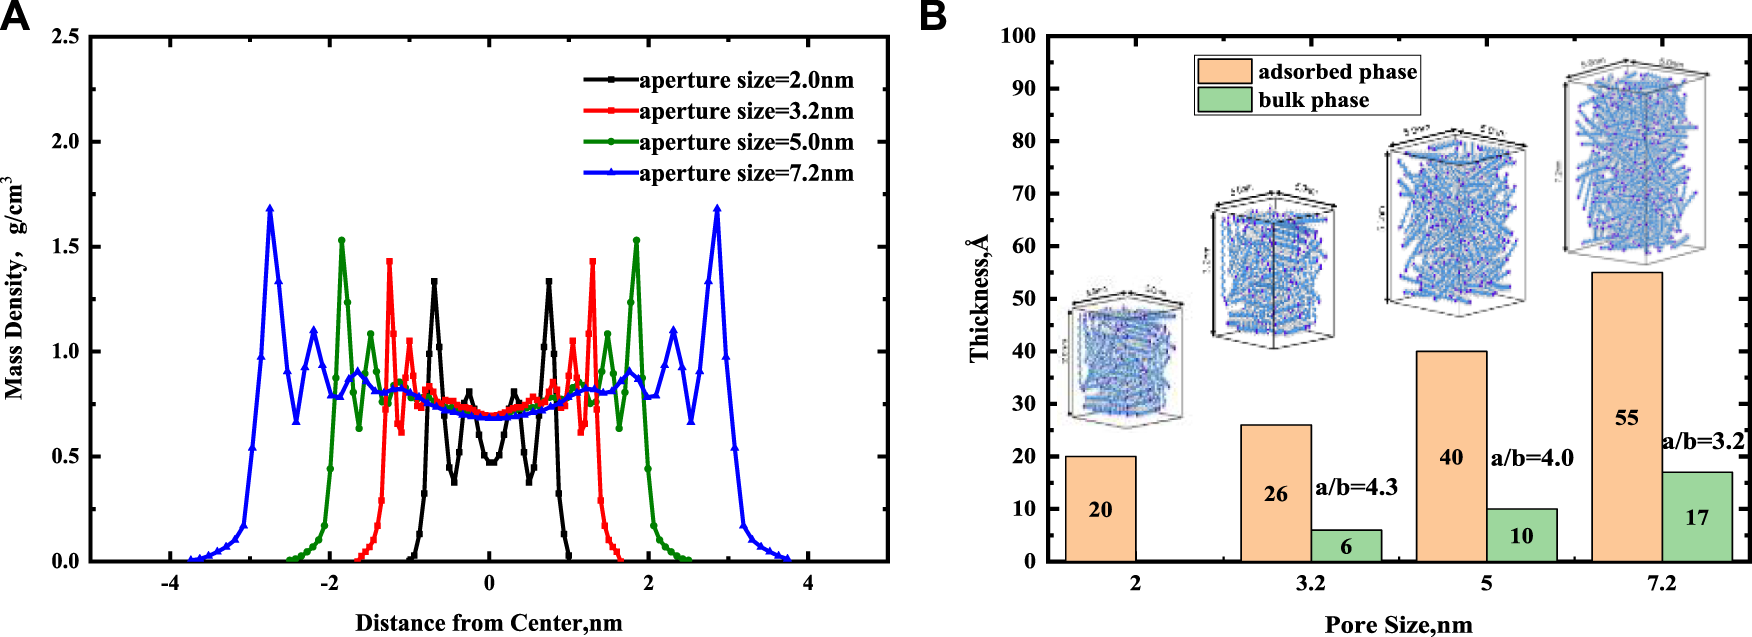
(A) Effect of pore size on the continuous mass density profiles for nC19 in the mixed nanopores. (B) The thickness of adsorbed phase and bulk phase at different pore sizes.
FIGURE 7
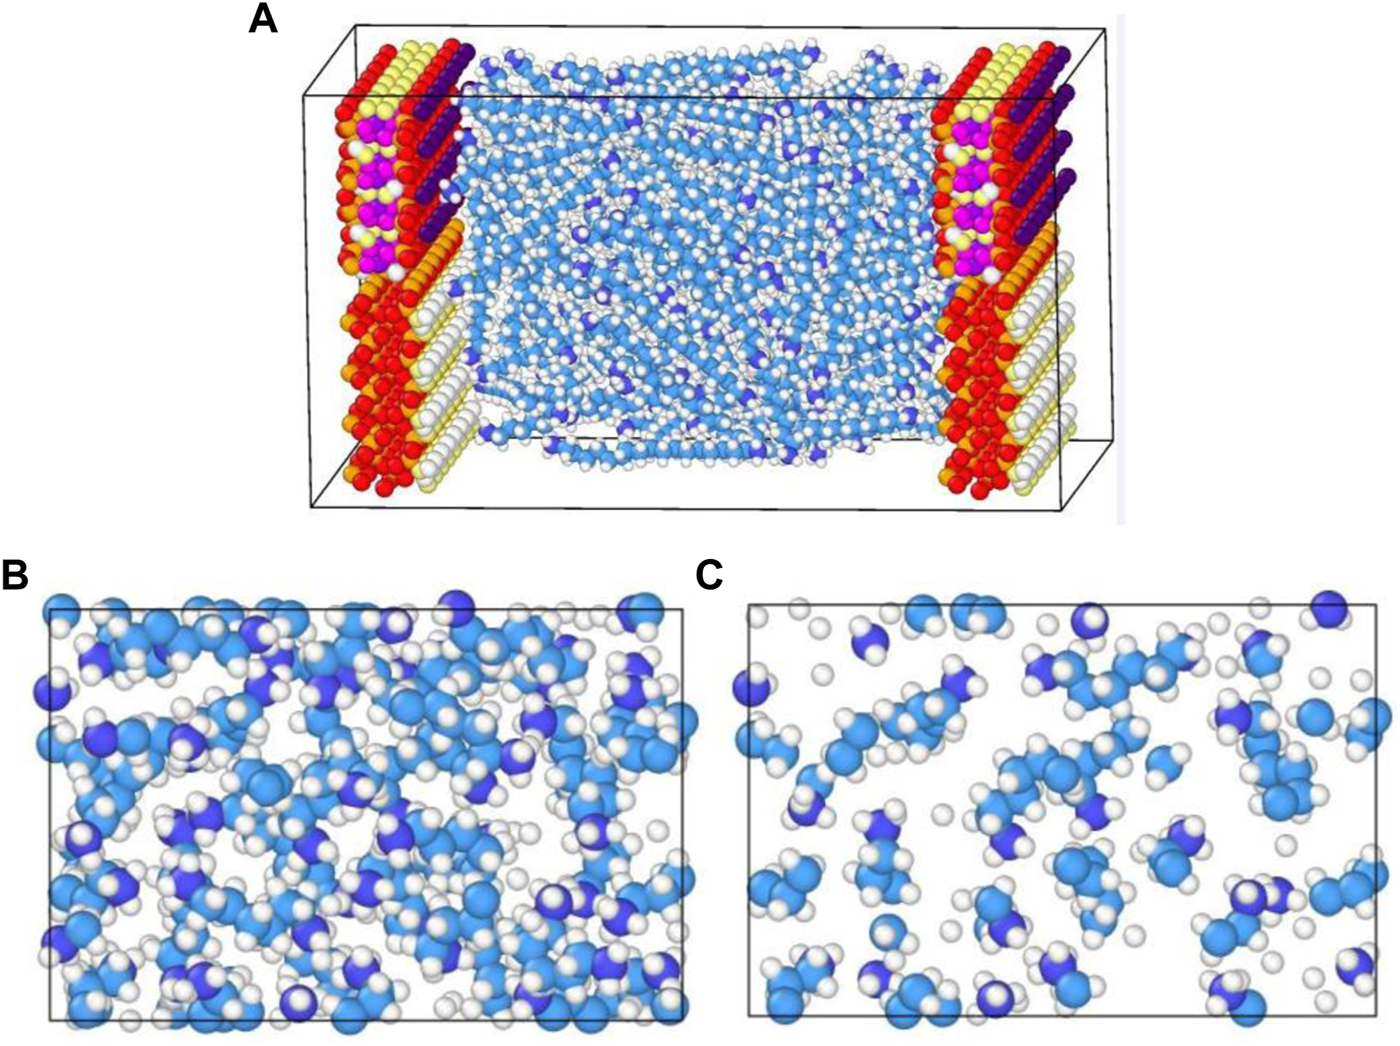
(A) Equilibrium configurations snapshots of nC19 in mixed nanopores; (B) Snapshot showing the fluid distribution of nC19 in the near-wall region; (C) Snapshot showing the fluid distribution of nC19 in a bulk region.
Overall, the pore size affects the fluid distribution of the adsorbed phases and bulk phases, and there must be a minimum size where the pores are filled with adsorbed phase fluids and no bulk phase fluids. Wang W et al. (2015) proposed that if an organic pore is less than 3.84 nm, there will be only adsorption of n-octane and no free oil. Moreover, 3.84 nm corresponds to the thickness of the eight alkane layers. In our work, when the inorganic mixed solid wall is less than 3.2 nm, there is no bulk phase, and the thickness of eight alkane layers is about 3.6 nm. Bulk oil still exists in the 3.2 nm pore, indicating that when the pore is inorganic, the minimum pore size of only adsorption oil may be smaller than the organic pore.
Effect of Pressure on n-Alkanes Adsorption
Figure 8A shows that the continuous mass density profiles of nC19 in 5 nm mixed nanopores at pressures of 272, 322, and 372 atm under a temperature of 373 K. There is no noticeable deviation among the mass density profiles of the adsorbed phases for the different pressures. It was probably due to capillary condensation; the reservoir pressure is greater than the saturated vapor pressure of alkanes. With an increase in pressure, the adsorption capacity of alkanes on the pore wall hardly changed. The densities of the first adsorbed layer under different pressures are 0.780, 0.783, 0.783 g/cm3, respectively, almost unchanged. The densities of the bulk fluid in the center of the pore are 0.695, 0.694, and 0.684 g/cm3, respectively. With an increase in pressure, there is a certain influence on the bulk fluid density. The results show that the bulk fluid density values agree with the experimental data. The relative errors are about 4.05, 4.15, and 5.52% at 272, 322 and 372 atm, respectively.
FIGURE 8
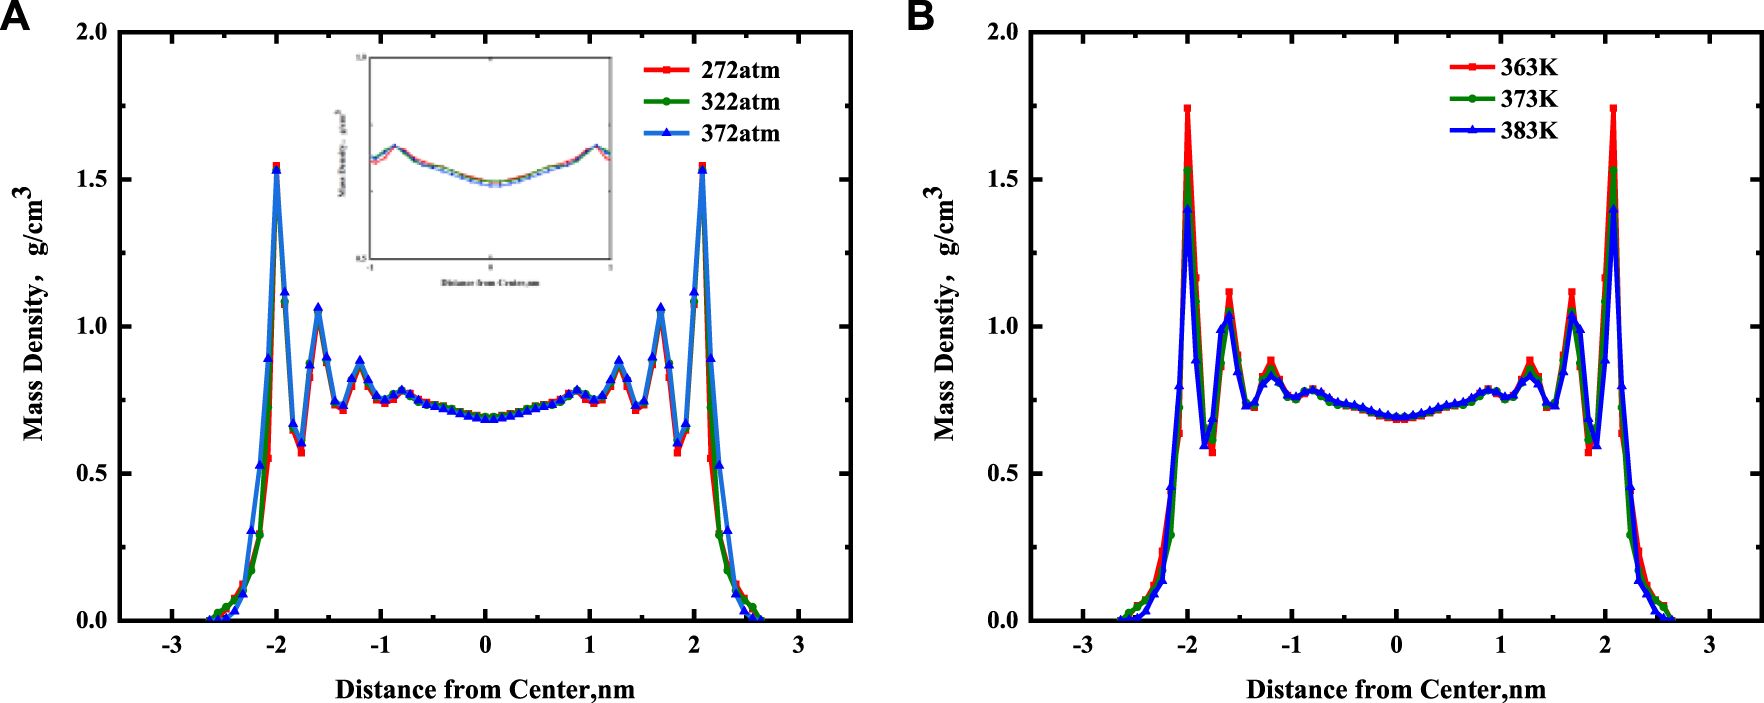
(A) Effect of pressure on the continuous mass density profiles for nC19 in the mixed nanopores; (B) Effect of temperature on the continuous mass density profiles for nC19 in the mixed nanopores.
Effect of Temperature on n-Alkanes Adsorption
Figure 8B shows the continuous mass density profiles of nC19 in 5 nm mixed nanopores at temperatures of 363, 373, and 383 K under a pressure of 322 atm. These profiles are similar to the previous conclusion. There are four adsorbed layers under different temperatures, and the peak density of each adsorbed layer gradually increases with distance from the pore center. The density of the bulk fluid under different temperatures is ∼0.695 g/cm3. At 363 K, the ratio of the adsorption layer density to the bulk fluid density ranges from 1.13 to 2.49. The average density of the adsorption layer is 1.133 g/cm3. At 373 K, the density ratio is 1.13–2.21, and the average density of the adsorption layer is 1.055 g/cm3. At 383 k, the density ratio is 1.13–2.01, and the average density is 1.011 g/cm3. The average density ratio of the first adsorption layer to the bulk phase at different temperatures is 1.13. Overall, adsorption occurs near the pore wall at 363 K. With a gradual increase in temperature, the liquid-liquid effect near the pore wall gradually increases, resulting in the deceleration of the adsorption rate between alkane molecules and the wall. The density of each adsorption layer and the average density of the adsorption layer further decreases as well. The reason may be that the kinetic energy of alkane molecules in the system was calculated from the square sum of the particle velocity, and the system’s kinetic energy is positively correlated with temperature. Therefore, a higher temperature results in greater kinetic energy and a shorter movement time for the alkane molecules from the pore wall. It is much easier to detach from the pore surface of the shale and form a free state. Furthermore, with an increase in temperature, the viscosity of nC19 molecules decreases, resulting in a decrease in density. The bulk fluid density values of the model at different temperatures agree with the experimental data. The relative errors are about 3.57, 4.15, and 4.17% at the different temperatures of 363, 373, and 383 K.
Radial Distribution Function and Intermolecular Force Analysis
The theory of radial distribution function (RDF) is one of the most active research aspects in chemical thermodynamics and the most precise section among the theory of liquids. It is a key function for describing the structure of fluids. It plays an important role in determining the equilibrium and non-equilibrium thermodynamic properties of fluids (Lyubartsev and Laaksonen, 1995). It is also the primary linkage between macroscopic thermodynamic properties and interaction forces among the molecules in pure fluid and fluid mixture.
At present, molecular simulation, integral methods, and micro-phase equilibrium methods are the main calculation methods to obtain RDF (Kirkwood et al., 1952; Carvalho et al., 2020). The results of RDF obtained from molecular simulation are the most accurate (Pérez Molina et al., 2021). As shown in Figure 9, RDF can be interpreted as the ratio of local density to bulk density of the system. The local density near the reference atom is different from the bulk density; however, when it is far away from the reference atom, the local density is the same as the bulk density. In other words, the RDF should be close to 1 when the r is large. It can be calculated by Eq. 1.Where dN is the number of atoms (molecules) that have a force on the reference atom within a certain range (r, r + dr), ρ is the atom density.
FIGURE 9
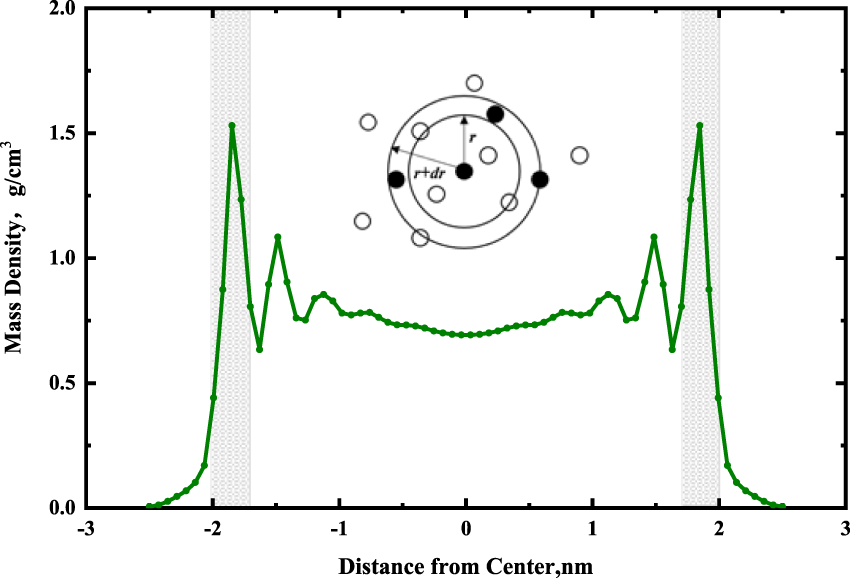
Diagram of the radial distribution function and the region of radial distribution calculation (gray region), black balls represent reference particles.
The peak position of RDF played an important role (Chen et al., 2021). In the RDF diagram, if the peak position is less than or equal to 3.5 Å, there is a chemical or hydrogen bond between reference atoms and other atoms. If the peak position is more than 3.5 Å, the Coulomb and van der Waals forces are the main forces (Yang, 2020).
The two-dimensional radial distribution functions of CH3–CH3 correlations in 5 nm mixed solid wall of different pressures and temperatures were calculated from 3.5-ns EMD simulation. As shown in Figure 10, the adsorption peak position of CH3–CH3 is more than 3.5 Å, indicating that the main intermolecular forces are van der Waals force and Coulomb force. Since the position of the RDF is located near the wall (the position with the largest adsorption phase density), RDF can explain the force of fluid molecules on the mixed component shale wall. When the pressure changes, there is little difference in the value and position of the main peak, as shown in Figure 10A. This further indicates that the adsorption of the fluid on the wall changes little with pressure. In Figure 10B, when the temperature changes, the position of the main peak remains unchanged. The value of the main peak decreases with an increase in temperature, indicating that the number of fluid molecules in the near-wall region decreases with an increase in temperature. This is consistent with the density distribution curve analysis results in Figure 8. In addition, the RDFs reach 1 when the r is large. The short-range order of nC19 is also observed, illustrating the liquid-like structure under confinement.
FIGURE 10
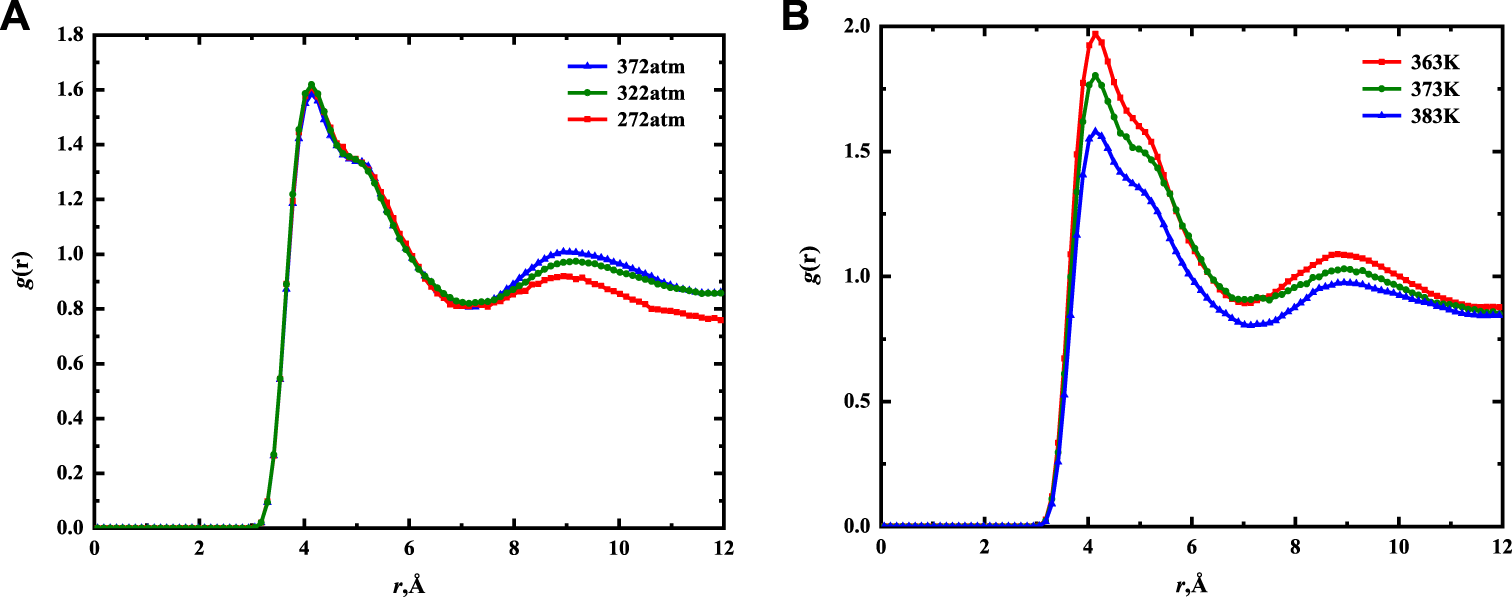
Two-dimensional CH3–CH3 RDF for nC19 in 5 nm mixed nanopores of different pressures (A) and temperatures (B).
Conclusion
In this work, we combined the analysis results of XRD and GS from the Songliao Basin shale oil to determine primary compositions. The main mineral component of shale was quartz and illite. The main carbon peak of the fluid component was nC19. Molecular dynamics simulation technology was used to analyze the occurrence state of the fluid under the varying conditions of single-component walls and multi-component mixtures walls to further verify the accuracy of the selection of the pore wall. The analysis of mass density curves under different pore sizes, temperatures, and pressures revealed that the critical adsorption point of the shale oil in inorganic pores was smaller than that of organic matter. In this paper, the critical point was less than 3.2 nm. Because the kinetic energy of molecules was directly related to temperature, the density of the adsorbed phase and the thickness of the adsorbed layer were more sensitive to temperature; a higher temperature resulted in greater kinetic energy, where it was easier to form a free state on the pore wall. The density and thickness of adsorbed phase were less affected by pressure due to capillary condensation. The main intermolecular forces were van der Waals force and Coulomb force. The RDFs of nC19 showed a liquid-like structure under confinement.
Statements
Data availability statement
The original contributions presented in the study are included in the article/supplementary material, further inquiries can be directed to the corresponding authors.
Author contributions
SL conceived the project and designed the simulation schemes. SL, J-MW, Y-KL, BL, and SS performed the molecular simulations. SL, J-MW, SS, A-QS, and F-YT analyzed the data; SL and J-MW wrote the manuscript with input from other authors; All authors contributed to the discussion and approved the final manuscript.
Funding
This paper is financially supported by the National Natural Science Foundation of China (51804078, 52074087); China Postdoctoral Science Foundation (2019M651255); Postdoctoral Foundation of Hei Long Jiang (LBH-Z18039); PetroChina Innovation Foundation (2020D-5007-0106).
Conflict of interest
Author F-YT was employed by the company Daqing Oilfield Limited Company.
The remaining authors declare that the research was conducted in the absence of any commercial or financial relationships that could be construed as a potential conflict of interest.
Publisher’s note
All claims expressed in this article are solely those of the authors and do not necessarily represent those of their affiliated organizations, or those of the publisher, the editors and the reviewers. Any product that may be evaluated in this article, or claim that may be made by its manufacturer, is not guaranteed or endorsed by the publisher.
References
1
Awan R. S. Liu C. Aadil N. Yasin Q. Salaam A. Hussain A. et al (2021). Organic Geochemical Evaluation of Cretaceous Talhar Shale for Shale Oil and Gas Potential from Lower Indus Basin, Pakistan. J. Pet. Sci. Eng.200, 108404. 10.1016/j.petrol.2021.108404
2
Beckers J. Leeuw S. (2000). Molecular Dynamics Simulation of Nanoporous Silica. J. Non-Crystalline Solid261 (1-3), 87–100. 10.1016/S0022-3093(99)00607-9
3
Cao Z. Jiang H. Zeng J. Saibi H. Lu T. Xie X. et al (2021). Nanoscale Liquid Hydrocarbon Adsorption on clay Minerals: a Molecular Dynamics Simulation of Shale Oils. Chem. Eng. J.420, 127578. 10.1016/j.cej.2020.127578
4
Carvalho F. S. Braga J. P. Alves M. O. Gonçalves C. E. M. (2020). Neural Network in the Inverse Problem of Liquid Argon Structure Factor: from Gas-To-Liquid Radial Distribution Function. Theor. Chem. Acc.139 (2), 29. 10.1007/s00214-019-2531-1
5
Chen Z. Shen Y. Zhang H. Dai Y. Qu Y. Zhu Z. et al (2021). Molecular Interaction Mechanism and Performance Evaluation in the Liquid-Liquid Extraction Process of Ionic Liquid-Heptane-Tertiary Butanol Based on Molecular Dynamics. J. Mol. Liquids340, 116837. 10.1016/j.molliq.2021.116837
6
Cody R. D. Thompson G. L. (1976). Quantitative X-ray Powder Diffraction Analyses of Clays Using an Orienting Internal Standard and Pressed Disks of Bulk Shale Samples. Clays Clay Miner.24 (5), 224–231. 10.1346/ccmn.1976.0240503
7
Cygan R. T. Liang J.-J. Kalinichev A. G. (2004). Molecular Models of Hydroxide, Oxyhydroxide, and Clay Phases and the Development of a General Force Field. J. Phys. Chem. B108 (4), 1255–1266. 10.1021/jp0363287
8
Dong D. Z. Zou C. N. Li J. Z. Wang S. J. Li X. J. Wang Y. M. et al (2011). Resource Potential, Exploration and Development prospect of Shale Gas in the Whole World. Dizhi Tongbao30, 324–336. 10.3969/j.issn.1671-2552.2011.02.018
9
Dong Z. T. Xue H. Li B. Tian S. Lu S. Lu S. (2021). Molecular Dynamics Simulations of Oil-Water Wetting Models of Organic Matter and Minerals in Shale at the Nanometer Scale. J. Nanosci. Nanotechnol.21, 85–97. 10.1166/jnn.2021.18468
10
Downs R. T. Hall-Wallace M. (2006). American Mineralogist crystal Structure Database. Choice Rev. Online43, 43Sup–0302. 10.5860/choice.43sup-0302
11
Guo C. Xu J. Wu K. Wei M. Liu S. (2015). Study on Gas Flow through Nano Pores of Shale Gas Reservoirs. Fuel143, 107–117. 10.1016/j.fuel.2014.11.032
12
Han H. Pang P. Li Z.-l. Shi P.-t. Guo C. Liu Y. et al (2019). Controls of Organic and Inorganic Compositions on Pore Structure of Lacustrine Shales of Chang 7 Member from Triassic Yanchang Formation in the Ordos Basin, China. Mar. Pet. Geol.100, 270–284. 10.1016/j.marpetgeo.2018.10.038
13
Ibrahim W. E. Salim A. M. A. Sum C. W. (2020). Mineralogical Investigation of fine Clastic Rocks from Central Sarawak, Malaysia. J. Petrol. Explor. Prod. Technol.10 (6), 21–30. 10.1007/s13202-019-00751-0
14
Jin Z. Firoozabadi A. (2015). Flow of Methane in Shale Nanopores at Low and High Pressure by Molecular Dynamics Simulations. J. Chem. Phys.143 (10), 104315–105170. 10.1063/1.4930006
15
Jin Z. J. Zhu R. K. Liang X. P. Shen Y. (2021). Several Issues Worthy of Attention in Current Lacustrine Shale Oil Exploration and Development. Pet. Explor. Dev.06, 1–12. 10.1016/s1876-3804(21)60303-8
16
Kelly S. (2013). “Experimental Investigation of the Influence of Molecular Surface Interactions on Imbibition in Shale Nano-Pore Proxies,” in SPE Annual Technical Conference and Exhibition, September 2013 (New Orleans, Louisiana, USA: Society of Petroleum Engineers). 10.2118/167635-STU
17
Kirkwood J. G. Lewinson V. A. Alder B. J. (1952). Radial Distribution Functions and the Equation of State of Fluids Composed of Molecules Interacting According to the Lennard‐Jones Potential. J. Chem. Phys.20 (6), 929–938. 10.1063/1.1700653
18
Le T. Striolo A. Cole D. R. (2015). Propane Simulated in Silica Pores: Adsorption Isotherms, Molecular Structure, and Mobility. Chem. Eng. Sci.121, 292–299. 10.1016/j.ces.2014.08.022
19
Ledyastuti M. Liang Y. Kunieda M. Matsuoka T. (2012). Asymmetric Orientation of Toluene Molecules at Oil-Silica Interfaces. J. Chem. Phys.137 (6), 064703. 10.1063/1.4742696
20
Li Z. Jun Yao J. Kou J. (2019). Mixture Composition Effect on Hydrocarbon-Water Transport in Shale Organic Nanochannels. J. Phys. Chem. Lett.10, 4291–4296. 10.1021/acs.jpclett.9b01576
21
Liu C. Wang Z. Guo Z. Hong W. Dun C. Zhang X. et al (2017). Enrichment and Distribution of Shale Oil in the Cretaceous Qingshankou Formation, Songliao basin, Northeast china. Mar. Pet. Geol.86, 751–770. 10.1016/j.marpetgeo.2017.06.034
22
Liu B. Gao Y. Liu K. Liu J. Ostadhassan M. Wu T. et al (2021a). Pore Structure and Adsorption Hysteresis of the Middle Jurassic Xishanyao Shale Formation in the Southern Junggar Basin, Northwest China. Energy Explor. Exploit.39, 761–778. 10.1177/0144598720985136
23
Liu B. He S. Meng L. Fu X. Gong L. Wang H. (2021b). Sealing Mechanisms in Volcanic Faulted Reservoirs in Xujiaweizi Extension, Northern Songliao Basin, Northeastern China. Bulletin105, 1721–1743. 10.1306/03122119048
24
Loucks R. G. Reed R. M. Ruppel S. C. Hammes U. (2012). Spectrum of Pore Types and Networks in Mudrocks and a Descriptive Classification for Matrix-Related Mudrock Pores. Bulletin96, 1071–1098. 10.1306/08171111061
25
Lyubartsev A. P. Laaksonen A. (1995). Calculation of Effective Interaction Potentials from Radial Distribution Functions: A Reverse Monte Carlo Approach. Phys. Rev. E52 (4), 3730–3737. 10.1103/PhysRevE.52.3730
26
Martic G. Gentner F. Seveno D. Coulon D. De Coninck J. Blake T. D. (2002). A Molecular Dynamics Simulation of Capillary Imbibition. Langmuir18 (21), 7971–7976. 10.1021/la020068n
27
Nosé S. (1984). A Unified Formulation of the Constant Temperature Molecular Dynamics Methods. J. Chem. Phys.81 (1), 511–519. 10.1063/1.447334
28
Parrinello M. Rahman A. (1981). Polymorphic Transitions in Single Crystals: A New Molecular Dynamics Method. J. Appl. Phys.52 (12), 7182–7190. 10.1063/1.328693
29
Pérez-Molina M. Pérez-Polo M. F. Chica J. G. Fernandez-Varo H. et al (2021). An Equation of State Based on the Intermolecular Potential and the Radial Distribution Function to Estimate the Virial Coefficients by Using PVT Chaotic Data. Fluid Phase Equilib.546, 113124. 10.1016/j.fluid.2021.113124
30
Severson B. L. Snurr R. Q. (2007). Monte Carlo Simulation of N-Alkane Adsorption Isotherms in Carbon Slit Pores. J. Chem. Phys.126 (13), 134708. 10.1063/1.2713097
31
Stukowski A. (2010). Visualization and Analysis of Atomistic Simulation Data with OVITO-The Open Visualization Tool. Model. Simul. Mater. Sci. Eng.18 (1), 015012–22162. 10.1088/0965-0393/18/1/015012
32
Sun Z. Shi J. Wu K. Li X. (2018). Gas Flow Behavior through Inorganic Nanopores in Shale Considering Confinement Effect and Moisture Content. Ind. Eng. Chem. Res.57, 3430–3440. 10.1021/acs.iecr.8b00271
33
Sun L. Liu H. He W. Li G. Zhang S. Zhu R. et al (2021). An Analysis of Major Scientific Problems and Research Paths of Gulong Shale Oil in Daqing Oilfield, NE China. Pet. Explor. Develop.48, 527–540. 10.1016/S1876-3804(21)60043-5
34
Wang S. Feng Q. Zha M. Lu S. Qin Y. Xia T. et al (2015a). Molecular Dynamics Simulation of Liquid Alkane Occurrence State in Pores and Slits of Shale Organic Matter. Pet. Explor. Develop.42 (6), 844–851. 10.1016/S1876-3804(15)30081-1
35
Wang S. Feng Q. Javadpour F. Xia T. Li Z. (2015b). Oil Adsorption in Shale Nanopores and its Effect on Recoverable Oil-In-Place. Int. J. Coal Geol.147-148, 9–24. 10.1016/j.coal.2015.06.002
36
Wang S. Javadpour F. Feng Q. (2016). Molecular Dynamics Simulations of Oil Transport through Inorganic Nanopores in Shale. Fuel171, 74–86. 10.1016/j.fuel.2015.12.071
37
Wang Z. Zheng Y. Chen F. Xie X. Wu S. Sun L. (2018). Biomarker Geochemistry of Eq34-10 Cyclothem Shale in Qianjiang Depression of the Jianghan Salt lake Facies Basin. Pet. Sci. Techn.36 (2), 148–153. 10.1080/10916466.2017.1411947
38
Wang W W. Li S. Y. Liu Y. Qiu D. K. Ma Y. Wu J. X. (2015). “Analysis of the Chemical Constitutions of Yaojie Shale Oil in China by Gas Chromatography-Mass Spectrometry (GC-MS),” in Energy and Sustainability V, Special Contributions, Putrajaya, Malaysia, December 2014, 91–100. 10.2495/ESS140081
39
Yang Z. Caineng Z. O. U. Wu S. Senhu L. I. N. Songqi P. A. N. Xiaobing N. I. U. et al (2019). Formation, Distribution and Resource Potential of the "sweet Areas (Sections)" of continental Shale Oil in China. Mar. Pet. Geol.102, 48–60. 10.1016/j.marpetgeo.2018.11.049
40
Yang F. (2020). Molecular Simulation Study on Adsorption of Heavy Metal Irons by clay Minerals. Master Thesis. Taiyuan University of Technology.
41
Ye X. Cui S. de Almeida V. F. Khomami B. (2013). Effect of Varying the 1-4 Intramolecular Scaling Factor in Atomistic Simulations of Long-Chain N-Alkanes with the OPLS-AA Model. J. Mol. Model.19, 1251–1258. 10.1007/s00894-012-1651-5
42
Zhang W. Feng Q. Jin Z. Xing X. Wang S. (2021). Molecular Simulation Study of Oil-Water Two-phase Fluid Transport in Shale Inorganic Nanopores. Chem. Eng. Sci.245 (17), 116948. 10.1016/j.ces.2021.116948
43
Zhao J. Yao G. Ramisetti S. B. Hammond R. B. Wen D. (2018). Molecular Dynamics Simulation of the Salinity Effect on the N-Decane/Water/Vapor Interfacial Equilibrium. Energy Fuels32, 11080–11092. 10.1021/acs.energyfuels.8b00706
44
Zhou T. Chen M. Zhang S. Li Y. Li F. Zhang C. (2020a). Simulation of Fracture Propagation and Optimization of ball-sealer In-Stage Diversion under the Effect of Heterogeneous Stress Field. Nat. Gas Industry B7 (5), 523–532. 10.1016/j.ngib.2020.09.010
45
Zhou T. Wang H. Li F. Li Y. Zou Y. Zhang C. (2020b). Numerical Simulation of Hydraulic Fracture Propagation in Laminated Shale Reservoirs. Pet. Explor. Develop.47, 1117–1130. 10.1016/S1876-3804(20)60122-7
46
Zou C. Dong D. Wang S. Li J. Li X. Wang Y. et al (2010). Geological Characteristics and Resource Potential of Shale Gas in China. Pet. Explor. Develop.37, 641–653. 10.1016/S1876-3804(11)60001-3
47
Zou C. N. Tao S. Z. Bai B. Yang Z. Zhu R. K. Hou L. H. et al (2015). Differences and Relations between Unconventional and Conventional Oil and Gas. China Pet. Explor.20 (01), 1–16. 10.3969/j.issn.1672-7703.2015.01.001
Summary
Keywords
molecular dynamics, shale composition, fluid composition, adsorption, intermolecular force
Citation
Liang S, Wang J-M, Liu Y-K, Liu B, Sun S, Shen A-Q and Tao F-Y (2022) Oil Occurrence States in Shale Mixed Inorganic Matter Nanopores. Front. Earth Sci. 9:833302. doi: 10.3389/feart.2021.833302
Received
11 December 2021
Accepted
29 December 2021
Published
14 January 2022
Volume
9 - 2021
Edited by
Kun Zhang, Southwest Petroleum University, China
Reviewed by
Yu Song, China University of Geosciences Wuhan, China
Zhe Cao, SINOPEC Petroleum Exploration and Production Research Institute, China
Updates
Copyright
© 2022 Liang, Wang, Liu, Liu, Sun, Shen and Tao.
This is an open-access article distributed under the terms of the Creative Commons Attribution License (CC BY). The use, distribution or reproduction in other forums is permitted, provided the original author(s) and the copyright owner(s) are credited and that the original publication in this journal is cited, in accordance with accepted academic practice. No use, distribution or reproduction is permitted which does not comply with these terms.
*Correspondence: Shuang Liang, liangshuang21@163.com; Yi-Kun Liu, liuyikun111@126.com
This article was submitted to Geochemistry, a section of the journal Frontiers in Earth Science
Disclaimer
All claims expressed in this article are solely those of the authors and do not necessarily represent those of their affiliated organizations, or those of the publisher, the editors and the reviewers. Any product that may be evaluated in this article or claim that may be made by its manufacturer is not guaranteed or endorsed by the publisher.