 Xuangang Meng
 Song Hang
 Heng Zhang
 Feilong Gao
 Yong Gao
 Xiangfang Li
- 1MOE Key Laboratory of Petroleum Engineering, China University of Petroleum, Beijing, China
- 2Qilicun Oil Production Plant, Yanchang Oilfield, Yan’an, China
Water huff-n-puff is an effective technology to enhance oil recovery (EOR) of low-permeability reservoirs, which are usually developed with hydraulic fracturing. Fluid exchange between fractures and the matrix is the main EOR mechanism. However, the presented water huff-n-puff simulations usually assume vertical fracture morphology, while the horizontal fractures formed in shallow reservoirs are rarely reported. In this study, we first introduced the water huff-n-puff process in a low-permeability oil reservoir with horizontal fractures and described the multiphase flow characteristics during the huff, soak, and puff stages. Then combined with a series of experiments, a comprehensive method is used to determine the key flow parameters, that is, capillary pressure and relative permeability. Finally, using the Chang 6 reservoir as an example, a series of numerical simulations were conducted to demonstrate the effect of water huff-n-puff on the well performance in this field. The simulation results showed that oil production is mainly affected by the injection volume and injection rate, while water production mainly depends on the well shut-in time. For a typical well in this field, the optimal injection volume, injection rate, and well shut-in time are 300 m3, 10 m3/d, and 30 days, respectively. In addition, our results showed that increasing the number of cycles not only benefits fluid exchange but also enhances the formation pressure. Both of them can accelerate the development of low-permeability oil reservoirs.
1 Introduction
With the depletion of conventional resources and the increase in energy demand, low-permeability oil reservoirs play an important role in the world energy map (Wang et al., 2018; Rao et al., 2020; Feng et al., 2021). Due to the poor physical properties of the reservoir, that is, small pore size, low porosity, and low permeability, hydraulic fracturing becomes the necessary technology to develop these types of reservoirs in a commercial and effective way (Takahashi and Kovscek, 2010; Ren et al., 2016; Huang et al., 2021a; Huang et al., 2021b). However, the fields usually show a rapid decline in the production rate and formation pressure, which corresponds to low recovery that depends only on elastic energy (Han et al., 2021). Therefore, how to improve oil recovery after depletion production has become an urgent target for researchers and engineers. Due to its wide distribution in nature, water is considered the most appropriate medium to supplement formation energy. Moreover, in order to extract more oil from low-permeability reservoirs, water huff-n-puff is the preferred technology because injected water in the fractures and crude oil in the matrix can exchange with each other under the drive of capillary force (Wang et al., 2018). Moreover, this technology has been already put into practice in some areas, such as the Changqing oil field and the Yanchang oil field in China. Therefore, research studies on the dynamic process and influencing factors of water huff-n-puff are important to improve the well performance of reservoirs with low permeability.
During the water huff-n-puff process, the well is shut down for a period of time after the injection of water. Under the drive of capillary pressure, injected water is imbibed into the matrix and displaces the oil into the fracture or into the area near the wellbore. Subsequently, the well is reopened, and the oil in the fractures or the near-wellbore area can be produced easily (Wang et al., 2021a; Wang et al., 2021b). Therefore, imbibition under the drive of capillary pressure is considered to be the main mechanism of water huff-n-puff to improve the recovery of low-permeability reservoirs. According to this mechanism, researchers have conducted numerous laboratory experiments and numerical simulations (Wilsey and Bearden, 1954; Graham and Richardson, 1959; Tavassoli et al., 2005; Sun et al., 2022). Rangel-German and Kovscek (2004) used a microscopic visualization model to observe the fluid exchange between fractures and the sandstone matrix, and the results showed that the fluid exchange is affected by the injection rate and the relative permeability of the media. Wang et al. (2018) conducted a series of imbibition experiments and found that there is an optimum permeability for spontaneous imbibition. This is because the variation of permeability has contradictory effects on spontaneous imbibition, that is, the decrease in capillary pressure and the increase of water flow space. Rao et al. (2020) investigated the mechanisms of water puff-n-huff in low-permeability reservoirs with complex fracture networks, and the results showed that the surface area of fractures determines the imbibition efficiency. His results suggest that increasing the complexity of fractures can promote fluid exchange between the fractures and the matrix. In addition, formation energy supplementation and unstable displacement are also considered to contribute to EOR. Wang et al. (2019) conducted a simulation to evaluate the effect of multiple cycles on well production in a tight oil block. The results showed that increasing the number of cycles can increase the injection pressure and decrease the capillary pressure, leading to a decrease in development effects.
Although researchers have conducted many experiments and simulations to investigate the effects of water huff-n-puff on well performance in low-permeability reservoirs, most of the work focuses on reservoirs with vertical fractures. In fact, the morphology of hydraulic fractures strongly depends on the relative magnitude of stress in the vertical and horizontal directions. For example, in a deposit with deep burial depth, the hydraulic fractures usually expand in the vertical direction because the stress in this direction is much greater than that in the horizontal direction. However, for a reservoir with shallow burial depth, the stress in the horizontal direction is in the advantage position, leading to the formation of horizontal fractures (Hartsock and Warren, 1961). Fisher and Warpinski (2012) made a statistical analysis of ten thousand of hydraulic fractures in North America and found that the morphology of hydraulic fractures is horizontal when the depth of the reservoirs is less than 2000 ft; at a depth greater than 4000 ft, mainly vertical fractures are found. At the Yanchang oil field in China, the burial depth of the reservoirs is in the range of 500–700 m. Thus, the morphology of fractures in this area usually extends in the horizontal direction. However, the huff-n-puff process of water and its effects on the well performance in these reservoirs have not been well studied.
In this article, we first presented the process of water huff-n-puff in a low-permeability oil reservoir with horizontal fractures, accompanied by the multiphase flow characteristics during huff, soak, and puff stages. Then in combination with the imbibition experiments, a comprehensive method is used to determine the key flow parameters, that is, capillary pressure and relative permeability. Finally, using the Chang 6 reservoir as an example, the impact of the water huff-n-puff method on the well performance of low-permeability oil reservoirs with horizontal fractures is evaluated with a series of numerical simulations.
2.Mechanism Analysis of Water Huff-N-Puff
Water huff-n-puff could enhance oil recovery because of the supplement of formation energy and the exchange between crude oil in the matrix and injected water in the fractures. Based on the migration of fluids, water huff-n-puff can be divided into huff, soak, and puff stages (Wang et al., 2018; Gao et al., 2022).
As illustrated in Figure 1A, in the huff stage, water is injected into the reservoirs with high pressure to create the fracture networks. For a reservoir with low permeability and shallow depth, the horizontal morphology with an elliptical shape is the most common. In this stage, the injected water fills the fractures and then flows into the matrix in the vertical direction and the radial direction. Overall, the injected water increases the pressure of the formation and lowers the oil saturation near the wellbore. After the water injection, the well is shut down for a period of time, which can be referred to the soak stage. As illustrated in Figure 1B, capillary pressure plays the main role in this stage and determines the redistribution of fluids, that is, oil and water. Under the drive of capillary pressure, the convective motion of oil and injected water is achieved by spontaneous imbibition. Overall, the main objective of well shut-in is to exchange the crude oil at depth to the fracture or near-wellbore zone. After a certain period of shut-in, the well is reopened and the oil starts to be produced. As illustrated in Figure 1C, under the drive of drawdown pressure, the oil in the fractures flows rapidly to the bottom hole, resulting in higher production that lasts only for a short time. With the continuous production, both of the fluids in the radial and vertical directions would flow into the fractures. After a period of production, the oil in the fractures and near-wellbore zone is essentially removed, and the well shows the characteristics of depletion development again.
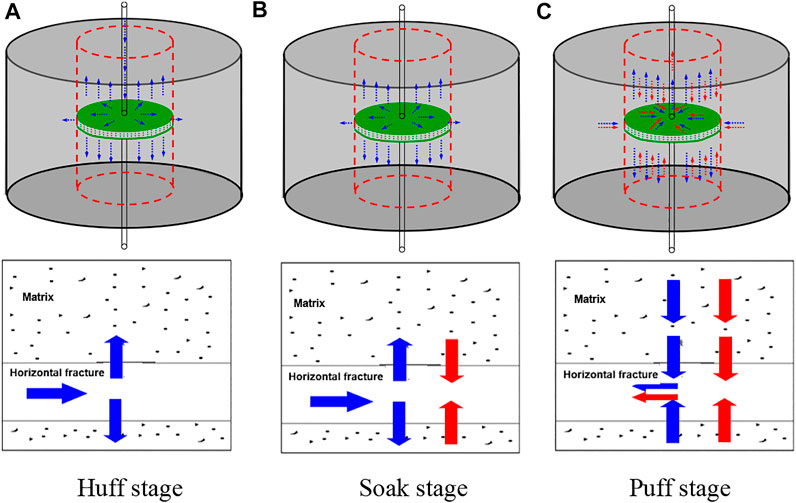
FIGURE 1. Schematic diagram for the water huff-n-puff in low-permeability reservoirs with a horizontal fracture. (A) Huff stage, (B) soak stage, (C) puff stage.
3 Estimation of Capillary Pressure and Relative Permeability
Based on the analysis of the mechanism of water huff-n-puff, the imbibition effect is the key factor for the migration and redistribution of fluids. Therefore, in this part, two cores from the Chang 6 reservoir are selected to conduct the imbibition experiments. Meanwhile, some related experiments, such as, wettability measurement, mercury injection test, and interfacial tension (IFT) measurement, are also conducted. Based on the experimental results, we used a comprehensive method to determine the capillary pressure and relative permeability, which are the fundamental parameters for numerical simulations.
Capillary Pressure
Two sandstones with low permeability from the Chang 6 reservoir were used for the experiments. The information of porosity and permeability is given in Table 1. Mercury injection and pore size distribution (PSD) curves were measured using an AutoPore IV mercury-injection analyzer with the highest pressure of 204 MPa and the pore size ranging from 0.006–360 μm, as shown in Figure 2.

TABLE 1. Sample properties in the Chang 6 reservoir.
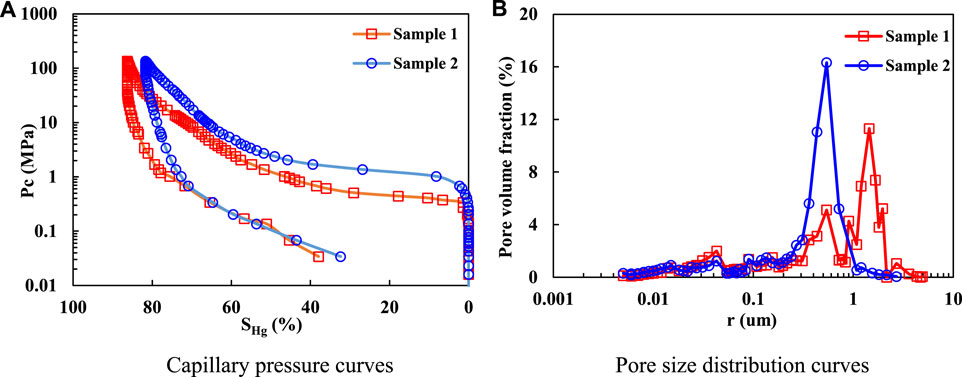
FIGURE 2. Results of mercury injection test of our samples. (A) Capillary pressure curves. (B) Pore size distribution curves
It should be noted that the capillary pressure curves of the oil–water system can be estimated based on the mercury injection curves by correcting the difference between the oil–water system and the Hg–air system. Before the correction, the wettability of the rock and the IFT of the oil–water system should be determined. In this study, the sessile drop method was used to measure the contact angle, and the results for our samples are 16.6° and 8.2°, respectively (Figure 3). Therefore, it is assumed that the Chang 6 reservoir is water-wet. Meanwhile, the interfacial tension (IFT) of the crude oil is measured by a spinning drop tensiometer at room temperature of 20°C and reservoir temperature of 35°C, and the results are shown in Figure 4. At room temperature, the IFT is 35 mN/m, while at reservoir temperature, the IFT decreases to 22 mN/m.
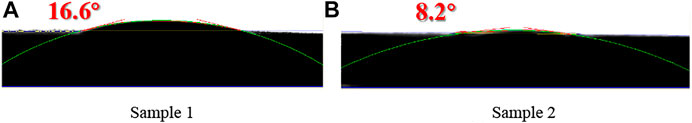
FIGURE 3. Contact angle of two samples. (A) Sample 1. (B) Sample 2
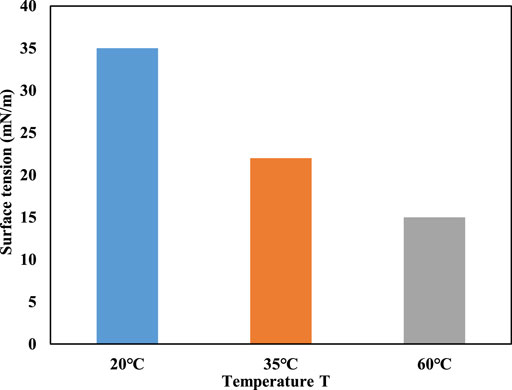
FIGURE 4. IFT of crude oil–water system with different temperature.
Based on the measured contact angle and IFT, the capillary pressure of the oil–water system at room temperature (20°C) and reservoir temperature (35°C) is shown in Figure 5. In this study, the capillary pressure at reservoir temperature is considered as the representative one in the reservoir. it should be noted that this replacement is based on the following assumptions: 1) the effect of pressure on IFT is ignored because IFT results from the density difference of two immiscible fluids, and pressure has no significant effect on water density and oil density. 2) The effect of temperature on wettability is ignored. At room temperature, our samples have already shown strong hydrophilicity. In general, when the surface is hydrophilic, increasing the temperature can enhance the affinity to water molecules. Thus, the influence of temperature is insignificant.
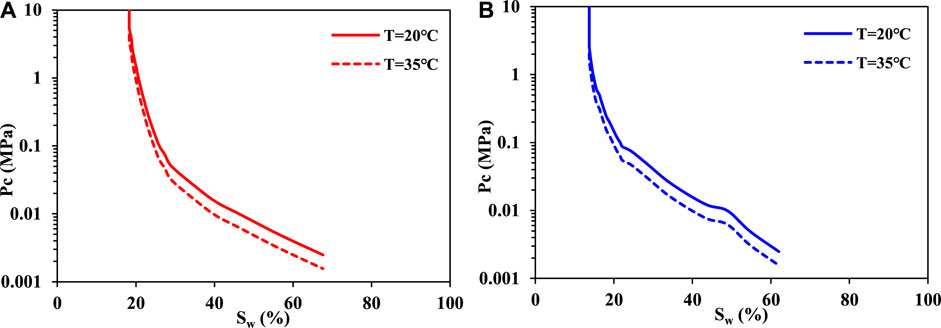
FIGURE 5. Estimated capillary pressure of two cores for the oil–water system. (A) Sample 1. (B) Sample 2
Spontaneous Imbibition Experiments
As illustrated in Figure 6, the experiment of spontaneous imbibition is performed with an automatic metering system, which is assembled by an electronic balance and a computer. In this experiment, the samples are held under a rigid metal frame with a non-elastic and impermeable string, and their mass can be measured by the electronic balance (JJ632BC), whose accuracy is 0.0001 g and measuring range is 620 g. Meanwhile, the change of mass is transmitted to the computer in real time. The experiments were conducted in a constant temperature chamber (T = 20°C) to mitigate the effects of temperature variation in the environment. The procedure of experiments is as follows: 1) the geometrical parameters of the samples, that is, length and radius, are measured. 2) The samples are cleaned and the impurities in the core, that is, crude oil and bitumen, are removed. 3) The samples are dried at a temperature of 105°C for 8 h. The mass of the dry samples is determined if the mass difference between the two successive measurements is less than 0.01 g. 4) The clean samples are immersed in crude oil for 48 h to ensure that the pores are filled with crude oil. Then the samples are suspended by an impermeable string and immersed into the water. 5) The mass of imbibed water is recorded automatically until the mass remains constant within 1 hour.

FIGURE 6. Picture of spontaneous imbibition experiments.
As illustrated in Figure 7A, our results indicate that the imbibition curves of the two samples are very close because their physical properties are very similar. From Figure 7A, it can be seen that the imbibition rate gradually decreases and finally approaches equilibrium. The reason is that the imbibition of water increases the water saturation of the cores, which leads to a decrease in the capillary pressure. Moreover, the experimental data are managed by the method, that is, the Y-coordinate is plotted as the imbibed mass m, while the X-coordinate is plotted as the square root of time t1/2, as shown in Figure 7B. The results show that m has a linear relationship with t1/2. This finding may help to determine the relative permeability of the imbibition process.
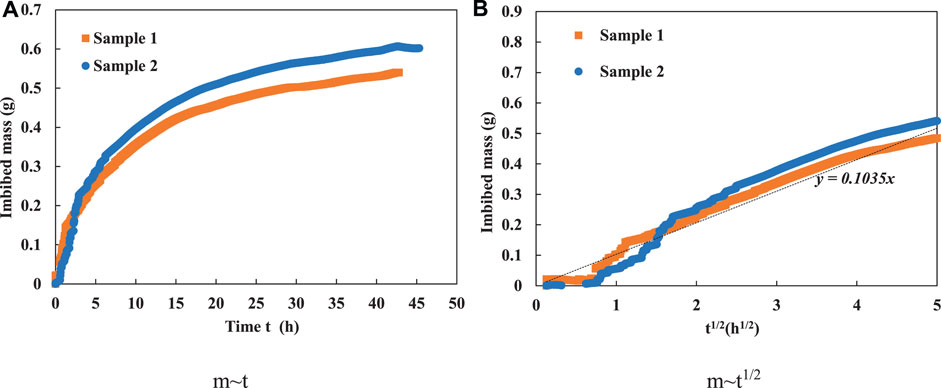
FIGURE 7. Results of imbibition experiments. (A) m∼t. (B) m∼t1/2.
Relative Permeability
By neglecting the gravity effect, a mathematical model for immiscible, incompressible, and isothermal two-phase flow is obtained by combining the Darcy flow and continuity equation (Ren et al., 2016; Alyafei and Blunt, 2018) as follows:
where vt is the total velocity, fr (Sw) is the fractional flow function, and Dr (Sw) is the capillary dispersion coefficient.
The fractional flow function can be expressed as follows:
where Krw and Kro are the water relative permeability and oil relative permeability, respectively; μw and μo are the water viscosity and oil viscosity, respectively.
The capillary dispersion coefficient can be expressed as follows:
For spontaneous imbibition, the initial condition is given as follows:
The boundary condition for spontaneous imbibition is given as follows:
Based on the experimental results in Section 3.2, imbibed mass m has a linear relationship with the square root of time t1/2. Correspondingly, the imbibed rate is also in proportion to the t1/2, which can be written as follows (Ren et al., 2016):
where A is an imbibition constant.
Furthermore, capillary fractional flow F(Sw) is defined as the ratio of water flux in the core to the condition at the inlet.
Based on Eqs 1–8, the water saturation profile for spontaneous imbibition can be given with the semi-analytic form, as follows:
Based on Eq. 9, the imbibition mass can be given as follows:
Therefore, the slope between m and t1/2 is given as follows:
According to Eqs 10–14, we can know that besides the physical properties of core samples and fluids, the capillary dispersion coefficient and relative permeability are the key factors to determine the imbibition results. The capillary pressure is shown in Figure 5, and the relative permeability curve can be determined as the function of normalized water saturation.
Based on Eqs 14–17, parameter λ can be obtained by the slope between m and t1/2 in our experiments. Moreover, the relative permeability curve can be estimated, and the results are shown in Figure 8. The results provide the basic seepage parameters for our numerical simulations.
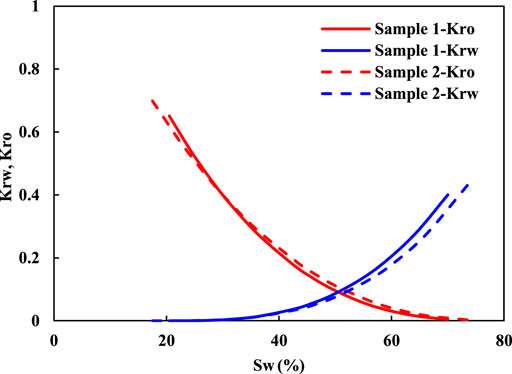
FIGURE 8. Estimated relative permeability curves of two samples.
Meanwhile, some uncertainties during this process should be noted: 1) as shown in Figure 2B, the measured PSD curves demonstrated that the pore dimension of samples ranges from several nanometers to several micrometers. Non-Darcy flow has been widely acknowledged in such a small space because of its remarkable surface effects (Feng et al., 2018b; Feng et al., 2019). 2) Microfractures induced by the imbibed water could also influence the imbibition process. 3) Some special phenomena (e.g., electric double layer, electro-viscosity, and osmotic pressure) induced by the ion in the formation fluids increase the complexity of multiphase flow (Feng et al., 2018a). This would be our future work.
4 Numerical Simulation and Field Application
In this section, well A in the Chang 6 reservoir is taken to perform the numerical simulation. The Chang 6 reservoir is located in the eastern region of the Yanchang oil field. The buried depth is in the range of 500–700 m. The average porosity is only 7–9%, and the average permeability is 0.3–0.5 mD. Based on the geological analysis and production practice, it is confirmed that the fractures in this area are extended in the horizontal direction. Based on the multiphase flow characteristics in Section 3, we performed a series of simulations to evaluate the effect of water huff-n-puff on the well production with further considering the horizontal fracture and imbibition effect.
4 1 Model Establishment
The black oil model in CMG is adopted to simulate the water huff-n-puff in well A. The grid size is 43 × 43 × 9 (Figure 9). In the vertical direction, the reservoir is divided into nine layers, among which the fifth layer is the fracturing one. The depth of the first layer is set as 500 m. In the horizontal direction, the grid size is 7 m × 7 m. In order to describe the elliptically horizontal fracture and improve the computational accuracy, the local mesh encryption method is employed to set the grid near the well point. The sizes in this area are set as 1 m × 1 m. Therefore, the total grid number is 145 × 193 × 9. In the well pattern design, a nine-point pattern is adopted in this block, and all the well points are located in the center of the elliptic horizontal fracture. Based on the monitoring results in the field, the long axis and short axis of elliptically horizontal fracture are respectively assumed to be 35 and 25 m. The aperture and permeability of fracture are set to 0.5 cm and 300 mD, respectively. In terms of the seepage parameters, the relative permeability in Section 3.3 and capillary pressure at the reservoir temperature in Section 3.1 are adopted to describe the fluids flow in the matrix, while the diagonal line phase permeability curve is adopted to model the fluids flow in the fractures. In this simulation, the stress sensitivity of fractures is not included because of the shallow buried depth (500–700 m) and low reservoir pressure (4.5 MPa). Other reservoir parameters are shown in Table 2.
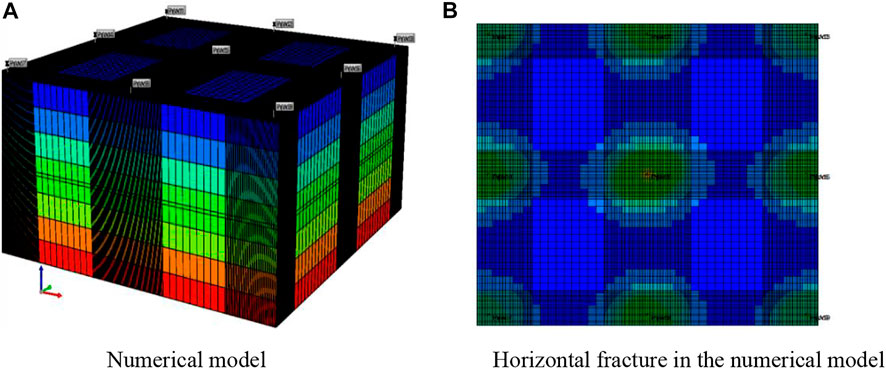
FIGURE 9. Diagram of the reservoir numerical model. (A) Numerical model. (B) Horizontal fracture in the numerical model.
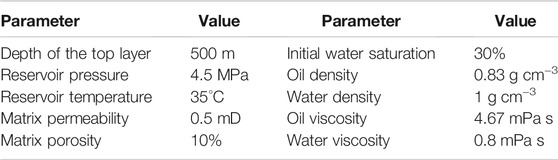
TABLE 2. Reservoir parameters and production parameters.
4 2 Sensitivities Analysis
Combined with the research status and field practice, a series of numerical simulations were performed to choose the optimal parameters in one cycle, that is, the injection rate, injected volume, and soak time. Then based on these optimal parameters, well performance with multiple cycles of huff and puff is analyzed.
4.2.1Effect of Injected Rate
With a constant injected water volume (300 m3) and constant soak time (30 days), three cases, that is, 5 m3/d, 10 m3/d, and 15 m3/d, are simulated to investigate the effect of the injected rate on the well performance. Meanwhile, depletion production is regarded as the reference. Considering the actual case in the practice field, water huff-n-puff is adopted after a year of depletion production, and the simulated time lasts for 400 days with a constant bottom pressure at 1 MPa. As shown in Figure 10, compared with the depletion production, water huff-n-puff can significantly enhance the well production. Moreover, as the injection rate increases, the time for one cycle becomes shorter and the cumulative oil production is higher. Considering the economic benefits and limitations of field injection equipment, 10 m3/d is the optimal injected rate. On the other hand, there is no difference in water production for the three cases, indicating that after soaking for 30 days, the distribution of oil and water reached a steady state. Thus, the injected water rate has little influence on water production.
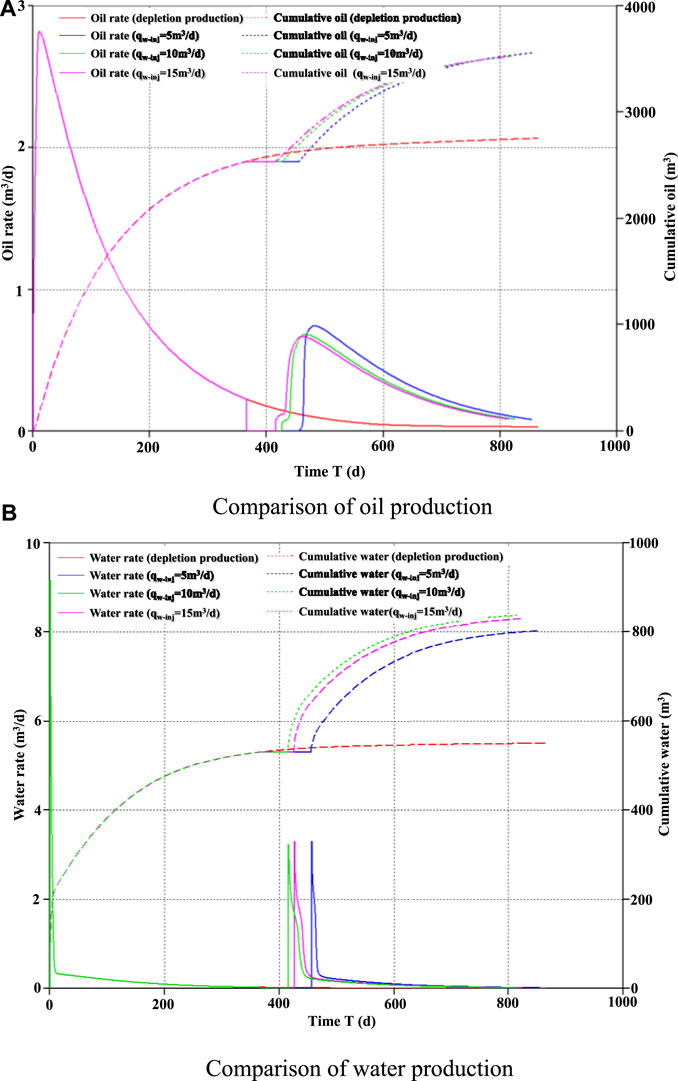
FIGURE 10. Comparison of oil and water production with different injection rates. (A) Comparison of oil production. (B) Comparison of water production.
4.2.2Injected Volume
With a constant injected water rate (10 m3/d) and constant soak time (30 days), four cases, that is, 100 m3, 150 m3, 300 m3, and 500 m3, are simulated to investigate the effect of injected volume on the well performance. The production system and the reference are consistent with the case in Section 4.2.1. As shown in Figure 11, the simulated results showed that the increase of injected water volume can enhance the production of oil. When the injected volume is small (100 and 150 m3), the well production rapidly reaches its peak once the well is reopened. This is because during the soak period, the injected water is totally imbibed to the depth of the reservoir, and the oil in the fracture and near-well zone can be outputted directly. Correspondingly, the daily water production curves have also proved this mechanism.
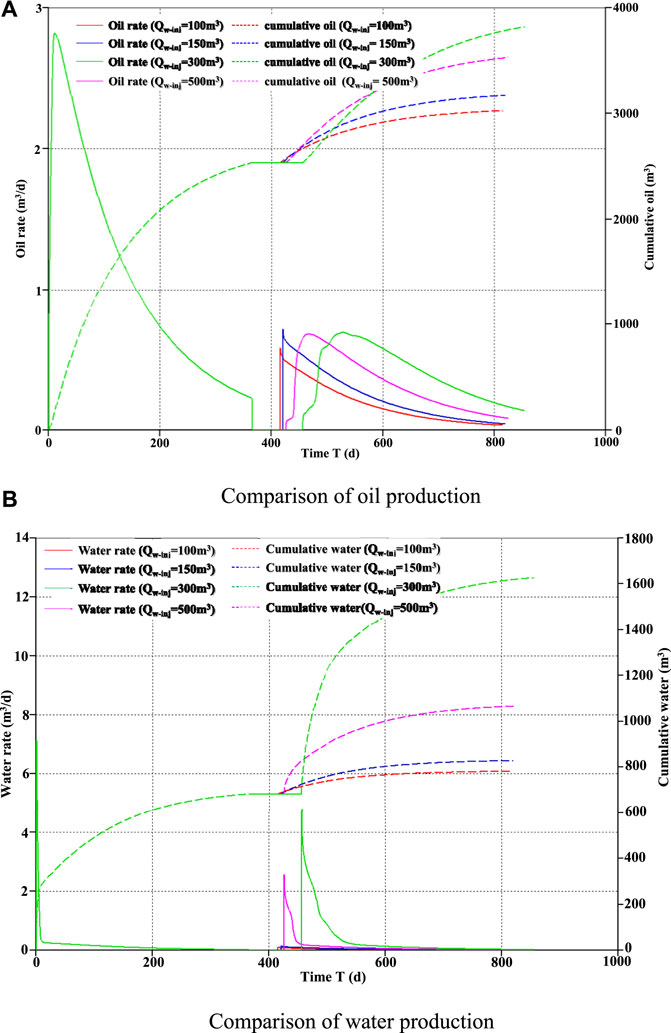
FIGURE 11. Comparison of oil and water production with different injection volumes. (A) Comparison of oil production. (B) Comparison of water production.
In terms of cumulative production, cumulative oil production increases with the increase of injection volume. With a constant injected rate, the larger the injected volume is, the longer the time for one cycle will be. After the well is reopened, within 150 days, the highest cumulative oil production is obtained with the case of 500 m3 injected water. While for a longer production time, 300 m3 is the optimal one. In terms of water production, when the injection rate is 500 m3, it takes a longer time for the daily water production to drop to the normal level, indicating that some injection water is ineffective, which neither has a contribution to the supplement of formation energy nor enhances the exchange between crude oil and injected water. Therefore, 300 m3 is the optimal injected volume for well A.
4.2.3Soak Time
Soak time is the key parameter to determine the redistribution of oil and water. With a constant injected water rate (10 m3/d) and injected volume (300 m3 day), four cases, that is, 10, 30, 50, and 70 days, are simulated to investigate the effect of soak time on well performance. As illustrated in Figure 12A, our results suggest that the soak time has an insignificant influence on the cumulative oil production. As illustrated in Figure 12B, due to the imbibition effect between injected water and crude oil, the cumulative water production decreases with the increase of soak time, and the reduction is sensitive with the soak time ranging from 10 to 30 days. However, when the soak time is over 50 days, the variation of cumulative water production is very small. In terms of the comprehensive improvement of the production level, including supplementation of formation pressure and economic benefits, 30 days is the optimal soak time for well A.
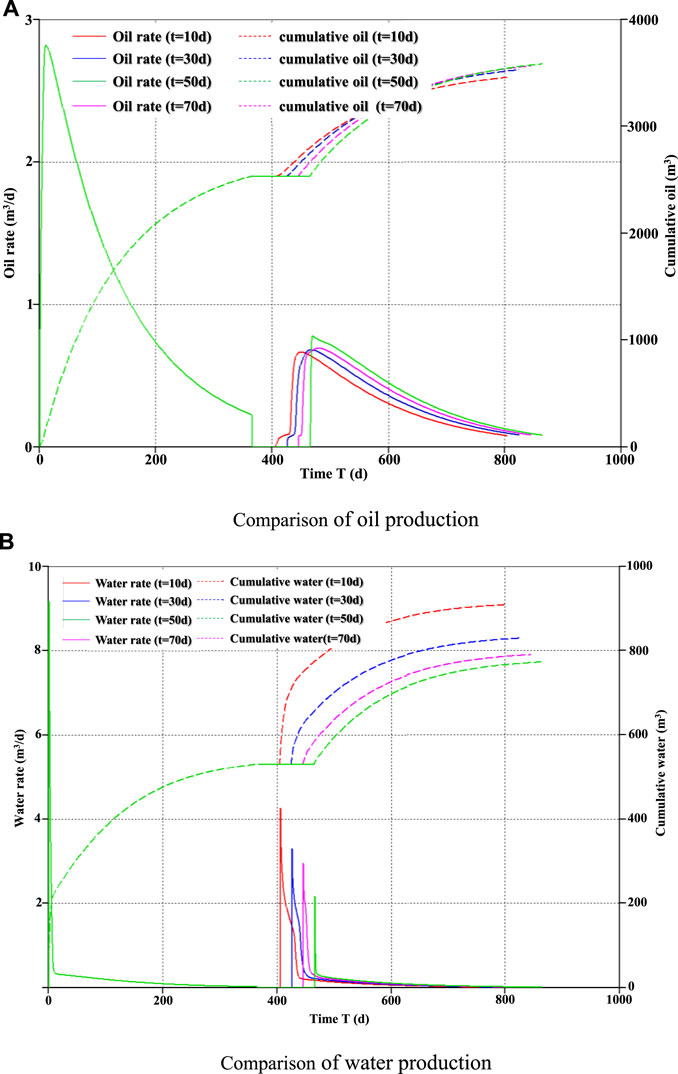
FIGURE 12. Comparison of oil and water production with different soak time. (A) Comparison of oil production. (B) Comparison of water production.
4.2.4Number of Cycles
At the field application, water huff-n-puff is usually put into practice for several cycles. With a constant water injection rate (10 m3/d) and total injected volume (900 m3), three cases, that is, one cycle, two cycles and three cycles, are simulated to investigate the effect of multiple cycles on the well production. It should be noted that one cycle includes huff, soak, and puff stages. In each cycle, the soak time is assumed to be 30 days. The simulated results are demonstrated in Figure 13. As shown in Figure 13A, for the case of one cycle, the oil production gradually decreases after reopening the well, while for the case of two cycles and three cycles, the oil production can maintain stability for a longer period of time. Meanwhile, the variation of cycle numbers is found to have little influence on the cumulative oil production. As shown in Figure 13B, we observed that the cumulative water production decreases as the cycle numbers increases, which indicates that more water is imbibed into the depth of the reservoirs and acts as a supplement to the formation energy. Therefore, increasing the number of cycles is not only beneficial to the fluids exchange but also helpful to enhance the formation pressure, which can help achieve the best development effect.
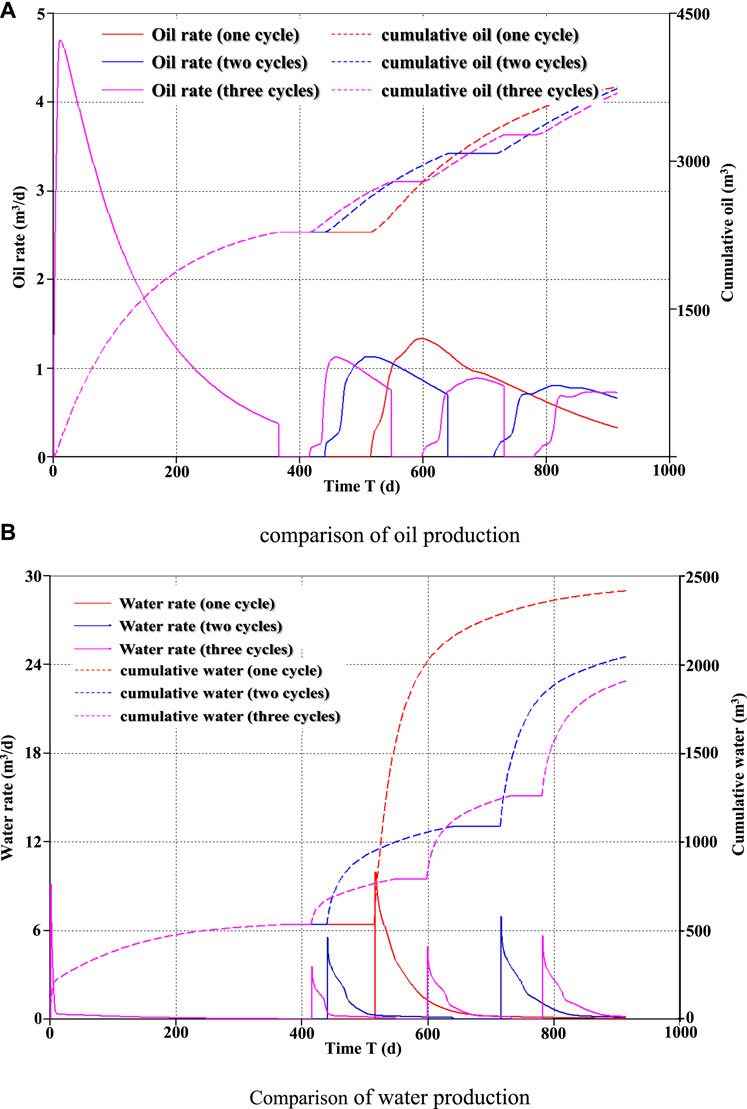
FIGURE 13. Comparison of oil and water production with different cycles. (A) Comparison of oil production. (B) Comparison of water production
5 Conclusion
In this study, we first introduced the water huff-n-puff process in a low-permeability oil reservoir with horizontal fractures and described the multiphase flow characteristics during the huff, soak, and puff stages. Then combined with a series of experiments, a comprehensive method was used to determine the key flow parameters, that is, capillary pressure and relative permeability. Finally, using the Chang 6 reservoir as an example, a series of numerical simulations were conducted to demonstrate the effect of water huff-n-puff on the well performance in this field. Based on our studies, following conclusions can be drawn:
1) The mechanism of water huff-n-puff for low-permeability reservoirs with horizontal fractures is revealed. Based on the migration of fluids, water huff-n-puff can be divided into huff, soak, and puff stages. During the shut-in period, the fluid exchange between crude oil in the matrix and water in the fractures occurs in the radial direction and the vertical direction.
2) The framework for relative permeability from the spontaneous imbibition experiments is estimated. Spontaneous imbibition experiments demonstrate the linear relationship between imbibition mass and the square root of time. Coupling this finding and capillary pressure into the two-phase flow theory, relative permeability can be properly determined.
3) Water huff-n-puff parameters for a well in the Chang 6 reservoir are optimized considering the horizontal fractures and imbibition effect. The results show that oil production is mainly influenced by the injection volume and the injection speed, while water production is mainly determined by the well shut-in time. The optimal injection volume, injection rate, and well shut-in time are 300 m3, 10 m3/d, and 30 days, respectively. Moreover, the increase in the cycle number is not only beneficial to the fluids exchange but also helpful to enhance the formation pressure. Both of them can accelerate the development of low-permeability oil reservoirs.
Data Availability Statement
The raw data supporting the conclusion of this article will be made available by the authors, without undue reservation.
Author Contributions
XM contributed to conceptualization, methodology, and writing—original draft. SH helped with methodology, writing—review and editing, and supervision. HZ assisted with methodology and validation. FG contributed to conceptualization and methodology. YG helped with software. XL assisted with funding acquisition and supervision.
Conflict of Interest
Authors HZ, FG, and YG were employed by the company Yanchang Oilfield Co. Ltd.
The remaining authors declare that the research was conducted in the absence of any commercial or financial relationships that could be construed as a potential conflict of interest.
Publisher’s Note
All claims expressed in this article are solely those of the authors and do not necessarily represent those of their affiliated organizations, or those of the publisher, the editors, and the reviewers. Any product that may be evaluated in this article, or claim that may be made by its manufacturer, is not guaranteed or endorsed by the publisher.
Acknowledgments
We acknowledge the support of the National Natural Science Foundation Projects of China (51874319).
References
Alyafei, N., and Blunt, M. J. (2018). Estimation of Relative Permeability and Capillary Pressure from Mass Imbibition Experiments. Adv. Water Resour. 115, 88–94. doi:10.1016/j.advwatres.2018.03.003
Feng, D., Bakhshian, S., WuSong, K. Z., Song, Z., Ren, B., Li, J., et al. (2021). Wettability Effects on Phase Behavior and Interfacial Tension in Shale Nanopores. Fuel 290, 119983. doi:10.1016/j.fuel.2020.119983
Feng, D., Li, X., Wang, X., Li, J., Sun, F., Sun, Z., et al. (2018a). Water Adsorption and its Impact on the Pore Structure Characteristics of Shale clay. Appl. Clay Sci. 155, 126–138. doi:10.1016/j.clay.2018.01.017
Feng, D., Li, X., WangLiZhang, X. J. X., Li, J., and Zhang, X. (2018b). Capillary Filling under Nanoconfinement: the Relationship between Effective Viscosity and Water-wall Interactions. Int. J. Heat Mass Transfer 118, 900–910. doi:10.1016/j.ijheatmasstransfer.2017.11.049
Feng, D., Wu, K., Wang, X., Li, J., and Li, X. (2019). Modeling the Confined Fluid Flow in Micro-nanoporous media under Geological Temperature and Pressure. Int. J. Heat Mass Transfer 145 (145), 118758. doi:10.1016/j.ijheatmasstransfer.2019.118758
Fisher, K., and Warpinski, N. (2012). Hydraulic-Fracture-Height Growth: Real Data. SPE Prod. operations 27 (01), 8–19. doi:10.2118/145949-pa
Gao, S., Yang, Y., Liao, G., Xiong, W., Liu, H., Shen, R., et al. (2022). Experimental Research on Inter-fracture Asynchronous Injection-Production Cycle for a Horizontal Well in a Tight Oil Reservoir. J. Pet. Sci. Eng. 208, 109647. doi:10.1016/j.petrol.2021.109647
Graham, J. W., and Richardson, J. G. (1959). Theory and Application of Imbibition Phenomena in Recovery of Oil. Trans. AIME 216, 377–381. doi:10.2118/1143-g
Han, B., Cui, G., Wang, Y., Zhang, J., Zhai, Z., Shi, Y., et al. (2021). Effect of Fracture Network on Water Injection Huff-Puff for Volume Stimulation Horizontal wells in Tight Oil Reservoir: Field Test and Numerical Simulation Study. J. Pet. Sci. Eng. 207, 109106. doi:10.1016/j.petrol.2021.109106
Hartsock, J. H., and Warren, J. E. (1961). The Effect of Horizontal Hydraulic Fracturing on Well Performance. J. Petrol. Technol. 13, 1050–1056. doi:10.2118/61-pa
Held, R. J., and Celia, M. A. (2001). Modeling Support of Functional Relationships between Capillary Pressure, Saturation, Interfacial Area and Common Lines. Adv. Water Resour. 24, 325–343. doi:10.1016/s0309-1708(00)00060-9
Huang, L., Ning, Z., Lin, H., Zhou, W., Wang, L., Zou, J., et al. (2021b). High-pressure Sorption of Methane, Ethane, and Their Mixtures on Shales from Sichuan Basin, China. Energy Fuels 35 (5), 3989–3999. doi:10.1021/acs.energyfuels.0c04205
Huang, L., Zhou, W., XuWang, H. Lu., Wang, L., Zou, J., and Zhou, Q. (2021a). Dynamic Fluid States in Organic-Inorganic Nanocomposite: Implications for Shale Gas Recovery and CO2 Sequestration. Chem. Eng. J. 411, 128423. doi:10.1016/j.cej.2021.128423
Li, Z., Qu, X., Liu, W., Lei, Q., Sun, H., and He, Y. (2015). Development Modes of Triassic Yanchang Formation Chang 7 Member Tight Oil in Ordos Basin, NW China. Petrol. Explor. Dev. 42 (2), 217–221. doi:10.1016/s1876-3804(15)30011-2
Liu, L., Liu, Y., Yao, J., and Huang, Z. (2020). Mechanistic Study of Cyclic Water Injection to Enhance Oil Recovery in Tight Reservoirs with Fracture Deformation Hysteresis. Fuel 271, 117677. doi:10.1016/j.fuel.2020.117677
Rangel-German, E. R., and Kovscek, A. R. (2004). “Microvisual Analysis of Matrix-Fracture Interaction,” in SPE International Petroleum Conference in Mexico. doi:10.2118/92133-ms
Rao, X., Zhao, H., and Deng, Q. (2020). Artificial-neural-network (ANN) Based Proxy Model for Performances Forecast and Inverse Project Design of Water Huff-N-Puff Technology. J. Pet. Sci. Eng. 195, 107851. doi:10.1016/j.petrol.2020.107851
Ren, W., Li, G., Tian, S., Sheng, M., and Geng, L. (2016). Analytical Modelling of Hysteretic Constitutive Relations Governing Spontaneous Imbibition of Fracturing Fluid in Shale. J. Nat. Gas Sci. Eng. 34, 925–933. doi:10.1016/j.jngse.2016.07.050
Sun, K., Liu, H., Wang, J., Wei, X., Ma, L., Kang, Z., et al. (2022). Three-dimensional Physical Simulation of Water Huff-N-Puff in a Tight Oil Reservoir with Stimulated Reservoir Volume. J. Pet. Sci. Eng. 208, 109212. doi:10.1016/j.petrol.2021.109212
Takahashi, S., and Kovscek, A. R. (2010). Spontaneous Countercurrent Imbibition and Forced Displacement Characteristics of Low-Permeability, Siliceous Shale Rocks. J. Pet. Sci. Eng. 71 (1-2), 47. doi:10.1016/j.petrol.2010.01.003
Tavassoli, Z., Zimmerman, R. W., and Blunt, M. J. (2005). Analysis on Counter-current Imbibition with Gravity in Weakly Water-Wet Systems. J. Pet. Sci. Eng. 48 (1–2), 94–104. doi:10.1016/j.petrol.2005.04.003
Wang, D., Cheng, L., Cao, R., Jia, P., Fang, S., Rao, X., et al. (2019). The Effects of the Boundary Layer and Fracture Networks on the Water Huff-N-Puff Process of Tight Oil Reservoirs. J. Pet. Sci. Eng. 176, 466–480. doi:10.1016/j.petrol.2019.01.065
Wang, X., Peng, X., Zhang, S., Du, Z., and Zeng, F. (2018). Characteristics of Oil Distributions in Forced and Spontaneous Imbibition of Tight Oil Reservoir. Fuel 224, 280–288. doi:10.1016/j.fuel.2018.03.104
Wang, Y., Liu, H., Guo, M., Shen, X., Han, B., and Zhou, Y. (2021b). Image Recognition Model Based on Deep Learning for Remaining Oil Recognition from Visualization experiment. Fuel 291, 120216. doi:10.1016/j.fuel.2021.120216
Wang, Y., Liu, H., and Zhou, Y. (2021a). Development of a Deep Learning-Based Model for the Entire Production Process of Steam-Assisted Gravity Drainage (SAGD). Fuel 287, 119565. doi:10.1016/j.fuel.2020.119565
Keywords: water huff-n-puff, low-permeability reservoirs, horizontal fracture, Chang 6 reservoir, imbibition
Citation: Meng X, Hang S, Zhang H, Gao F, Gao Y and Li X (2022) Study of Water Huff-n-Puff in Low-Permeability Oil Reservoirs With Horizontal Fractures: A Case Study of Chang 6 Reservoir in Yanchang, China. Front. Earth Sci. 9:824410. doi: 10.3389/feart.2021.824410
Received: 29 November 2021; Accepted: 29 December 2021;
Published: 31 January 2022.
Edited by:
Yu Pang, University of Calgary, CanadaReviewed by:
Yanwei Wang, Jilin University, ChinaLiang Huang, Chengdu University of Technology, China
Lei Li, China University of Petroleum (Huadong), China
Copyright © 2022 Meng, Hang, Zhang, Gao, Gao and Li. This is an open-access article distributed under the terms of the Creative Commons Attribution License (CC BY). The use, distribution or reproduction in other forums is permitted, provided the original author(s) and the copyright owner(s) are credited and that the original publication in this journal is cited, in accordance with accepted academic practice. No use, distribution or reproduction is permitted which does not comply with these terms.
*Correspondence: Xuangang Meng, bXh1YW5nYW5nQDE2My5jb20=