 Shilin Wang1
 Hu Li
Hu Li Shuai Yin
95% of researchers rate our articles as excellent or good
Learn more about the work of our research integrity team to safeguard the quality of each article we publish.
Find out more
ORIGINAL RESEARCH article
Front. Earth Sci. , 07 January 2022
Sec. Economic Geology
Volume 9 - 2021 | https://doi.org/10.3389/feart.2021.823855
This article is part of the Research Topic Advances in the Study of Natural Fractures in Deep and Unconventional Reservoirs View all 29 articles
Structural fractures have a significant control effect on the large-scale accumulation of hydrocarbons in the Yanchang Formation. Previous studies have affirmed the important role of fractures in hydrocarbon accumulations in strongly deformed zones. However, for low-amplitude structural areas, the degree of fracture development is relatively low, and their control on sweet spots of hydrocarbons has not yet formed a unified understanding. In this paper, taking the Upper Triassic Yanchang Formation in the western Ordos Basin as an example, the development characteristics, prediction method, and the distribution of fractures in tight sandstone reservoirs in low-amplitude structural areas have been systematically studied using a large number of cores, thin sections, paleomagnetism, FMI logging, acoustic emission, productivity data, and finite element method. The research results showed that the Yanchang Formation in the study area mainly develop high-angle and vertical fractures, which were formed by regional tectonic shearing. Fractures are mainly developed in the fine-grained and ultra-fine-grained sandstones of the distributary channel and estuary bar microfacies, while the fractures in the medium-grained sandstones of the distributary channel and the mudstones of the distributary bay are relatively underdeveloped. The core fractures and micro-fractures of the Yanchang Formation all have the regional distribution characteristics, and the fracture strikes are mainly between NE50° and NE 70°. Moreover, the finite element method was used to predict the fractures in the target layer, and the prediction results are consistent with the actual distribution results of the fractures. The coupling analysis of fractures and tight oil sandstone distribution showed that the existence of fractures provided conditions for the accumulation of hydrocarbons in the Yanchang Formation. The confluence and turning areas of the river channels were repeatedly scoured by river water, and the rocks were brittle and easy to form fractures. The thickness of the fractured sandstone in these areas is usually greater than 0.4 m. Moderately developed fracture zones are prone to form hydrocarbon accumulation “sweet spots,” and the fracture indexes of these areas are usually distributed between 0.8 and 1.2. However, when the fracture index exceeds 1.2, over-developed fractures are unfavorable for the accumulation of hydrocarbons.
The sweet spot prediction of fractured reservoirs is a hot spot in the current petroleum industry research (Borgia et al., 1996; Du and Yang., 2004; Barton et al., 2009; Cai., 2020; Cheng et al., 2020). Fractured reservoirs have strong heterogeneity, so traditional fracture evaluation methods face many challenges, such as the fine identifications of fractured segments and fracture sweet spots of tight reservoirs based on geophysical methods (Baecher., 1983; Bhatti et al., 2020; Chen., 2020; Fan et al., 2020a; Han et al., 2021; Liu et al., 2021a). At present, the conventional methods for identifying and evaluating reservoir fractures include core observations, conventional and imaging logging (Dowd et al., 2007; Casini et al., 2016; Li et al., 2019; Cao et al., 2020; Fan et al., 2020b; Liu et al., 2020a; Bukar et al., 2021). The cores obtained by drilling can be used to directly observe the development of underground fractures (Dcrshowitz and Einstein., 1988; Li et al., 2021; Yang et al., 2021; Xu and Gao., 2020; Nakaya and Nakamura., 2007; Dong et al., 2018; Hong et al., 2020; Liu et al., 2020b; Liu et al., 2021b). However, due to the impact of drilling and stress release, the core will crack after it was taken from the downhole to the ground, so it is necessary to identify the cause of the fractures on the core (Fan et al., 2018; Gao., 2019; Fan., 2020; Fu and Wang, 2020; Liu et al., 2020c; Liu et al., 2020d; Liu et al., 2021c). In addition, it is difficult to determine the original orientation of the fractures in the collected cores, while imaging logging overcomes this shortcoming (Gao., 2019; Liu et al., 2021c).
The collection cost of conventional logging data is much cheaper than other data, so it is widely used in reservoir exploration and evaluation (Jiang et al., 2017; Liu et al., 2019; Santosh and Feng., 2020; Yoshida and Santosh., 2020; He et al., 2021; Huang et al., 2021). However, the logging response is a comprehensive reflection of the various characteristics of the rock, and it is easily affected by factors such as fillings, mud, and dissolution (Mardia et al., 2007; Laubach et al., 2009; Sun et al., 2014; Hu et al., 2020; Li et al., 2020; Kang., 2021). Therefore, it is very difficult to directly use conventional logging curves to identify fractures. Imaging logging can intuitively provide the image information of the borehole wall, so it is currently the most effective fracture identification method (Sait and Matthew., 2013; Liu et al., 2017; Zhao et al., 2017; Peacock et al., 2018; Zhang et al., 2020; Li., 2021; Xue et al., 2021; Zhao et al., 2021; Gao., 2021). High-quality imaging logging data can provide information such as strike, dip, and opening of fractures. The information volume collected by imaging logging is large, so this type of logging method is time-consuming and expensive, and is only used by a few key wells (Liu et al., 2017; Li., 2021).
The finite element method is an effective technique widely used in the prediction of fracture distribution in tight reservoirs in recent years. The application of this technology is based on the established mechanical and mathematical models, and it is assumed that the deformation of the rock mass is the main reason for the rock mass ruptures (Murry., 1965; Mizoguchi and Ueta, 2013; Sebacher et al., 2017; Yin and Gao., 2019; Paiaman and Ghanbarian., 2021). For the Ordos Basin, the Mesozoic strata mainly developed low-amplitude structures, and low-amplitude structures represented weak compression stresses and weak deformation activities. Therefore, what kind of finite element model can be used to effectively characterize fractures is a problem worthy of in-depth study.
Tight oil sandstone reservoirs are developed in the Upper Triassic Yanchang Formation in the western Ordos Basin. The reservoir porosity is usually less than 10% and the gas permeability is less than 1 mD. The previous predictions of the sweet spots of tight oil sandstone reservoirs in the western Ordos Basin were mainly based on source rocks, sedimentary microfacies, diagenesis, and pore structures (Dong et al., 2018; Hong et al., 2020). There are few studies on the prediction of fractures in tightly heterogeneous continental tight sandstone reservoirs in low-amplitude structural areas. In this paper, taking the Upper Triassic Yanchang Formation in the western Ordos Basin as an example, the development characteristics, prediction method, and the distribution of fractures in tight oil sandstone reservoirs in low-amplitude structural areas have been systematically studied using a large number of cores, thin sections, paleomagnetism, FMI logging, acoustic emission, productivity data, and finite element method. This research can provide new ideas for the prediction of the “sweet spot” of continental tight oil sandstone reservoirs.
The Ordos Basin is a large multi-cycle craton basin. According to the current structural morphology, the basin was divided into six primary structural units, including the Yimeng Uplift, Weibei Uplift, West Shanxi Flexfold Belt, Yishan Slope, Tianhuan Depression, and West Margin Thrust Structural Belt. Low-amplitude structures are developed in the marginal area of the basin, and the structural fluctuations per 1 km are usually less than 10 m. The study area is located in the western oil-bearing area of the Ordos Basin (Figure 1). The Chang 6 to Chang 8 oil-bearing intervals in the study area is developed on the west-dip monoclinal structure, and the scale of inherited low amplitude uplift is generally 1–4 km2.
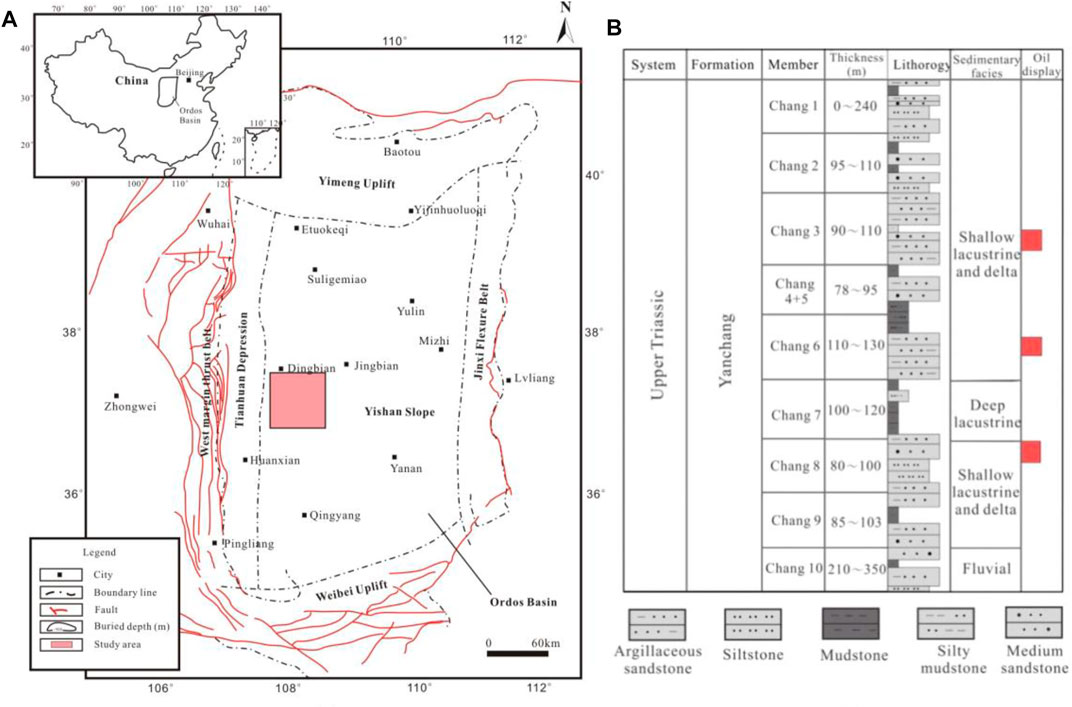
FIGURE 1. Location and stratum comprehensive histogram of the study area. Notes: (A) The study area is located in the western part of the Yishan Slope in the Ordos Basin; (B) The stratigraphic unit composition of the Upper Triassic Yanchang Formation in the study area.
The sedimentary unit division of the study area is shown in Figure 1. The target layers are the Chang 6 and the Chang 8 Members of the Yanchang Formation. When the Chang 8 oil layer group was deposited, the lake basin had been in a sinking state until the Chang 7 oil layer group reached the maximum burial depth. At this time, the continental lake developed to the largest scale, and the deep lake source rock was formed at this stage. In the Chang 6 depositional period, the continental lake basin gradually began to shrink, and the subsidence rate was lower than the sedimentation compensation rate, and the lake basin delta formed. The Chang 6 and Chang 8 Members of the Yanchang Formation in the western oil region mainly develop underwater distributary channels, distributary bays, estuary bars, far sand bars, and semi-deep lake-deep lake mud microfacies. Chang 6 Member is further divided into Chang 61, Chang 62, Chang 63 and Chang 64 sub-members; and Chang 8 Member is further divided into Chang 81 and Chang 82 sub-members. Chang 61 and Chang 81 are the main oil producing horizons in this area.
The technical methods used in this paper include conventional and FMI imaging logging, paleomagnetic experiments, acoustic emission testing, and finite element simulation. FMI imaging logging can provide high-resolution 360° omnidirectional two-dimensional petrophysical image information around the borehole wall (Ortega et al., 2006; Olson et al., 2009; Qie et al., 2021; Wang et al., 2021). The difference in resistivity or acoustic impedance caused by stratum characteristics such as lithology, fractures, pores, and bedding are converted into different color scales on the image. This technology intuitively and clearly displays the subtle changes in geological features such as the rock types, rock structures, sedimentary structures, pores, and fractures in the two-dimensional space surrounding the borehole wall in the form of images.
The 2G superconducting magnetometer measurement and the MMTD80 thermal demagnetizer from Magnetic Measurements were used for paleomagnetic experiments, and the fracture direction was determined. The demagnetization temperature of the samples include 12 points: normal temperature, 50°, 100°, 150°, 200°, 250°, 300°, 350°, 400°, 450°, 500°, and 600°. The remanence of the sample after demagnetization in each temperature range is measured, and the vector analysis is performed on the low-temperature viscous remanence of the final period. Furthermore, the viscous remanence VRM of the modern geomagnetic field magnetization recorded by the core is obtained. Since the VRM direction is consistent with the modern geomagnetic field direction, that is, it is consistent with the geographic coordinates, the core fracture strike was obtained by referring to the core fracture mark line.
The main result of the acoustic emission test is to obtain the corresponding stress value when the rock specimen is cracked under the load. The rock specimen is subjected to an axial load, and then the acoustic emission signal generated during the entire compression process of the specimen is measured. The acoustic emission instrument used in this study is a rock physics testing system. The specimen will have several large ruptures during the process of axial load, and the load value corresponding to each rupture corresponds to the ancient stress value. In this study, the samples for acoustic emission testing were taken from the 2.213 m cores of Well D4578.
The main structural period stress intensities experienced by the target layer in the study area were simulated combined with the three-dimensional finite element method (Figure 2). The finite element simulation software was ANSYS. Based on core observations, FMI imaging logging fracture identifications and tectonic stress field simulations, the development characteristics and distribution of fractures in the tight reservoirs of the Yanchang Formation have been predicted.

FIGURE 2. Technical process of finite element simulation.
The sedimentary structures of a rock is a direct reflection of the sedimentary environment and hydrodynamic conditions when it was formed, and it has an inherent relationship with the rock combination (Robinson et al., 1998; Xu et al., 2006; Xu and Dowd., 2010; Zhang and Wang., 2020). Affected by changes in the depositional environment and hydrodynamic conditions, the sedimentary structures of the Chang 6 and Chang 8 Members include lenticular bedding, trough-like cross bedding, block bedding, wavy bedding, parallel bedding and erodsion surfaces, and the convolute bedding can be seen locally (Figures 3A–D). They are all important signs for identifying sedimentary facies and microfacies (Yin et al., 2019; Yin et al., 2020). Plant debris appeared in part of the cores (Figure 3E), and the color was gray-dark gray. The lithology of channel sand bodies was mainly medium-fine-grained sandstone (Figure 3).
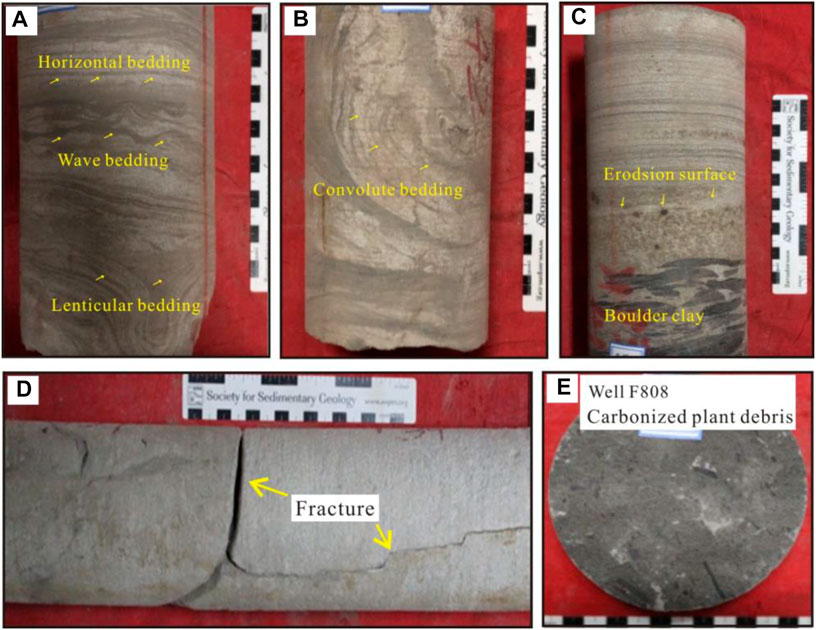
FIGURE 3. Core pictures of the tight sandstone of Yanchang Formation in the study area. Notes: (A) Well J41, 1 707.87 m, bedding structures; (B) Well J41, 1 711.41 m, convolute bedding; (C) Well J41, 1 645.96 m, boulder clay; (D) Well F3, 1.074 m, vertical and horizontal fractures; (E) Well F808, 1 951.7 m, carbonized plant debris.
The sandstone type in the study area is mainly feldspar sandstone, and feldspar is composed of potash feldspar and plagioclase. Among them, the plagioclase content is slightly higher than the potassium feldspar content, and the total feldspar content exceeds 50%. There is no significant difference between the Chang 6 and Chang 8 Members in the percentages of quartz, feldspar, and rock debris. The lithic components of the Chang 6 and Chang 8 Members are mainly eruptive rocks and granites, and the content of eruptive rocks is higher than that of granites. In addition, the main components of the cements of the Chang 6 and Chang 8 Members are carbonate minerals and clay minerals, while the content of clay iron, iron clay, and siliceous is very small.
The Yanchang Formation in the western oil region mainly developed high-angle and vertical fractures (Figure 3D). Most of the fracture surfaces observed in the core observations were straight and smooth, and the tail ends of the fractures had the phenomenon of folding tails, diamond-shaped knots, and diamond-shaped bifurcations. According to the core observations, the Yanchang Formation mainly developed vertical fractures, accounting for 70%, and oblique fractures and horizontal fractures accounted for 20 and 10%, respectively. Vertical and oblique fractures are mainly formed by regional structural shearing; and bedding fractures are mainly formed by the sliding of parallel bedding with peeling lineage under the combined action of sedimentary and tectonic stresses (Yin et al., 2018; Yin and Wu., 2020).
In addition to core observations, imaging logging can also help people visually observe the fractures (Yang et al., 2020; Zhao et al., 2020). Different types of fractures have different resistivity image characteristics. Under normal circumstances, when the fracture is in an open state, according to the fracture network invaded by the drilling fluid, the fracture exhibits an abnormal high conductivity. Furthermore, it is displayed as a dark sinusoidal curve on the electrical imaging and acoustic imaging diagrams. When the fracture angle is low, the amplitude of the sine curve is low, and when the fracture angle is high, the amplitude of the sine curve is high; vertical fractures appear as symmetrical dark lines (Figure 4). When the fracture is half-filled or filled, the color of the sinusoidal curve displayed on the electrical imaging and acoustic imaging diagrams is different according to the difference of the filling degrees and the filling compositions.
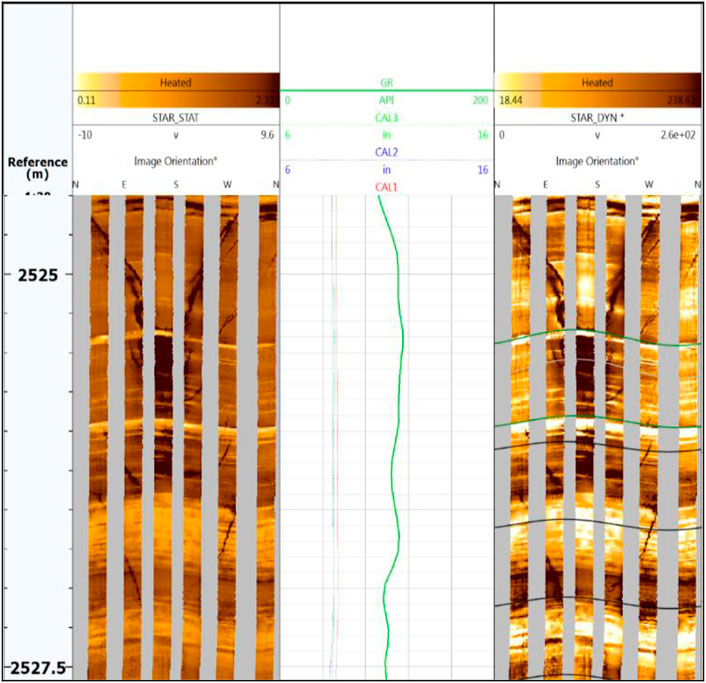
FIGURE 4. Response of fractures in the target formation on FMI imaging logging. Notes: Well 4548-3, Chang 6 Member, 2 524.5–2 527.5 m.
The statistical results of the fracture parameters of the target layer in the study area are shown in Figure 5. The tight oil sandstone reservoir of the target layer mainly develops vertical fractures, and the fracture width is mostly less than 1 mm, and the vertical cut depth of the fracture is mostly less than 40 cm (Figures 5A–C). The statistical results also show that the fractures are mainly developed in the fine sandstone and ultra-fine sandstone of the distributary channel and estuary bar microfacies, while the fractures in the medium-grained sandstone of the distributary channel and the mudstone of the distributary bay are relatively underdeveloped.
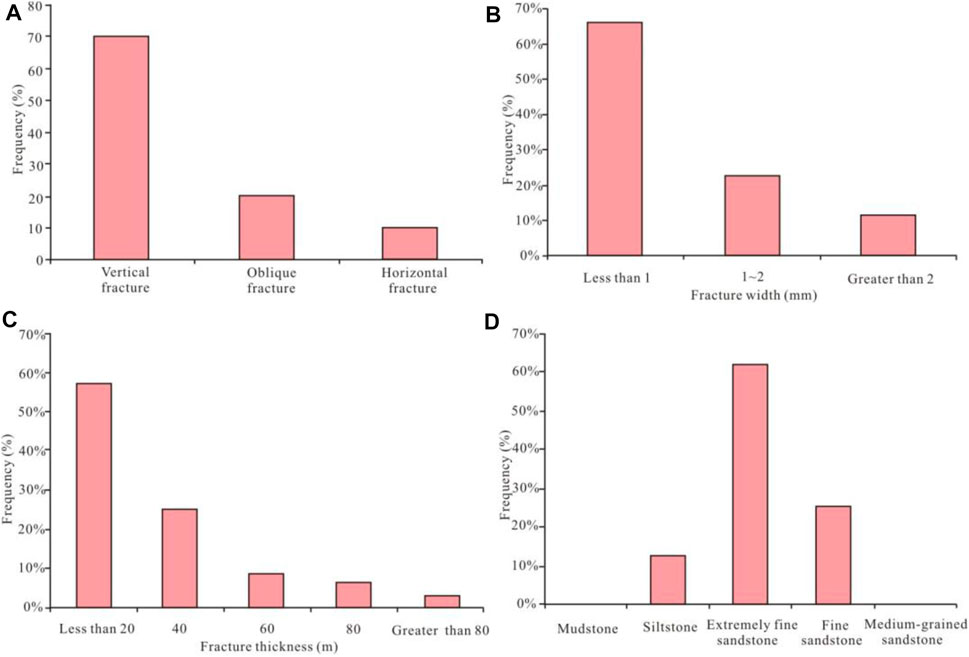
FIGURE 5. Distribution histogram of the fracture parameters of the target layer in the study area. (A) Fracture dip angle distribution; (B) Fracture opening distribution; (C) Fracture thickness distribution; (D) Ratio of fractures in different lithologies.
The Chang 6 and Chang 8 reservoirs of the Yanchang Formation in the study area have developed pores and micro-fractures. The pores are mainly intergranular pores (Figure 6A), followed by dissolution pores. The dissolution pores are mainly feldspar pores and a small amount of matrix pores. Both Chang 6 and Chang 8 reservoirs developed a large number of micro-fractures (Figure 6B). The volume of micro-fractures is very small, so its storage performance is limited, and the micro-fractures mainly play the role of fluid drainage. Microscopic thin-section observations showed that most of the microfractures in the tight sandstone of the Yanchang Formation are open fractures, with good fracture effectiveness (Figure 6B); some of the microfractures were fully filled by mud and the fracture effectiveness was poor.
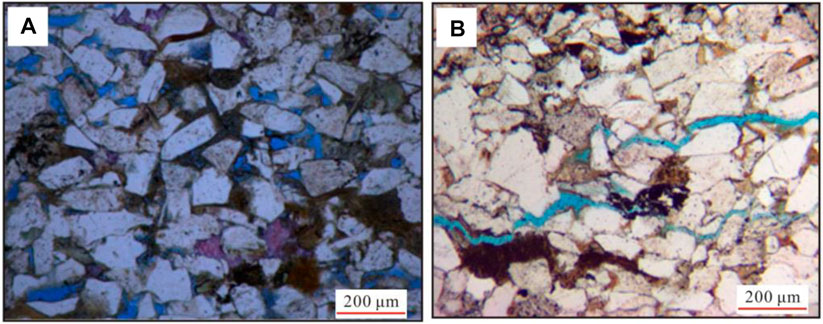
FIGURE 6. Development characteristics of micro-fractures in the tight sandstone of Yanchang Formation in the study area. Notes: (A) Well Y491, 1 731.46 m, intergranular pores and intergranular dissolution pores; (B) Well F668, 1 857.87 m, micro-fractures.
The microfractures in the Yanchang Formation are mostly straight fractures with a long extension distance and often pass through multiple particles. The previous divided the micro-fractures into Type I, Type II, and Type III (Laubach et al., 2009). Type I microfractures usually pass through a single particle or multiple particles with a small opening; Type II microfractures are usually distributed inside a single particle and are the results of mutual extrusion between particles, with a large opening; Type III micro-fractures are inherited micro-fractures, which are mainly affected by diagenetic evolution. They have no fixed shape and are mainly distributed inside the particles. Observations of microfractures in the Yanchang Formation reservoir in the study area showed that the microfractures of the Yanchang Formation had the characteristics of regional fractures, which were Type I microfractures.
The paleomagnetic experiment results showed that the fracture strikes of the Yanchang Formation in the study area were mainly distributed between NE50° and NE70° (Figure 7), which further indicated that the direction of regional stress on these fractures was the NE direction (Yin et al., 2020). Under the action of the regional environmental stress in the NE direction, a group of symmetrical conjugate shear fractures will form in the formation (Yin et al., 2019). Therefore, the direction of the other group of conjugate fractures was biased toward the northwest direction. Of course, the degree of development and opening of the fractures in the NW direction are significantly lower than those in the NE direction.
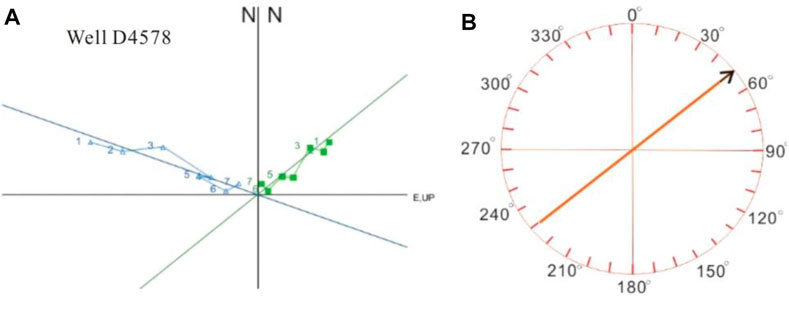
FIGURE 7. Analysis of fracture strik based on paleomagnetic tests. Notes: (A) Demagnetization temperature data, which has 12 points: normal temperature, 50°, 100°, 150°, 200°, 250°, 300°, 350°, 400°, 450°, 500°, 600°; (B) Recovery result of main fracture strike.
In this paper, ANSYS software was used for stress field simulation and fracture prediction (Yin et al., 2020). The main steps include modeling, element division, mechanical parameter assignment, stress loading, and fracture parameter calculation (Dong et al., 2018). The idea of the 3D geological model technology is based on the theoretical basis of shape function and trend surface analysis. The pre-processing module was used for geological model construction. In order to achieve the desired effect, the process is realized by a method based on spatial surface interpolation and fitting (Dong et al., 2018).
This modeling technique can realize the restoration of the tectonic stress field and the simulation of the spatial distribution of regional fractures. In the trend surface analysis method to restore the tectonic stress field, the dynamic mechanism of bumps or depressions is generally related to folds, and the tectonic stress system of bumps or depressions is consistent. The stress function solution can be obtained by solving the equation expressed by the surface deflection W (x, y) in the elastic plane:
In the formula, q (x, y) is the external load borne by the thin plate; D is the bending stiffness of the geological body, and its expression is as follows:
In the formula: E and υ are the elastic modulus and Poisson’s ratio, respectively; h is the thickness of the geological body.
The number of element nodes and units of the target layer finite element model based on the theoretical modeling of the shape function and the trend surface analysis method are shown in Table 1.

TABLE 1. Meshing of the target layer in the study area.
The boundary stress loading scheme and mechanical parameter assignment of the DL study area are shown in Figure 8. The fracture direction in the study area was mainly controlled by the stress in the NE direction. Combining regional stress and acoustic emission test results, the applied stress in the NE direction was 60 MPa, and the stress in the NW direction was 40 MPa. The grids were densified for the complex structures, such as the high points of the low-amplitude structure; while in the relatively flat areas, the density of the grid was appropriately reduced. For the geological model shown in Figure 8A, the grid density was 20 m. The interpretation results of logging rock mechanics parameters were used to assign values to the grid cells and discrete modeling. The different colors in Figure 8B represented different rock mechanics parameter values.
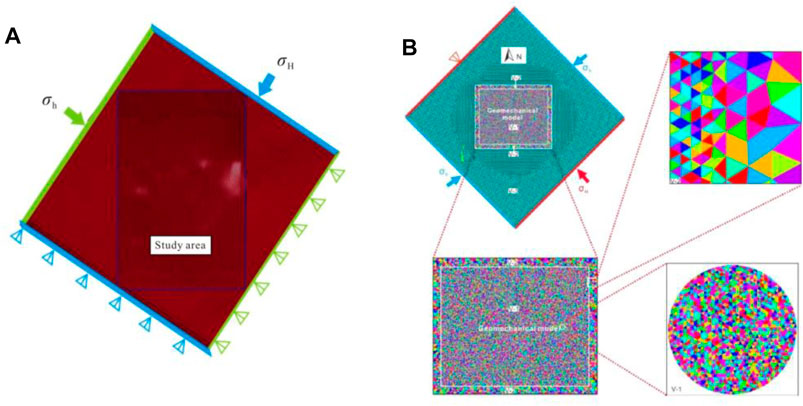
FIGURE 8. Geological model and basic parameter settings for finite element simulation in the target layer. Notes: (A) Boundary stress loading scheme; (B) Assignment of mechanical parameters (Liu et al., 2017).
In order to overcome the boundary effect and apply the boundary stress better, we expanded the periphery of the study area. When the boundary stress was applied, the overall displacement of the model was about 30 m. At this time, the displacement acting on a single finite element was also very small, so it can be ignored. The amount of strain was within the allowable range of deformation error, and the simulation results can be used for later fracture calculations.
The simulation results are mainly controlled by the geological model, environmental stress, and rock mechanical properties. These factors actually represent geological structure, stress expansion and sedimentary facies.
The study area mainly managed two strong tectonic movements, namely, the Yanshan Movement squeezed in the NW direction and the Himalayan Movement squeezed in the NE direction (Yin and Wu., 2020). At present, NE-trending fractures are mainly developed in the study area. Therefore, the paleo-tectonic stress referred to in this study belongs to the Himalayan period. The samples of acoustic emission paleo-stress test were taken from the core of 2.213 m depth in well D4578 in the study area. The test results show that σH is 58.11 MPa and σh is 31.79 MPa. Furthermore, the calculation results of the paleostress of the target layer in the study area were compared with the measured results of acoustic emissions. The comparison results showed that the absolute error between the measured value and the predicted value of the horizontal maximum principal stress was 1.11 MPa; the absolute error between the measured value and the predicted value of the minimum horizontal principal stress was -0.21 MPa. The paleo-stress simulation results were consistent with the measured results of acoustic emission, which proved that the calculation results of paleo-tectonic stress based on finite element were reliable.
In this paper, a calculation model based on the principle of conservation of energy was used to predict the plane distribution of fractures in the target layer. The basic principle is that the existence of fractures can cause significant differences in the distribution of strain energy. The strain energy density method is an effective method to predict the micro-scale ruptures of rocks, so it is suitable for low-amplitude structural areas. For weakly deformed rock masses, according to the principle of conservation of energy, the work done by external force acting on the rock mass to deform it is equal to the strain energy of the rock mass. Furthermore, the work can be obtained by the displacement of a single element node on the acting force (Zhang et al., 2006; Zheng et al., 2020). The calculation formula of thefracture index U is as follows:
In the formula, U is the fracture index; E is the Young’s modulus; ν is the Poisson’s ratio; σX, σY, and σZ are the principal stresses in different directions; τXY, τYZ, and τZX are the shear stress components in different stress directions.
The main oil layers in the study area are the Chang 61 and Chang 81 sub-members. Therefore, in this study, the Chang 61 and Chang 81 sub-members were used as the research object to carry out fracture predictions. The coupling relationship between the fracture index and the fracture thickness of the Chang 61 and Chang 81 submembers is shown in Figure 9. The fracture thickness refers to the vertical thickness of the natural fracture segment. When the fracture index is greater than 1, it is considered that a core-scale fracture has occurred in the rock mass. The fracture index distribution is consistent with the fracture thickness results (Figure 9).
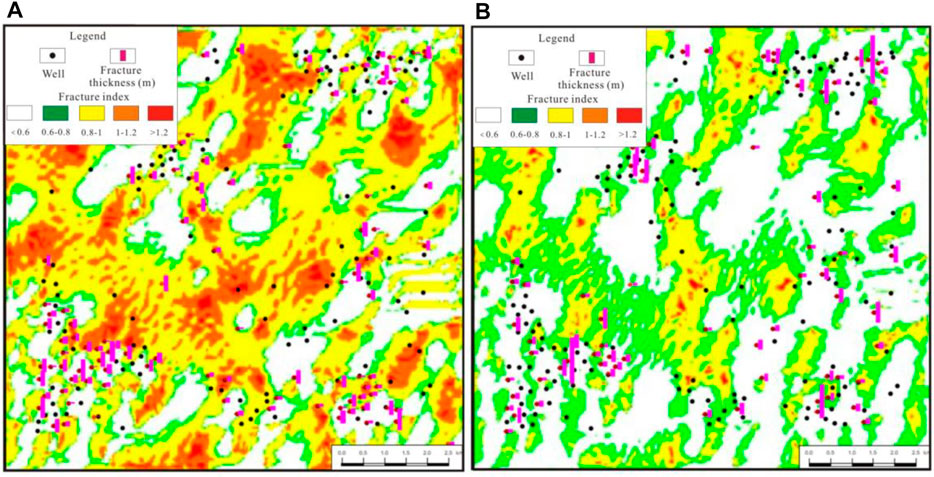
FIGURE 9. Prediction of the plane distribution of the fractures in the Chang 61 and Chang 81 sub-members in the study area. Notes: (A) Chang 61 sub-member; (B) Chang 81 sub-member.
In addition, it can be seen from Figure 9 that the predicted main direction of the fracture is between NE50° and 70° (Figure 10), which is consistent with the paleomagnetic test results.
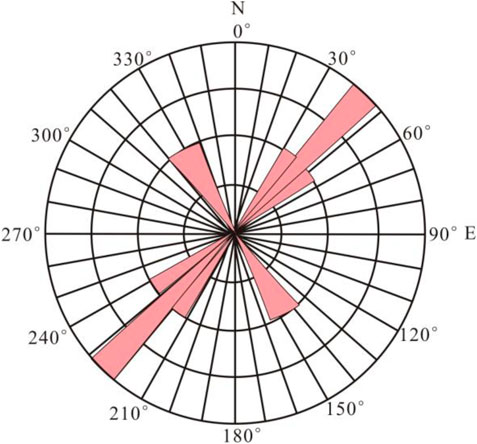
FIGURE 10. Statistical results of fracture strikes.
The Chang 6 and Chang 8 tight oil sandstone reservoirs of Yanchang Formation in the study area have no obvious oil-water interface, and lithological barriers form lithological traps. It is generally believed that the Chang 6 and Chang 8 oil layers in the study area have developed multi-stage channel sand bodies and mudstone superimposed vertically, forming a multi-stage effective lithological trap. Oil and gas fill and accumulate in multi-stage traps through high-permeability sandstone and fracture drainage system. Through this study, it is found that the widespread development of fractures is an important reason for the widespread oil-bearing in the longitudinal multi-layers of the Yanchang Formation in the study area. The provenance in the study area mainly came from the north, and the sand bodies are distributed along the north-south direction. The Chang 6 and Chang 8 members belong to the subfacies of the delta plain. Therefore, the river channel swinged frequently, and the river in the confluence or turning areas were repeatedly scoured, and the sandstones were well sorted and had greater brittleness. Furthermore, the sand bodies in these locations were prone to rupture and form fractures under the conditions of tectonic activity (Figure 11). At present, the locations where oil reservoirs have been found are also mainly located in the confluence or turning areas of river channels, and the thickness of the fractured sandstone in these areas is usually greater than 0.4 m.
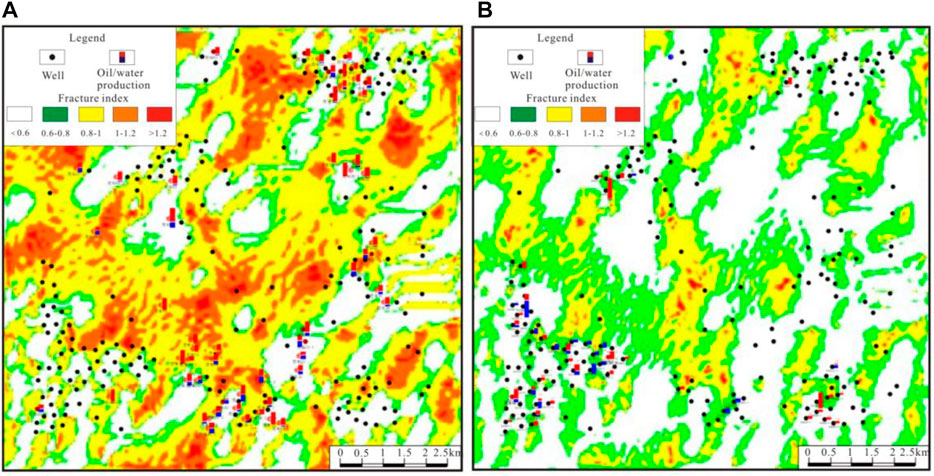
FIGURE 11. Coupling relationship between fracture distribution and hydrocarbon accumulation in the Chang 61 and Chang 81 sub-members in the study area. Notes: (A) Chang 61 sub-member; (B) Chang 81 sub-member.
The scales of low-amplitude structural traps in the study area are relatively small, mainly distributed in 1–4 km2. The study found that fractures developed in the top and wing parts of the low-amplitude structures are relatively developed, and these areas are conducive to the large-scale accumulation of hydrocarbons. Regarding the relationship between the degree of fracture development and lithology, the fractures are mainly developed in the lithology of medium and low thickness fine-grained sandstone, and the thickness of the sand body is mainly distributed in the range of 5–15 m. For extremely thick sand bodies with thickness greater than 15 m, fractures are relatively underdeveloped. The study also found that the fractures mainly developed in the wings of the main channel. The middle part of the main channel has good physical properties, and the degree of fracture development is low. However, from the middle part of the river channel to the wing part, the grain size of the sand body becomes finer, and the compaction space of the rock particles gradually becomes smaller, and the fine-grained rock is more prone to rupture. In addition, the scale of fracture development is negatively related to the thickness of the sand body. Therefore, the thickness of the sand body in the channel wing is small, and the rock is prone to rupture.
It can also be found from Figure 11 that there are many ranges of fracture index in the target layer of the study area greater than 1.2. Drilling cores also show that fractures in these areas are relatively developed. However, excessively developed fractures are not conducive to the enrichment of tight sandstone oil. This is because the sand and mudstones in the Yanchang Formation are frequently interbedded. When the fractures are developed too high, the fractures in the reservoir will communicate with the overburden and cause the escape of hydrocarbons.
On the whole, the formation and distribution of Yanchang Formation reservoirs are closely related to fracture distribution. Moderately developed fracture zones are prone to form hydrocarbon accumulation “sweet spots,” and the fracture indexes of these areas are usually distributed between 0.8 and 1.2. When the fracture index exceeds 1.2, over-developed fractures are unfavorable to the formation of oil reservoirs. For the hydrocarbon drainage system, the fractures in the wings of the main sand body are more developed, which makes the sand body more likely to be preferentially charged by hydrocarbons. Due to the lack of fractures in the middle of the river channel, the superimposed high-permeability sand bodies are the main hydrocarbon drainage system.
(1) The Yanchang Formation in the study area mainly develop high-angle and vertical fractures, which were formed by regional tectonic shearing. Fractures are mainly developed in the fine sandstone and ultra-fine sandstone of the distributary channel and estuary bar microfacies, while the fractures in the medium-grained sandstone of the distributary channel and the mudstone of the distributary bay are relatively underdeveloped.
(2) The core fractures and micro-fractures of the Yanchang Formation all have the regional distribution characteristics, and the fracture strikes are mainly between NE50° and NE 70°.
(3) The finite element method was used to predict the fractures in the target layer, and the prediction results are consistent with the actual distribution results of the fractures.
(4) The coupling analysis of fractures and tight oil sandstone distribution showed that the existence of fractures provided conditions for the accumulation of hydrocarbons in the Yanchang Formation. The confluence and turning areas of the river channels were repeatedly scoured by river water, and the rocks were brittle and easy to form fractures. The thickness of the fractured sandstone in these areas is usually greater than 0.4 m.
(5) Moderately developed fracture zones are prone to form hydrocarbon accumulation “sweet spots,” and the fracture indexes of these areas are usually distributed between 0.8 and 1.2. However, when the fracture index exceeds 1.2, over-developed fractures are unfavorable for the accumulation of hydrocarbons.
The original contributions presented in the study are included in the article/supplementary material, further inquiries can be directed to the corresponding authors.
HL and SY are responsible for the idea and writing of this paper and SW and LL are responsible for the experiments and analysis.
Author LL was employed by the Research Institute of Yanchang Petroleum (Group) Co., Ltd.
The remaining authors declare that the research was conducted in the absence of any commercial or financial relationships that could be construed as a potential conflict of interest.
All claims expressed in this article are solely those of the authors and do not necessarily represent those of their affiliated organizations, or those of the publisher, the editors and the reviewers. Any product that may be evaluated in this article, or claim that may be made by its manufacturer, is not guaranteed or endorsed by the publisher.
Baecher, G. B. (1983). Statistical Analysis of Rock Mass Fracturing. Math. Geology. 15 (2), 329–348. doi:10.1007/bf01036074
Barton, C., Moos, D., and Tezuka, K. (2009). Geomechanical Wellbore Imaging: Implications for Reservoir Fracture Permeability. Bulletin 93 (11), 1551–1569. doi:10.1306/06180909030
Bhatti, A., Ismail, A., Raza, A., Gholami, R., Rezaee, R., Nagarajan, R., et al. (2020). Permeability Prediction Using Hydraulic Flow Units and Electrofacies Analysis. Energ. Geosci. 1 (1–2), 81–91. doi:10.1016/j.engeos.2020.04.003
Borgia, G. C., Bortolotti, V., Brancolini, A., Brown, R. J., and Fantazzini, P. (1996). Developments in Core Analysis by NMR Measurements. Magn. Reson. Imaging 14 (7-8), 751–760. doi:10.1016/s0730-725x(96)00160-9
Bukar, M., Worden, R. H., Bukar, S., and Shell, P. (2021). Diagenesis and its Controls on Reservoir Quality of the Tambar Oil Field, Norwegian North Sea. Energ. Geosci. 2 (1), 10–31. doi:10.1016/j.engeos.2020.07.002
Cai, M. F. (2020). Key Theories and Technologies for Surrounding Rock Stability and Ground Control in Deep Mining. J. Mining Strata Control. Eng. 2 (3), 033037. doi:10.13532/j.jmsce.cn10-1638/td.20200506.001
Cao, L., Yao, Y., Cui, C., and Sun, Q. (2020). Characteristics of In-Situ Stress and its Controls on Coalbed Methane Development in the southeastern Qinshui Basin, North China. Energ. Geosci. 1 (1–2), 69–80. doi:10.1016/j.engeos.2020.05.003
Casini, U., Hunt, D. W., Monsen, E., and Bounaim, A. (2016). Fracture Characterization and Modeling from Virtual Outcrops. AAPG Bull. 100 (1), 41–61. doi:10.1306/09141514228
Chen, J. W. (2020). Analysis of Roadheader’s Rotary Table Onvibration Modal Based on Finite Element Method and Tested Data. J. Mining Strata Control. Eng. 2 (2), 026032. doi:10.13532/j.jmsce.cn10-1638/td.20191209.001
Cheng, J. W., Zhao, G., Sa, Z. Y., Zheng, W. C., Wang, Y. G., and Liu, J. (2020). Overlying Strata Movement and Deformation Calculationprediction Models for Underground Coal Mines. J. Mining Strata Control. Eng. 2 (4), 043523. doi:10.13532/j.jmsce.cn10-1638/td.20200716.001
Dcrshowitz, W. S., and Einstein, H. H. (1988). Characterizing Rock Ioint Geometry with Joint System Models. Rock Mech. Rock Eng. 21 (1), 21–51.
Dong, S., Zeng, L., Dowd, P., Xu, C., and Cao, H. (2018). A Fast Method for Fracture Intersection Detection in Discrete Fracture Networks. Comput. Geotechnics 98, 205–216. doi:10.1016/j.compgeo.2018.02.005
Dowd, P. A., Xu, C., Mardia, K. V., and Fowell, R. J. (2007). A Comparison of Methods for the Stochastic Simulation of Rock Fractures. Math. Geol. 39 (7), 697–714. doi:10.1007/s11004-007-9116-6
Du, Q. Z., and Yang, H. Z. (2004). Viscoelastic Wave Equations of Seismic Multi-Wave in Fractured media. Acta Physica Sinica 53 (8), 2802–2805. doi:10.7498/aps.53.2801
Fan, C. H., He, S., Zhang, Y., Qin, Q. R., and Zhong, C. (2018). Development Phases and Mechanisms of Tectonic Fractures in the Longmaxi Formation Shale of the Dingshan Area in Southeast Sichuan Basin, China. Acta Geologica Sinica 92 (6), 2351–2366. doi:10.1111/1755-6724.13732
Fan, C., Li, H., Qin, Q., He, S., and Zhong, C. (2020a). Geological Conditions and Exploration Potential of Shale Gas Reservoir in Wufeng and Longmaxi Formation of southeastern Sichuan Basin, China. J. Pet. Sci. Eng. 191, 107138. doi:10.1016/j.petrol.2020.107138
Fan, C., Li, H., Zhao, S., Qin, Q., Fan, Y., Wu, J., et al. (2020b). Formation Stages and Evolution Patterns of Structural Fractures in marine Shale: Case Study of the Lower Silurian Longmaxi Formation in the Changning Area of the Southern Sichuan Basin, China. Energy Fuels 34 (8), 9524–9539. doi:10.1021/acs.energyfuels.0c01748
Fan, K. (2020). Sudden Deformation Characteristic and Cutting Roof Support Technology for Double-Used Roadways in Longtan Mine. J. Mining Strata Control. Eng. 2 (3), 033032. doi:10.13532/j.jmsce.cn10-1638/td.20191227.001
Fu, X., and Wang, R. F. (2020). Cooperative Self-Adaptive Control Modelof Fluid Feeding System and Hydraulic Supports in Workingface. J. Mining Strata Control. Eng. 2 (3), 036031. doi:10.13532/j.jmsce.cn10-1638/td.20191203.001
Gao, F. Q. (2019). Use of Numerical Modeling for Analyzing Rockmechanic Problems in Underground Coal Mine Practices. J. Mining Strata Control. Eng. 1 (1), 013004. doi:10.13532/j.jmsce.cn10-1638/td.2019.02.009
Gao, F. Q. (2021). Influence of Hydraulic Fracturing of Strong Roof on Mining-Induced Stress Insight from Numerical Simulation. J. Min. Strata Cont. Eng. 3 (2), 023032–46. doi:10.13532/j.jmsce.cn10-1638/td.20210329.001
Han, L., Shen, J., Qu, J., and Ji, C. (2021). Characteristics of a Multi-Scale Fracture Network and its Contributions to Flow Properties in Anthracite. Energy Fuels 35 (14), 11319–11332. doi:10.1021/acs.energyfuels.1c01465
He, S., Li, H., Qin, Q., and Long, S. (2021). Influence of Mineral Compositions on Shale Pore Development of Longmaxi Formation in the Dingshan Area, Southeastern Sichuan Basin, China. Energy Fuels 35 (13), 10551–10561. doi:10.1021/acs.energyfuels.1c01026
Hong, D., Cao, J., Wu, T., Dang, S., Hu, W., and Yao, S. (2020). Authigenic clay Minerals and Calcite Dissolution Influence Reservoir Quality in Tight Sandstones: Insights from the central Junggar Basin, NW China. Energ. Geosci. 1 (1–2), 8–19. doi:10.1016/j.engeos.2020.03.001
Hu, Q. F., Cui, X. M., Liu, W. K., Ma, T. J., and Geng, H. R. (2020). Law of Overburden and Surface Movement and Deformation Dueto Mining Super Thick Coalseam. J. Mining Strata Control. Eng. 2 (2), 023021. doi:10.13532/j.jmsce.cn10-1638/td.20191113.001
Huang, F. R., Yan, S. X., Wang, X. L., Jiang, P. C., and Zhan, S. B. (2021). Experimental Study on Infrared Radiation Characteristics of Gneiss under Uniaxial Compression. J. Mining Strata Control. Eng. 3 (1), 013011. doi:10.13532/j.jmsce.cn10-1638/td.20200730.001
Jiang, T., Zhang, J., and Wu, H. (2017). Effects of Fractures on the Well Production in a Coalbed Methane Reservoir. Arab J. Geosci. 10 (22), 494. doi:10.1007/s12517-017-3283-7
Kang, H. P. (2021). Temporal Scale Analysis on Coal Mining Andstrata Control Technologies. J. Mining Strata Control. Eng. 3 (1), 013538. doi:10.13532/j.jmsce.cn10-1638/td.20200814.001
Laubach, S. E., Olson, J. E., and Gross, M. R. (2009). Mechanical and Fracture Stratigraphy. Bulletin 93, 1413–1426. doi:10.1306/07270909094
Li, H., Qin, Q., Zhang, B., Ge, X., Hu, X., Fan, C., et al. (2020). Tectonic Fracture Formation and Distribution in Ultradeep marine Carbonate Gas Reservoirs: A Case Study of the Maokou Formation in the Jiulongshan Gas Field, Sichuan Basin, Southwest China. Energy Fuels 34, 14132–14146. doi:10.1021/acs.energyfuels.0c03327
Li, H., Tang, H., Qin, Q., Zhou, J., Qin, Z., Fan, C., et al. (2019). Characteristics, Formation Periods and Genetic Mechanisms of Tectonic Fractures in the Tight Gas Sandstones Reservoir: A Case Study of Xujiahe Formation in YB Area, Sichuan Basin, China. J. Pet. Sci. Eng. 178, 723–735. doi:10.1016/j.petrol.2019.04.007
Li, S. L., Liu, G. J., Jia, R. F., Xue, F., and Wang, K. Y. (2021). Study on Friction Effect and Damage Evolution of End Face in Uniaxial Compression Test. J. Min. Strata Cont. Eng. 3 (3), 033014. doi:10.13532/j.jmsce.cn10-1638/td.20210325.001
Li, Y. (2021). Mechanics and Fracturing Techniques of Deep Shale from the Sichuan Basin, SW China. Energ. Geosci. 2 (1), 1–9. doi:10.1016/j.engeos.2020.06.002
Liu, B., Bai, L., Chi, Y., Jia, R., Fu, X., and Yang, L. (2019). Geochemical Characterization and Quantitative Evaluation of Shale Oil Reservoir by Two-Dimensional Nuclear Magnetic Resonance and Quantitative Grain Fluorescence on Extract: A Case Study from the Qingshankou Formation in Southern Songliao Basin, Northeast China. Mar. Pet. Geology. 109, 561–573. doi:10.1016/j.marpetgeo.2019.06.046
Liu, B., He, S., Meng, L., Fu, X., Gong, L., and Wang, H. (2021a). Sealing Mechanisms in Volcanic Faulted Reservoirs in Xujiaweizi Extension, Northern Songliao Basin, Northeastern China. Bulletin 105, 1721–1743. doi:10.1306/03122119048
Liu, B., Sun, J., Zhang, Y., He, J., Fu, X., Yang, L., et al. (2021b). Reservoir Space and Enrichment Model of Shale Oil in the First Member of Cretaceous Qingshankou Formation in the Changling Sag, Southern Songliao Basin, NE China. Pet. Exploration Dev. 48 (3), 608–624. doi:10.1016/S1876-3804(21)60049-6
Liu, B., Gao, Y., Liu, K., Liu, J., Ostadhassan, M., Wu, T., et al. (2021c). Pore Structure and Adsorption Hysteresis of the Middle Jurassic Xishanyao Shale Formation in the Southern Junggar Basin, Northwest China. Energy Exploration & Exploitation 39, 761–778. doi:10.1177/0144598720985136
Liu, B., Yan, M., Sun, X., Bai, Y., Bai, L., and Fu, X. (2020a). Microscopic and Fractal Characterization of Organic Matter within Lacustrine Shale Reservoirs in the First Member of Cretaceous Qingshankou Formation, Songliao Basin, Northeast China. J. Earth Sci. 31, 1241–1250. doi:10.1007/s12583-020-1345-3
Liu, B., Song, Y., Zhu, K., Su, P., Ye, X., and Zhao, W. (2020b). Mineralogy and Element Geochemistry of Salinized Lacustrine Organic-Rich Shale in the Middle Permian Santanghu Basin: Implications for Paleoenvironment, Provenance, Tectonic Setting and Shale Oil Potential. Mar. Pet. Geology. 120, 104569. doi:10.1016/j.marpetgeo.2020.104569
Liu, B., Wang, S., Ke, X., Fu, X., Liu, X., Bai, Y., et al. (2020c). Mechanical Characteristics and Factors Controlling Brittleness of Organic-Rich continental Shales. J. Pet. Sci. Eng. 194, 107464. doi:10.1016/j.petrol.2020.107464
Liu, B., Yang, Y., Li, J., Chi, Y., Li, J., and Fu, X. (2020d). Stress Sensitivity of Tight Reservoirs and its Effect on Oil Saturation: A Case Study of Lower Cretaceous Tight Clastic Reservoirs in the Hailar Basin, Northeast China. J. Pet. Sci. Eng. 184, 106484. doi:10.1016/j.petrol.2019.106484
Liu, J., Ding, W., Yang, H., Wang, R., Yin, S., Li, A., et al. (2017). 3D Geomechanical Modeling and Numerical Simulation of In-Situ Stress fields in Shale Reservoirs: A Case Study of the Lower Cambrian Niutitang Formation in the Cen'gong Block, South China. Tectonophysics 712-713, 663–683. doi:10.1016/j.tecto.2017.06.030
Mardia, K. V., Nyirongo, V. B., Walder, A. N., Xu, C., Dowd, P. A., Fowell, R. J., et al. (2007). Markov Chain Monte Carlo Implementation of Rock Fracture Modelling. Math. Geol. 39 (4), 355–381. doi:10.1007/s11004-007-9099-3
Mirzaei-Paiaman, A., and Ghanbarian, B. (2021). A New Methodology for Grouping and Averaging Capillary Pressure Curves for Reservoir Models. Energ. Geosci. 2 (1), 52–62. doi:10.1016/j.engeos.2020.09.001
Mizoguchi, K., and Ueta, K. (2013). Microfractures within the Fault Damage Zone Recordthe History of Fault Activity. Geophys. Res. Lett. 40 (8), 2023–2027. doi:10.1002/grl.50469
Murry, G. H. (1965). Quantitative Fracture Study- Sanish Pool, McKenzie County, North Dakota. Abstract AAPG Bull. 49 (9), 1570–1571.
Nakaya, S., and Nakamura, K. (2007). Percolation Conditions in Fractured Hard Rocks: A Numerical Approach Using Thethree Dimensional Binary Fractal Fracture Network (3D-BFFN) Model. J. Geophys. Res. 112 (B12), 1–15. doi:10.1029/2006jb004670
Olson, J. E., laubach, S. E., and lander, R. H. (2009). Natural Fracture Characterization in Tight Gas Sandstones: Integrating Mechanics and Diagenesis. Bulletin 93 (11), 1535–1549. doi:10.1306/08110909100
Ortega, O. J., Marrett, R. A., and Laubach, S. E. (2006). A Scale-independent Approach to Fracture Intensity and Average Spacing Measurement. Bulletin 90 (2), 193–208. doi:10.1306/08250505059
Peacock, D. C. P., Sanderson, D. J., and Rotevatn, A. (2018). Relationships between Fractures. J. Struct. Geology. 106, 41–53. doi:10.1016/j.jsg.2017.11.010
Qie, L., Shi, Y. N., and Liu, J. G. (2021). Experimental Study on Grouting Diffusion of Gangue Solid Filling Bulk Materials. J. Mining Strata Control. Eng. 3 (2), 023011. doi:10.13532/j.jmsce.cn10-1638/td.20201111.001
Robinson, N. I., Sharp, J. M., and Krciscl, I. (1998). Contaminant Transport in Sets of Parallel Finite Fractures with Fray Turc Skins. J. Contaminant Hydrol. 31 (1-2), 83–109. doi:10.1016/s0169-7722(97)00055-7
Sait, B., and Matthew, J. P. (2013). Fault and Fracture Distribution within a tight-Gas sandstone Reservoir: Mesaverde Group, Mamm Creekfield, Piceance Basin, Colorado, USA. Pet. Geosci. 19, 203–222. doi:10.1144/petgeo2011-093
Santosh, M., and Feng, Z. Q. (2020). New Horizons in Energy Geoscience. Energ. Geosci. 1 (1–2), A1. doi:10.1016/j.engeos.2020.05.005
Sebacher, B., Hanea, R., and Stordal, A. S. (2017). An Adaptive Pluri-Gaussian Simulation Model for Geological Uncertainty Quantification. J. Pet. Sci. Eng. 158, 494–508. doi:10.1016/j.petrol.2017.08.038
Sun, W., Li, Y. F., Fu, J. W., and Li, T. Y. (2014). Review of Fracture Identification with Well Logs and Seismic Data. Prog. Geophys. 29 (3), 1231–1242. doi:10.6038/pg20140332
Wang, D. L., Hao, B. Y., and Liang, X. M. (2021). Slurry Diffusion of Singlefracture Based on Fluid-Solid Coupling. J. Mining Strata Control. Eng. 3 (1), 013038. doi:10.13532/j.jmsce.cn10-1638/td.20200429.001
Xue, F., Liu, X. X., and Wang, T. Z. (2021). Research on Anchoring Effect of Jointed Rock Mass Based on 3D Printing and Digital Speckle Technology. J. Mining Strata Control. Eng. 3 (2), 023013. doi:10.13532/j.jmsce.cn10-1638/td.20201020.001
Xu, N., and Gao, C. (2020). Study on the Special Rules of Surface Subsidence Affected by Normal Faults. J. Min. Strata Cont. Eng. 2 (1), 011007. doi:10.13532/j.jmsce.cn10-1638/td.2020.01.011
Xu, C., and Dowd, P. (2010). A New Computer Code for Discrete Fracture Network Modelling. Comput. Geosciences 36 (3), 292–301. doi:10.1016/j.cageo.2009.05.012
Xu, C., Dowd, P. A., Mardia, K. V., and Fowell, R. J. (2006). A Flexible True Plurigaussian Code for Spatial Facies Simulations. Comput. Geosciences 32 (10), 1629–1645. doi:10.1016/j.cageo.2006.03.002
Yang, Li., Zhou, D-H., Wang, W-H., Jiang, T-X., and Xue, Z-J. (2020). Development of Unconventional Gas and Technologies Adopted in China. Energ. Geosci. 1 (1–2), 55–68. doi:10.1016/j.engeos.2020.04.004
Yang, J. X., Luo, M. K., Zhang, X. W., Huang, N., and Hou, S. J. (2021). Mechanical Properties and Fatigue Damage Evolution of Granite Under Cyclic Loading and Unloading Conditions. J. Min. Strata Cont. Eng. 3 (3), 033016. doi:10.13532/j.jmsce.cn10-1638/td.20210510.001
Yin, S., Dong, Li., Yang, X., and Wang, R. (2020). Experimental Investigation of the Petrophysical Properties, Minerals, Elements and Pore Structures in Tight Sandstones. J. Nat. Gas Sci. Eng. 76 (1), 1–14. doi:10.1016/j.jngse.2020.103189
Yin, S., and Gao, Z. (2019). Numerical Study on the Prediction of "sweet Spots" in a Low Efficiency-Tight Gas sandstone Reservoir Based on a 3D Strain Energy Model. IEEE Access 7 (6), 1–12. doi:10.1109/access.2019.2933450
Yin, S., Han, C., Wu, Z., and Li, Q. (2019). Developmental Characteristics, Influencing Factors and Prediction of Fractures for a Tight Gas sandstone in a Gentle Structural Area of the Ordos Basin, China. J. Nat. Gas Sci. Eng. 72 (12), 1–14. doi:10.1016/j.jngse.2019.103032
Yin, S., Lv, D., and Ding, W. (2018). New Method for Assessing Microfracture Stress Sensitivity in Tight sandstone Reservoirs Based on Acoustic Experiments. Int. J. Geomechanics 18 (4), 1–10. doi:10.1061/(asce)gm.1943-5622.0001100
Yin, S., and Wu, Z. (2020). Geomechanical Simulation of Low-Order Fracture of Tight sandstone. Mar. Pet. Geology. 100, 1–10. doi:10.1016/j.marpetgeo.2020.104359
Yoshida, M., and Santosh, M. (2020). Energetics of the Solid Earth: An Integrated Perspective. Energ. Geosci. 1 (1–2), 28–35. doi:10.1016/j.engeos.2020.04.001
Zhang, C., Song, W. D., Fu, J. X., Li, Y., and Zhang, K. C. (2020). Technology for Roadway Management of Fractured Rock Massesin a Submarine Gold Mine. J. Mining Strata Control. Eng. 2 (3), 033039. doi:10.13532/j.jmsce.cn10-1638/td.20200313.002
Zhang, T., Switzer, P., and Journel, A. (2006). Filter-based Classification of Training Image Patterns for Spatial Simulation. Math. Geol. 38 (1), 63–80. doi:10.1007/s11004-005-9004-x
Zhang, T., and Wang, Y. L. (2020). Study on Deformation Evolution Law and Support Technology of Surrounding Rock in Multiple Mining Roadway. J. Mining Strata Control. Eng. 2 (2), 023016. doi:10.13532/j.jmsce.cn10-1638/td.20200106.001
Zhao, J. L., Liu, J. J., Zhang, Q. H., and Qu, X. R. (2017). Overview of Geophysical Exploration Methods and Technical of Tight sandstone Gas Reservoirs. Prog. Geophys. 32 (2), 840–848. doi:10.6038/pg20170253
Zhao, Z., Wu, K., Fan, Y., Guo, J., Zeng, B., and Yue, W. (2020). An Optimization Model for Conductivity of Hydraulic Fracture Networks in the Longmaxi Shale, Sichuan basin, Southwest China. Energ. Geosci. 1 (1–2), 47–54. doi:10.1016/j.engeos.2020.05.001
Zhao, K. K., Jiang, P. F., Feng, Y. J., Sun, X. D., Cheng, L. X., and Zheng, J. W. (2021). Investigation of the Characteristics of Hydraulic Fracture Initiation by Using Maximum Tangential Stress Criterion. J. Min. Strata Cont. Eng. 3 (2), 023520–46. doi:10.13532/j.jmsce.cn10-1638/td.20201217.001
Keywords: ordos basin, Yanchang formation, fracture, FMI imaging logging, finite element, low-amplitude structure
Citation: Wang S, Li H, Lin L and Yin S (2022) Development Characteristics and Finite Element Simulation of Fractures in Tight Oil Sandstone Reservoirs of Yanchang Formation in Western Ordos Basin. Front. Earth Sci. 9:823855. doi: 10.3389/feart.2021.823855
Received: 28 November 2021; Accepted: 15 December 2021;
Published: 07 January 2022.
Edited by:
Wei Ju, China University of Mining and Technology, ChinaCopyright © 2022 Wang, Li, Lin and Yin. This is an open-access article distributed under the terms of the Creative Commons Attribution License (CC BY). The use, distribution or reproduction in other forums is permitted, provided the original author(s) and the copyright owner(s) are credited and that the original publication in this journal is cited, in accordance with accepted academic practice. No use, distribution or reproduction is permitted which does not comply with these terms.
*Correspondence: Hu Li, bGlodTg2MDYyOEAxMjYuY29t; Shuai Yin, c3BlZWR5c3lzQDE2My5jb20=
Disclaimer: All claims expressed in this article are solely those of the authors and do not necessarily represent those of their affiliated organizations, or those of the publisher, the editors and the reviewers. Any product that may be evaluated in this article or claim that may be made by its manufacturer is not guaranteed or endorsed by the publisher.
Research integrity at Frontiers
Learn more about the work of our research integrity team to safeguard the quality of each article we publish.