 Aqsa Anees1
 Hucai Zhang1
 Umar Ashraf1Ren Wang2,3Kai Liu2,3Hassan Nasir Mangi4Ren Jiang5
 Xiaonan Zhang1Qi Liu1Shucheng Tan6*Wanzhong Shi2,3*
- 1Institute for Ecological Research and Pollution Control of Plateau Lakes, School of Ecology and Environmental Science, Yunnan University, Kunming, China
- 2School of Earth Resources, China University of Geosciences, Wuhan, China
- 3Key Laboratory of Tectonics and Petroleum Resources, Ministry of Education, China University of Geosciences, Wuhan, China
- 4School of XingFa Mining Engineering, Wuhan Institute of Technology, Wuhan, China
- 5Research Institute of Petroleum Exploration and Development, Petro-China Company Limited, Beijing, China
- 6School of Resource Environment and Earth Science, Yunnan University, Kunming, China
The Hangjinqi area was explored for natural gas around 40 years ago, but the efficient consideration in this area was started around a decade ago for pure gas exploration. Many wells have been drilled, yet the Hangjinqi area remains an exploration area, and the potential zones are still unclear. The Lower Shihezi Formation is a proven reservoir in the northern Ordos Basin. This study focuses on the second and third members of the Lower Shihezi Formation to understand the controlling factors of faults and sedimentary facies distribution, aimed to identify the favorable zones of gas accumulation within the Hangjinqi area. The research is conducted on a regional level by incorporating the 3D seismic grid of about 2500 km2, 62 well logs, and several cores using seismic stratigraphy, geological modeling, seismic attribute analysis, and well logging for the delineation of gas accumulation zones. The integrated results of structural maps, thickness maps, sand-ratio maps, and root mean square map showed that the northwestern region was uplifted compared to the southern part. The natural gas accumulated in southern zones was migrated through Porjianghaizi fault toward the northern region. Well J45 from the north zone and J77 from the south zone were chosen to compare the favorable zones of pure gas accumulation, proving that J45 lies in the pure gas zone compared to J77. Based on the faults and sedimentary facies distribution research, we suggest that the favorable zones of gas accumulation lie toward the northern region within the Hangjinqi area.
Introduction
The Ordos Basin (OB), located in central China, is one of the most productive and petroliferous craton basins with the highest annual gas output in China (Yang et al., 2005; Xu et al., 2018; Wang et al., 2020). The gas exploration in the OB started in the 1980s. Since then, numerous Permian and Ordovician gas fields have been discovered in the central and north regions of the OB. These incorporate Sulige, Yulin, Changqing, Jinbian, and Daniudi gas fields (Duan et al., 2008; Yang et al., 2015a). Our study is focused on the Hangjinqi area, which is situated in the Yimeng Uplift and northern Yishan slope, covering an area of 9825 km2 within northern Ordos Basin (Wu et al., 2017) (Figure 1A). In recent times, exploratory wells within the Hangjinqi area found a considerable volume of gas in the sandstones of the Upper Paleozoic era (Xu et al., 2018). Hangjinqi area offers essential geologic conditions for making a large-scale gas reservoir, and thus is a potential area for becoming a vast gas exploration zone (Anees et al., 2019). The Lower Shihezi Formation (LSF) of the Middle Permian Period is considered the most significant reservoir of the OB (Sun et al., 2009). We are focusing on understanding the controls of faults and sedimentary facies distribution with the help of geological modeling, seismic stratigraphy, seismic attribute analysis, and petrophysical analysis on the second and third members of LSF in the Hangjinqi area.
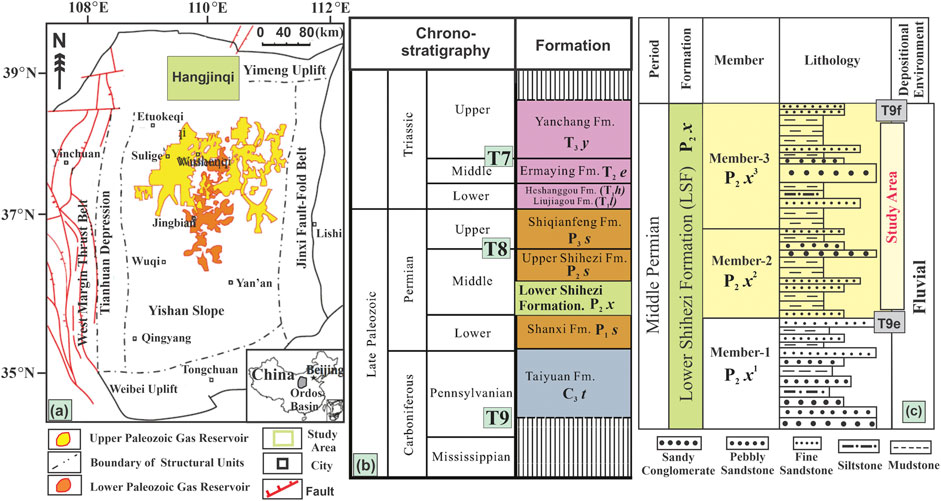
FIGURE 1. (A) Gas fields of Paleozoic area, structural units, and location of the study area (highlighted by the green rectangle) within the Ordos Basin (modified from Wu et al., 2017); (B) regional stratigraphic chart of Hangjinqi area (modified from Anees et al., 2019); (C) three members of the Lower Shihezi Formation. The yellow-colored rectangles of 2nd and 3rd members highlight the targeted area.
The geological modeling is an essential tool for decision making (Patel and McMechan, 2003) and for understanding the behavior of sedimentary reservoir facies (Ashraf et al., 2021; Shehata et al., 2021). Seismic attribute analysis is an essential and advanced tool for better-quality classification of sedimentary facies distribution and depositional environments (Ashraf et al., 2019; Vo Thanh et al., 2019; 2020; Vo Thanh and Sugai, 2021). Studies on faults distribution provide essential information related to tectonics, overpressure, burial history, and diagenesis (Zhou et al., 2016; Ashraf et al., 2020a; Jiang et al., 2021; Ullah et al., 2022). Recently, many studies have been conducted to study the controlling factors of reservoir quality distribution and sedimentary facies (Feng et al., 2019; Dar et al., 2021; Li et al., 2021; Radwan, 2021; Shu et al., 2021; Zhang et al., 2021). In many contemporary studies, petrophysical parameters were employed to estimate gas reservoirs accurately (Ehsan et al., 2018; Ehsan and Gu, 2020; Radwan et al., 2020; Ehsan et al., 2021; Radwan et al., 2021a; Radwan et al., 2021b; Radwan et al., 2022).
The published literature on the sedimentary facies and faults distribution of the second and third members of the LSF within the Hangjinqi exploration area is still scarce. In addition, the growth history of fault distribution of central fault systems in the OB is still poorly understood (Xu et al., 2018). The main issues in identifying and understanding the controlling factors of faults and sedimentary facies distribution are as follows: (1) seismic amplitude resolution is limited (Liu et al., 2007), (2) presence of coal layers present beneath LSF (Anees et al., 2019), (3) uplifting during Paleozoic Era causes various lateral variations which were further triggered during Yanshan structural movements (Sun et al., 2009). Numerous faults were established, which made the study area more complicated. Former studies conducted within the study area were focused on the structural evolution (Yang et al., 2015a; Yang et al., 2015b), tectonic controls (Liu et al., 2020), channel identification (Anees et al., 2019; Anees et al., 2022), evaluation of genetic types and source of Upper Paleozoic tight gas (Wu et al., 2017), hydrothermal mineralization of uranium deposits (Zhang et al., 2017), and evaluation of clay mineral content, and type of reservoir properties (Wang et al., 2020).
The current study aims to understand the controlling factors of faults and sedimentary facies distribution for the identification of favorable zones for gas accumulation of the second member (T9e) and third member (T9f) of the Middle Permian sediments of the Lower Shihezi Formation in the Hangjinqi area, northern Ordos Basin, China. We aimed to utilize the vast post-stacked 3D seismic and well log data along with cores to better understand facies distribution through seismic attributes, seismic stratigraphy, petrophysical analysis, and geological modeling. We also aimed to put forward new facts about the sedimentation of narrow Permian sections. This study will also demarcate the favorable gas zones and channel recognition through structure maps, thickness maps, sand-ratio maps, and depositional facies map. We anticipate that our research will offer more insights within the second and third members of the Middle Permian sediments of LSF within the Hangjinqi exploration area.
Geology of Study Area
Structural Characteristics
The Ordos Basin (OB) was established in the west margin of the North China Block (NCB) of the Paleozoic Era on the Archean-Proterozoic basement (Zhang et al., 2017). During the Late Cretaceous, the OB was uplifted, resulting in a plateau (Zhang et al., 2017). However, due to large-scale strike-slip events during the Cenozoic Era, the OB was separated from the NCB, and numerous graben structures were formed around the basin (Zhang et al., 1998; Liu et al., 2020). The basin consists of six tectonic regions and five secondary structural regions characterized by fluctuations in the structure at the top surface of the basement (Wu et al., 2017). The six tectonic units include Weibei uplift, Yimeng uplift, Western edge overthrust belt, Jinxi flexural belt, Yishan ramp, and Tianhuan depression (Hao et al., 2007; Liu et al., 2020). The study area of Hangjinqi is situated at the junction of the Yishan ramp and Yimeng uplift. The five structural units incorporate the Gongkahan uplift, the Hangjinqi fault, the Wulangeer uplift, the Yishan slope, and the Tianhuan depression. The Hangjinqi area is considered a promising region for hydrocarbon migration because of the paleohigh in northern OB. From the west to east region of the study area, three main faults are disseminated named as Wulanjilinmiao fault, Sanyanjing fault, and Porjianghaizi fault (PF) (also referred to as Boerjianghaizi fault in the literature) (Wu et al., 2017). These three faults have W-E to SW-NE dipping orientations (Liu et al., 2020). The PF is the main and the largest fault that separated the Hangjinqi area into north and south regions. The PF experienced various evolution stages, including formation stage, thrusting stage, and tearing stage during Caledonian Yanshanian, Indosinian Yanshanian, and Late Yanshanian (Li et al., 2015).
Stratigraphic Characteristics
The Upper Paleozoic rocks are comprised of Carboniferous Taiyuan Formation (C3t), Lower Permian Shanxi Formation (P1s), Middle Permian Lower Shihezi Formation (P2x), Middle Permian Upper Shihezi Formation (P2s), and Upper Permian Shiqianfeng Formation (P3s) (Ritts et al., 2004). The coal and mudstones of Taiyuan and Shanxi Formations are the primary source rocks (Wu et al., 2017). The Shanxi Formation (P1s) comprises of Lower Shanxi member (P1s1) and Upper Shanxi member (P1s2). The Lower Shihezi Formation (LSF) (P2x) consists of three members. These members are categorized as a first member (P2x1), second member (P2x2), and third member (P2x3) (Liu et al., 2020) (Figure 1B). The tight sandstones of LSF are acting as the main reservoir within the study area, incorporating sandy fluvial conglomerate and coarse-to-fine-grained sandstones (Zhang et al., 2009; Anees et al., 2019). These tight sandstones have low porosity (less than 12%) and low permeability (less than 1 mD) (Dai et al., 2012). However, these values of tight reservoir sands may differ due to lithological variations (Yang et al., 2005). The thick mudstones of Upper Shihezi and Shiqianfeng Formations are main seal rocks and consist of thick lacustrine layers of mudstone and sandstone intercalations (Wu et al., 2017).
Materials and Methods
Materials used in our study to understand the faults and facies distribution for identifying favorable gas zones of second and third members of LSF include cores, post-stacked seismic grid, and well log data. A total of 62 wells were utilized to evaluate the most favorable zones of gas accumulation of the Hangjinqi area. Several geophysical logs such as gamma-ray (GR), spontaneous potential (SP), deep resistivity (LLD), shallow resistivity (LLS), caliper (CAL), and sonic (DT) logs were incorporated (Ali et al., 2020; Ali et al., 2021). The regional seismic grid of about 2500 km2 is included to study the distribution characteristics and favorable gas accumulation zones. A total of 2280 inlines and 1880 crosslines are used. The intervals between the inlines and crosslines are 25 m. The cores samples from wells J45 and J77, including fine sandstone, coarse sandstone, and mudstone, were utilized in our study. The wells J45 and J77 were chosen based on their location nearby braided channels.
The methodology presented in our study incorporates the following steps: Initially, seismic and well data were employed to establish synthetic seismogram, and targeted horizons were marked. The two interpreted horizons are interpolated and utilized to study the faults distribution, topography, and thickness of tight reservoir sand with the help of geological modeling. Seismic attribute analysis interpreted braided channels’ lateral distribution and geometry. Seismic sections were utilized to study the behavior of sediment distribution and channel distribution. Finally, we establish the depositional facies distribution map of targeted T9e-T9f horizons to interpret the favorable zones of sand deposition by marking the favorable gas accumulation zones. Geophysical logging and their geological cores through wells J45 and J77 were used to evaluate gas and water volume. These wells were finally employed to identify the favorable zones of gas accumulation.
Geological Modeling
Geological models are an effective and advanced tool to image the subsurface facies. Geoscientists are continuously developing geological modeling techniques for better prediction and simulation of subsurface systems (Radwan, 2022). The geological model is the numerical equivalent of a 3D geological map that gives the targeted subsurface geobody. Structural maps, thickness maps, and sand-ratio maps of targeted T9e and T9f horizons are created to study the distribution characteristics of faults and sedimentary facies to demarcate the favorable zones.
Seismic Attribute Analysis
Sedimentary facies classification through seismic attribute analysis has been proficiently employed in geosciences for decades (Wang et al., 2017). Seismic attributes provide valuable, reliable information regarding bedding thickness, continuity, fractures, porosity, depositional environment, lithofacies, and sequence boundaries (Chopra and Marfurt, 2005; Abbas et al., 2019). Various horizon attributes were computed between targeted T9e and T9f horizons to identify the sedimentary facies such as fluvial channels. The Root Mean Square (RMS) attribute and Continuous Wavelet Transform (CWT) method of spectral decomposition provided the best results and were incorporated in our study.
Petrophysical Analysis
For a tight sand reservoir region of our study area, the fluid information within the reservoir can be ambiguous because the logging curve is disturbed by the borehole environment and formation (Jiang et al., 2017). The relationship between log data and test data is not accurate, and the corrected logging curve data depends on the test data for standard inspection (Xiang et al., 2021). Consequently, consistency amid log data and test data is based on the preliminary logging interpretation, gas logging, and production data. Integrating the test results with LLD, porosity, and other gas logging data of the targeted interval, the high consistency intervals are chosen for the standard sample with enhanced test quality. In the end, we executed the standard inspection to interpret the gas-water and pure gas layers within the targeted horizons of the LSF.
Depositional Facies Map and its Indication
Facies maps are drawn at an isochronous surface. The depositional facies map is an effective tool to interpret the distribution of sedimentary facies. The aim of incorporating the depositional facies map in our study was to calibrate the favorable sand distribution and accumulation zones. The depositional facies map of the targeted T9e-T9f horizons was made by integrating the resulted information of the RMS attribute map, structural maps, thickness distribution map, and sand-ratio maps of T9e and T9f.
Results
Seismic-To-Well Tie and Horizon Interpretation
We have interpreted the horizons based on the stratigraphic column model. Sedimentary deposits are represented as stratigraphic sequences, each constituted by a vertical succession of parallel layers. Seismic and well log data were jointly used to interpret and identify the different horizons with more clarity. Synthetic seismogram was calibrated via seismic-to-well tie (Ashraf et al., 2016; Anees et al., 2017), which is a process of acquiring the association amid seismic reflections and geological features. The attained synthetic traces were matched with the corresponding seismic traces to build the connection among time and depth (Ashraf et al., 2020b). Two reflectors were marked named as T9e (P2x2) and T9f (P2x3), which denote the second member and third member of the LSF (Figure 2). The interpolations of the interpreted horizons show that the area is tectonically unstable. The study area is separated into northern and southern parts by a central Porjianghaizi Fault (PF) (Figures 3A,B). The targeted horizons T9f (P2x3) and T9e (P2x2) are also shown on the uninterpreted and interpreted seismic sections near well J77 (Figures 4A,B).
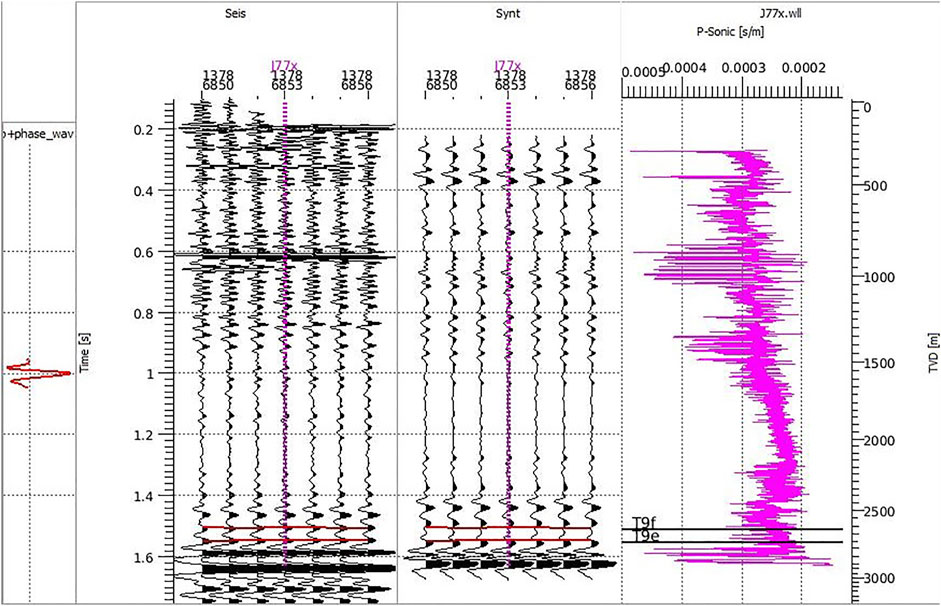
FIGURE 2. Synthetic seismogram shows the synthetic and seismic traces and the sonic log of well J77. The marked horizons T9e and T9f are the targeted horizons within the LSF.
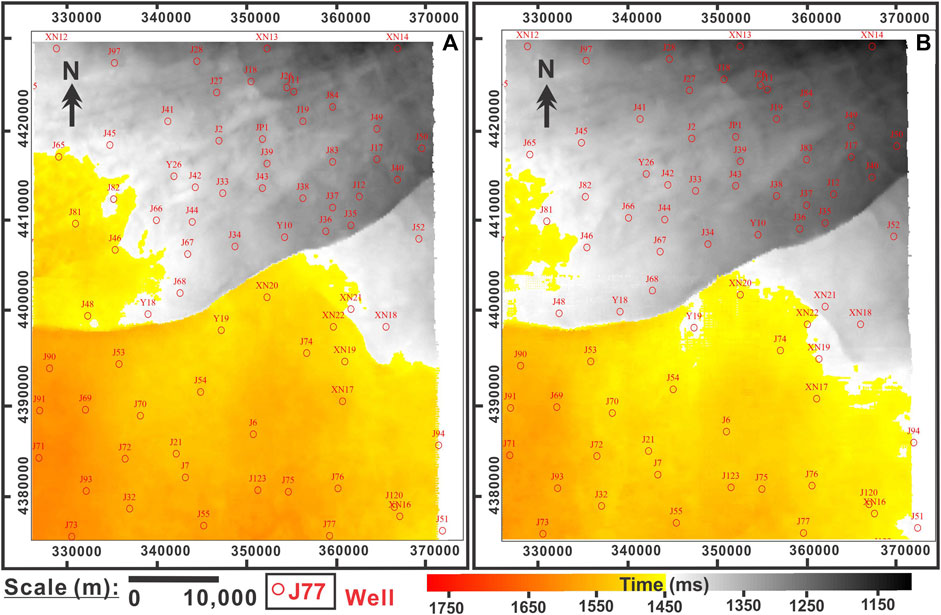
FIGURE 3. Horizon interpolation of (A) T9e and (B) T9f.
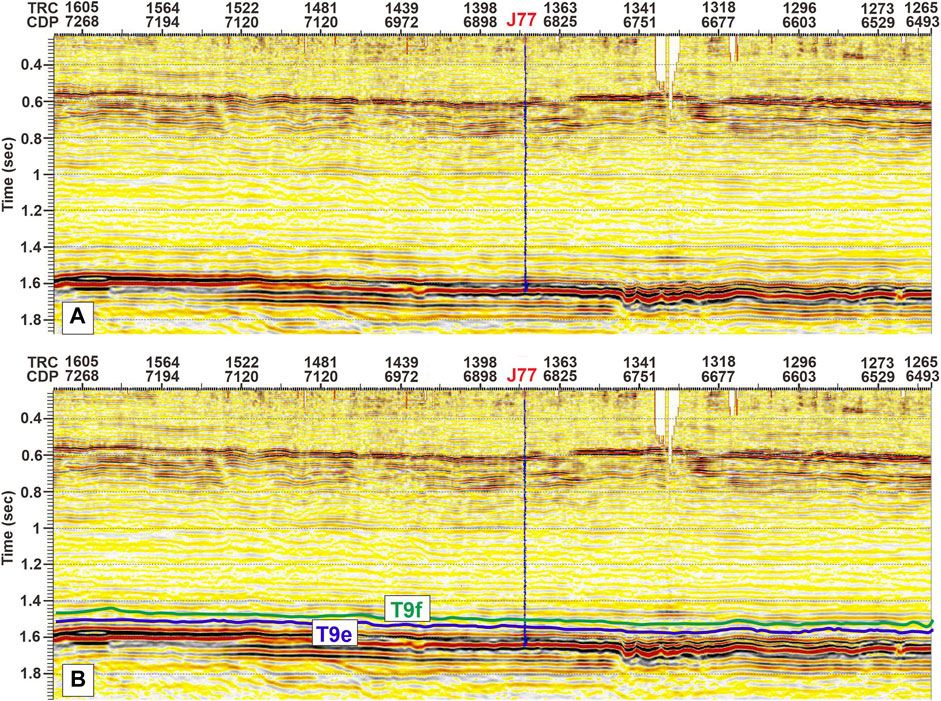
FIGURE 4. (A) uninterpreted and (B) interpreted seismic sections at well J77 with targeted interpreted horizons.
Distribution Characteristics of Fault in the Hangjinqi Area
The Hangjinqi Fault Zone (HFZ) consists of two different wide relay ramps (RRs) in the fault trace in the middle of the data coverage. The present-day fault trace is discontinuous for over 200 km (about 150 km within the Hangjinqi area) (Yang et al., 2013). Three main segments of HFZ, east (PF), central (WF), and west (SF), coincide with left steps in the fault geometry (Yang et al., 2013). HFZ consists of three main types of faults; there are also three levels and three periods of these faults. The three stages of faults prominently developed in the east Hangjinqi area are as follows: (1) late Haixi fault (weak extrusion) developed near well J75 and Shiguhao area, (2) early Yanshan late fault (strong extrusion) developed in the regions of Shiguhao and Azhen areas, and (3) late Yanshan early fault (weak extension and positive inversion) developed in the PF zone, the Lijiaqu fault zone, and the Shiguhao and Azhen areas (Yang et al., 2015b).
These three levels were characterized based on the extension of the faults developed toward the east of the Hangjinqi area. The tectonic activity in the study area is controlled and triggered by the main fault of PF, which is extending laterally within the northern OB. The faults distribution across horizons T9e and T9f show evidence of more tectonic activity at the north of the PF than the south region of the study area (Figures 5A,B). In addition to significant regional faults, there are also local minor faults. There are substantial differences in the development of structures on both sides of PF. There are many minor faults in the north of the PF, while the faults in the south are sparse, and minor faults are mainly locally developed, mainly in the Lower Carboniferous-Permian strata.
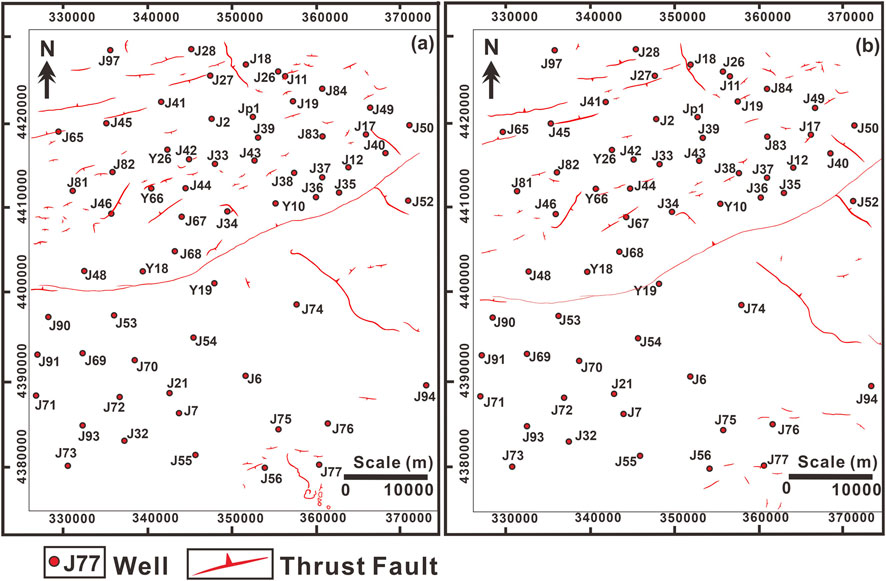
FIGURE 5. Interpretation of faults distribution and horizon slices of (A) T9e and (B) T9f.
Structural Mapping
A structure map shows the topography of the unit. The contours within the maps indicate the relief of the specific strata, usually beneath the surface. The structural styles such as syncline or anticline, faults and other geologic features in space are displayed. The structure map shows the topography of targeted T9e, and T9f sedimentary layers lie toward the east of the Hangjinqi area.
The structural maps of Middle Permian layers of T9e and T9f show a deepening trend toward the southern region, having depths of about 3000 m. The structural topography is divided into uplifted northern and deepened southern regions through the PF. The northeastern region shows stratigraphic thinning with depths of about 1800–1900 m. The regions of the north of the structural maps show more deformation due to frequent low-to-medium rank faults that offset the sedimentary layers within the northern area. However, there are fewer faults in the southern region. The northeastern regions of T9e and T9f are uplifted compared to other maps’ areas (Figures 6A,B). The overall results indicate that the preliminary shortening deformation and uplifting took place during this period.
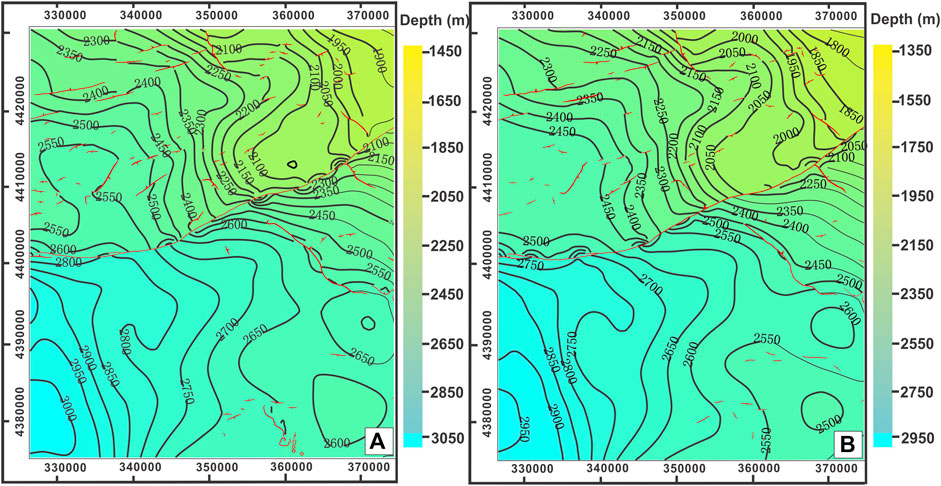
FIGURE 6. Structural maps showing the faults distribution and contour values and horizon slices of (A) T9e and (B) T9f.
Thickness Mapping
Thickness mapping is an essential tool in geosciences to identify the thickness variations and thickness trends of different layers. T9e was marked at the bottom of the second member of LSF and T9f at the top of the third member of the Lower Shihezi Formation, so a thickness map between T9e-T9f (Lower Shihezi 2 + 3) was generated. The resulting thickness map shows significant thickness variations across the Hangjinqi area, large in the northern area compared to the southern region. The thickness is lesser in the northwestern (NW) area than in the south region, which indicates erosion in the NW region due to uplifting. The uplifting at the NW region suggests the origin of the braided channels. These results indicate a gentle slope from the north toward the south (Figure 7). Corollary, the results show that the braided channels originate from NW and flow toward the southern region.
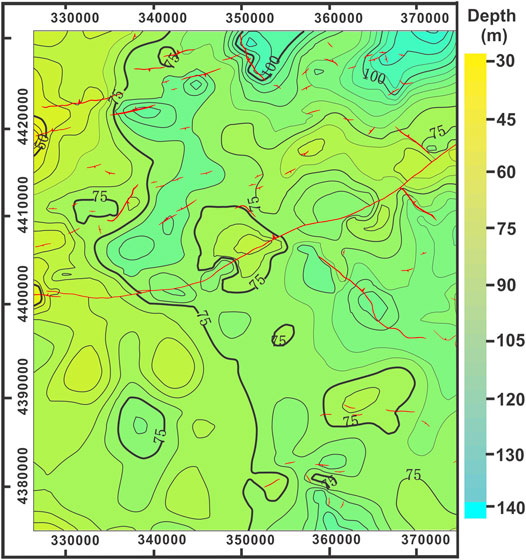
FIGURE 7. Thickness map showing the faults distribution and contour values along with targeted horizon slices of T9e-T9f.
Sand-Ratio Mapping
The sand-ratio provides the distribution of the sand to mud ratio. Sand-ratio distribution maps of the second member (T9e) and third member (T9f) were plotted with the help of structure and thickness maps to study the favorable zones of tight sand accumulation. The light blue color shows that more sand is deposited in these regions and the regions with yellow color indicate that more mud is deposited in these areas. The results of sand-ratio maps of targeted members show that maximum sand was deposited toward the northwestern region, which flows toward the south direction (Figure 8). These maximum values of sand-ratio indicate braided channels. In addition, the extreme eastern region also shows maximum sand-ratio values, indicating the favorable zone for braided channel deposition (Figures 8 and 9). The result of the sand-ratio map of T9e and T9f almost shows similar results, and their response agrees with each other. The corollary, the maximum sand-ratio values indicate that the braided channel originates from the north and flows toward the southern direction.
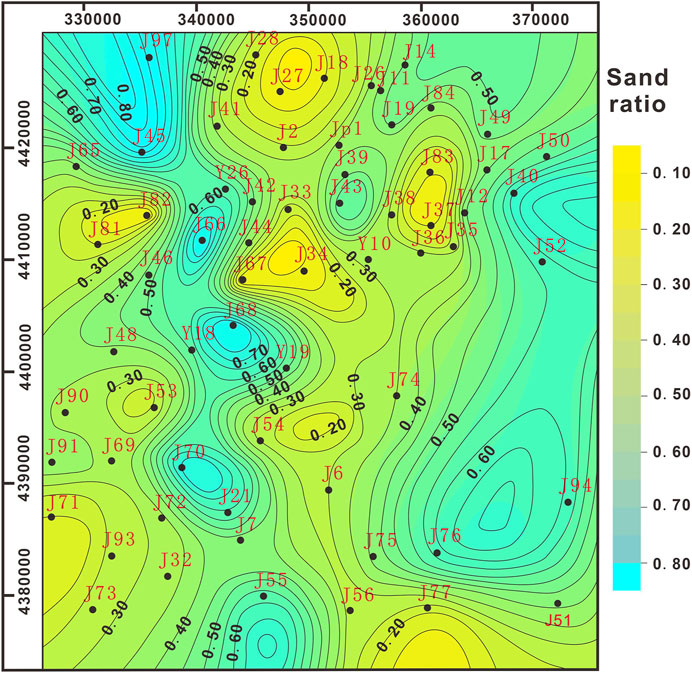
FIGURE 8. Sand-ratio distribution map of the second member (T9e) of the Lower Shihezi Formation.
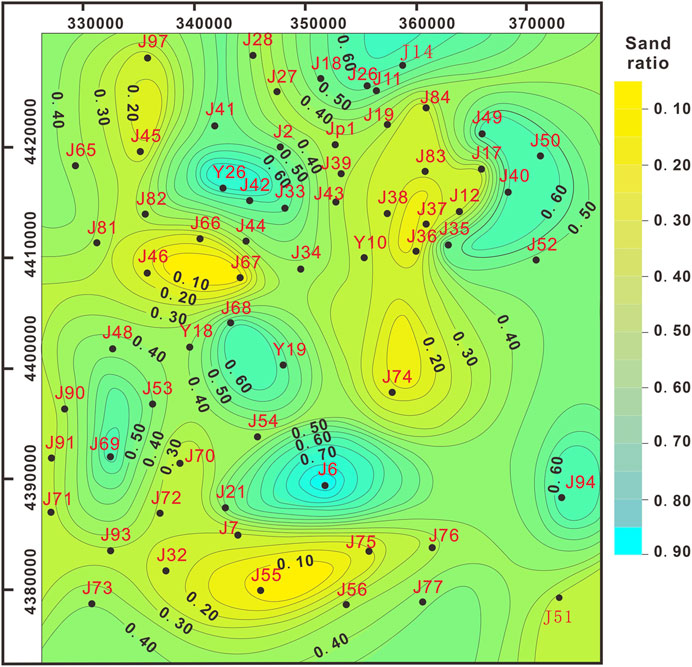
FIGURE 9. Sand-ratio distribution map of the third member (T9f) of the Lower Shihezi Formation.
Sediment Distribution via Seismic Stratigraphy
The OB is saturated with numerous sedimentary layers, ranging from Paleozoic to Cenozoic Era. Six major unconformities (T3, T4, T5, T7, T8, and T9) were marked on the seismic data to show the behavior of sediment distribution characteristics (Figures 10A,B). The Cambrian and Devonian rocks are missing within the Hangjinqi area. In addition, Lower Jurassic, Upper Jurrasic, Upper Cretaceous, Paleogene, and Neogene strata are also missing (Figure 1B). These sediments of different ages are missing because of regional uplifting and hiatus in the study area (Yang et al., 2015b).
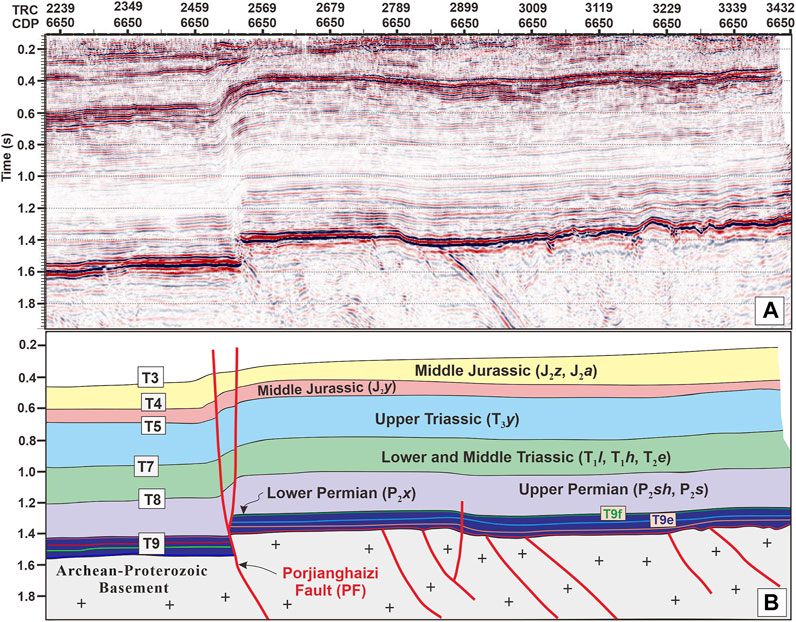
FIGURE 10. (A) Uninterpreted and (B) interpreted seismic profiles through the east segment of PF of the HFZ, which is slightly affected by inversion.
The strata between T4 and T3 consists of Middle Jurassic Zhiluo (J2z) and An’ding (J2a) Formations. The J2z is composed of sandstone, while J2a is composed of mudstone facies. The sediments amid T5 and T4 are also composed of Middle Jurassic Yan’an (J2y) Formation consisting of sand and gravel facies. The Middle Jurassic sediments were deposited in the fluvial and lacustrine environments (Yang et al., 2015b). The rocks among T7 and T5 are comprised of Upper Triassic Yachang (T3y) Formation that varies between sandstone and mudstone facies. The sediments between T8 and T7 are composed of Lower-to-Middle Triassic Liujiagou (T1l), Heshangou (T1h), and Ermaying (T2e) Formations. The lithologies of T1l and T1h sediments vary from muddy siltstone interbedded with sandstone facies, whereas T2e consists of mudstone facies. The Permian to Triassic sediments show an fluvial, deltaic, and lacustrine depositional environment (Yang et al., 2013). The sediments between T9 and T8 are composed of Upper Permian (Shiqianfeng (P3s) Formation) and Upper Shihezi (P2s) Formation of Middle Permian age. P3s are composed of thick beds of mudstone interbedded with fine-sand facies, whereas P2s are composed of thick lacustrine beds of mudstone with thin intercalations of sandstone facies (Wu et al., 2017). The sediments above T9 consist of Pennsylvanian Taiyuan (C3t) Formation, Lower Permian Shanxi (P1s) Formation, and Middle Permian Lower Shihezi (P2x) Formation (LSF). Several coal beds are interbedded with mud and sand facies within the C3t and P1s. The LSF consists of three members (P2x1, P2x2, P2x3), whereas the area of interest of our study is the second member and third member marked as T9e (P2x2) and T9f (P2x3) within the LSF (Figure 4B). The sediments below T9 are composed of crystalline rocks of Archean-Proterozoic ages.
Distribution Characteristics of Channels Through Seismic Attribute Analysis
Seismic attribute analysis was performed to identify the braided channels between the targeted T9e-T9f horizons. Several amplitude and instantaneous attributes were applied to get the optimized results. The Root Mean Square (RMS) horizon attribute and Continuous Wavelet Transform (CWT) method of spectral decomposition provided the best results, and hence are included in the results. The horizon RMS attribute map confirms the presence of numerous braided channels within the study area. The sinuous zones having relatively high RMS values showing narrow parallel lines were interpreted as channels (highlighted by red arrows in Figure 11A). The RMS values are higher above the major PF (highlighted by the green arrow) than the lower region. The lower region of the RMS map shows low RMS values. The NW region shows the highest RMS values, which suggest the origin of the braided channels. The CWT method of spectral decomposition on targeted horizons of T9e-T9f was transformed from the time domain to the frequency domain. Several frequency slices of 15, 25, 35, 45, and 55 Hz were extracted. The 45 Hz slice shows the best results because thin features such as channels can be better recognized with high frequency (Li et al., 2017). Hence, a 45-Hz slice was included in our results. The dark-colored narrow sinuous features running parallel on the map were interpreted as channels which were marked by red arrows on the map (Figure 11B).
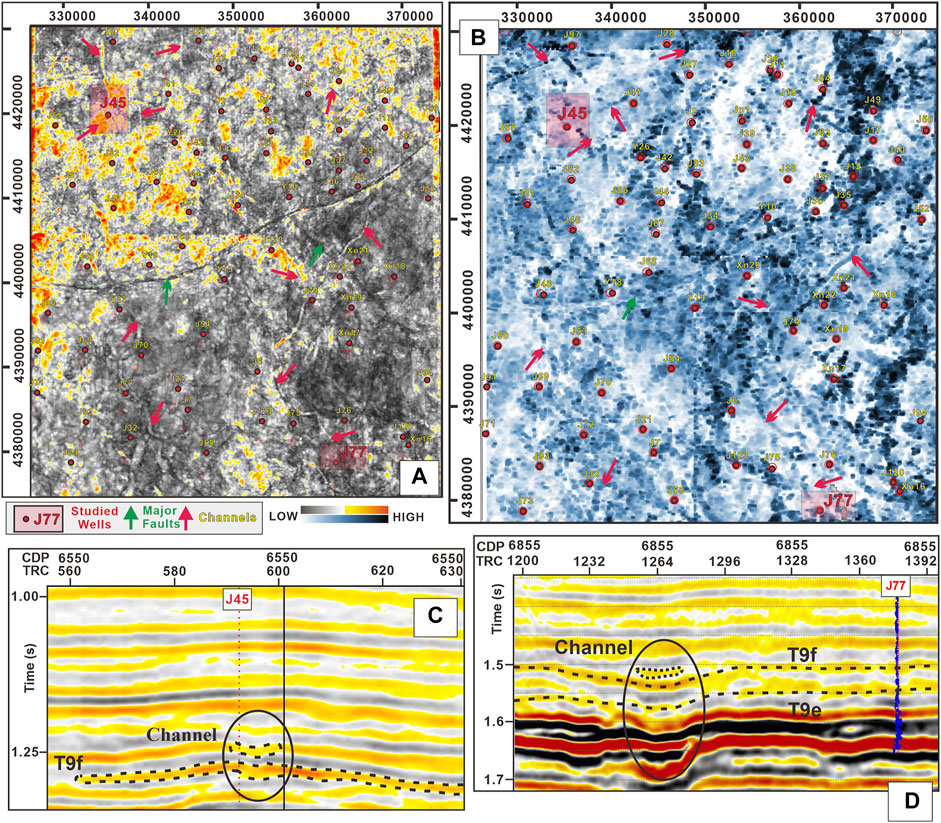
FIGURE 11. (A) RMS horizon attribute map and (B) 45 Hz iso-frequency spectral decomposition map, along T9e-T9f horizons showing the faults and narrow parallel lines. Convex bottom shaped undercutting features of channels on seismic sections at well locations (C) J45 and (D) J77.
We have also interpreted the channels on the corresponding seismic sections at various locations for a reliable interpretation. We have chosen two locations, each from northern (J45) and southern (J77) region separated by PF (highlighted by light red squares). These wells were chosen because of their optimal location nearby the channels on the RMS attribute map. The corresponding location of J45 on the seismic section also confirms the convex bottom, which suggests undercutting close to the targeted T9e-T9f horizons (Figure 11C). In addition, the corresponding location of J77 also shows convex bottom seismic features of the channels (Figure 11D). The associated vertical sections of J45 and J77 confirm the presence of channels which show the reliability of the study.
Comparison of Favorable Zones via Formation Evaluation
There is one perforation interval within the well J45 (Figure 12). The depth of the perforated layer ranges from 2483.5 to 2487.5 m. The total thickness of the perforated interval is 4 m. The average porosity value of the interval is 14.87%. The average permeability value of the interval is 2.14 mD. The perforated layer is less affected by mud intrusion and diameter expansion. The log curves of the reservoir section show medium resistivity, low GR, low SP, medium density, relatively low AC, and high porosity-permeability values. The test gas production volume is 4375 m3/day, and the water volume is 0 m3/day. The gas logging curve of total hydrocarbon value (TG) is maximum close to reservoir depth. These log interpretation results suggest that the reservoir is a pure gas layer. Henceforth, the reservoir within J45 of the Lower Shihezi Formation belongs to a good gas reservoir.
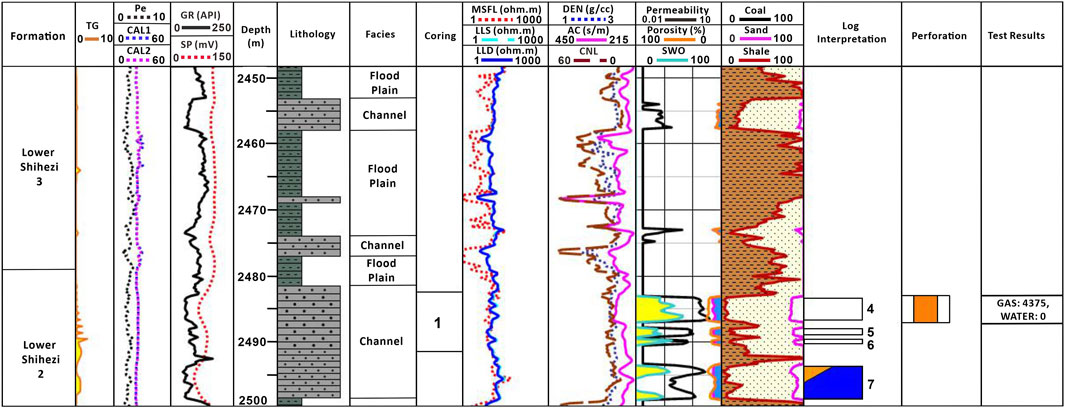
FIGURE 12. Well log interpretation of the well J45.
There are three perforation intervals (marked as 1, 2, and 3) within the well J77 (Figure 13). The depths of the perforated layers range from 2609 to 2611.5 m for interval-1, 2614–2616 m for interval-2, and 2619–2621 m for interval-3. The thicknesses of these three perforated intervals are 2.5 m, 2 m, and 2 m. The average porosity values of these intervals are 10.05%, 11.1%, and 9.71%. The average permeability values of the three intervals are 1.40 mD, 1.43 mD, and 1.21 mD. The perforated layers are less affected by mud intrusion and diameter expansion. The log curves of the reservoir section show high resistivity, low GR, low density, relatively high AC, and low porosity-permeability values. The test gas production volume is 3547 m3/day, and the water volume is 2.74 m3/day. The gas logging curve of the total hydrocarbon value is close to 10 at the reservoir level. These log interpretation results suggest that the reservoir is not a pure gas layer but a gas-water layer. Henceforth, the well J77 within the LSF belongs to a tight sandstone reservoir.
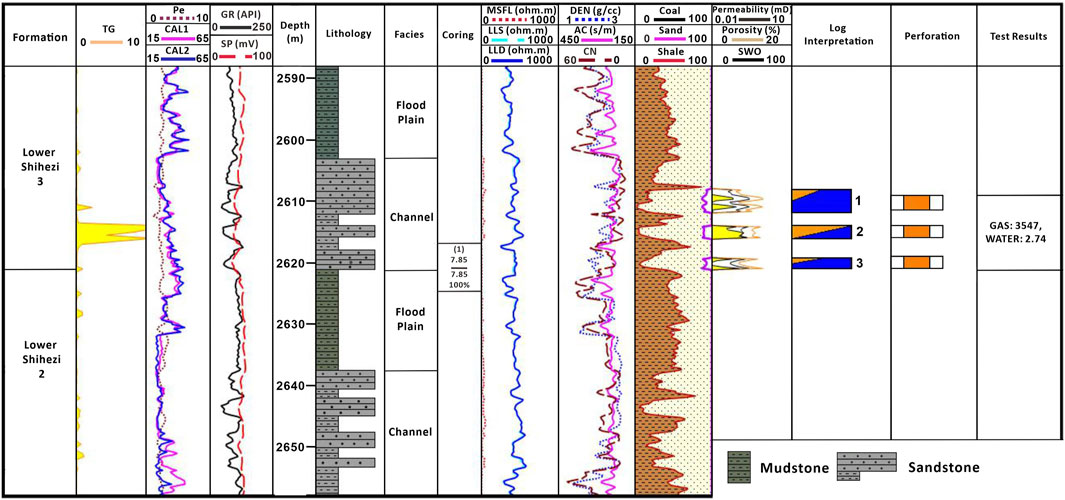
FIGURE 13. Well log interpretation of the well J77.
The results of the geological cores of wells J45 and J77 from the second and third members of the LSF are also incorporated to evaluate the distribution of sedimentary facies. The primary lithologies in the study area are sandstone and mudstone (Figures 14A–H). The cores of J77 at depths 2618.89–2619.08 m shows the presence of light gray gravel-bearing coarse sandstone (i.e., quartz gravel and lithic gravel) (Figures 14A,B). The gravel content is increasing from top to bottom. The facies consists of light gray gravelly coarse sandstone and gray mudstone at a depth of 2619.37–2619.53 m (Figures 14C,D).
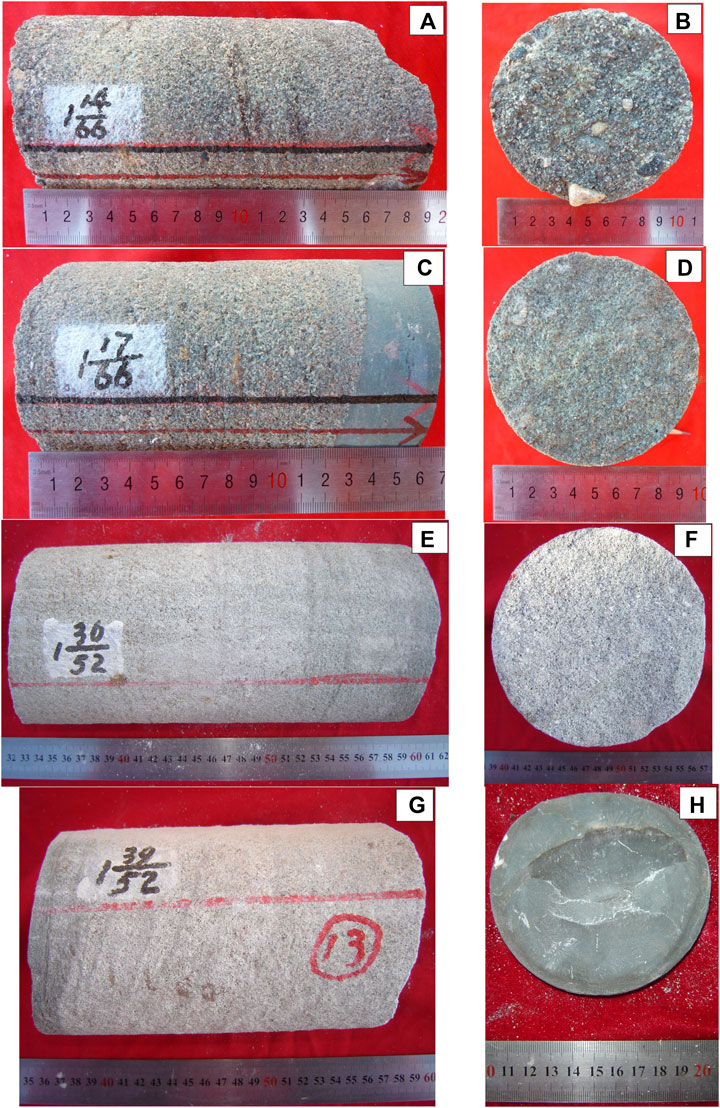
FIGURE 14. Cores of wells J77 and J45 from second and third members of the LSF. Well J77: (A,B) Light gray gravel-bearing coarse sandstone (quartz gravel and lithic gravel) at depths 2618.89–2619.08 m. (C,D) Light gray gravelly sandstone and gray mudstone at depths 2619.37–2619.53 m. Well J45: (E) Light gray medium sandstone and fine sandstone at depths 2488.35–2488.56 m. (F) Light gray gravelly medium sandstone at depths 2483.18–2483.36 m. (G) Gray mudstone and light gray gravelly medium sandstone at depths 2488.76–2488.92 m. (H) Gray mudstone at depth 2486.97–2487.09 m.
The cores of well J45 at depths 2488.35–2488.56 m show that the structural features of the upper light gray medium sandstone are in gradual contact with the middle and lower light gray fine sandstone (Figure 14E). The cores at depth 2483.18–2483.36 m show the presence of light gray gravelly medium sandstone (Figure 14F). The cores at depths 2488.76–2488.92 m show that the gray mudstone is 2 cm away from the top, while light gray gravelly medium sandstone is at the lower part (Figure 14G), while depths 2486.97–2487.09 m show the presence of gray mudstone (Figure 14H).
The sand has moderately sorted sub-angular grains with compact cementation. It shows horizontal-bedding to trough cross-bedding of normal grading sequences, which shows the characteristics of braided channels (Lin et al., 2017). The gradual contact between sandstone and mudstone facies indicates changes in facies from the fluvial channel to the floodplain. The presence of different colors in mudstone facies shows different depositional environments (Jiang et al., 2011). The brown color suggests that the mudstone was deposited in the oxidizing depositional environment, while gray color in mudstone indicates a reducing environment.
Discussion
Distribution Characteristics of Sedimentary Facies of Lower Shihezi Formation
The northern region of OB was uplifted for an extended time due to the presence of the Yinshan fold belt, which affected the sedimentary units of the Late Carboniferous Taiyuan-Permian Shihezi Period (Yang et al., 2015a). Due to strong tectonic activity, many regional faults were developed that controlled the depositional pattern of the Taiyuan Formation Period. During early Permian times, the delta-plain depositional environment was developed from the northern to the southern region. The sedimentary filling configuration got thinner in the north area and thicker in the south. The pattern goes on, and the Lower Shihezi-Upper Shihezi Formation revealed an overall filling-up effect on the uplifted depressions due to solid tectonic activities.
During the Late-Carboniferous-Early Permian Period of the Taiyuan and Lower Shihezi Formation, the depositional environment of the basin completely changed to continental facies from marine facies. During the early stage of the LSF, the tectonic activity was intense toward the northern part of OB. Due to this, the supply of the provenances was adequate, rivers were developed, and the grain size of the sandstones was mainly coarser, i.e., gravel-bearing sandstone. During the late stage of the LSF, the tectonic activity was less intense; sedimentary slope decreased, river construction was weakened which gave rise to the distribution of medium- to fine-grained sediments. Henceforth, the depositional pattern of the LSF consisted of braided river deposits.
The structural maps showed that the paleogeomorphology at the NW direction was uplifted, and a gentle slope was formed toward the SE direction (Figures 6A,B). The distribution of the sedimentary facies is mainly governed by paleogeomorphology. The integrated results of structural, thickness, and sand-ratio mapping show that the sedimentary facies of LSF were distributed in braided river deposits. The main sedimentary subfacies were channels and floodplains. The sand bodies were deposited in the river channels and the sub-aqueous braided channels. At the same time, the mudstone facies were deposited in the floodplains. The braided channels originate from the NW direction and flow in the SE direction (Figure 15).
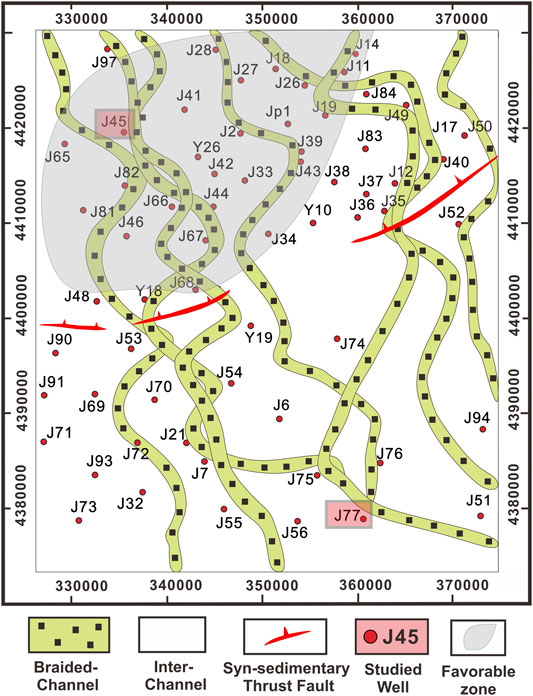
FIGURE 15. The proposed depositional facies map of T9e-T9f shows the presence of braided channels. The highlighted wells in the pink rectangle were used for comparing the favorable gas accumulation zones. The highlighted gray region shows a favorable gas zone.
Identification of Favorable Zones Within Hangjinqi Exploration Area
The current study is focused on identifying the favorable zones of gas accumulation that can be targeted for future studies. The sand-ratio, RMS attribute, and thickness maps indicated the presence of uplifted paleohigh regions toward the northern section of the Hangjinqi area. Due to this uplifting, the accumulated gas in the southern region was affected and migrated laterally toward the north of the region due to the presence of open areas in the PF (Liu et al., 2020). In our study, we have chosen two wells (J77 from the southern area and J45 from the northern region) to identify the favorable zones in the exploration area. We studied the formation evaluation of these two wells to compare the test results for promising zones (Figures 12 and 13). The test results of J77 showed that the reservoir region is composed of a mixed gas-water layer, whereas the test results of well J45 revealed that the reservoir zone is composed of pure gas. Hence, we proposed that the northern region of the PF is more favorable for gas exploration (Figure 15).
Conclusion
The research has been conducted on the Middle Permian sediments of the second and third members of the Lower Shihezi Formation interpreted as T9e (P2x2) and T9f (P2x3) within the Hangjinqi area, northern Ordos Basin, China. The fault distribution characteristics of T9e-T9f showed that the significant Porjianghaizi Fault mainly controls the study area, and many minor faults developed in the lower Carboniferous-Permian strata. The structural maps revealed a deepening trend of about 3000 m in the southern region while thinning trend of about 1900 m in the northern region. The thickness map also suggested that the thickness is lesser in the north of the region compared to southern areas, which revealed that the NW region is more uplifted. These results were supported by sand-ratio mapping and RMS attribute map, which also revealed the presence of maximum sand deposition toward the NW region. Cores of wells J77 and J45 show the trough crossbedding of gravel-bearing coarse sandstone and mudstone, which indicated the presence of braided channels confirmed by the RMS attribute map and spectral decomposition of a 45-Hz slice. The locations of J45 and J77 wells also confirmed the presence of a convex bottom and undercutting on the seismic sections close to the targeted T9e-T9f horizons. The integrated results of drilling cores, attribute analysis, petrophysical analysis, and geological modeling confirmed the presence of braided channels in the Lower Shihezi Formation. The test results of wells J45 (NW region) and J77 (southern region) showed that the NW region is more favorable for pure gas exploration than the south region. Corollary, we proposed that more attention should be given to the NW region for pure gas exploration.
Data Availability Statement
The original contributions presented in the study are included in the article/Supplementary Material. Further inquiries can be directed to the corresponding authors.
Author Contributions
AA, WS, and UA conceived this study. WS supervised this project. RW and KL undertook the responsibility of arranging the data for this project. AA and UA wrote the manuscript. HM and RJ helped in formal analysis and software. XZ and QL discussed the data. ST and HZ reviewed the manuscript and provided the necessary fundings. All authors contributed to the article and approved the submitted version.
Funding
This research was supported by the National Natural Science Foundation of China (Grant Nos. 4162134 and 41820104008), China University of Geosciences (Wuhan) (CUGCJ1712), and the Open Fund of the Key Laboratory of Tectonics and Petroleum Resources (China University of Geosciences in Wuhan) (TPR-2018-18), the National Key R&D program of China (2017YFE0106300), the 13th Five year Plan of the Ministry of Science and Technology of China (2016ZX05034-002003), and Yunnan Provincial Government Leading Scientist Program, No. 2015HA024.
Conflict of Interest
Author RJ is employed by China National Petroleum Company.
The remaining authors declare that the research was conducted in the absence of any commercial or financial relationships that could be construed as a potential conflict of interest.
Publisher’s Note
All claims expressed in this article are solely those of the authors and do not necessarily represent those of their affiliated organizations, or those of the publisher, the editors, and the reviewers. Any product that may be evaluated in this article, or claim that may be made by its manufacturer, is not guaranteed or endorsed by the publisher.
Acknowledgments
I am grateful to my former supervisor WS for providing the necessary data, guidance, support, and technical help to accomplish this research. I am also thankful for my labmates at the China University of Geosciences. I also acknowledge the China University of Geosciences, Wuhan and Yunnan University for funding this project.
References
Abbas, A., Zhu, H., Anees, A., Ashraf, U., and Akhtar, N. (2019). Integrated Seismic Interpretation, 2d Modeling along with Petrophysical and Seismic Atribute Analysis to Decipher the Hydrocarbon Potential of Missakeswal Area. Pakistan. J. Geol. Geophys. 7 (2), 1–12. doi:10.4172/2381-8719.1000455
Ali, M., Jiang, R., Ma, H., Pan, H., Abbas, K., Ashraf, U., et al. (2021). Machine Learning - A Novel Approach of Well Logs Similarity Based on Synchronization Measures to Predict Shear Sonic Logs. J. Pet. Sci. Eng. 203, 108602. doi:10.1016/j.petrol.2021.108602
Ali, M., Ma, H., Pan, H., Ashraf, U., and Jiang, R. (2020). Building a Rock Physics Model for the Formation Evaluation of the Lower Goru Sand Reservoir of the Southern Indus Basin in Pakistan. J. Pet. Sci. Eng. 194, 107461. doi:10.1016/j.petrol.2020.107461
Anees, A., Shi, W., Ashraf, U., and Xu, Q. (2019). Channel Identification Using 3D Seismic Attributes and Well Logging in Lower Shihezi Formation of Hangjinqi Area, Northern Ordos Basin, China. J. Appl. Geophys. 163, 139–150. doi:10.1016/j.jappgeo.2019.02.015
Anees, A., Zhang, H., Ashraf, U., Wang, R., Liu, K., Abbas, A., et al. (2022). Sedimentary Facies Controls for Reservoir Quality Prediction of Lower Shihezi Member-1 of the Hangjinqi Area, Ordos Basin. Minerals 12, 126. doi:10.3390/min12020126
Anees, A., Zhong, S. W., Ashraf, U., and Abbas, A. (2017). Development of a Computer Program for Zoeppritz Energy Partition Equations and Their Various Approximations to Affirm Presence of Hydrocarbon in Missakeswal Area. Geosciences 7 (2), 55–67. doi:10.5923/j.geo.20170702.02
Ashraf, U., Zhang, H., Anees, A., Ali, M., Zhang, X., Shakeel Abbasi, S., et al. (2020b). Controls on Reservoir Heterogeneity of a Shallow-marine Reservoir in Sawan Gas Field, SE Pakistan: Implications for Reservoir Quality Prediction Using Acoustic Impedance Inversion. Water 12 (11), 2972. doi:10.3390/w12112972
Ashraf, U., Zhang, H., Anees, A., Mangi, H. N., Ali, M., Zhang, X., et al. (2021). A Core Logging, Machine Learning and Geostatistical Modeling Interactive Approach for Subsurface Imaging of Lenticular Geobodies in a Clastic Depositional System, SE Pakistan. Nat. Resour. Res. 30 (3), 2807–2830. doi:10.1007/s11053-021-09849-x
Ashraf, U., Zhang, H., Anees, A., Nasir Mangi, H., Ali, M., Ullah, Z., et al. (2020a). Application of Unconventional Seismic Attributes and Unsupervised Machine Learning for the Identification of Fault and Fracture Network. Appl. Sci. 10 (11), 3864. doi:10.3390/app10113864
Ashraf, U., Zhu, P., Anees, A., Abbas, A., and Talib, A. (2016). Analysis of Balkassar Area Using Velocity Modeling and Interpolation to Affirm Seismic Interpretation, Upper Indus basin. Geosciences 6 (3), 78–91. doi:10.5923/j.geo.20160603.02
Ashraf, U., Zhu, P., Yasin, Q., Anees, A., Imraz, M., Mangi, H. N., et al. (2019). Classification of Reservoir Facies Using Well Log and 3D Seismic Attributes for prospect Evaluation and Field Development: A Case Study of Sawan Gas Field, Pakistan. J. Pet. Sci. Eng. 175, 338–351. doi:10.1016/j.petrol.2018.12.060
Chopra, S., and Marfurt, K. J. (2005). Seismic Attributes - A Historical Perspective. Geophysics 70 (5), 3SO–28SO. doi:10.1190/1.2098670
Dai, J., Ni, Y., and Wu, X. (2012). Tight Gas in China and its Significance in Exploration and Exploitation. Pet. Exploration Develop. 39, 277–284. doi:10.1016/s1876-3804(12)60043-3
Dar, Q. U., Pu, R., Baiyegunhi, C., Shabeer, G., Ali, R. I., Ashraf, U., et al. (2021). The Impact of Diagenesis on the Reservoir Quality of the Early Cretaceous Lower Goru Sandstones in the Lower Indus Basin, Pakistan. J. Pet. Explor. Prod. Technol., 1–16.
Duan, Y., Wang, C. Y., Zheng, C. Y., Wu, B. X., and Zheng, G. D. (2008). Geochemical Study of Crude Oils from the Xifeng Oilfield of the Ordos basin, China. J. Asian Earth Sci. 31 (4-6), 341–356. doi:10.1016/j.jseaes.2007.05.003
Ehsan, M., Gu, H., Akhtar, M. M., Abbasi, S. S., and Ehsan, U. (2018). A Geological Study of Reservoir Formations and Exploratory Well Depths Statistical Analysis in Sindh Province, Southern Lower Indus Basin, Pakistan. Kuwait J. Sci. 44 (1), 417–428. doi:10.1007/s13369-018-3476-8
Ehsan, M., Gu, H., Ali, A., Akhtar, M. M., Abbasi, S. S., Miraj, M. A. F., et al. (2021). An Integrated Approach to Evaluate the Unconventional Hydrocarbon Generation Potential of the Lower Goru Formation (Cretaceous) in Southern Lower Indus Basin, Pakistan. J. Earth Syst. Sci. 130 (2), 1–16. doi:10.1007/s12040-021-01584-4
Ehsan, M., and Gu, H. (2020). An Integrated Approach for the Identification of Lithofacies and clay Mineralogy through Neuro-Fuzzy, Cross Plot, and Statistical Analyses, from Well Log Data. J. Earth Syst. Sci. 129 (1), 1–13. doi:10.1007/s12040-020-1365-5
Feng, C., Lei, D., Qu, J., and Huo, J. (2019). Controls of Paleo-Overpressure, Faults and Sedimentary Facies on the Distribution of the High Pressure and High Production Oil Pools in the Lower Triassic Baikouquan Formation of the Mahu Sag, Junggar Basin, China. J. Pet. Sci. Eng. 176, 232–248. doi:10.1016/j.petrol.2019.01.012
Hao, S. M., Li, L., and You, H. Z. (2007). Permo-Carboniferous Paralic Depositional Systems in the Daniudi Gas Field and its Near-Source Box-type Gas Accumulation Forming Model. Geology. China 34 (2), 605–611. (In Chinese with English abstract) 1000-3657 (2007) 04-606-06.
Jiang, R., Zhao, L., Xu, A., Ashraf, U., Yin, J., Song, H., et al. (2021). Sweet Spots Prediction through Fracture Genesis Using Multi-Scale Geological and Geophysical Data in the Karst Reservoirs of Cambrian Longwangmiao Carbonate Formation, Moxi-Gaoshiti Area in Sichuan Basin, South China. J. Pet. Exploration Prod. Technol., 1–16. doi:10.1007/s13202-021-01390-0
Jiang, Y., Sun, J., Gao, J., Shao, W., Chi, X., and Chai, X. (2017). Numerical Simulation of Mud Invasion Around the Borehole in Low Permeability Reservoir and a Method for Array Induction Log Resistivity Correction. J. Jilin Univ. (Earth Sci. Edition) 47 (1), 265–278. doi:10.13278/j.cnki.jjuese.201701306
Jiang, Z., Xu, J., Chen, Z., and Lin, W. (2011). Sedimentary Systems and Their Influences on Gas Distribution in the Second Member and Third Member of the Permian Xiashihezi Formation in the Daniudi Gas Field, Ordos Basin, China. Energy Exploration & Exploitation 29 (1), 59–75. doi:10.1260/0144-5987.29.1.59
Li, B., Zhang, H., Xia, Q., Peng, J., and Guo, Q. (2021). Quantitative Evaluation of Tight Sandstone Reservoir Based on Diagenetic Facies—A Case of Lower Silurian Kepingtage Formation in Shuntuoguole Low Uplift, Tarim Basin, China. Front. Earth Sci. 8, 597535. doi:10.3389/feart.2020.597535
Li, Q., Wu, W., Yu, S., Kang, H., Tong, L., Cao, X., et al. (2017). The Application of Three-Dimensional Seismic Spectral Decomposition and Semblance Attribute to Characterizing the deepwater Channel Depositional Elements in the Taranaki Basin of New Zealand. Acta Oceanol. Sin. 36 (9), 79–86. doi:10.1007/s13131-017-1113-0
Li, W. L., Ji, W. M., Liu, Z., Lei, T., and Zhu, J. Y. (2015). Control of Boerjianghaizi Fault on Gas Accumulation of Upper Paleozoic in Northern Ordos basin. Geoscience 29 (3), 584–590. (in Chinese with English abstract 1000- 8527 (2015) 03- 0584 -07).
Lin, W., Chen, L., Lu, Y., and Zhao, S. (2017). “Sedimentary Facies and Gas Accumulation Model of Lower Shihezi Formation in Shenguhao Area, Northern Ordos basin, China,” in EGU General Assembly Conference Abstracts, Vienna, Austria, April 23–28, 2017, 3896.
Liu, J., Wang, Y., Yang, M., Xie, C., Zhao, X., and Chen, S. (2007). Seismic Identification of Channel Sandbodies in the Fuyang Oil Layer in North Songliao Basin, China. Appl. Geophys. 4 (2), 127–132. doi:10.1007/s11770-007-0018-7
Liu, K., Wang, R., Shi, W., Zhang, W., Qi, R., Qin, S., et al. (2020). Tectonic Controls on Permian Tight Gas Accumulation: Constrains from Fluid Inclusion and Paleo-Structure Reconstruction in the Hangjinqi Area, Northern Ordos Basin, China. J. Nat. Gas Sci. Eng. 83, 103616. doi:10.1016/j.jngse.2020.103616
Patel, M. D., and McMechan, G. A. (2003). Building 2-D Stratigraphic and Structure Models from Well Log Data and Control Horizons. Comput. Geosciences 29 (5), 557–567. doi:10.1016/s0098-3004(03)00039-6
Radwan, A. E., Kassem, A. A., and Kassem, A. (2020). Radwany Formation: A New Formation Name for the Early-Middle Eocene Carbonate Sediments of the Offshore October Oil Field, Gulf of Suez: Contribution to the Eocene Sediments in Egypt. Mar. Pet. Geology. 116, 104304. doi:10.1016/j.marpetgeo.2020.104304
Radwan, A. E. (2021). Modeling the Depositional Environment of the sandstone Reservoir in the Middle Miocene Sidri Member, Badri Field, Gulf of Suez Basin, Egypt: Integration of Gamma-ray Log Patterns and Petrographic Characteristics of Lithology. Nat. Resour. Res. 30 (1), 431–449. doi:10.1007/s11053-020-09757-6
Radwan, A. E., Rohais, S., and Chiarella, D. (2021b). Combined Stratigraphic-Structural Play Characterization in Hydrocarbon Exploration: A Case Study of Middle Miocene Sandstones, Gulf of Suez basin, Egypt. J. Asian Earth Sci. 218, 104686. doi:10.1016/j.jseaes.2021.104686
Radwan, A. E. (2022). “Three-dimensional Gas Property Geological Modeling and Simulation,” in Sustainable Geoscience for Natural Gas Subsurface Systems (Cambridge, MA: Gulf Professional Publishing), 29–49. doi:10.1016/b978-0-323-85465-8.00011-x
Radwan, A. E., Trippetta, F., Kassem, A. A., and Kania, M. (2021a). Multi-scale Characterization of Unconventional Tight Carbonate Reservoir: Insights from October Oil Filed, Gulf of Suez Rift basin, Egypt. J. Pet. Sci. Eng. 197, 107968. doi:10.1016/j.petrol.2020.107968
Radwan, A. E., Wood, D. A., Mahmoud, M., and Tariq, Z. (2022). “Gas Adsorption and reserve Estimation for Conventional and Unconventional Gas Resources,” in Sustainable Geoscience for Natural Gas Subsurface Systems (Gulf Professional Publishing), 345–382. doi:10.1016/b978-0-323-85465-8.00004-2
Ritts, B. D., Hanson, A. D., Darby, B. J., Nanson, L., and Berry, A. (2004). Sedimentary Record of Triassic Intraplate Extension in North China: Evidence from the Nonmarine NW Ordos Basin, Helan Shan and Zhuozi Shan. Tectonophysics 386 (3-4), 177–202. doi:10.1016/j.tecto.2004.06.003
Shehata, A. A., Kassem, A. A., Brooks, H. L., Zuchuat, V., and Radwan, A. E. (2021). Facies Analysis and Sequence-Stratigraphic Control on Reservoir Architecture: Example from Mixed Carbonate/siliciclastic Sediments of Raha Formation, Gulf of Suez, Egypt. Mar. Pet. Geology. 131, 105160. doi:10.1016/j.marpetgeo.2021.105160
Shu, Y., Bao, H., Chen, M., Lu, Y., Liu, H., Peng, W., et al. (2021). Lithofacies Types, Assemblage Characteristics and Sedimentary Evolution Model of Lacustrine Shale in Dongyuemiao Formation of Fuxing Area. Front. Earth Sci. 9, 772581. doi:10.3389/feart.2021.772581
Sun, Y., Liu, C., Lin, M., Li, Y., and Qin, P. (2009). Geochemical Evidences of Natural Gas Migration and Releasing in the Ordos Basin, China. Energy Exploration & Exploitation 27 (1), 1–13. doi:10.1260/014459809788708192
Ullah, J., Luo, M., Ashraf, U., Pan, H., Anees, A., Li, D., et al. (2022). Evaluation of the Geothermal Parameters to Decipher the thermal Structure of the Upper Crust of the Longmenshan Fault Zone Derived from Borehole Data. Geothermics 98, 102268. doi:10.1016/j.geothermics.2021.102268
Vo Thanh, H., and Sugai, Y. (2021). Integrated Modelling Framework for Enhancement History Matching in Fluvial Channel Sandstone Reservoirs. Upstream Oil Gas Technol. 6, 100027.
Vo Thanh, H., Sugai, Y., Nguele, R., and Sasaki, K. (2019). Integrated Workflow in 3D Geological Model Construction for Evaluation of CO2 Storage Capacity of a Fractured Basement Reservoir in Cuu Long Basin, Vietnam. Int. J. Greenh. Gas Control. 90, 102826.
Vo Thanh, H., Sugai, Y., and Sasaki, K. (2020). Impact of a New Geological Modelling Method on the Enhancement of the CO2 Storage Assessment of E Sequence of Nam Vang Field, Offshore Vietnam. Energy Sources A: Recovery Util. Environ. Eff. 42 (12), 1499–1512.
Wang, R., Shi, W., Xie, X., Zhang, W., Qin, S., Liu, K., et al. (2020). Clay mineral Content, Type, and Their Effects on Pore Throat Structure and Reservoir Properties: Insight from the Permian Tight Sandstones in the Hangjinqi Area, North Ordos Basin, China. Mar. Pet. Geology. 115, 104281. doi:10.1016/j.marpetgeo.2020.104281
Wang, X., Zhang, B., Zhao, T., Hang, J., Wu, H., and Yong, Z. (2017). Facies Analysis by Integrating 3D Seismic Attributes and Well Logs for prospect Identification and Evaluation - A Case Study from Northwest China. Interpretation 5 (2), SE61–SE74. doi:10.1190/int-2016-0149.1
Wu, X., Ni, C., Liu, Q., Liu, G., Zhu, J., and Chen, Y. (2017). Genetic Types and Source of the Upper Paleozoic Tight Gas in the Hangjinqi Area, Northern Ordos Basin, China. Geofluids 2017 (3), 1–14. doi:10.1155/2017/4596273
Xiang, Z., Li, K., Deng, H., Liu, Y., He, J., Zhang, X., et al. (2021). Research on Test and Logging Data Quality Classification for Gas-Water Identification. Energies 14 (21), 6991. doi:10.3390/en14216991
Xu, Q., Shi, W., Xie, X., Busbey, A. B., Xu, L., Wu, R., et al. (2018). Inversion and Propagation of the Late Paleozoic Porjianghaizi Fault (North Ordos Basin, China): Controls on Sedimentation and Gas Accumulations. Mar. Pet. Geology. 91, 706–722. doi:10.1016/j.marpetgeo.2018.02.003
Xue, H., An, C., Dong, Z., Xiao, D., Yan, J., Ding, G., et al. (2021). Reservoir Characteristics and Controlling Factors of Oil Content in Hybrid Sedimentary Rocks of the Lucaogou Formation, Western Jimusaer Sag, Junggar Basin. Front. Earth Sci. 9, 736598. doi:10.3389/feart.2021.736598
Yang, M. H., Li, L., Zhou, J., Jia, H. C., Sun, X., Gong, T., et al. (2015a). Structural Evolution and Hydrocarbon Potential of the Upper Paleozoic Northern Ordos Basin, north China. Acta Geologica Sinica (English Edition) 89, 1636–1648. doi:10.1111/1755-6724.12570
Yang, M. H., and Liu, C. Y. (2006). Sequence Stratigraphic Framework and its Control on Accumulation of Various Energy Resources in the Mesozoic continental Basins in Ordos. Oil Gas Geology. 27 (4), 563–570.
Yang, M., Li, L., Zhou, J., Jia, H., Sun, X., Qu, X., et al. (2015b). Mesozoic Structural Evolution of the Hangjinqi Area in the Northern Ordos Basin, North China. Mar. Pet. Geology. 66, 695–710. doi:10.1016/j.marpetgeo.2015.07.014
Yang, M., Li, L., Zhou, J., Qu, X., and Zhou, D. (2013). Segmentation and Inversion of the Hangjinqi Fault Zone, the Northern Ordos basin (North China). J. Asian Earth Sci. 70-71, 64–78. doi:10.1016/j.jseaes.2013.03.004
Yang, Y., Li, W., and Ma, L. (2005). Tectonic and Stratigraphic Controls of Hydrocarbon Systems in the Ordos Basin: A Multicycle Cratonic basin in central China. Bulletin 89 (2), 255–269. doi:10.1306/10070404027
Zhang, H., Lan, Z., Li, X., and Huang, X. (2021). The Sedimentary Facies and Evolution Characteristics of the Middle and Deep Strata in the Nanpu No. 3 Structural Area. Front. Earth Sci. 9, 525. doi:10.3389/feart.2021.703070
Zhang, L., Bai, G., Luo, X., Ma, X., Chen, M., Wu, M., et al. (2009). Diagenetic History of Tight Sandstones and Gas Entrapment in the Yulin Gas Field in the Central Area of the Ordos Basin, China. Mar. Pet. Geology. 26 (6), 974–989. doi:10.1016/j.marpetgeo.2008.05.003
Zhang, L., Liu, C., Fayek, M., Wu, B., Lei, K., Cun, X., et al. (2017). Hydrothermal Mineralization in the Sandstone-Hosted Hangjinqi Uranium deposit, North Ordos Basin, China. Ore Geology. Rev. 80, 103–115. doi:10.1016/j.oregeorev.2016.06.012
Zhang, Y. Q., Mercier, J. L., and Vergély, P. (1998). Extension in the Graben Systems Around the Ordos (China), and its Contribution to the Extrusion Tectonics of South China with Respect to Gobi-Mongolia. Tectonophysics 285 (1-2), 41–75. doi:10.1016/s0040-1951(97)00170-4
Keywords: gas accumulation, sedimentary facies, lower Shihezi formation, Hangjinqi area, fault distribution
Citation: Anees A, Zhang H, Ashraf U, Wang R, Liu K, Mangi HN, Jiang R, Zhang X, Liu Q, Tan S and Shi W (2022) Identification of Favorable Zones of Gas Accumulation via Fault Distribution and Sedimentary Facies: Insights From Hangjinqi Area, Northern Ordos Basin. Front. Earth Sci. 9:822670. doi: 10.3389/feart.2021.822670
Received: 26 November 2021; Accepted: 20 December 2021;
Published: 04 February 2022.
Edited by:
Ahmed E. Radwan, Jagiellonian University, PolandReviewed by:
Shuai Yin, Xi’an Shiyou University, ChinaJun Zhao, China University of Mining and Technology, China
Afiqah Zahraa Ahmad Zailani, Beicip-Franlab Asia, Malaysia
Copyright © 2022 Anees, Zhang, Ashraf, Wang, Liu, Mangi, Jiang, Zhang, Liu, Tan and Shi. This is an open-access article distributed under the terms of the Creative Commons Attribution License (CC BY). The use, distribution or reproduction in other forums is permitted, provided the original author(s) and the copyright owner(s) are credited and that the original publication in this journal is cited, in accordance with accepted academic practice. No use, distribution or reproduction is permitted which does not comply with these terms.
*Correspondence: Wanzhong Shi, c2hpd3pAY3VnLmVkdS5jbg==; Shucheng Tan, c2hjaHRhbkB5bnUuZWR1LmNu