 Zhen Gao1,2
 Liguang Wu
- 1Department of Atmospheric and Oceanic Sciences, Institute of Atmospheric Sciences, Fudan University, Shanghai, China
- 2State Key Laboratory of Severe Weather, Chinese Academy of Meteorological Sciences, Beijing, China
- 3Innovation Center of Ocean and Atmosphere System, Zhuhai Fudan Innovation Research Institute, Zhuhai, China
- 4IRDR ICoE on Risk Interconnectivity and Governance on Weather/Climate Extreme Impact and Public Health, Fudan University, Shanghai, China
It has been numerically demonstrated that the turbulence above the boundary is important to tropical cyclone intensification and rapid intensification, but the three-dimensional structures of the sub-grid-scale (SGS) eddy have not been revealed due to the lack of observational data. In this study, two numerical simulations of Super Typhoon Rammasun (2014) were conducted with the Advanced Weather Research and Forecast (WRF) model by incorporating the large-eddy simulation (LES) technique, in which the enhanced eyewall convection and the process of rapid intensification are captured. Consistent with previous observational studies, the strong turbulent kinetic energy (TKE) is found throughout the whole eyewall inside of the radius of maximum wind in both experiments. The simulations indicate that the strong TKE is associated with horizontal rolls with the horizontal extent of 2–4 km, which are aligned azimuthally in the intense eyewall convection. It is indicated that the three-dimensional structures of the SGS eddy can be simulated with the vertical grid spacing of ∼100 m when the horizontal grid spacing is 74 m. It is suggested that there is considerable turbulence associated with azimuthally-aligned horizontal rolls in the mid-level eyewall of tropical cyclone.
Introduction
Intensity change is currently one of the most difficult challenges in tropical cyclone (TC) forecast (Rogers et al., 2006; Rogers et al., 2013). While the strong turbulence in the traditional intensity theories is usually regarded as a flow feature pertaining to the planetary boundary layer (PBL) (Charney and Eliassen, 1964; Ooyama, 1964; Ooyama, 1969; Emanuel, 1986; Emanuel, 1995), a few studies suggested that intense turbulent mixing generated by cloud processes also exists above the PBL in the eyewall and rainbands of a TC (Lorsolo et al., 2010; Rogers et al., 2012; Zhu et al., 2019; Chen and Bryan, 2021; Zhu et al., 2021). Using airborne Doppler measurements, Lorsolo et al. (2010) and Rogers et al. (2012) found strong turbulence in the convective eyewall throughout the troposphere mainly within the radius of maximum wind. Incorporating an in-cloud turbulent-mixing parameterization in the vertical turbulent-mixing scheme of the Hurricane Weather Research and Forecasting (HWRF) model, Zhu et al. (2019) numerically demonstrated the importance of eyewall and rainband sub-grid-scale (SGS) eddy forcing to numerical prediction of TC intensification and rapid intensification, but the three-dimensional structures of the SGS eddy have not been revealed due to the lack of observational data. Thus, to better understand the in-cloud turbulent mixing and improve the TC intensity forecasts, it is necessary to understand the fine-scale features of the TC eyewall.
Previous studies focused mostly on fine-scale structures in the TC boundary layer. Two coherent structures have already been revealed. One is roll vortices (Foster, 2005; Nolan, 2005; Gao and Ginis, 2016; Wang and Jiang, 2016; Gao et al., 2017; Gao and Ginis, 2018), which tend to align with the tangential winds with sub-kilometer to multi-kilometer wavelengths (Wurman and Winslow, 1998; Morrison et al., 2005; Lorsolo et al., 2008; Ellis and Businger, 2010). The other is called tornado-scale vortices, which are associated with extreme updrafts and downdrafts, strong vertical vorticity, and huge near-surface gusts (Aberson et al., 2006; Marks et al., 2008; Wurman and Kosiba, 2018; Wu et al., 2018, 2019). Relatively little is known about the fine-scale structures in the mid-level eyewall of TCs although the extreme updrafts beyond the TC boundary layer were observed (Guimond et al., 2010; Heymsfield et al., 2010). Recently, Zheng et al. (2020) examined two numerical experiments conducted with the Advanced Weather Research and Forecast (WRF) model, in which the large-eddy simulation (LES) technique is used with the finest grid spacing of 37 and 111 m. They found that the simulated extreme updraft in the TC eyewall exhibited relatively high frequencies in the lower, middle and upper troposphere, suggesting different types of fine-scale structures associated with the extreme updrafts. Following Zheng et al. (2020), the numerical simulation of Typhoon Rammasun (2014) was conducted with the WRF-LES framework In this study. Our focus is on the vertical distribution of turbulent kinetic energy (TKE) and the associated fine-scale structures in the mid-level eyewall.
Experimental Design
Super Typhoon Rammasun (2014) formed to the east of the Philippines on 12 July 2014, became a super typhoon in the South China Sea on 17 July, and reached its peak intensity at 0600 UTC 18 July after 36 h of rapid intensification (Qiu et al., 2020). Rammasun made its first landfall over Hainan Island at 0730 UTC 18 July 2014. Based on the China Meteorological Administration (CMA) best track dataset, the lifetime maximum intensity is 888 hPa in the sea-level pressure and 71.4 m s−1 in the maximum wind speed at 10 m, while the peak intensity is 918 hPa and 72.0 m s−1 in the Joint Typhoon Warning Center (JTWC) best track dataset.
In this study, two numerical experiments were designed to simulate the rapid intensification of Super Typhoon Rammasun (2014) in the South China Sea and its subsequent landfall process using version 3.2.1 of the WRF model. The outermost domain (centered at 18.9°N, 116.9°E) covered an area of 5,600 km × 4,500 km with a horizontal grid spacing of 18 km. The horizontal grid spacings of the five nested domains were 6 km, 2 km, 2/3 km (∼667 m), 2/9 km (∼222 m), and 2/27 km (∼74 m), respectively. There were 251 × 311, 271 × 271, 211 × 211, 541 × 541, 802 × 802, 1801 × 1801 grid points, respectively. Two different vertical spacings are used in the numerical simulations. Vertical grid spacing in LES75 increases rapidly from 40 to ∼350 m at 5 km and shows decline to 250 m at top of the model (50 hPa). The second experiment (LES151) is designed to increase from 40 to 100 m at 200 m, sustain ∼100 m until 12 km and experience a steady growth to more than 250 m at 50 hPa. The model tops in two experiments were 50 hPa.
The simulations were initialized at 1800 UTC 15 July 2014 when it was over the Philippines and integrated for 72 h to 1800 UTC 18 July 2014 when it made the second landfall in Guangxi, China. The spun-up vortex was initially located at the center of Super Typhoon Rammasun (13.6°N, 121.9°E). The two innermost domains were activated at 0000 UTC 18 July after the third and fourth domains were activated at 2100 UTC 15 July. The Kain–Fritsch cumulus parameterization scheme was used in the outermost domain (Kain and Fritsch, 1993), and the WRF six-class scheme was selected in the nested domains (Hong and Lim, 2006). The Rapid Radiative Transfer Model (RRTM) and the Dudhia shortwave radiation scheme were used for calculating long-wave radiation and shortwave radiation (Dudhia, 1989; Mlawer et al., 1997). The LES technique is adopted in the sub-kilometer domains (Mirocha et al., 2010) and the Yonsei University scheme is selected for PBL parameterization in the other domains (Noh et al., 2003).
The purpose of two experiments is to compare the influence of the vertical spacing on the TKE at the middle levels. In the following analysis, we will focus on the hourly output from 0300 UTC to 0700 UTC 18 July (3 h after the activation of the innermost domain and before landfall in Hainan Island at 0700 UTC 18 July). The TC center is defined as the minimum pressure variance center (Yang et al., 2020).
Overview of the Simulated Typhoon
Figure 1 shows the comparisons of the track and intensity between the observation and the simulation. The simulated tracks in LES75 and LES151 are very close to the observation (Figure 1A). The mean errors between the observed and simulated tracks are about 30 km in LES75 and 33 km in LES151, respectively. The landfall time of the simulated TCs is 0700 UTC 18 July. Considering the 1-h output interval, it is consistent with the observed landfall time of 0730 UTC 18 July.
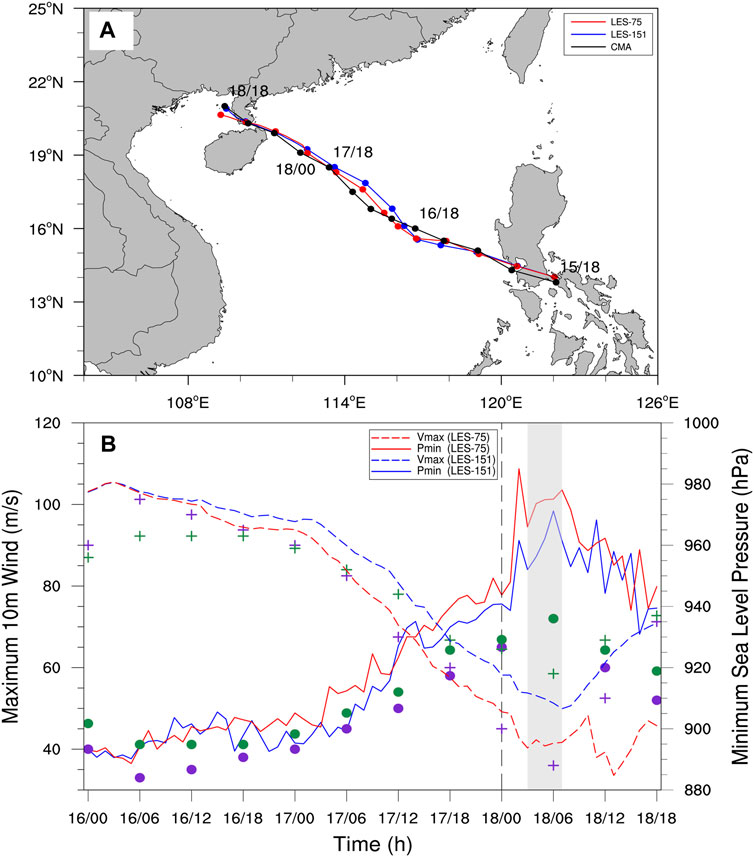
FIGURE 1. Comparisons of the observed and simulated (A) tracks and (B) intensities of Super Typhoon Rammasun (2014). The time is in the dd/hh format. The observed track is from the CMA best track dataset, while the observed intensities are from the CMA best track dataset (purple dots and crosses) and the JTWC best track dataset (green dots and crosses) in terms of minimum sea-level pressure (crosses, units: hPa) and maximum instantaneous wind speed at 10 m (dots, units: m s−1). The time intervals are 6 h from the observation and 1 h for the simulation. The gray shading area is the range of analysis times and the black dashed line indicates the activation of D05 and D06 domains.
The simulated intensity is measured with the minimum sea-level pressure and the maximum instantaneous 10 m wind speed. Note that the simulated intensity is always derived from the innermost domain. The intensity evolution of Rammasun (2014) is well simulated in LES75 and LES151, except the abrupt increase of the maximum instantaneous 10 m wind speed immediately after the fifth and sixth domains are activated at 0000 UTC 18 July. For this reason, our analysis covers a 4-h period from 0300 UTC to 0700 UTC on 18 July. As shown in Figure 1B, both two simulations capture the observed rapid intensification processes.
The minimum sea-level pressure fluctuates between 893.7 (906.6) and 896.4 (911.7) hPa during 4 h in LES75 (LES151) (Figure 1B). They are higher than the minimum sea-level pressure of 888 hPa in the CMA dataset, and lower than the minimum sea-level pressure of 918 hPa in the JTWC dataset. The minimum pressure of 888 hPa in the CMA dataset was estimated by observation from Qizhou Island station in the eyewall (Cai and Xu, 2016). Feng et al. (2021) argued that the minimum sea-level pressure resulted from the tornado-scale vortex that is prevalent near the inner edge of the TC eyewall. During the 4-h period, the maximum instantaneous wind fluctuates between 94.5 (84.0) and 103.5 (98.4) m s−1 in LES75 (LES151). In Cai and Xu (2016), the maximum instantaneous wind of 72.4 m s−1 at 0439 UTC 18 July was observed at Qizhou Island station just before the anemometer was destroyed. The station was then located at the inner edge of the eyewall. Considering lack of the observation and the influence of the tornado-scale vortex on the simulated maximum instantaneous wind (Wu et al., 2018), the intensity of Rammasun (2014) in our simulations are generally comparable to that in the observation.
Figure 2 shows the comparison of the simulated radar reflectivity at 800 m at 0700 UTC 18 July in the D04 domain and the observation at Haikou station at 0659 UTC 18 July. The observed and simulated vertical shear vectors between 200 hPa and 850 hPa are also plotted. The magnitudes of the shear over the radius of 500 km are 6.0 m s−1 in the fifth generation European Centre for Medium-range Weather Forecasting (ECMWF) global reanalysis (ERA5,
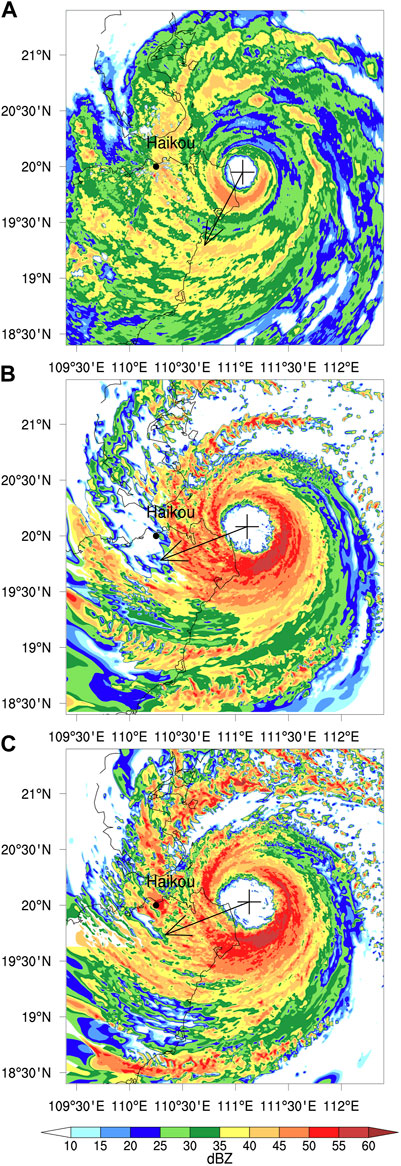
FIGURE 2. The comparisons of the radar reflectivity (units: dBZ) from (A) Haikou station at 0659 UTC 18 July 2014 and the radar reflectivity at 800 m in (B) LES75 and (C) LES151 at 0700 UTC 18 July 2014 in the D04 domain. The arrow shows the vertical wind shear between 200 hPa and 850 hPa and plus signs indicate the TC center.
The Simulated TKE and the Associated Mid-Level Fine Structures
Following previous studies (Green and Zhang, 2014; Wu et al., 2018, 2019), the mean wind fields are obtained by averaging in a moving box of 8 × 8 km2. The perturbation wind components are the differences between the total wind and the smoothed wind. Wu et al. (2019) examined the perturbation winds with different moving windows in size. They found that there is little difference in the resulting small-scale features with the finest grid spacing of 37 m as the window size is larger than 8 × 8 km2. The small-scale features are similar to those by subtracting the symmetric and wavenumber 1-3 components with respect to the TC center.
Following Zhang et al. (2011) and Liu et al. (2021), the TKE at a grid point is computed as follows:
where
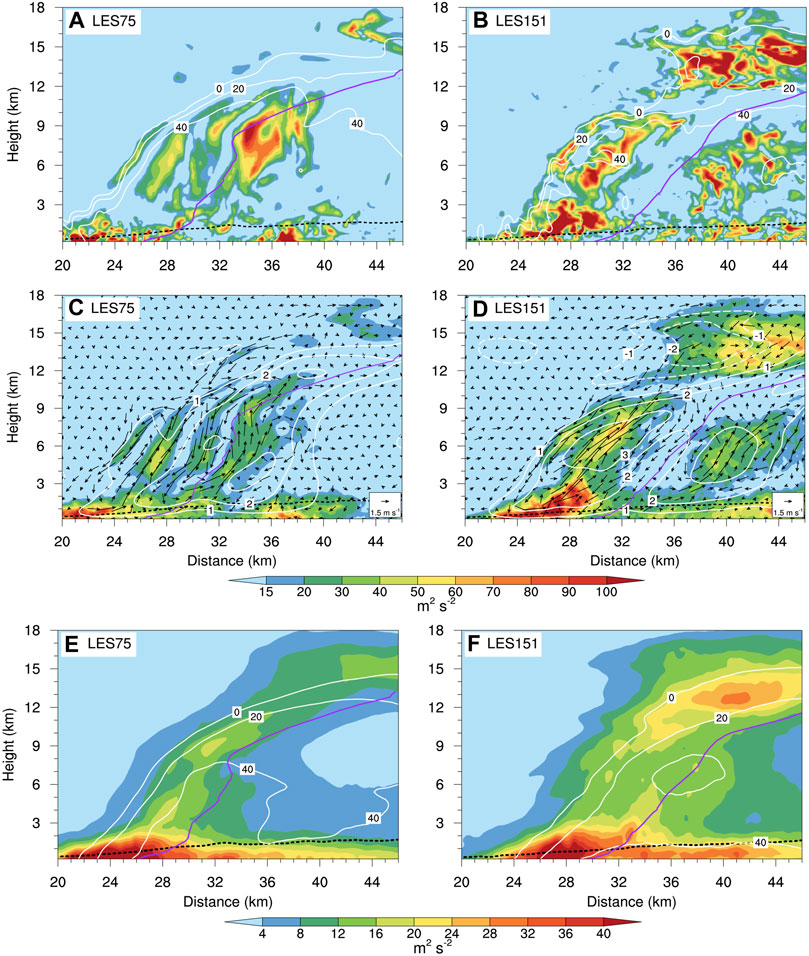
FIGURE 3. (A, B) The radius-height cross sections of TKE (shading, units: m2 s-2) and radar reflectivity (contours, units: dBZ) simulated at 0300 UTC 18 July in LES75 (left) along the azimuth of 185° and at 0400 UTC 18 July in LES151 (right) along the azimuth of 188° with an interval of 20 dBZ. (C, D) The radius-height sector cross sections of TKE (shading), radial and vertical perturbation winds (vectors), and smoothed vertical motion (solid contours for upward motion and dashed contours for downward motion), which are averaged over 170°–200° in LES75 and averaged over 173°–203° in LES151. (E, F) Same as (A, B), but averaged azimuthally over the whole eyewall. The radius of maximum wind is indicated with the solid purple lines and the dashed black lines indicate the height of the inflow layer.
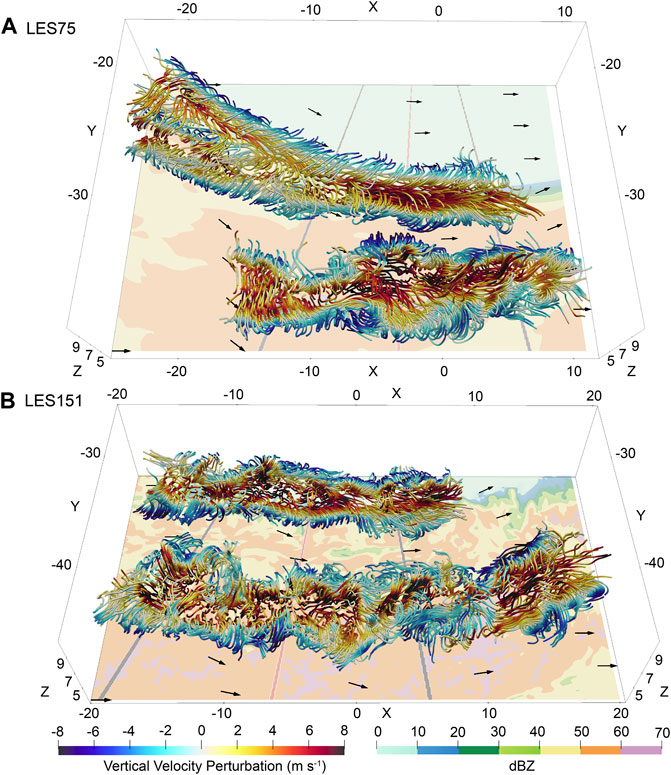
FIGURE 4. The perturbation winds (three-dimensional streamlines), 7 km horizontal winds (vectors), and 7 km radar reflectivity (shading) at 0300 UTC 18 July in LES75 and at 0400 UTC 18 July in LES151. The streamlines with warm and cool colors indicate the upward and downward motion, respectively. The red and black lines indicate the position of the cross section in Figures 3A,B and the azimuthal range of the cross sections in Figures 3C,D, respectively.
To demonstrate the fine-scale wind structures associated with the localized high TKE, the sector radius-height cross sections in the vicinity of these in Figures 3A,B are averaged azimuthally in Figures 3C,D. The average covers an azimuthal range of 30° from 170° to 200° in LES75 and 173°–203° in LES151 (azimuthal ranges shown in Figure 4). Both the experiments indicate that the high TKE at middle levels is associated with relatively horizontal rolls, which tilt radially outward with the increasing height. The radial extent of the horizontal rolls is 2–4 km, and the vertical extent is larger than the radial extent. The horizontal rolls occur in the eyewall vertical motion (white contours) smoothed with a 8 × 8 km2 moving box, suggesting that the horizontal rolls are associated with the eyewall convection (Figures 3C,D). The rolls are found on both the sides of the radius of maximum wind.
Lorsolo et al. (2010) retrieved the TKE using airborne Doppler measurements from Hurricanes Isabel (2003), Fabian (2003), Frances (2004), Katrina (2005), and Rita (2005) at various stages of their development. They constructed a mean cross section of TKE for all considered legs and proposed a conceptual model. The largest TKE is located inside of the radius of maximum wind. Figures 3E,F show the cross section of the mean TKE averaged azimuthally for the whole eyewall in LES75 and LES151. Consistent with Lorsolo et al. (2010), both the two experiments successfully simulate “tower-like” structure of TKE, and the strongest TKE occurs inside of the radius of maximum wind. Also, the strong TKE exists in the boundary inflow outside of the radius of maximum wind. Compared with LES75, the region of azimuthally mean TKE >12 m2 s−2 shows wider range at the middle level in LES151. Moreover, higher azimuthally mean TKE (>20 m2 s−2) is simulated in LES151 at the upper levels (Figures 3E,F).
The horizontal rolls in Figures 3C,D actually represent azimuthally-aligned vortex rings in the three-dimensional streamlines of perturbation winds (Figure 4), which are located in the mid-level eyewall within the strong convection (Figure 2). In Figure 4, the simulated radar reflectivity at 7 km is also plotted to indicate the intense eyewall convection. As shown in Figure 4, horizontal rolls with the horizontal extent of 2–4 km in the mid-level eyewall are successfully simulated in LES75 and LES151 with vertical grid spacings of ∼300 and ∼100 m. It is suggested that the simulation with the vertical grid spacings in LES75 and LES151 can resolve the vortex rings. We examine all the 4-h data and find that the azimuthally-aligned rolls are a common feature in the mid-level eyewall convection.
Summary
Previous studies indicated that strong turbulence could occur in the convective eyewall throughout the troposphere (Lorsolo et al., 2010; Rogers et al., 2012; Chen and Bryan, 2021). The importance of eyewall and rainband sub-grid-scale (SGS) eddy forcing to TC intensification and rapid intensification has been demonstrated numerically (Zhu et al., 2019). Jiang et al. (2020) and Zheng et al. (2020) have shown that the extreme updraft contained small-scale rolls within the eyewall and rainbands region. In addition, these small-scale turbulent mixing plays an important role in transporting heat, momentum and water vapor in deep convective clouds (LeMone and Zipser, 1980; Hogan et al., 2009). However, the three-dimensional structures of the fine-scale structures associated with strong TKE have not been revealed due to the lack of observational data.
In this study, two numerical simulations of Super Typhoon Rammasun (2014) were conducted with the LES technique in the WRF model. While the vertical spacing is ∼300 m in LES75, the vertical spacing is ∼100 m in LES151 at the middle levels (3–11 km). Although the simulated intensity is different in terms of the minimum sea-level pressure and maximum instantaneous wind at 10 m, the enhanced eyewall convection and the process of rapid intensification are captured in two experiments. It is found that the azimuthally mean TKE simulated in both experiments consistent with the observation (Lorsolo et al., 2010; Rogers et al., 2012). That is, the strong TKE is found throughout the whole eyewall inside of the radius of maximum wind. Furthermore, the strong TKE is associated with horizontal rolls, and which are aligned azimuthally in the intense eyewall convection. The radial extent of the horizontal rolls is 2–4 km, and the vertical extent is larger than the radial extent. This study suggests that there is considerable turbulence associated with azimuthally-aligned horizontal rolls in the mid-level eyewall of tropical cyclone.
Although previous observations have studied the distributions of strong TKE in the eyewall (Lorsolo et al., 2010; Rogers et al., 2012), the associated mid-level fine-scale features remain unclear due to the limitation of the observations. The results presented in this study should be useful for revealing the structures of fine-scale structures associated with strong TKE numerically. Future research effort should be continuously devoted to confirming the existence of mid-level horizontal rolls and improving in-cloud turbulent-mixing parameterization given the importance of the fine-scale systems on TC structure changes and intensity (Zhu et al., 2019, 2021).
Data Availability Statement
The raw data supporting the conclusion of this article will be made available by the authors, without undue reservation.
Author Contributions
LW and ZG conducted analysis and writing. ZG contributed to figures included in this manuscript. XZ conducted the numerical experiment.
Funding
This study was jointly supported by the National Natural Science Foundation of China (41730961, 41930967, and 41905001) and the Scientific Research Program of Shanghai Municipal Science and Technology Commission (19dz1200101).
Conflict of Interest
The authors declare that the research was conducted in the absence of any commercial or financial relationships that could be construed as a potential conflict of interest.
Publisher’s Note
All claims expressed in this article are solely those of the authors and do not necessarily represent those of their affiliated organizations, or those of the publisher, the editors and the reviewers. Any product that may be evaluated in this article, or claim that may be made by its manufacturer, is not guaranteed or endorsed by the publisher.
References
Aberson, S. D., Montgomery, M. T., Bell, M., and Black, M. (2006). Hurricane Isabel (2003): New Insights into the Physics of Intense Storms. Part II: Extreme Localized Wind. Bull. Am. Meteorol. Soc. 87 (10), 1349–1354. doi:10.1175/BAMS-87-10-1349
Cai, Q., and Xu, Y. “An Analysis of Super Typhoon Rammasun's (2014) Peak Intensity,” in EGU general assembly conference abstracts, Vienna, Austria, April 2016, 13654. European Planetary Science Congress, EPSC2016-13654.
Charney, J. G., and Eliassen, A. (1964). On the Growth of the Hurricane Depression. J. Atmos. Sci. 21 (1), 68–75. doi:10.1175/1520-0469(1964)021<0068:OTGOTH>2.0.CO;2
Chen, X., and Bryan, G. H. (2021). Role of Advection of Parameterized Turbulence Kinetic Energy in Idealized Tropical Cyclone Simulations. J. Atmos. Sci. 1 (11), 3593–3611. doi:10.1175/JAS-D-21-0088.1
Dudhia, J. (1989). Numerical Study of Convection Observed during the Winter Monsoon Experiment Using a Mesoscale Two-Dimensional Model. J. Atmos. Sci. 46 (20), 3077–3107. doi:10.1175/1520-0469(1989)046<3077:NSOCOD>2.0.CO;2
Ellis, R., and Businger, S. (2010). Helical Circulations in the Typhoon Boundary Layer. J. Geophys. Res. 115, D06205. doi:10.1029/2009JD011819
Emanuel, K. A. (1986). An Air-Sea Interaction Theory for Tropical Cyclones. Part I: Steady-State Maintenance. J. Atmos. Sci. 43 (6), 585–605. doi:10.1175/1520-0469(1986)043<0585:AASITF>2.0.CO;2
Emanuel, K. A. (1995). Sensitivity of Tropical Cyclones to Surface Exchange Coefficients and a Revised Steady-State Model Incorporating Eye Dynamics. J. Atmos. Sci. 52 (22), 3969–3976. doi:10.1175/1520-0469(1995)052<3969:SOTCTS>2.0.CO;2
Feng, Y., Wu, L., Liu, Q., and Zhou, W. (2021). Negative Pressure Perturbations Associated with Tornado‐Scale Vortices in the Tropical Cyclone Boundary Layer. Geophys. Res. Lett. 48 (9). doi:10.1029/2020GL091339
Foster, R. C. (2005). Why Rolls Are Prevalent in the Hurricane Boundary Layer. J. Atmos. Sci. 62 (8), 2647–2661. doi:10.1175/JAS3475.1
Gao, K., Ginis, I., Doyle, J. D., and Jin, Y. (2017). Effect of Boundary Layer Roll Vortices on the Development of an Axisymmetric Tropical Cyclone. J. Atmos. Sci. 74 (9), 2737–2759. doi:10.1175/JAS-D-16-0222.1
Gao, K., and Ginis, I. (2018). On the Characteristics of Linear-phase Roll Vortices under a Moving Hurricane Boundary Layer. J. Atmos. Sci. 75 (8), 2589–2598. doi:10.1175/JAS-D-17-0363.1
Gao, K., and Ginis, I. (2016). On the Equilibrium-State Roll Vortices and Their Effects in the Hurricane Boundary Layer. J. Atmos. Sci. 73 (3), 1205–1222. doi:10.1175/JAS-D-15-0089.1
Green, B. W., and Zhang, F. (2014). Sensitivity of Tropical Cyclone Simulations to Parametric Uncertainties in Air-Sea Fluxes and Implications for Parameter Estimation. Monthly Weather Rev. 142 (6), 2290–2308. doi:10.1175/mwr-d-13-00208.1
Guimond, S. R., Heymsfield, G. M., and Turk, F. J. (2010). Multiscale Observations of Hurricane Dennis (2005): The Effects of Hot Towers on Rapid Intensification. J. Atmos. Sci. 67 (3), 633–654. doi:10.1175/2009JAS3119.1
Heymsfield, G. M., Tian, L., Heymsfield, A. J., Li, L., and Guimond, S. (2010). Characteristics of Deep Tropical and Subtropical Convection from Nadir-Viewing High-Altitude Airborne Doppler Radar. J. Atmos. Sci. 67 (2), 285–308. doi:10.1175/2009JAS3132.1
Hogan, R. J., Grant, A. L. M., Illingworth, A. J., Pearson, G. N., and O'Connor, E. J. (2009). Vertical Velocity Variance and Skewness in clear and Cloud-Topped Boundary Layers as Revealed by Doppler Lidar. Q.J.R. Meteorol. Soc. 135 (640), 635–643. doi:10.1002/QJ.413
Hong, S. Y., and Lim, J.-O. J. (2006). The WRF Single-Moment 6-Class Microphysics Scheme (WSM6). Asia-Pacific J. Atmos. Sci. 42 (2), 129–151.
Jiang, Y., Wu, L., Zhao, H., Zhou, X., and Liu, Q. (2020). Azimuthal Variations of the Convective-Scale Structure in a Simulated Tropical Cyclone Principal Rainband. Adv. Atmos. Sci. 37 (11), 1239–1255. doi:10.1007/S00376-020-9248-X
Kain, J. S., and Fritsch, J. M. (1993). “Convective Parameterization for Mesoscale Models: The Kain-Fritsch Scheme,” in The Representation of Cumulus Convection in Numerical Models. Editor K. Emanuel (New York, United States: Springer), 165–170. doi:10.1007/978-1-935704-13-3_16
LeMone, M. A., and Zipser, E. J. (1980). Cumulonimbus Vertical Velocity Events in GATE. Part I: Diameter, Intensity and Mass Flux. J. Atmos. Sci. 37 (11), 2444–2457. doi:10.1175/1520-0469(1980)037<2444:CVVEIG>2.0.CO;2
Liu, Q., Wu, L., Qin, N., and Li, Y. (2021). Storm‐Scale and Fine‐Scale Boundary Layer Structures of Tropical Cyclones Simulated with the WRF‐LES Framework. Geophys. Res. Atmos. 126, e2021JD035511. doi:10.1029/2021JD035511
Lorsolo, S., Schroeder, J. L., Dodge, P., and Marks, F. (2008). An Observational Study of Hurricane Boundary Layer Small-Scale Coherent Structures. Monthly Weather Rev. 136 (8), 2871–2893. doi:10.1175/2008MWR2273.1
Lorsolo, S., Zhang, J. A., Marks, F., and Gamache, J. (2010). Estimation and Mapping of Hurricane Turbulent Energy Using Airborne Doppler Measurements. Monthly Weather Rev. 138 (9), 3656–3670. doi:10.1175/2010MWR3183.1
Marks, F. D., Black, P. G., Montgomery, M. T., and Burpee, R. W. (2008). Structure of the Eye and Eyewall of Hurricane Hugo (1989). Monthly Weather Rev. 136 (4), 1237–1259. doi:10.1175/2007MWR2073.1
Mirocha, J. D., Lundquist, J. K., and Kosović, B. (2010). Implementation of a Nonlinear Subfilter Turbulence Stress Model for Large-Eddy Simulation in the Advanced Research WRF Model. Monthly Weather Rev. 138 (11), 4212–4228. doi:10.1175/2010MWR3286.1
Mlawer, E. J., Taubman, S. J., Brown, P. D., Iacono, M. J., and Clough, S. A. (1997). Radiative Transfer for Inhomogeneous Atmospheres: RRTM, a Validated Correlated-K Model for the Longwave. J. Geophys. Res. 102, 16663–16682. doi:10.1029/97JD00237
Morrison, I., Businger, S., Marks, F., Dodge, P., and Businger, J. A. (2005). An Observational Case for the Prevalence of Roll Vortices in the Hurricane Boundary Layer*. J. Atmos. Sci. 62 (8), 2662–2673. doi:10.1175/JAS3508.1
Noh, Y., Cheon, W. G., Hong, S. Y., and Raasch, S. (2003). Improvement of the K-Profile Model for the Planetary Boundary Layer Based on Large Eddy Simulation Data. Boundary-Layer Meteorology 107 (2), 401–427. doi:10.1023/A:1022146015946
Nolan, D. S. (2005). Instabilities in hurricane-like Boundary Layers. Dyn. Atmospheres Oceans 40 (3), 209–236. doi:10.1016/J.DYNATMOCE.2005.03.002
Ooyama, K. (1964). A Dynamical Model for the Study of Tropical Cyclone Development. Geofísica Internacional (Mexico) 4, 187–198.
Ooyama, K. (1969). Numerical Simulation of the Life Cycle of Tropical Cyclones. J. Atmos. Sci. 26 (1), 3–40. doi:10.1175/1520-0469(1969)026<0003:NSOTLC>2.0.CO;2
Qiu, W., Wu, L., and Ren, F. (2020). Monsoonal Influences on Offshore Rapid Intensification of Landfalling Typhoons in a Sheared Environment over the South China Sea. Weather Forecast. 35 (2), 623–634. doi:10.1175/WAF-D-19-0134.1
Rogers, R., Aberson, S., Aksoy, A., Annane, B., Black, M., Cione, J., et al. (2013). NOAA'S Hurricane Intensity Forecasting Experiment: A Progress Report. Bull. Am. Meteorol. Soc. 94 (6), 859–882. doi:10.1175/BAMS-D-12-00089.1
Rogers, R., Aberson, S., Black, M., Black, P., Cione, J., Dodge, P., et al. (2006). The Intensity Forecasting Experiment: A NOAA Multiyear Field Program for Improving Tropical Cyclone Intensity Forecasts. Bull. Am. Meteorol. Soc. 87 (11), 1523–1538. doi:10.1175/BAMS-87-11-1523
Rogers, R., Lorsolo, S., Reasor, P., Gamache, J., and Marks, F. (2012). Multiscale Analysis of Tropical Cyclone Kinematic Structure from Airborne Doppler Radar Composites. Monthly Weather Rev. 140 (1), 77–99. doi:10.1175/MWR-D-10-05075.1
Wang, S., and Jiang, Q. (2016). Impact of Vertical Wind Shear on Roll Structure in Idealized hurricane Boundary Layers. Atmos. Chem. Phys. 17 (5), 3507–3524. doi:10.5194/ACP-17-3507-2017
Wu, L., Liu, Q., and Li, Y. (2018). Prevalence of Tornado-Scale Vortices in the Tropical Cyclone Eyewall. Proc. Natl. Acad. Sci. USA 115 (33), 8307–8310. doi:10.1073/PNAS.1807217115
Wu, L., Liu, Q., and Li, Y. (2019). Tornado-scale Vortices in the Tropical Cyclone Boundary Layer: Numerical Simulation with the WRF-LES Framework. Atmos. Chem. Phys. 19 (4), 2477–2487. doi:10.5194/ACP-19-2477-2019
Wurman, J., and Kosiba, K. (2018). The Role of Small-Scale Vortices in Enhancing Surface Winds and Damage in Hurricane Harvey (2017). Mon. Wea. Rev. 146 (3), 713–722. doi:10.1175/MWR-D-17-0327.1
Wurman, J., and Winslow, J. (1998). Intense Sub-kilometer-scale Boundary Layer Rolls Observed in hurricane Fran. Science 280 (5363), 555–557. doi:10.1126/SCIENCE.280.5363.555
Yang, H., Wu, L., and Xie, T. (2020). Comparisons of Four Methods for Tropical Cyclone Center Detection in a High-Resolution Simulation. J. Meteorol. Soc. Jpn. 98 (2), 379–393. doi:10.2151/JMSJ.2020-020
Zhang, J. A., Marks, F. D., Montgomery, M. T., and Lorsolo, S. (2011). An Estimation of Turbulent Characteristics in the Low-Level Region of Intense Hurricanes Allen (1980) and Hugo (1989). Mon. Wea. Rev. 139 (5), 1447–1462. doi:10.1175/2010MWR3435.1
Zheng, Y., Wu, L., Zhao, H., Zhou, X., and Liu, Q. (2020). Simulation of Extreme Updrafts in the Tropical Cyclone Eyewall. Adv. Atmos. Sci. 37 (7), 781–792. doi:10.1007/S00376-020-9197-4
Zhu, P., Hazelton, A., Zhang, Z., Marks, F. D., and Tallapragada, V. (2021). The Role of Eyewall Turbulent Transport in the Pathway to Intensification of Tropical Cyclones. Geophys. Res. Atmos. 126, e2021JD034983. doi:10.1029/2021JD034983
Keywords: tropical cyclone eyewall, turbulent kinetic energy, large-eddy simulation, horizontal rolls, sub-grid-scale eddy
Citation: Gao Z, Wu L and Zhou X (2022) Fine-Scale Structures in the Mid-Level Eyewall of Super Typhoon Rammasun (2014) Simulated With the WRF-LES Framework. Front. Earth Sci. 9:814785. doi: 10.3389/feart.2021.814785
Received: 14 November 2021; Accepted: 23 December 2021;
Published: 12 January 2022.
Edited by:
Qingqing Li, Nanjing University of Information Science and Technology, ChinaReviewed by:
Xin Qiu, Nanjing University, ChinaHehe Ren, Nanjing University of Aeronautics and Astronautics, China
Copyright © 2022 Gao, Wu and Zhou. This is an open-access article distributed under the terms of the Creative Commons Attribution License (CC BY). The use, distribution or reproduction in other forums is permitted, provided the original author(s) and the copyright owner(s) are credited and that the original publication in this journal is cited, in accordance with accepted academic practice. No use, distribution or reproduction is permitted which does not comply with these terms.
*Correspondence: Liguang Wu, bGlndWFuZ3d1QGZ1ZGFuLmVkdS5jbg==