 Dengpan Xiao
 Yi Zhang
 Huizi Bai
- Engineering Technology Research Center, Geographic Information Development and Application of Hebei, Institute of Geographical Sciences, Hebei Academy of Sciences, Shijiazhuang, China
Crop phenology is the process of crop growth and yield formation, which is largely driven by climatic conditions. It is vital to investigate the shifts in crop phenological processes in response to climate variability. Previous studies often only explored the response of a single crop phenology to climate change, and lacked comparative studies on the climate response in different crop phenology. We intend to investigate the trends in phenological change of three typical crops (i.e., maize, rice and soybean) in Northeast China (NEC) and their response to climate change during 1981–2010. Its main purpose is to reveal the differences in the sensitivity of different crop phenology to key climate factors [e.g., mean temperature (T), accumulated precipitation (AP) and accumulated sunshine hours (AS) during the crop growth period]. We found that the three crops have different phenological changes and varying ranges, and significant spatial heterogeneity in phenological changes. The results indicated that the lengths of different crop growth stages [e.g., the vegetative growth period (VGP), the reproductive growth period (RGP) and the whole growth period (WGP)] were negatively correlated with T, especially in VGP and WGP. However, the lengths of growth period of the three crops were positively correlated with AP and AS. For each 1°C increase in T, the number of days shortened in WGP (about 5 days) was the largest, and that in RGP (less than 2 days) was the smallest. Therefore, the increases in T during past 3 decades have significantly shortened VGP and WGP of three crops, but had slight and inconsistent effects on RGP. Moreover, changes in AP has slight impact on the growth periods of maize and rice, and significantly shortened RGP and WGP of soybean. Changes in AS exerted important and inconsistent effects on the phenology of three crops. This study indicated that there are significant differences in the sensitivity and response of different crop phenology to climate factors. Therefore, in evaluating the response and adaptation of crops to climate change, comparison and comprehensive analysis of multiple crops are helpful to deeply understand the impact of climate change on crop production.
Introduction
The Sixth Assessment Report (AR6) of the Intergovernmental Panel on Climate Change (IPCC) states that multi-decadal global warming is unequivocal (IPCC, 2021). Plant phenology, generally defined as the phasic process of plant cycle or timeline activities of plants (Lieth, 1974; Visser and Both, 2005), is strongly controlled by short- and long-term variability in weather and climate (Menzel et al., 2006; Tao et al., 2014a; Shen et al., 2018). Generally, crop phenology determines the timing and duration of critical periods for growth, which in turn can greatly affect the harvestable yield and food quality (Porter and Semenov, 2005). A warmer climate inevitably leads to shift in crop phenology, which ultimately determinate crop yields (Estrella et al., 2007; Tao et al., 2013; Xiao et al., 2017; Zhao et al., 2019). Quantitatively assessing the shift in crop phenology caused by climate change can help agricultural stakeholders to formulate effective climate change adaptation strategies (Mo et al., 2016; Abendroth et al., 2021). Therefore, the effects of climate change on crop phenology are a major concern for agricultural production (Wang et al., 2013; Xiao et al., 2013; Tao et al., 2014b; Bai et al., 2019).
The impacts of climate variability and/or climate change on crop phenology have been studied by numerous researchers in China for various crops, such as maize (Tao et al., 2014a; Xiao et al., 2016; Xiao et al., 2019; Liu et al., 2021), rice (Tao et al., 2013; Wang et al., 2017a; Bai et al., 2019; Ye et al., 2019; Bai and Xiao, 2020), wheat (Wang et al., 2013; He et al., 2015; Xiao et al., 2015; Xiao et al., 2017), soybean (He et al., 2020; Gong et al., 2021), and cotton (Wang et al., 2017b; Li et al., 2021a). As climate warming accelerates the crop growth and shortens the growing period (Tao et al., 2014a; Xiao et al., 2015), previous related studies have mainly focused on the effects of increasing temperature on crop phenology (Estrella et al., 2007; Zhang et al., 2013). To some extent, changes in precipitation and/or sunshine hours also play certain roles in determining the process of crop growth (Bai and Xiao, 2020; He et al., 2020; Liu et al., 2021). In general, drought due to decreased precipitation results in a large threat to crop growth and development (Li et al., 2021b). Additionally, due to the significant differences in the sensitivity of the growth processes of different crops to climate change (Estrella et al., 2007), the phenological responses of different crops to climate change vary greatly (Mo et al., 2016; Wu et al., 2019). According to previous studies, under the background of climate change in the past few decades, the whole growth period of wheat in China has mainly been shortened (Xiao et al., 2015), while the growth period of maize and rice has been mainly extended (Tao et al., 2014a; Wang et al., 2017a). However, related studies often only explored the response of a single crop phenology to climate change (Zhang et al., 2014; Tao et al., 2014a; Tao et al., 2014b; Xiao et al., 2015; Xiao et al., 2019), and lacked comparative studies on the climate response in the phenology of different crops under the same or similar climate background (Wu et al., 2019). Therefore, investigating and comparing the processes and mechanisms of response and adaptation of various crop to agro-meteorological stressors and ongoing climate change is helpful to propose corresponding field management measures for different crops (Porter and Semenov, 2005; Tao et al., 2014a).
The Northeast China (NEC) located in high-latitude area and is likely to be significantly affected by ongoing climate change (Liu et al., 2013; Liu et al., 2018). This good climate and the excellent soil quality make NEC become an important crop production area in the country (Zhao et al., 2015; Liu et al., 2018). However, during the period of 1961–2007, annual average temperature in NEC has increased by 0.38°C per decade, but annual precipitation and sunshine duration have decreased by 9 mm per decade and 42 h per decade, respectively (Liu et al., 2020). In NEC, maize, rice and soybean were the three most important crops, and the planting areas of maize, rice and soybean in 2015 were 1.42 × 10⁷ (51.1%), 5.82 × 10⁶ (20.9%) and 3.75 × 10⁶ ha (13.5%), respectively (Yan et al., 2020). Due to climate change, the phenology of maize (Li et al., 2014), rice (Gao et al., 2018) and soybean (Gong et al., 2021) in NEC have all undergone significant changes, but there is still a lack of comparative studies on the phenology of the three crops in response to climate change (Li et al., 2011; Zhao et al., 2015). In order to deeply understand the processes and mechanisms controlling various crop responses to ongoing climate change, it is important to investigate phenology shifts of main crops in NEC in response to climate change over the past few decades.
In the present study, the effects of climate change on the phenology of three crops (e.g., maize, rice and soybean) in NEC were assessed based on detailed phenological records from experiment stations and historical meteorological data during 1981–2010. Its main purpose is 1) to investigate the phenological shifts of three crops over the past 3 decades, 2) to determine the differences in the sensitivity of different crop phenology to main climate factors (e.g., temperature, precipitation and sunshine hours), and 3) to quantify the contributions of various climate factors to the phenology of the three crops. The results of this study, especially the quantitative absolute contribution of key climate factors to the phenology of three different crops, will help to better understand the impact of climate change on crop phenology, and can further guide the formulation of adaptation options for crop production in future.
Materials and Methods
Study Area
This study area is located in NEC, which includes Liaoning, Jilin and Heilongjiang Province (Figure 1), with 2.78 × 10⁷ ha of farmland. The region has a temperate monsoon climate, with an annual accumulated temperature above zero of 2,500–4,000°C day and an annual precipitation of 400–1,000 mm (Chen et al., 2011). In this region, maize, rice and soybean are the main food and economic crops, and the growing seasons are usually from May to September.
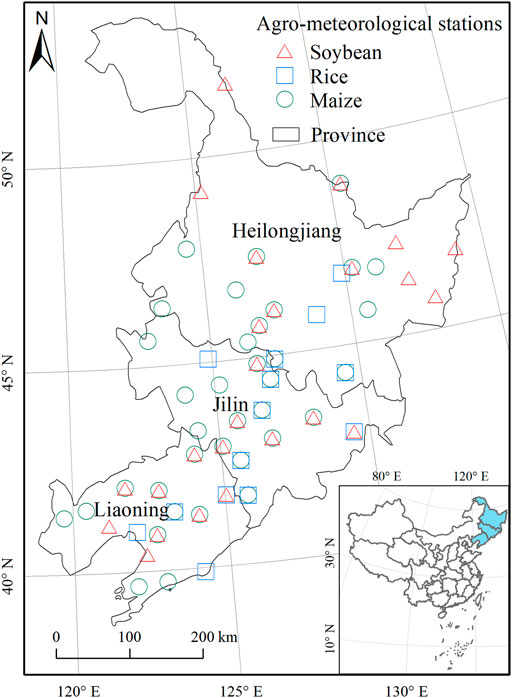
FIGURE 1. A map depicting the geographical location of the study area (bottom right inset) and the locations of the agro-meteorological stations used in the study (main map).
Crop Phenology and Climate Data
The long-term phenology records of maize, rice and soybean in NEC from 1981 to 2010 were respectively obtained from 36, 14 and 25 agro-meteorological stations managed by the China Meteorological Administration (CMA) (Figure 1, Supplementary Table S1). Since some agro-meteorological stations have the phenological data for two crops, there were a total of 51 different agro-meteorological stations in this study (Figure 1). The phenological stages of the three crops (e.g., maize, rice and soybean) investigated in this study include sowing date (SD), flowering date (FD) and maturity date (MD). In order to analyze the response of different growth stages of crops to climate change, we divided the whole growth period of crops from sowing to maturity (WGP) into two phases, namely the vegetative growth period from sowing to flowering (VGP) and the reproductive growth period from flowering to maturity (RGP). The average observed date of phenological stages and the average length of growth periods for the three crops in each station were shown in Supplementary Table S2. In addition, daily weather data including temperature, sunshine hours and precipitation for 1981–2010 were from a total of 90 ground-based meteorological stations across NEC. Of the 90 meteorological stations, 43 were in the agro-meteorological stations. This implied that there were no nearby weather stations in 8 of the investigated agro-meteorological stations. For the 8 stations, daily weather data were estimated using the Thornton et al. (1997) method. The method was used to interpolate data from the 90 weather stations to the nearest 10-km resolution. Using this method, daily weather data was derived for each agro-meteorological experimental station for the period 1981–2010 (Xiao et al., 2015).
Methods
The mean dates of sowing, flowering and maturity of maize, rice and soybean for the period of 1981–2010 were calculated for each station. Generally, temperature, precipitation and sunshine hours are the most important climate factors affecting crop growth and development. The average of the field-observed mean temperature (T), accumulated precipitation (AP) and accumulated sunshine hours (AS) for the three growth phases (i.e., VGP, RGP and WGP) were also calculated based on the observed sowing, flowering and maturity dates at each station. By using regression analysis, the trends in the phenological stages (e.g., SD, FD and MD) of three crops, the duration of the growth periods (e.g., VGP, RGP and WGP), and climate factors (e.g., T, AP and AS) were calculated for each station for the period 1981–2010. The time-variant trends of above variables were determined by using the univariate linear regression model as:
where Yi is the observed phenological date/duration, and climate factors (T, AS and AP) in year i; k is the linear regression slope; b is the slope intercept; and Xi is year i (i = 1, 2, 3, … 30). The Durbin-Watson statistic was conducted to test the null hypothesis that the residuals from an ordinary least-squares regression are not auto-correlated. Statistical significance was tested using the two-tailed t-test (Tao et al., 2017).
To investigate the impact of climate change on crop phenology in NEC, the correlations between climate factors and crop phenology were analyzed. Bivariate correlation analysis was performed to determine the correlations between the duration of each of the three growth phases (VGP, RGP and WGP) and corresponding climate factors (T, AS and AP). Moreover, to explored the impact of SD on crop phenology, the correlations between crop growth phases and SD were also been investigated. The statistical significance of the results was also determined with two-tailed t-test analysis.
The sensitivity of the lengths of three growth phases (i.e., VGP, RGP and WGP) of maize, rice and soybean to three climatic factors (i.e., T, AP, and AS) during the period of 1981–2010 was calculated respectively using multiple linear regression model (Bai and Xiao, 2020) as follows:
where GDnt (day) is the observed duration of three growth phases in the nth station of the tth year; Tnt (°C), APnt (mm), and ASnt (h) are the mean temperature (T), accumulated precipitation (AP), and accumulated sunshine hours (AS) during corresponding growth phase in the nth station of the tth year, respectively; then an (day °C−1), bn (day 100mm−1), and cn (day 100 h−1) are the sensitivity of duration of three growth phases to T, AP, and AS in the nth station, respectively; and d is a constant.
The contributions of various climate variables to the crop phenology were calculated as follow:
where Con is the contribution of three climate factors (e.g., Con_T, Con_AP and Con_AS); Sen is the sensitivity of duration of crop growth phases to climate factors (i.e., an, bn and cn in Eq. 2); Tre is the trends of climate factors (T, AS and AP) during the past 3 decades; then 3 indicates 3 decades from 1981 to 2010.
Results
Changes in Crop Phenology and the Growth Duration in the NEC
The study showed that the phenological stages of three crops changed significantly during 1981–2010 (Supplementary Table S3). For maize, SD (58.3% of stations), FD (52.8% of stations) and MD (86.1% of stations) generally delayed in most stations (Figure 2a1, a2, a3). Changes in crop phenology would inevitably led to changes in the length of different growth phases. The VGP of maize showed a shortening trend in most stations (Figure 3 a1), while the RGP and WGP mainly showed a prolonged trend (Figure 3, a2, a3). In addition, maize phenology and growth periods in different provinces showed different trends (Figure 4A). The SD of maize was mainly advanced in Heilongjiang Province, while it was delayed in Liaoning and Jilin Provinces (Figure 4A). The changes in FD of maize were relatively small, while the MD showed a significant delay trend in the three provinces (Figure 4A). The VGP of maize showed a prolonged trend in Heilongjiang Province, but a shortened trend in Jilin and Liaoning Province. The RGP and WGP showed significant prolongation trends in the three provinces (Figure 4A).
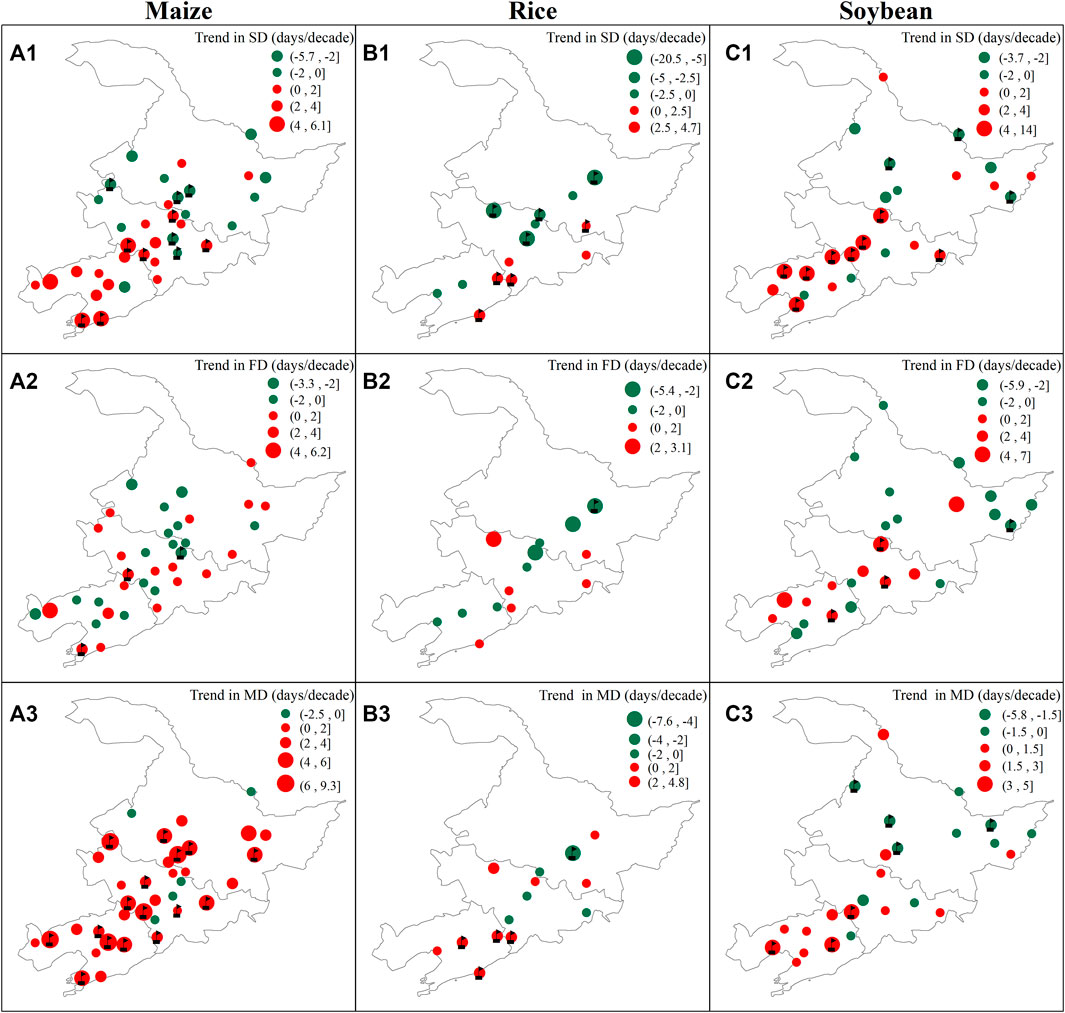
FIGURE 2. Trends in sowing date (A1–C1), flowering date (A2–C2) and maturity date (A3–C3) of maize (A1–A3), rice (B1–B3) and soybean (C1–C3) in Northeast China for 1981–2010. Flags shows trend is significant at 5% probability level.

FIGURE 3. Trends in the length of the vegetative period from sowing to flowering (VGP) (A1–C1), the reproductive period from flowering to maturity (RGP) (A2–C2) and whole growth period from sowing to maturity (WGP) (A3–C3) for maize (A1–A3), rice (B1–B3) and soybean (C1–C3) in Northeast China for 1981–2010. Flags shows trend is significant at 5% probability level.
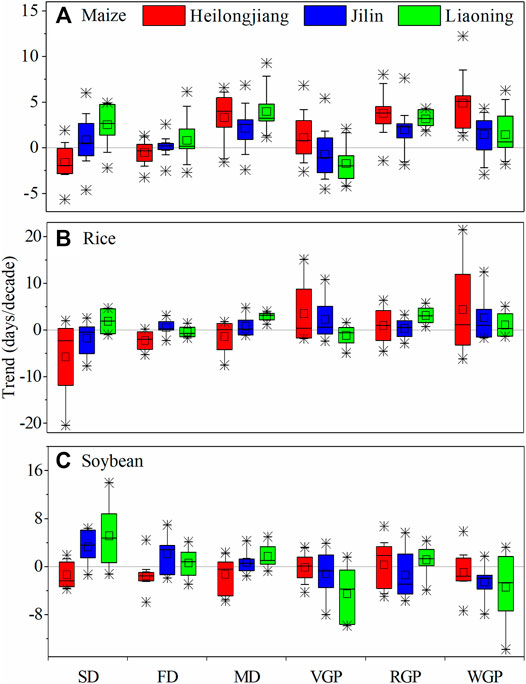
FIGURE 4. Trends in phenology of maize (A), rice (B) and soybean (C) in the Northeast China for 1981–2010. Note that SD, FD and MD are sowing date, flowering date and maturity date, respectively; VGP, RGP and WGP are vegetative period from sowing to flowering, reproductive period from flowering to maturity and whole growth period from sowing to maturity, respectively.
For rice, phenological changes were more complicated, and the trends at different stations were very different. About half of the stations (mainly concentrated in the north) showed a trend of advancement in the SD of rice (Figure 2 b1). The FD of rice at 8 of the 14 stations showed an earlier trend, while the MD of rice at 9 stations among the 14 stations showed a trend of delay (Figure 2 b2, b3). The VGP of rice shortened at 8 stations, and two stations reached a significant level (p < 0.05); the other 6 stations prolonged and three stations reached a significant level (p < 0.05) (Figure 3 b1). RGP of rice at most stations (10 stations) showed a prolonged trend, and the WGP of rice at half of the stations showed a prolonged trends, with 5 stations reaching a significant level (p < 0.05) (Figure 3 b2, b3). Overall, SD, FD and MD of rice mainly showed the trends in advance in Heilongjiang Province, but mainly showed a postponement trend in Liaoning Province, and the change in Jilin Province was relatively small (Figure 4B). The VGP of rice in Liaoning and Jilin provinces showed a prolonged trend, while the RGP of rice in Heilongjiang Province showed a prolonged trend, and the WGP had a certain degree of prolonged trend in the all three provinces (Figure 4B).
For soybean, the SD mainly showed an earlier trend in Heilongjiang Province, while it mainly showed a postponement trend in Liaoning and Jilin Provinces (Figure 2 c1). Similar to the SD, the FD and MD of soybean showed an earlier trend in Heilongjiang Province, but mainly postponed in Liaoning and Jilin (Figure 2 c2, c3). The different growth periods of soybean show obvious spatial characteristics. The VGP of soybean mainly shortened in Liaoning Province, but prolonged in Heilongjiang (Figure 3 c1, Figure 4C). Moreover, the RGP of soybean is mainly prolonged in Liaoning (Figure 3 c2, Figure 4C). The WGP of soybean mainly showed a shortening trend in 3 provinces (Figure 3 c3, Figure 4C).
Climate Trends in Different Crop Growth Periods in the NEC During 1981–2010
The stations, located in various geographical and climate zones, showed diverse climate condition (Supplementary Figures S1–S3) and climatic trends (Supplementary Figures S5–S7) in different growth periods of three crops (i.e., maize, rice and soybean). Overall, the T and AP during the crop growth periods across the three provinces were very different (Supplementary Figure S4). The T during the growth period of the three crops in Liaoning Province was significantly higher than that in Jilin and Liaoning Provinces (Supplementary Figures S4a1–c1). The difference in AS during the growth period of crops in the three provinces is relatively small (Supplementary Figures S4a3–c3). As shown in Figure 5, warming trends were observed over three growth periods (i.e., VGP, RGP and WGP) of three crops (i.e., maize, rice and soybean) during 1981–2010, except for the RGP of maize in Liaoning Province. On the contrary, the AP during the growth period of crops in the three provinces mainly showed decreasing trends during the 1981–2010, except for VGP of soybean in Jilin Province (Figure 5 a2, b2). The AS during the growth period of three crops mainly increased in Heilongjiang and Jilin provinces. In Liaoning Province, the AS during RGP of three crops increased, while that during the VGP and WGP showed decreasing trends during the 1981–2010 (Figure 5 a3, b3).
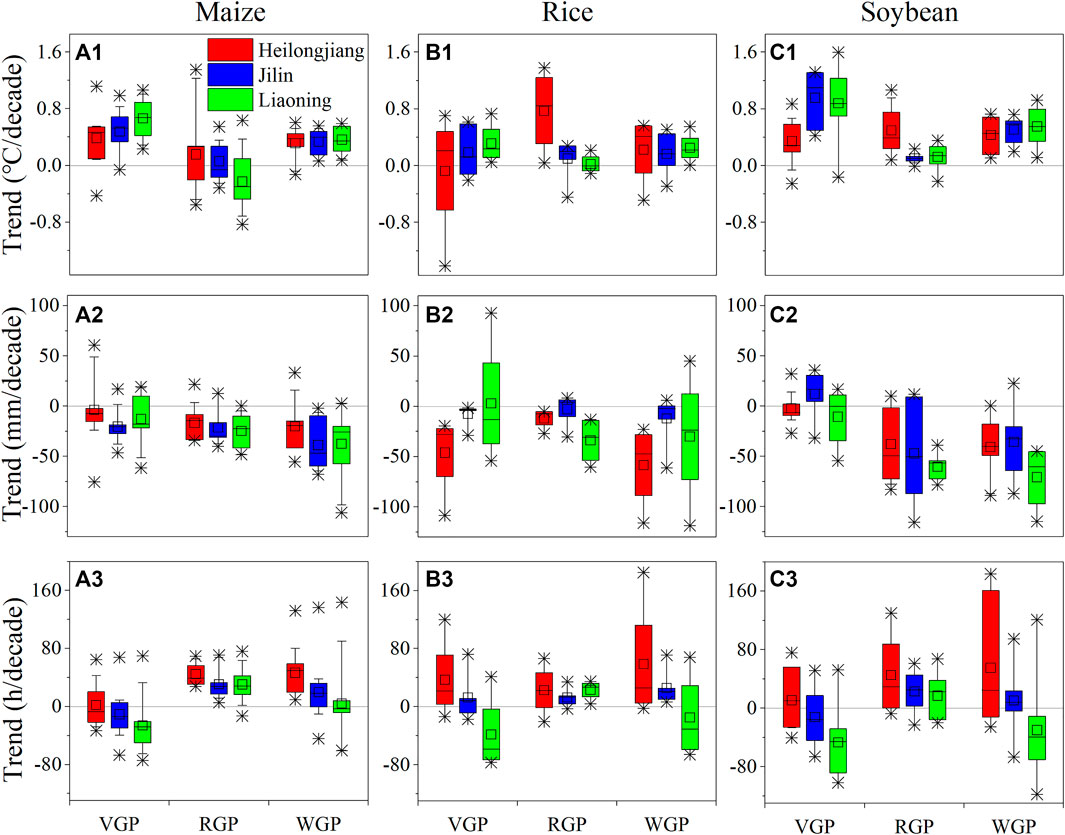
FIGURE 5. Trends in mean temperature (A1–C1), accumulated precipitation (A2–C2) and accumulated sunshine hours (A3–C3) during the vegetative period from sowing to flowering (VGP), the reproduction period from flowering to maturity (RGP) and whole growth period from sowing to maturity (WGP) for maize (A1–A3), rice (B1–B3) and soybean (C1–C3).
Correlation Between the Crop Growth Duration and Different Climate Variables in Each Growth Stage
Overall, the lengths of different crop growth phases (i.e., VGP, RGP and WGP) were mainly negatively correlated with the T during the corresponding growth period, especially in the VGP and WGP (Figure 6). Although the RGP lengths of rice and soybean at some sites were negatively correlated with T, most of them did not reach the significant level (p > 0.05) (Figure 6 b2, c2). In contrast, the lengths of VGP, RGP and WGP for the three crops at most stations were positively correlated with AP (Supplementary Figure S8) and AS (Supplementary Figure S9). Since changes in the sowing date (SD) will change the climatic conditions of the crop growth process, we also investigated the correlation between the length of the crop growth phases and SD. Across all the stations in NEC, the lengths of VGP and WGP for maize, rice and soybean were negatively correlated with SD (Supplementary Figure S10). However, the correlations between the lengths of RGP and SD were inconsistent and insignificant at most stations (p > 0.05) (Supplementary Figure S10). Overall, SD shift of crop mainly affected duration of VGP and WGP, but had little impact on duration of RGP.
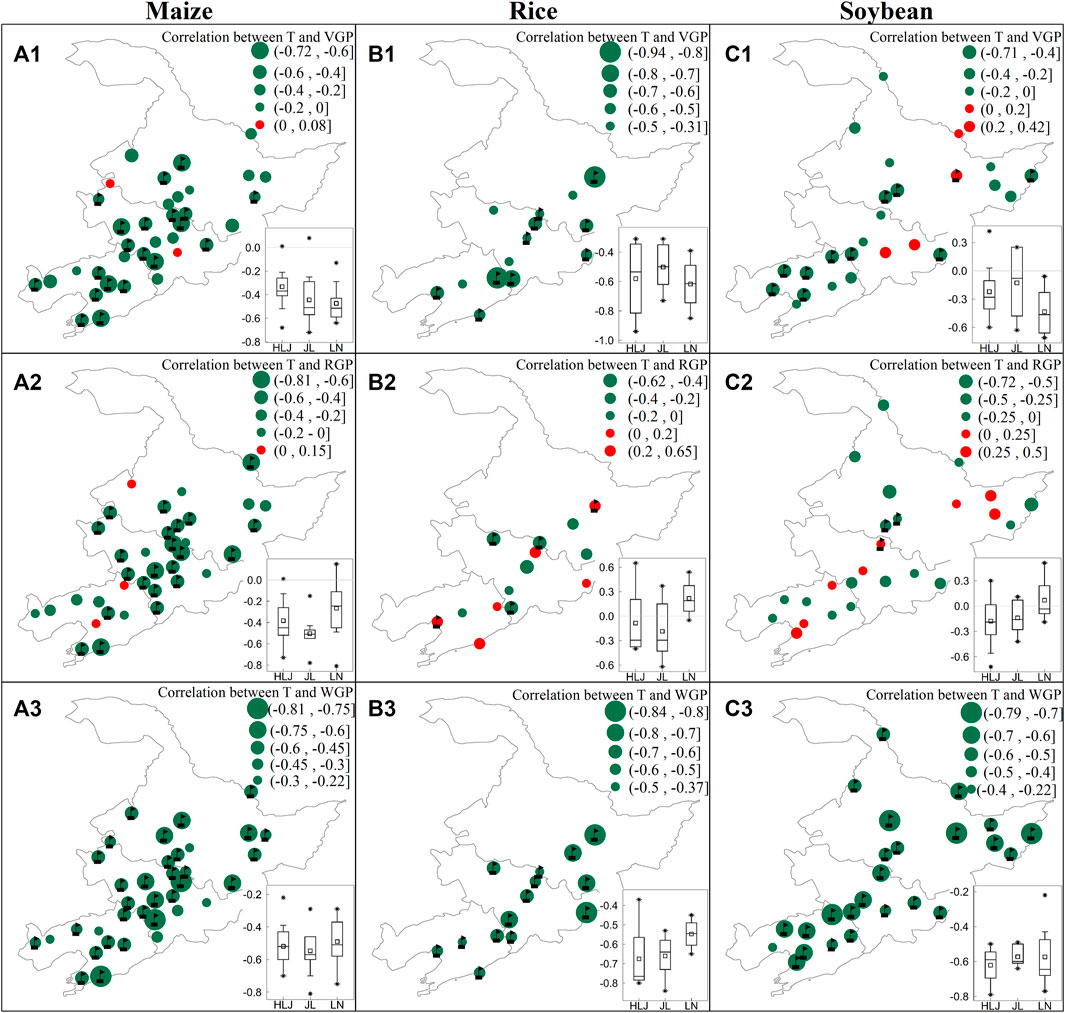
FIGURE 6. Correlation between mean temperature (T) and the length of the vegetative period from sowing to flowering (VGP) (A1–C1), the reproductive period from flowering to maturity (RGP) (A2–C2) and whole growth period from sowing to maturity (WGP) (A3–C3) for maize (A1–A3), rice (B1–B3) and soybean (C1–C3). HLJ, JL and LN are the Heilongjiang, Jilin and Liaoning Province, respectively.
Sensitivity of the Crop Growth Duration to Different Climate Variables in Each Growth Stage
The increase in T during the growth periods of the three crops mainly led to the shortening of the growth periods, except for the RGP in Liaoning Province. In general, for each 1°C increase in T during the crop growth periods, the number of days shortened in WGP is the largest (about 5 days), and that in RGP is the smallest (less than 2 days) (Figure 7 a1, b1, c1). However, the increase in AP and AS during the growth periods of the three crops have prolonged the length of crop growth periods (e.g., VGP, RGP and WGP). Among them, the impacts of increased AP on the growth periods of soybean was far greater than that on maize and rice (Figure 7 a2, b2, c2). In addition, the increase in AS has a significant effect on prolonging the growth periods of the three crops. For all the growth periods of maize and soybean, as well as the RGP of rice, the length of growth periods prolonged by more than 3 days for every 100 h increase in AS (Figure 7 a3, b3, c3).
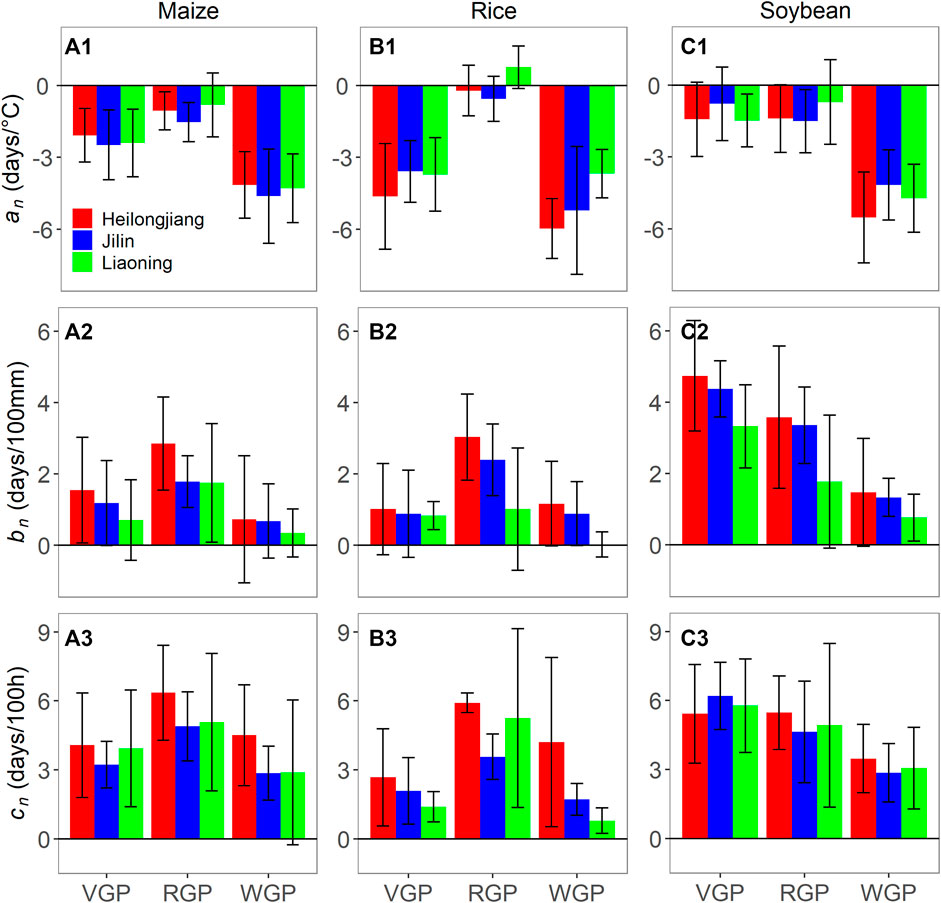
FIGURE 7. The sensitivity of the length of the vegetative period from sowing to flowering (VGP), the reproductive period from flowering to maturity (RGP) and whole growth period from sowing to maturity (WGP) of maize (A1–A3), rice (B1–B3) and soybean (C1–C3) to mean temperature (an) (A1–C1), accumulated precipitation (bn) (A2–C2) and accumulated sunshine hours (cn) (A3–C3).
Changes in the Crop Growth Duration due to Climate Trends During the Period of 1981–2010
Over the past 3 decades, the changes in T during crop growth periods have significantly shortened the VGP and WGP of three crops, except for the VGP of rice in Heilongjiang Province. On average, the increases in T shortened the WGP of maize, rice and soybean by about 3, 2 and 7 days, respectively (Figure 8 a1, b1, c1). However, the T changes during the crop growth periods have slight and inconsistent effects on the RGP of crops. Generally, the change in T mainly shortened the RGP of soybean by about 1 day on average (Figure 8 c1). The changes in AP during the crop growth periods in the past 3 decades has slight impact on the length of growth periods of maize and rice, but significantly shortened the RGP and WGP of soybean (Figure 8 a2, b2, c2). In addition, the AS changes over the past 3 decades had important impacts on the crop growth periods (Figure 8 a3, b3, c3). The changes in AS during maize growth periods prolonged the RGP and WGP by about 5 and 2 days, respectively (Figure 8 a3). The changes in AS during rice growth periods mainly prolong the length of the growth periods of rice, among which the VGP, RGP and WGP of rice in Heilongjiang Province were prolonged by 5, 4 and 13 days, respectively (Figure 8 b3). For soybean, the changes in AS significantly prolonged the RGP and WGP of soybean in Heilongjiang Province, but significantly shortened the VGP and WGP of soybean in Liaoning Province (Figure 8 c3).
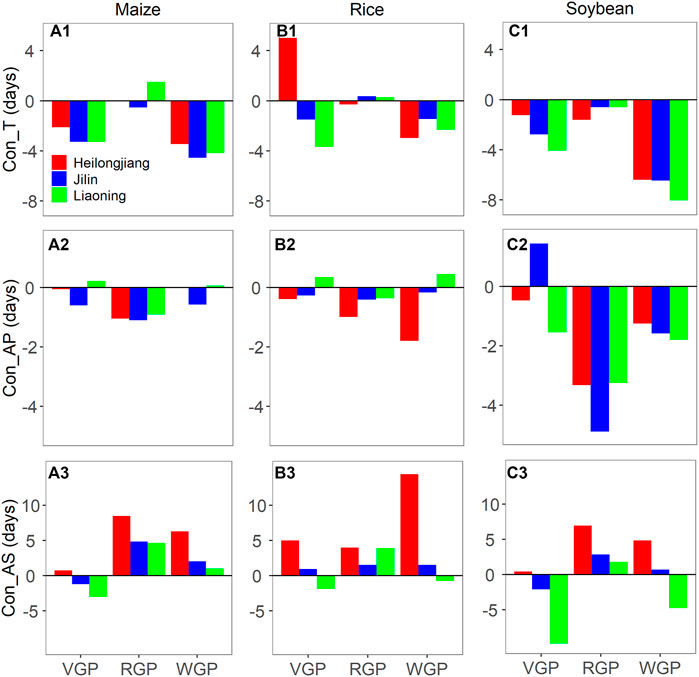
FIGURE 8. Contributions of mean temperature (Con_T) (A1–C1), accumulated precipitation (Con_AP) (A2–C2) and accumulated sunshine hours (Con_AS) (A3–C3) to the length of the vegetative period from sowing to flowering (VGP), the reproductive period from flowering to maturity (RGP) and whole growth period from sowing to maturity (WGP) for maize (A1–A3), rice (B1–B3) and soybean (C1–C3).
Discussion
In this present study, shifts in phenology of spring-sown maize, rice and soybean were investigated based on the phenological observations across NEC. In general, the phenological dates and growth phases of three crops experienced significant changes during the period of 1981–2010. As the growth and development process of different crops have different requirements for climatic conditions, there are significant differences in the response of different crop phenology to climate change (Menzel et al., 2006; Mo et al., 2016). In the NEC, the three typical crops (i.e., maize, rice and soybean) have different phenological changes and varying ranges during the past 3 decades. For example, the MD of maize was significantly delayed and RGP was considerably prolonged, but the MD and RGP of rice and soybean has slight changes. In addition, there was significant spatial heterogeneity in phenological changes of three crops (Li et al., 2011). The SD of the three crops in Heilongjiang Province was significantly advanced, while that in Liaoning Province was mainly delayed. As a result, the FD and MD of rice and soybean mainly advanced in Heilongjiang Province, but mainly delayed in Liaoning Province. To some extent, along with climate change, the adjustment of SD could change the climatic environment during the period of crop growth, and would further exert important impacts on the subsequent phenological stages of crops (Xiao et al., 2019).
The changes of crop phenology were closely related to regional climate variability and change (Xiao et al., 2015; Wu et al., 2019; Liu et al., 2021). Generally, climate factors such as temperature, precipitation and sunshine hours are the important determinants of crop growth and development (Bai and Xiao, 2020). During the past few decades, the climate change during the growth period of three crops across the NEC was mainly manifested in the increase in temperature and sunshine hours, and the decrease in precipitation (Li et al., 2011; Liu et al., 2013; Gong et al., 2021). Clarifying how these climate variables influence crop phenology is of paramount importance in understanding and implementing adaptation strategies to climate change (Tao et al., 2013; Bai et al., 2019; Liu et al., 2021). In this study, we diagnosed the correlation between the length of the phenological period and climatic factors. The results indicated that the lengths of different crop growth phases (e.g., VGP, RGP and WGP) were negatively correlated with the mean temperature (T) during the corresponding growth period, especially in the VGP and WGP. This suggests that a temperature rise mainly shortened the duration of growth periods of three crops in NEC (Li et al., 2011). The main reason is that crops mainly use accumulated temperature to drive the occurrence and development of each growth period. An increase in temperature within a certain range can obviously make various growth stages of crops reach the accumulated temperature demand in advance, and ultimately advance the growth period (Porter and Semenov, 2005). In contrast, the lengths of growth period of the three crops at most stations were positively correlated with accumulated precipitation (AP) and accumulated sunshine hours (AS) during the corresponding growth period. The main reason is that low precipitation may increase the occurrence of drought events, leading to early senescence of crop leaves and earlier phenology (Blum, 1996; Li et al., 2021), and sunshine hours have an important influence on the photoperiod of crops (Zhang and Tao, 2013). Furthermore, we investigated the correlations between the lengths of crop growth period and SD. Overall, SD shift of crop mainly affected the duration of VGP and WGP, but had little impact on the duration of RGP. Related studies also pointed out that the adjustment of SD mainly changes the VGP of crops, but has little effect on the RGP (Bai et al., 2019; Xiao et al., 2019).
We further detected the sensitivity of crop phenology in NEC to climate change and identified the dominant climate factors. This study showed that for each 1°C increase in T during the growth period of crops, the number of days shortened in WGP (about 5 days) was the largest, and that in RGP (less than 2 days) was the smallest. The results indicate that although the increase in temperature significantly shortened the total growth length of the crops, it had a smaller effect on the RGP, which is generally the key stage for the formation of crop yields (Xiao and Tao, 2014; Tao et al., 2017). The increases in AP and AS during the growth period of the three crops have prolonged the length of crop growth periods. Among them, the impacts of increased AP on the growth period of soybean was far greater than that on maize and rice. Moreover, the increase in AS has a significant effect on prolonging the growth period of the three crops. Overall, the length of crop growth period prolonged by more than 3 days for every 100 h increase in AS. Related research also pointed out that AS have a significant positive effects on the phenology of rice (Bai and Xiao, 2020) and maize (Liu et al., 2021).
The quantitative impact assessment of various climatic factors on crop phenology is essential for informing policies for adaptation strategies (Bai and Xiao, 2020). In order to quantitatively evaluate the impact of climate change on the phenology of different crops during the past 3 decades in NEC, we have disentangled the contributions of three climatic variables (i.e., T, AP and AS) on the trends of crop phenology. Overall, there were distinct responses of various phenophase shifts to climate change. Over the past 3 decades, the increases in T during crop growth period have significantly shortened the VGP and WGP of three crops. However, the T changes during the crop growth period have slight and inconsistent effects on the RGP of crops. The changes in AP during the crop growth period in the past 3 decades has slight impact on the length of growth period of maize and rice, but significantly shortened the RGP and WGP of soybean. In addition, changes in AS have important and inconsistent effects on the phenology of the three crops. In detailed, the increases in AS during maize growth period prolonged the RGP and WGP, and that during rice growth period mainly prolong the length of the growth period of rice, among which the VGP, RGP and WGP of rice in Heilongjiang Province were prolonged by 5, 4 and 13 days, respectively. For soybean, the changes in AS significantly prolonged the RGP and WGP of soybean in Heilongjiang Province, but significantly shortened the VGP and WGP of soybean in Liaoning Province. The above results show that in addition to changes in T during the growth period have an important impact on crop phenology, AP and AS also have a greater impacts on crop phenology (He et al., 2020; Liu et al., 2021). The previous studies often only considered the impact of climate warming on crop phenology, and ignored the impact of AP and AS on crop phenology (Wang et al., 2013; Xiao et al., 2015; Zhao et al., 2015; Mo et al., 2016; Xiao et al., 2017; Ye et al., 2019). Therefore, in the future, we should fully consider the impact of different climate variables on crop phenology in order to more clearly understand the impact mechanism of climate change on crop phenology (Bai and Xiao, 2020).
Although climate variables are the main driving factors that determine crop growth and development (Estrella et al., 2007; Xiao et al., 2013), we can mitigate and adapt to climate change by improving agronomic practices (Mo et al., 2016; Zhao et al., 2019). Generally, crop phenology is affected by climate environment and agronomic management measures such as sowing date adjustment and cultivar improvement (Zhao et al., 2015). To some extent, adopting reasonable management measures is an effective way to deal with climate change (Wang et al., 2013; He et al., 2020). Related studies pointed out that delaying sowing dates and applying the longer-duration cultivar were management adaptations used by farmers to adapt to climate change occurring in the past few decades, and that can continue to be used (Wang et al., 2013; Tao et al., 2014a; Zhao et al., 2015; Wang et al., 2017a; Xiao et al., 2017; Xiao et al., 2019; Ye et al., 2019). With the climate warming, the potential growing season has lengthened, and the risk of low-temperature freezes and frost injury has decreased in NEC (Gong et al., 2021). Local crop producers could choose longer growing season crop cultivars to take advantage of the increasing temperatures, as a longer crop growing season would make the efficient use of thermal resources (Wang et al., 2017a). Therefore, shift in crop phenology were confounded by the combined effects of climate change and agronomic management adjustment (Zhang et al., 2013; Tao et al., 2014a; Liu et al., 2021). In this study, we mainly explored the internal relationships between the phenology of different crops and key climate factors in the NEC, and the results could provided scientific basis for a better understanding of the response of crop production to climate change in the study area. Moreover, since in-depth exploration the interactive effects of climate change and crop management practices on crop phenology can be used to formulate adaptation strategies to mitigate climate change (Visser and Both, 2005), further research is needed to determine the contribution of agronomic practices to the phenological changes of different crop across NEC.
Conclusion
This study investigated the phenological trends of three typical crops in NEC during the period of 1981–2010, and explored the contributions of key climatic factors to crop phenological changes. Overall, the three crops (i.e., maize, rice and soybean) have different phenological changes and varying ranges during the past 3 decades. Moreover, the changes of crop phenology were closely related to regional climate variability and change. Our results indicated that the lengths of different crop growth phases (e.g., VGP, RGP and WGP) were negatively correlated with T during the corresponding growth period. However, the lengths of growth periods of the three crops at most stations were positively correlated with AP and AS. Furthermore, over the past 3 decades, the increases in T during crop growth period have significantly shortened the VGP and WGP of three crops. However, the T changes during the crop growth period have slight and inconsistent effects on the RGP of crops. The changes in AP during the crop growth period has slight impacts on the length of growth period of maize and rice, but significantly shortened the RGP and WGP of soybean. Changes in AS have important and inconsistent effects on the phenology of the three crops. Our results suggest that crop phenology in NEC was significantly effected by ongoing climate change. The spatiotemporal changes of crop phenology presented here can further guide the development of adaptation options for maize production in near future.
Data Availability Statement
The original contributions presented in the study are included in the article/Supplementary Material, further inquiries can be directed to the corresponding author.
Author Contributions
DX carried out the study design. YZ carried out the data collection, calculation and interpretation. DX wrote the original draft. HB and JT also gave critical revision of the manuscript. All authors contributed to the article and approved the final manuscript.
Funding
This work was supported by the National Natural Science Foundation of China (No. 41901128).
Conflict of Interest
The authors declare that the research was conducted in the absence of any commercial or financial relationships that could be construed as a potential conflict of interest.
Publisher’s Note
All claims expressed in this article are solely those of the authors and do not necessarily represent those of their affiliated organizations, or those of the publisher, the editors and the reviewers. Any product that may be evaluated in this article, or claim that may be made by its manufacturer, is not guaranteed or endorsed by the publisher.
Supplementary Material
The Supplementary Material for this article can be found online at: https://www.frontiersin.org/articles/10.3389/feart.2021.811621/full#supplementary-material
References
Abendroth, L. J., Miguez, F. E., Castellano, M. J., Carter, P. R., Messina, C. D., Dixon, P. M., et al. (2021). Lengthening of maize Maturity Time Is Not a Widespread Climate Change Adaptation Strategy in the US Midwest. Glob. Change Biol. 27, 2426–2440. doi:10.1111/gcb.15565
Bai, H., and Xiao, D. (2020). Spatiotemporal Changes of Rice Phenology in China during 1981-2010. Theor. Appl. Climatol. 140, 1483–1494. doi:10.1007/s00704-020-03182-8
Bai, H., Xiao, D., Zhang, H., Tao, F., and Hu, Y. (2019). Impact of Warming Climate, Sowing Date, and Cultivar Shift on Rice Phenology Across China during 1981-2010. Int. J. Biometeorol. 63, 1077–1089. doi:10.1007/s00484-019-01723-z
Blum, A. (1996). Crop Responses to Drought and the Interpretation of Adaptation. Plant Growth Regul. 20, 135–148. doi:10.1007/bf00024010
Chen, C., Lei, C., Deng, A., Qian, C., Hoogmoed, W., and Zhang, W. (2011). Will Higher Minimum Temperatures Increase Corn Production in Northeast China? An Analysis of Historical Data over 1965-2008. Agric. For. Meteorology 151, 1580–1588. doi:10.1016/j.agrformet.2011.06.013
Estrella, N., Sparks, T. H., and Menzel, A. (2007). Trends and Temperature Response in the Phenology of Crops in Germany. Glob. Change Biol 13, 1737–1747. doi:10.1111/j.1365-2486.2007.01374.x
Gao, M., Xu, Y., Yin, H., Li, K., and Li, X. (2018). Analysis on the Changes of Rice Growth Period over Northeast China in 1992–2012. Clim. Change Res. 14, 495–504. Chinese with English abstract. doi:10.12006/j.issn.1673-1719.2017.221
Gong, L., Tian, B., Li, Y., and Wu, S. (2021). Phenological Changes of Soybean in Response to Climate Conditions in Frigid Region in China Over the Past Decades. Int. J. Plant Prod. 15, 363–375. doi:10.1007/s42106-021-00145-5
He, L., Asseng, S., Zhao, G., Wu, D., Yang, X., Zhuang, W., et al. (2015). Impacts of Recent Climate Warming, Cultivar Changes, and Crop Management on Winter Wheat Phenology Across the Loess Plateau of China. Agric. For. Meteorology 200, 135–143. doi:10.1016/j.agrformet.2014.09.011
He, L., Jin, N., and Yu, Q. (2020). Impacts of Climate Change and Crop Management Practices on Soybean Phenology Changes in China. Sci. Total Environ. 707, 135638. doi:10.1016/j.scitotenv.2019.135638
Li, N., Li, Y., Biswas, A., Wang, J., Dong, H., Chen, J., et al. (2021a). Impact of Climate Change and Crop Management on Cotton Phenology Based on Statistical Analysis in the Main-Cotton-Planting Areas of China. J. Clean. Prod. 298, 126750. doi:10.1016/j.jclepro.2021.126750
Li, Z., Zhang, Z., and Zhang, L. (2021b). Improving Regional Wheat Drought Risk Assessment for Insurance Application by Integrating Scenario-Driven Crop Model, Machine Learning, and Satellite Data. Agric. Syst. 191, 103141. doi:10.1016/j.agsy.2021.103141
Li, Z., Yang, P., Tang, H., Wu, W., Chen, Z., Zhou, Q., et al. (2011). Trend Analysis of Typical Phenophases of Major Crops under Climate Change in the Three Provinces of Northeast China. Sci. Agric. Sin. 44, 4180–4189. Chinese with English abstract. doi:10.3864/j.issn.0578-1752.2011.20.006
Li, Z., Yang, P., Tang, H., Wu, W., Yin, H., Liu, Z., et al. (2014). Response of Maize Phenology to Climate Warming in Northeast China between 1990 and 2012. Reg. Environ. Change 14, 39–48. doi:10.1007/s10113-013-0503-x
Liu, T., Yang, X., Batchelor, W. D., Liu, Z., Zhang, Z., Wan, N., et al. (2020). A Case Study of Climate-Smart Management in Foxtail Millet (Setaria Italica) Production under Future Climate Change in Lishu County of Jilin, China. Agric. For. Meteorology 292-293, 108131. doi:10.1016/j.agrformet.2020.108131
Liu, Y., Zhang, J., Pan, T., and Ge, Q. (2021). Assessing the Adaptability of Maize Phenology to Climate Change: The Role of Anthropogenic-Management Practices. J. Environ. Manage. 293, 112874. doi:10.1016/j.jenvman.2021.112874
Liu, Z., Yang, X., Chen, F., and Wang, E. (2013). The Effects of Past Climate Change on the Northern Limits of maize Planting in Northeast China. Climatic Change 117, 891–902. doi:10.1007/s10584-012-0594-2
Liu, Z., Yang, X., Lin, X., Gowda, P., Lv, S., and Wang, J. (2018). Climate Zones Determine where Substantial Increases of Maize Yields Can Be Attained in Northeast China. Climatic Change 149, 473–487. doi:10.1007/s10584-018-2243-x
Menzel, A., Sparks, T. H., Estrella, N., Koch, E., Aasa, A., Ahas, R., et al. (2006). European Phenological Response to Climate Change Matches the Warming Pattern. Glob. Chang. Biol. 12, 1969–1976. doi:10.1111/j.1365-2486.2006.01193.x
Mo, F., Sun, M., Liu, X.-Y., Wang, J.-Y., Zhang, X.-C., Ma, B. L., et al. (2016). Phenological Responses of spring Wheat and maize to Changes in Crop Management and Rising Temperatures from 1992 to 2013 across the Loess Plateau. Field Crops Res. 196, 337–347. doi:10.1016/j.fcr.2016.06.024
Porter, J. R., and Semenov, M. A. (2005). Crop Responses to Climatic Variation. Phil. Trans. R. Soc. B 360, 2021–2035. doi:10.1098/rstb.2005.1752
Shen, X., Liu, B., Henderson, M., Wang, L., Wu, Z., Wu, H., et al. (2018). Asymmetric Effects of Daytime and Nighttime Warming on spring Phenology in the Temperate Grasslands of China. Agric. For. Meteorology 259, 240–249. doi:10.1016/j.agrformet.2018.05.006
Tao, F., Xiao, D., Zhang, S., Zhang, Z., and Rötter, R. P. (2017). Wheat Yield Benefited from Increases in Minimum Temperature in the Huang-Huai-Hai Plain of China in the Past Three Decades. Agric. For. Meteorology 239, 1–14. doi:10.1016/j.agrformet.2017.02.033
Tao, F., Zhang, S., Zhang, Z., and Rötter, R. P. (2014a). Maize Growing Duration Was Prolonged across China in the Past Three Decades under the Combined Effects of Temperature, Agronomic Management, and Cultivar Shift. Glob. Change Biol. 20, 3686–3699. doi:10.1111/gcb.12684
Tao, F., Zhang, Z., Shi, W., Liu, Y., Xiao, D., Zhang, S., et al. (2013). Single rice Growth Period Was Prolonged by Cultivars Shifts, but Yield Was Damaged by Climate Change during 1981-2009 in China, and Late Rice Was Just Opposite. Glob. Change Biol. 19, 3200–3209. doi:10.1111/gcb.12250
Tao, F., Zhang, Z., Xiao, D., Zhang, S., Rötter, R. P., Shi, W., et al. (2014b). Responses of Wheat Growth and Yield to Climate Change in Different Climate Zones of China, 1981-2009. Agric. For. Meteorology 189-190, 91–104. doi:10.1016/j.agrformet.2014.01.013
Thornton, P. E., Running, S. W., and White, M. A. (1997). Generating Surfaces of Daily Meteorological Variables over Large Regions of Complex Terrain. J. Hydrol. 190, 214–251. doi:10.1016/S0022-1694(96)03128-9
Visser, M. E., and Both, C. (2005). Shifts in Phenology Due to Global Climate Change: the Need for a Yardstick. Proc. R. Soc. B. 272, 2561–2569. doi:10.1098/rspb.2005.3356
IPCC (2021). “Summary for Policymakers,” in Climate Change 2021: The Physical Science Basis. Contribution of Working Group I to the Sixth Assessment Report of the Intergovernmental Panel on Climate Change. Editors V. Masson-Delmotte, P. Zhai, A. Pirani, S. Connors, C. Péan, and S. Berger (Cambridge: Cambridge University Press). In Press.
Wang, J., Wang, E., Feng, L., Yin, H., and Yu, W. (2013). Phenological Trends of winter Wheat in Response to Varietal and Temperature Changes in the North China Plain. Field Crops Res. 144, 135–144. doi:10.1016/j.fcr.2012.12.020
Wang, X., Ciais, P., Li, L., Ruget, F., Vuichard, N., Viovy, N., et al. (2017a). Management Outweighs Climate Change on Affecting Length of rice Growing Period for Early rice and Single rice in China during 1991-2012. Agric. For. Meteorology 233, 1–11. doi:10.1016/j.agrformet.2016.10.016
Wang, Z., Chen, J., Xing, F., Han, Y., Chen, F., Zhang, L., et al. (2017b). Response of Cotton Phenology to Climate Change on the North China Plain from 1981 to 2012. Sci. Rep. 7, 6628. doi:10.1038/s41598-017-07056-4
Wu, D., Wang, P., Jiang, C., Yang, J., Huo, Z., and Yu, Q. (2019). Measured Phenology Response of Unchanged Crop Varieties to Long-Term Historical Climate Change. Int. J. Plant Prod. 13, 47–58. doi:10.1007/s42106-018-0033-z
Xiao, D., Moiwo, J. P., Tao, F., Yang, Y., Shen, Y., Xu, Q., et al. (2015). Spatiotemporal Variability of winter Wheat Phenology in Response to Weather and Climate Variability in China. Mitig. Adapt. Strateg. Glob. Change 20, 1191–1202. doi:10.1007/s11027-013-9531-6
Xiao, D., Qi, Y., Li, Z., Wang, R., Moiwo, J. P., and Liu, F. (2017). Impact of thermal Time Shift on Wheat Phenology and Yield under Warming Climate in the Huang-Huai-Hai Plain, China. Front. Earth Sci. 11, 148–155. doi:10.1007/s11707-016-0584-1
Xiao, D., Qi, Y., Shen, Y., Tao, F., Moiwo, J. P., Liu, J., et al. (2016). Impact of Warming Climate and Cultivar Change on maize Phenology in the Last Three Decades in North China Plain. Theor. Appl. Climatol 124, 653–661. doi:10.1007/s00704-015-1450-x
Xiao, D., and Tao, F. (2014). Contributions of Cultivars, Management and Climate Change to winter Wheat Yield in the North China Plain in the Past Three Decades. Eur. J. Agron. 52, 112–122. doi:10.1016/j.eja.2013.09.020
Xiao, D., Tao, F., Liu, Y., Shi, W., Wang, M., Liu, F., et al. (2013). Observed Changes in winter Wheat Phenology in the North China Plain for 1981-2009. Int. J. Biometeorol. 57, 275–285. doi:10.1007/s00484-012-0552-8
Xiao, D., Zhao, Y., Bai, H., Hu, Y., and Cao, J. (2019). Impacts of Climate Warming and Crop Management on maize Phenology in Northern China. J. Arid Land 11, 892–903. doi:10.1007/s40333-019-0028-3
Yan, M., Wei, D., and Wu, Y. (2020). Analysis on the Spatio-Temporal Evolution of the Main Food Crops Planting Structure in the Three Northeastern Provinces. J. North. Agric. 48, 114–118. Chinese with English abstract. doi:10.12190/j.issn.2096-1197.2020.06.19
Ye, T., Zong, S., Kleidon, A., Yuan, W., Wang, Y., and Shi, P. (2019). Impacts of Climate Warming, Cultivar Shifts, and Phenological Dates on rice Growth Period Length in China after Correction for Seasonal Shift Effects. Climatic Change 155, 127–143. doi:10.1007/s10584-019-02450-5
Zhang, S., and Tao, F. (2013). Modeling the Response of rice Phenology to Climate Change and Variability in Different Climatic Zones: Comparisons of Five Models. Eur. J. Agron. 45, 165–176. doi:10.1016/j.eja.2012.10.005
Zhang, S., Tao, F., and Zhang, Z. (2014). Rice Reproductive Growth Duration Increased Despite of Negative Impacts of Climate Warming across China during 1981-2009. Eur. J. Agron. 54, 70–83. doi:10.1016/j.eja.2013.12.001
Zhang, T., Huang, Y., and Yang, X. (2013). Climate Warming over the Past Three Decades Has Shortened rice Growth Duration in China and Cultivar Shifts Have Further Accelerated the Process for Late rice. Glob. Change Biol. 19, 563–570. doi:10.1111/gcb.12057
Zhao, J., Yang, X., Dai, S., Lv, S., and Wang, J. (2015). Increased Utilization of Lengthening Growing Season and Warming Temperatures by Adjusting Sowing Dates and Cultivar Selection for spring maize in Northeast China. Eur. J. Agron. 67, 12–19. doi:10.1016/j.eja.2015.03.006
Keywords: crop phenology, growth duration, climate change, Northeast China, impact assessment
Citation: Xiao D, Zhang Y, Bai H and Tang J (2021) Trends and Climate Response in the Phenology of Crops in Northeast China. Front. Earth Sci. 9:811621. doi: 10.3389/feart.2021.811621
Received: 09 November 2021; Accepted: 01 December 2021;
Published: 16 December 2021.
Edited by:
Xiangjin Shen, Northeast Institute of Geography and Agroecology (CAS), ChinaReviewed by:
Lei Wang, Northeast Institute of Geography and Agroecology (CAS), ChinaYue Yang, Northeast Normal University, China
Copyright © 2021 Xiao, Zhang, Bai and Tang. This is an open-access article distributed under the terms of the Creative Commons Attribution License (CC BY). The use, distribution or reproduction in other forums is permitted, provided the original author(s) and the copyright owner(s) are credited and that the original publication in this journal is cited, in accordance with accepted academic practice. No use, distribution or reproduction is permitted which does not comply with these terms.
*Correspondence: Dengpan Xiao, xiaodp@sjziam.ac.cn