 Qinjie Liu1,2
 Qiang Fu
- 1State Key Laboratory of Mining Response and Disaster Prevention and Control in Deep Coal Mines, Anhui University of Science and Technology, Huainan, China
- 2School of Mining Engineering, Anhui University of Science and Technology, Huainan, China
- 3Institute of Energy, Hefei Comprehensive National Science Center, Hefei, China
- 4Sinopec Exploration Company, Chengdu, China
- 5Department of Earth and Environment, Anhui University of Science and Technology, Huainan, China
Based on the comprehensive analysis of wellbore characteristics in a deep shale gas field, the in-situ stress state of the shale reservoir was assessed in this study for the Longmaxi formation in the Dingshan area, Southwestern China. The data obtained from hydraulic fracturing, drilling-induced fractures, and in-situ core testing were used to determine the magnitude and direction of the maximum principal horizontal stress in five wells. Besides, hydraulic fracturing and cross-multipole array acoustic logging (XMAC) were employed to determine the vertical variation of the in-situ stress. Based on the logging interpretation and mechanical test results, the spatial distribution of rock mechanical parameters in the Dingshan area was assessed by the amplitude variation versus offset (AVO) seismic inversion. A 3D heterogeneous mechanical inversion model was realized via the ANSYS and CATIA3D finite element software packages, providing the area in-situ stress field simulation. The depth, fault strike, and position change effects on the main stress, horizontal stress difference, and horizontal stress difference coefficient were numerically simulated. The results show that the maximum principal stress azimuth was mainly concentrated in the NE20°-NE80° sector. Moreover, the development zone of natural fractures was related to the area with the highest principal stress differences. The maximum principal stress variation in the study area was mainly in the compressive range from −135 to −45 MPa, gradually increasing from east to west and south to north. The stress type mainly depended on the depth, fault strike, and rock mechanical parameters, while the stress difference and stress difference coefficient near the fault structure were relatively small. This study’s findings are considered instrumental in improving the borehole stability, determining the casing setting point, and optimizing the well location in deep shale reservoirs with similar geological conditions.
Introduction
The rapid progress of horizontal staged fracturing and similar technologies provided breakthrough solutions for the global commercial development of shale gas. In particular, it became an important field of natural gas exploration and development in China, which self-generation and self-contained shale reservoirs have low porosity, ultra-low permeability, and relatively developed natural fractures (Wang et al., 2019). Since most of them have to be hydraulically fractured before economic development (Jang et al., 2015), shale gas production requires shale fracturing by the most effective methods, thus deriving many fracturing stimulation theories to create a complex fracture network (Kim and Lee, 2015). The development of a fracture system directly affects the exploitation efficiency of the shale gas reservoir and determines its quality and output (Ren and Lau, 2019). The assessments of hydraulic fracture expansion and designs of fracturing and perforation schemes are based on the main parameters of the in-situ stress field in the shale formation. The accuracy of formation rock stress state measurement and the authenticity of the adopted in-situ stress prediction model directly control the hydraulic fracturing efficiency. Therefore, the study of the in-situ stress field of shale reservoirs is crucial for shale gas exploration and development.
The rock stress in the formation is mainly formed by gravity and tectonic stresses induced by drilling, slotting, and coring (Li et al., 2019). The geomechanical model is established in the early stage of the oil and gas field development, which can address various problems encountered in the life cycle of oil and gas reservoir development. These problems may occur in the following stages: 1) in the exploration and evaluation stages of the reservoir to be developed, such as the evaluation of fault sealing (or leakage) potential (Ciftci et al., 2013), wellbore stability (He et al., 2015; Liu et al., 2019), and the potential location of oil-gas migration and accumulation (Zeng et al., 2010); 2) in the formal development stage of the reservoir, such as the determination of the best well trajectory (Zhang et al., 2015), casing set point and mud specific gravity, as well as prediction of anisotropic permeability of the fractured reservoir (Dubey et al., 2020); 3) in the whole subsequent production stage of the reservoir, which requires to select the best completion method, such as hydraulic fracturing or repetitive hydraulic fracturing (Chen et al., 2018), and stress sensitivity evaluation of the reservoir and fracture (Han et al., 2021); 4) in the secondary and tertiary oil recovery stages of reservoir development and process optimization, including water injection and steam injection (Sun et al., 2018).
After nearly a century of development, the reservoir stress state can be determined by various means. At present, the research techniques for determining in-situ stress of oil and gas reservoirs and mines are mainly divided into five categories (Ljunggren et al., 2003): 1) well trajectory analysis methods (Zhao et al., 2015), 2) core test methods (Nian et al., 2016), 3) calculation methods based on logging data (Han et al., 2018), 4) methods of actual measurement of underground in-situ stresses (Fu et al., 2021) and 5) simulation methods, including physical and numerical ones (Bai et al., 2018). In the study (Hashimoto and Matsu’Ura, 2006; Lü et al., 2017), the stress field simulation was performed using a simple three-dimensional geological model, whereas the geological unit was regarded as homogeneous and had constant mechanical parameters. However, such an assumption was often inconsistent with actual geological conditions, which deteriorates the accuracy of such stress field simulations.
In this paper, the geological conditions of the study area are assessed, and the rock mechanics parameters are experimentally determined. The single-well in-situ stress data of the study area are measured using the acoustic emission, drilling-induced fractures, and well deviation statistics. They are monitored, adjusted, and analyzed to obtain the in-situ stress distribution characteristics and their variation with depth. Based on the logging interpretation and rock mechanics test results, the spatial distribution of mechanical parameters is obtained by the amplitude variation versus offset (AVO) inversion. The maximum and minimum principal stress distribution characteristics, horizontal stress difference, and horizontal stress difference coefficient are predicted via the numerical simulation using a commercial finite element CATIA software package.
Geological Background
Location and Structure
The case study is the shale formation in the Dingshan area, located in the Qijiang District of Chongqing, Southwest China, about 150 km away from Jiaoshiba Block of Fuling shale gas field. Figure 1 shows the location of the Dingshan area and the cross-section through Dingshan wells (Liu et al., 2017a; Hu et al., 2019). The NE-trending structural belt of the Lintanchang-Dingshan in Southeast Sichuan belongs to the complex basin margin structure. The structural characteristics of this area are as follows. It straddles four structural units: East Sichuan high and steep fault-fold area, South Sichuan low and steep fold area, North Guizhou thrust belt, and South Sichuan cover coat detachment zone. The sedimentary cap has experienced multi-stage tectonic movements. Like other blocks in the Sichuan Basin, it underwent six major tectonic cycles in geological history, including Yangtze, Caledonian Hercynian, Indosinian, Yanshan, and Himalayan (Liu et al., 2021). Most of the above structural units have fold and fault structures, i.e., trough-like folds composed of high and steep anticline belts and the fault belt in NE and NNE directions. The structural style is anticline wide and gentle, syncline compact, parallel arrangement in rows and belts. Most faults are reverse ones with large dip angles ranging from 60 to 85°.
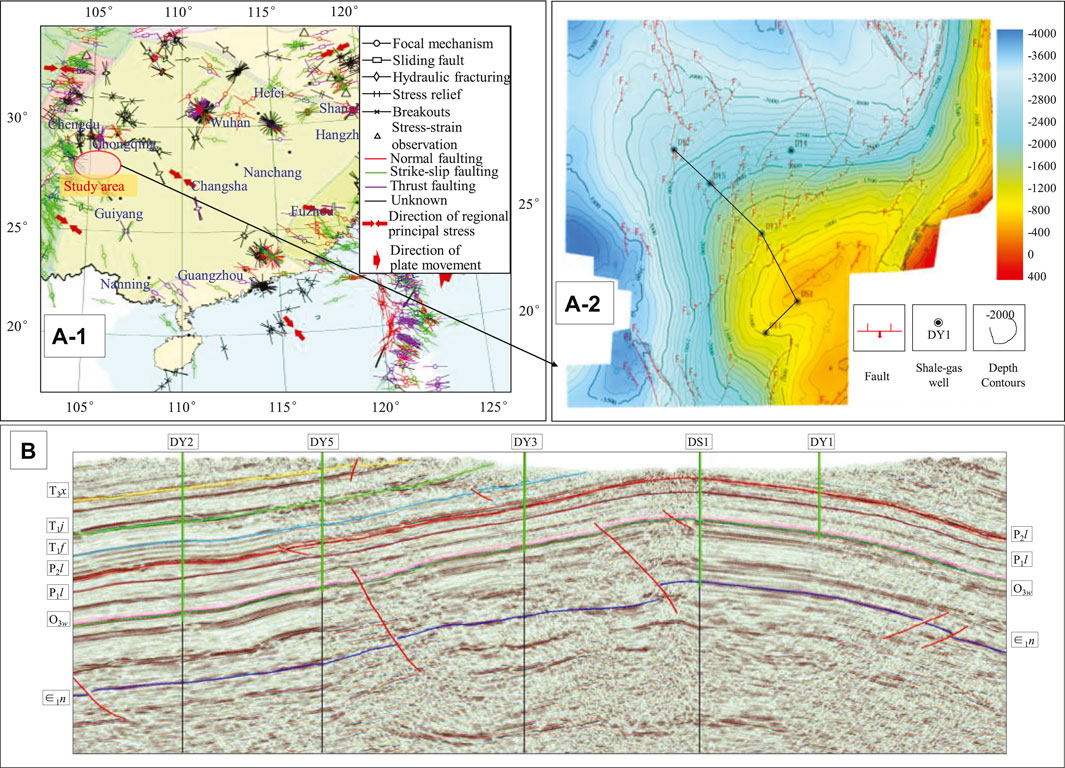
FIGURE 1. [(A), 1,2] Location of the Dingshan area and (B) Cross-section through the Dingshan area (Liu et al., 2017b; Hu et al., 2019) (The crustal stress data were provided by the China Earthquake Data Center).
Stratigraphy
The main strata developed from bottom to top in the Dingshan area are Sinian of Proterozoic, Permian of Early Paleozoic, and Late Paleozoic and Mesozoic (Liu et al., 2013). The strata in the study area are well developed, and the sedimentary basement is an epimetamorphic rock of the Banxi group of pre-Sinian. Triassic strata are exposed on the area surface, while Devonian, Carboniferous, and Cenozoic strata are absent. Carbonaceous and sandy shales dominate the lower part of the Longmaxi formation, and the upper part is interbedded with calcareous shale and thin argillaceous limestone. According to the field thickness measurement, the high-quality shale section of the Longmaxi formation is stably developed, with a thickness of 28.9–35 m, as shown in Figure 2.
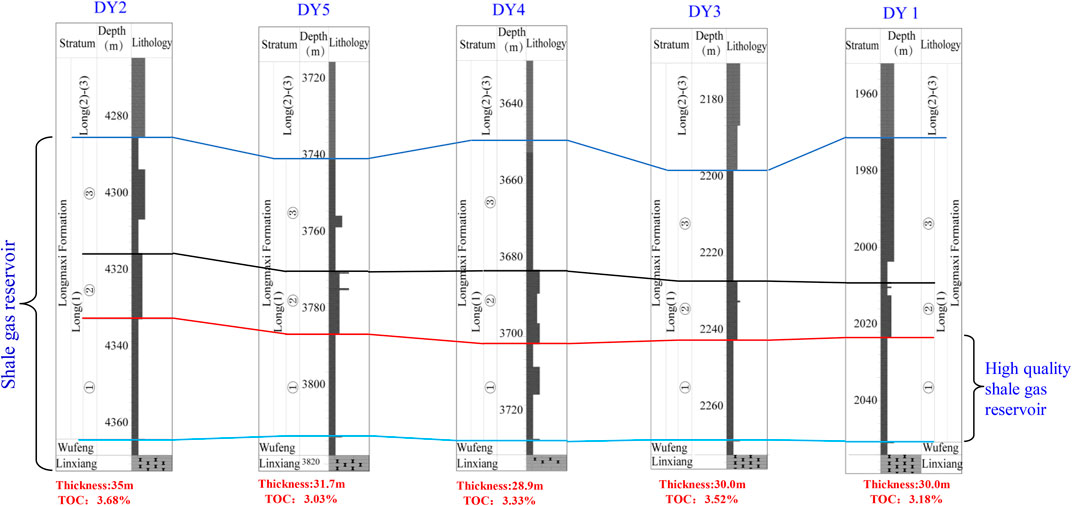
FIGURE 2. Distribution of shale gas intervals in the Longmaxi formation of Dingshan area.
Natural Fractures
The development orientation of fractures is closely related to in-situ stress, which is an important factor in controlling the distribution of natural and hydraulic-induced fractures in reservoirs. The paleotectonic stress field controls natural fractures’ formation, distribution, and development. The modern stress field controls the current occurrence state and effectiveness (opening and connectivity) of underground natural fractures, fracture forms, and extension directions of artificial fractures.
Core observation shows that the Longmaxi formation in the Dingshan area mainly features shear fractures, followed by tensile fractures, torsional fractures, interlayer fractures, and a small number of artificially induced fractures, as shown in Figure 3. High-angle shear fractures (Figures 3A–E) and vertical fractures (Figure 3B) are mainly developed, characterized by large extension length and straight fracture surface, and are mostly filled with calcite. The shale is rich in brittle index minerals; it undergoes the ductile shear fracture under local or regional tectonic stresses, forming high-angle tensile or Mode I fractures (also referred to as an opening mode, with tensile stresses normal to the crack plane) and shear or Mode II fractures (i.e., a sliding mode, with shear stresses acting parallel to the crack plane and perpendicular to the crack front), which are related to faults and folds, respectively. Tensile fractures are frequently referred to as joints, where no appreciable slip or shear is observed. The tensile fractures generally have small extension length and uneven fracture surface, being mostly filled with calcite (Figure 3D). Besides, a small number of tearing mode or Mode III fractures (i.e., a tearing mode with shear stresses acting parallel to the crack plane and parallel to the crack front) are observed. In organic-rich shale, the interlayer fractures (Figure 3F) are usually filled with calcite, pyrite, and organic matter. The occurrence of slip fractures is the same as that of rock stratum, with small dip angles, large trend variations, uneven fracture surfaces, and visible scratches. The induced fractures are artificial fractures caused by an imbalance between heavy mud and in-situ stresses, drilling tool loads, and torsion during drilling.
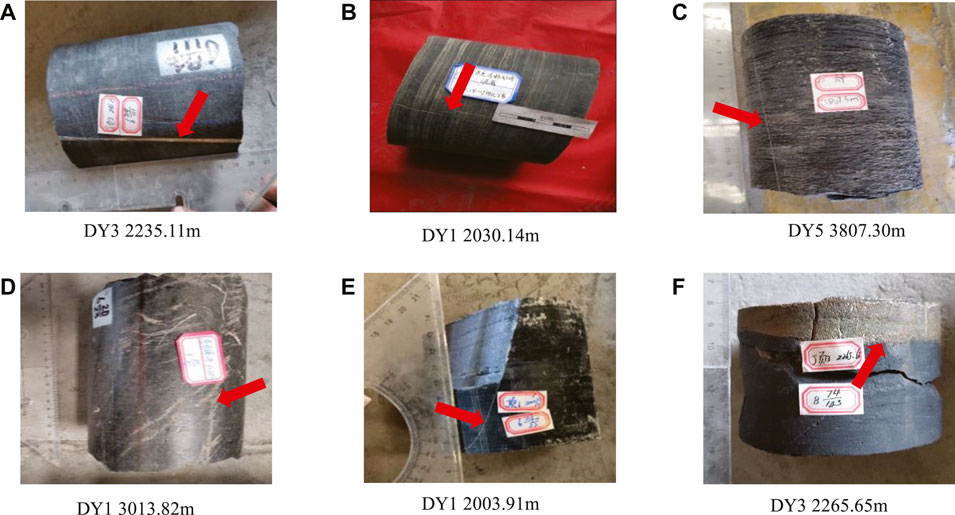
FIGURE 3. Characteristics of shale core fracture in the Longmaxi formation of Dingshan area. (A) DY3 2235.11 m. (B) DY1 2030.14 m. (D) DY1 3013.82 m. (E) DY1 2003.91 m. (F) DY3 2265.25 m.
The filling of fractures after their formation is a long-term process. According to the filling degree of minerals in fractures, they can be subdivided into full-filled, half-filled, and unfilled fractures. The filling degree of fractures becomes gradually weak, and so does the sealing of fractures. Core observation shows that about 60% of the fractures in the whole area are full-filled, 20% are half-filled, and 20% are unfilled. The core data analysis of five deep wells (namely Dingye 1–5, hereinafter abbreviated as DY1, DY2, DY3, DY4, and DY5) shows that the fracture filling materials include calcite, pyrite, organic matter, etc. The half-filled and filled fractures are mainly filled with calcite, accounting for about 68%, followed by the mixed filling of calcite and pyrite, accounting for 20%. The ratios of pyrite and organic matter filling are relatively small. Organic matter filling allows the respective fractures to play an important role in oil-gas migration and transportation in the reservoir space.
The core observation results combined with imaging logging interpretation data show that (Figure 4) there are mainly four groups of structural fracture development orientations, among which the NEE (80 ± 10) fractures are the most developed, followed by the NWW (305° ± 5°). The NNE (30° ± 5°) and NNW (350° ± 5°) fractures are relatively poorly developed. According to the intersecting relationship of core fractures and the analysis of the characteristics of fillings, NWW (305° ± 5°) and NNW (350° ± 5°) fractures are of the same stage, which can be matched as plane “X” type conjugate shear fractures. The fractures of NNE (30° ± 5°) and NEE (80° ± 10°) can be matched as another stage of plane “X” type conjugate shear fractures.
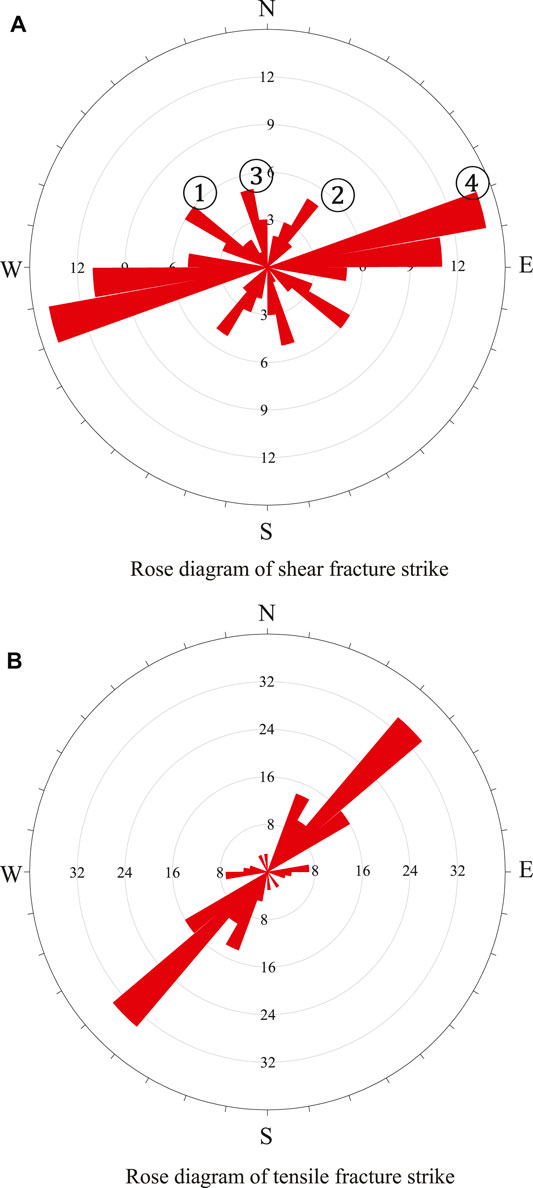
FIGURE 4. Rose diagram of fracture trend in shale gas well in the Dingshan area. (A) Rose diagram of shear fracture strike. (B) Rose diagram of tensile fracture strike.
Samples and Testing
The engineering rock mechanics was used to study the mechanical characteristics and failure types of rock, which was also essential for the stress field distribution analysis. It was necessary to prepare test specimens meeting the respective standards to determine their mechanical parameters adequately. The rock samples were acquired from DY1, DY2, DY3, DY4, and DY5 wells in the Longmaxi formation of the Dingshan area (three samples per well) and processed into cylindrical specimens with a diameter of 25 mm and a height of 50 mm. Their end face’s parallelism was controlled within 0.01 mm. The testing procedure complied with the GB/T 23561.7-2009 Part 7 and GB/T 23561.8-2009 Part 8: Methods for Determining the Uniaxial Compressive Strength and Deformation Parameters of Coal and Rock, which implied the stress loading rate of 0.5–1.0 MPa/s and the displacement-measuring device accuracy of 0.001 mm. A WDW-100E microcomputer-controlled electronic universal testing machine loading system was employed in the tests. The maximum axial load range of the WDW–100E testing machine was 100 kN, and the accuracy was ±0.5%. A computer-aided high-precision test control was performed, with online monitoring and recording of the loads and displacements. The uniaxial compression tests were carried out on specimens with different bedding angles. The displacement-controlled loading mode was adopted, with a 0.12 mm/min loading rate.
The uniaxial compression test results are listed in Table 1. As observed, the average uniaxial compressive strength values of DY1, DY2, DY3, DY4, and DY5 specimens were 69.4, 90.12, 75.3, 80.6, and 82.3 MPa, respectively.
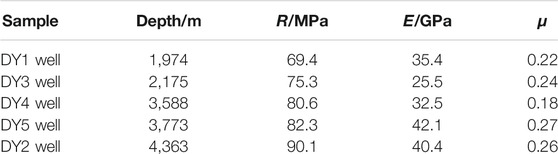
TABLE 1. The uniaxial compression test results for the Longmaxi formation shale of the Dingshan area, China.
Herein, R, E, and μ are rock’s compressive strength, the Young (elastic) modulus, and Poisson’s ratio, respectively.
Test Results on the In-situ Stress in the Horizontal Direction
When an object is subjected to an external force, a force opposing the external force is produced in its interior to keep balance, which is called the internal force. The in-situ stress is the internal stress existing in the crust rock mass, which is the force per unit area inside the medium caused by the vertical and horizontal movements of the crust and other factors. The in-situ stress state is described by the stress tensor, which includes three orthogonal principal stresses, and each principal stress has a direction and size (Rajabi et al., 2016). Only four components usually describe the in-situ stress tensor: the minimum horizontal stress magnitude, the maximum horizontal stress magnitude, the vertical stress magnitude, and the maximum horizontal stress direction (Bell, 1996; Yin et al., 2020). This paper mainly focuses on shale formation (namely the Longmaxi formation in China). Compared with the length and width in the horizontal direction of the study area, the distance changes little in the vertical direction. Therefore, we did not focus on the change of vertical stress of each well.
Longitudinal Profile of Horizontal Stress and Stress Difference
The In-Situ Stress Profile Based on the Logging Analysis
The stress difference distribution in five wells (DY1–DY5) of the Dingshan Block was obtained and analyzed in detail based on the logging interpretation results. The results show that the stress difference in the DY3 sidetracking horizontal well was 5 MPa. Those in DY1, DY2, DY4, and DY5 were 9, 8, 8, and 10 MPa, respectively, while the stress difference in the general bedding of deep wells was usually higher. As shown in Figure 5, the fracture pressure gradient significantly exceeded the maximum horizontal stress gradient and the minimum principal horizontal stress (PHS) gradient.
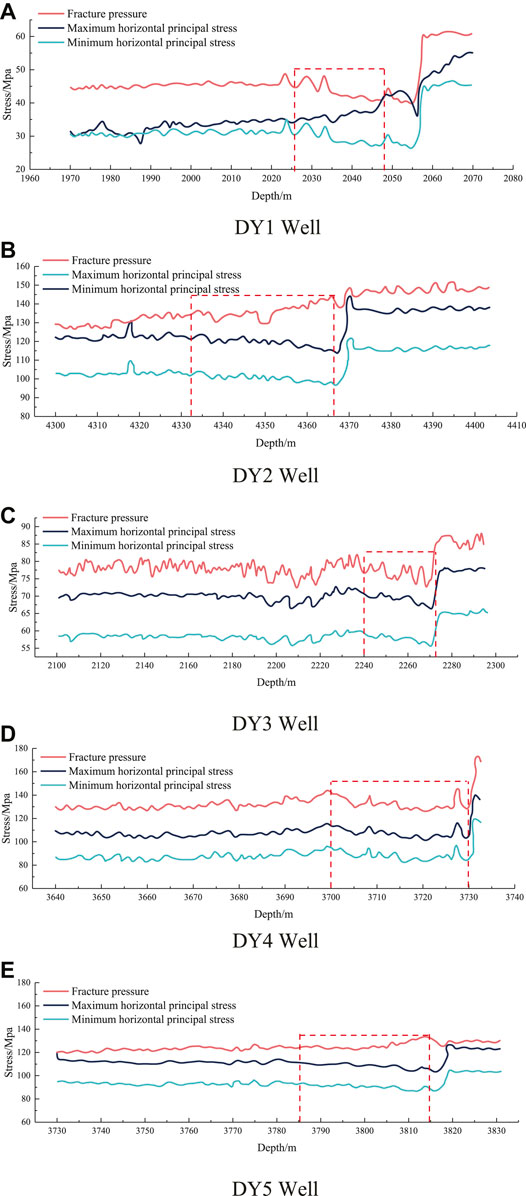
FIGURE 5. Stress profile of shale gas well of the Longmaxi formation in Dingshan area (based on logging interpretation results). (A) DY1 Well. (B) DY2 Well. (C) DY3 Well. (D) DY4 Well. (E) DY5 Well.
Vertical Variation Characteristics of In-Situ Stress Based on Fracturing Curve Reading
According to the fracture closure pressure data of each well (borehole) in the study area, the relationship between fracture closure pressure and depth was obtained and plotted, as shown in Figure 6. As observed, there is a certain correlation between the fracture closure pressure and depth. The fracture closure pressure in DY2 and DY3 specimens increased with depth. However, fracture closure pressure in DY2 fluctuated with a poor correlation with depth. The DY4 and DY5 fracture closure pressures decreased with depth, exhibiting a pronounced downward trend.
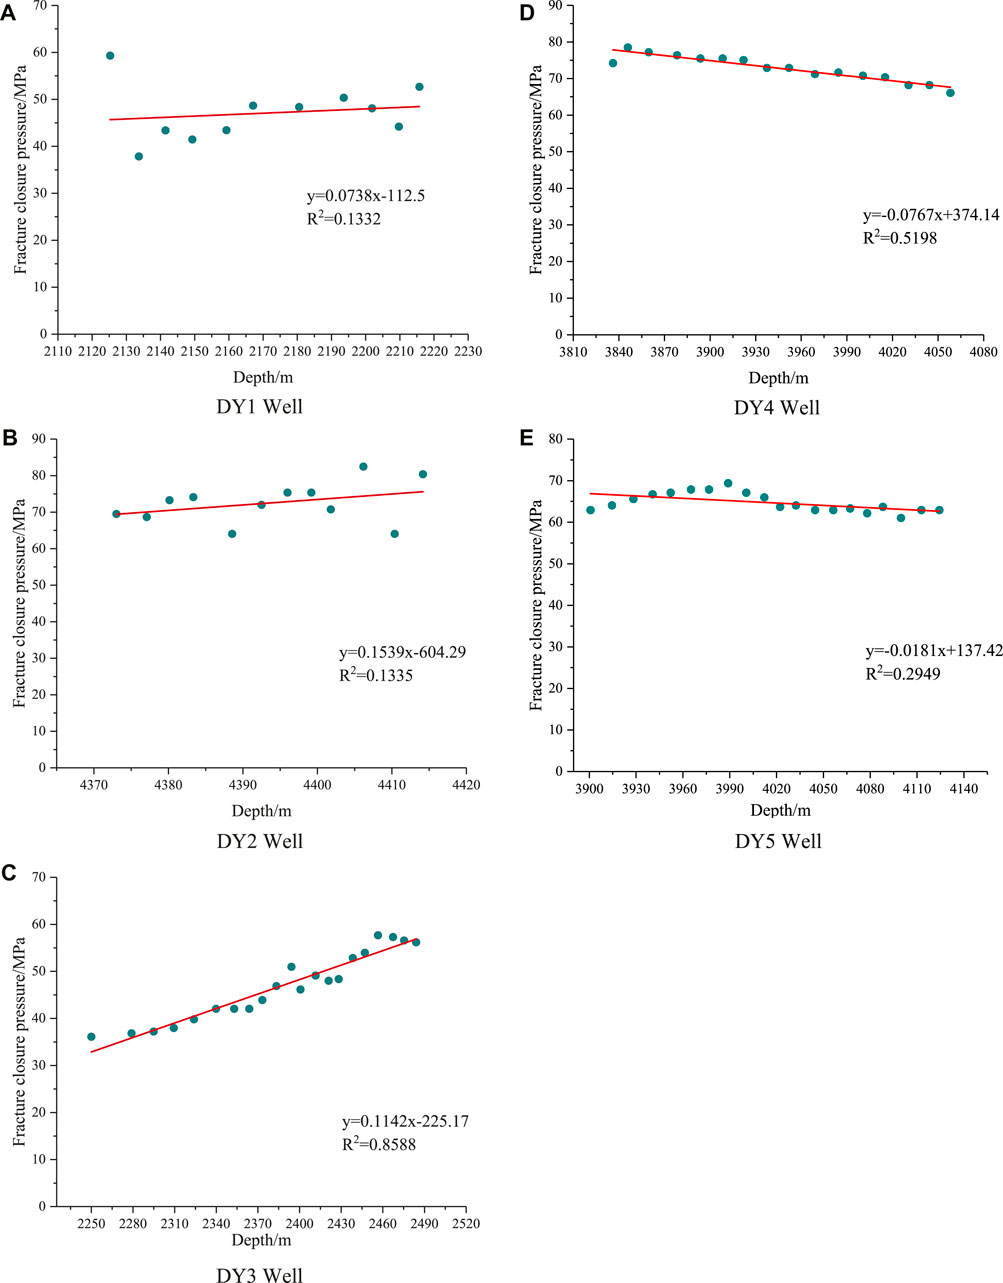
FIGURE 6. Relationship between fracture closure pressure and depth in Dingshan area. (A) DY1 Well. (B) DY2 Well. (C) DY3 Well. (D) DY4 Well. (E) DY5 Well.
According to the above results on fracture closure pressure, the maximum and minimum principal horizontal stress (PHS) values and the logging interpretation data were fitted to re-compile the vertical profile of the in-situ stress, as shown in Figure 7. It can be seen in Figure 7 that the fracture closure pressure obtained by logging interpretation differed from the horizontal minimum stress. The principal stress obtained from logging interpretation exceeded the corrected principal stress of well testing. However, the principal stresses obtained by different acquisition techniques increased with depth.
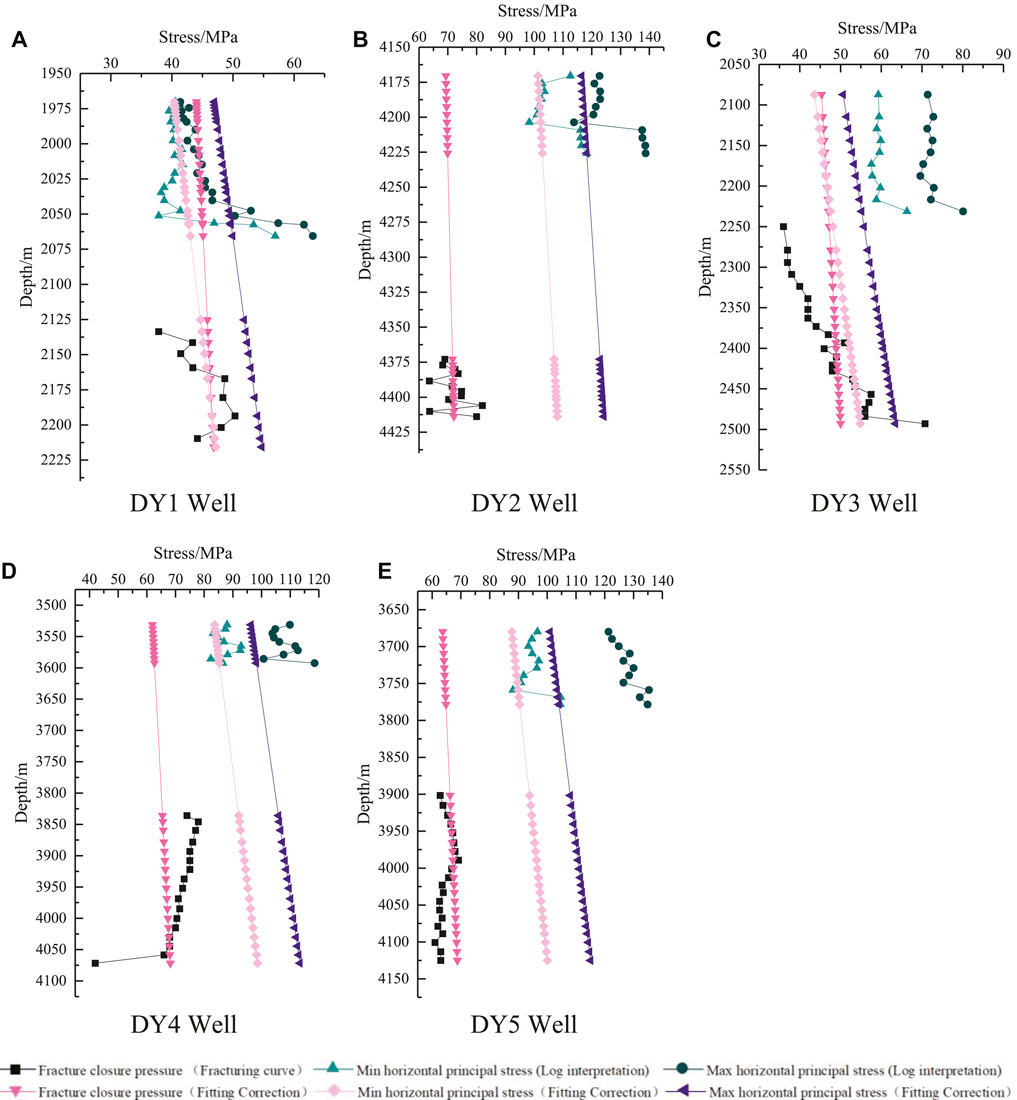
FIGURE 7. Stress vertical section of Dingshan area. (A) DY1 Well. (B) DY2 Well. (C) DY3 Well. (D) DY4 Well. (E) DY5 Well.
The Magnitude and Direction Distributions of the Horizontal In-Situ Stress
The Magnitude Distribution Characteristics of the In-Situ Stress
The magnitude and direction on the horizontal in-situ stress in the Dingshan area were based on fracturing curve data, minimum PHS data, and operation data obtained from well testing. The data on maximum and minimum PHS values in the study area were imported into AutoCAD. The preliminary contour maps of the maximum and minimum PHS values in the study area of the Longmaxi formation were drawn, as shown in Figure 8. As observed, the maximum PHS distribution in the Dingshan area decreased from the northwest (NW) direction to the southeast (SE) one. The maximum and minimum PHS values around DY4, DY5, and DY2 wells were relatively high, forming high-stress areas, while those near DY1 and DY3 wells were relatively low, corresponding to low-stress areas. The above maximum and minimum parameters decreased gradually from northwest to southeast, and the in-situ stress magnitudes dramatically dropped between DY3 and DY4 wells.
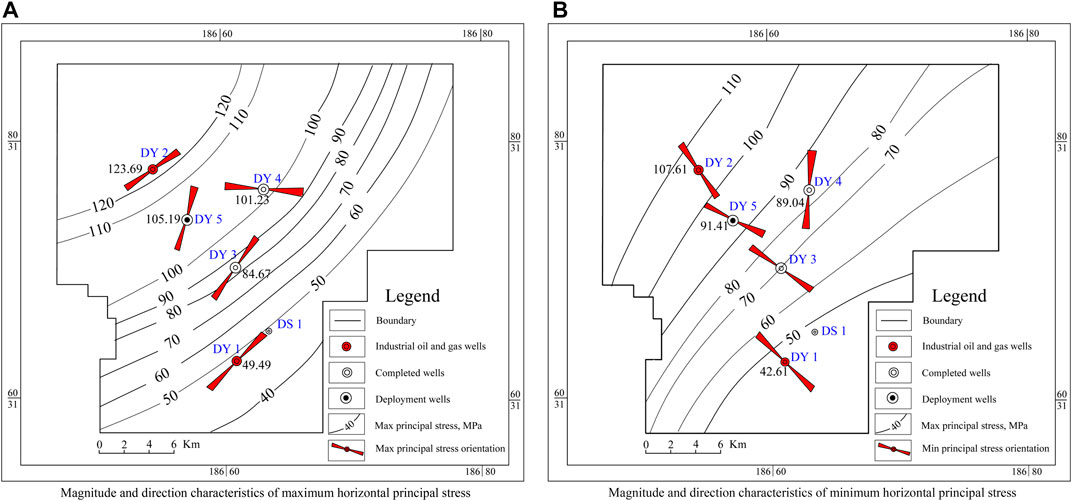
FIGURE 8. Magnitude and direction distribution of horizontal principal stress in the Longmaxi formation. (A) Magnitude and direction characteristics of maximum horizontal principal stress. (B) Magnitude and direction characteristics of minimum horizontal principal stress.
Among the five deep shale gas wells under study, the largest principal stress was observed in the DY2 well, and its minimum PHS was 107.61 MPa. The minimum PHS values were lower in relatively developed fractures. The fractures did not develop at higher compressive stresses, and the minimum PHS gradient was higher.
Azimuth Plane Distribution Characteristics of the In-Situ Stress
The preliminary orientation diagrams of maximum and minimum PHS in the Dingshan-Dongxi area were constructed, as shown in Figure 8. According to Figure 8A, the maximum PHS directions of DY2 well fell into the (NE-SW, NE40°) sector. The above directions changed from DY5 to DY4 wells from NW-SW to approximately E-W. DY3 and DY1 wells exhibited similar orientation changes. The maximum PHS direction of the DY1 well coincided with NEE-SW (∼NE40°). As shown in Figure 8B, the minimum PHS directions of DY2 and DY5 wells fell into the NW-SW sector, while those of DY3, DY2, and DY1 fluctuated from north to west. The minimum PHS direction of DY4 was approximately from south to north, slightly fluctuating between NW and NE directions.
Model and Numerical Simulation
The stress field of the Longmaxi formation in the Dingshan area was simulated via the finite element method (FEM) and the ANSYS software. The stress field simulation required the following steps: 1) determining the structural elements (such as faults, anticlines, and synclines) and strata geometry (e.g., elevation, thickness, etc.); 2) determining the spatial distribution of mechanical parameters (such as Poisson’s ratio and the Young modulus) of the rocks at different positions; 3) determining the load state and related boundary conditions of the geological body.
Geomechanical Model
Mechanical Parameters
Nuclear magnetic resonance and XMAC logging techniques were used to determine the mechanical parameters (the Young modulus, Poisson’s ratio, etc.), brittleness index, and rock element weight fraction in the profile. For various lithologies, the rock mechanical parameters may vary with formations. The AVO synchronous inversion of prestack seismic data can yield multiple-reservoir elastic parameters, making it possible to calculate the brittleness index via dynamic elastic parameters. Therefore, the AVO synchronous inversion can directly obtain dynamic elastic parameters (Liu et al., 2018). Compression and shear wave velocity and density logging data are the basic data for calculating dynamic elastic parameters. These logging data are vital for establishing the initial inversion model and constraining inversion results. Using the low-frequency components of logging curves in the Dingshan area, the initial 3D inversion model of the study area was constructed. Using the wide-azimuth angle gathers extraction to get the input data, the horizon mean slices of dynamic Young moduli and Poisson’s ratios of the Longmaxi formation in the Dingshan area were obtained by the AVO inversion, as shown in Figure 9.
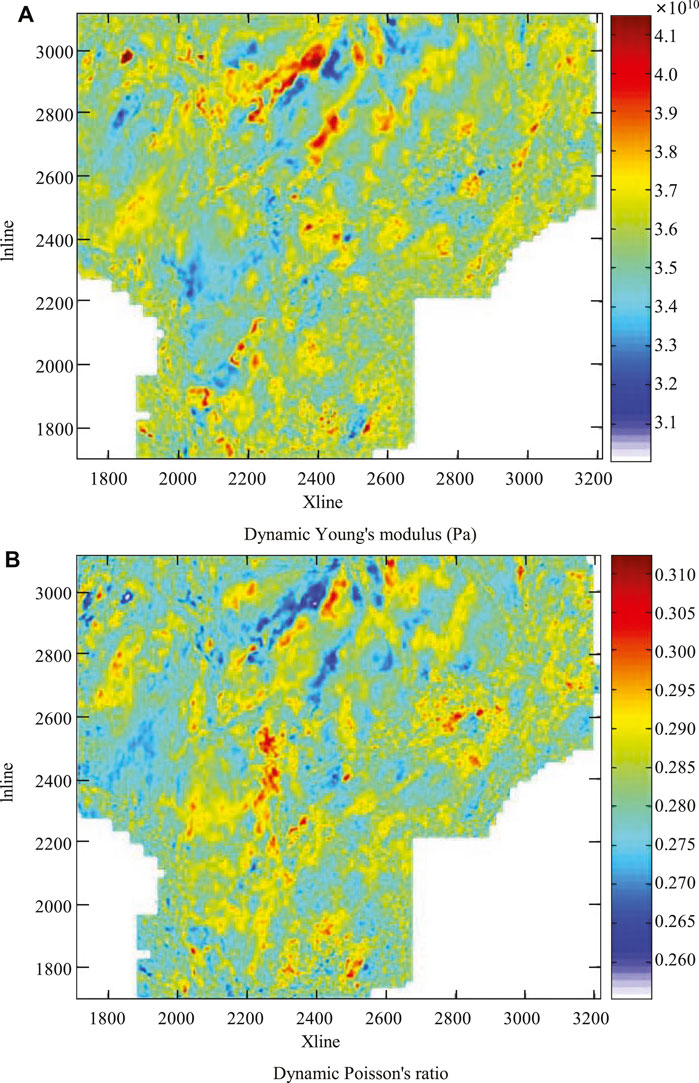
FIGURE 9. Slicing of dynamic Young’s modulus and Poisson’s ratio along strata of the Longmaxi formation in Dingshan area. (A) Dynamic Young’s modulus (Pa). (B) Dynamic Poisson’s ratio.
The Young moduli of the fault zone were usually smaller by 15–35% than those of the normal strata in the Dingshan area (Liu et al., 2017a; Yong et al., 2018; Zhong et al., 2019). Such mechanical parameters as the Young moduli and Poisson’s ratios vary with fault size: the larger the fault length, the greater the fault drop; the larger the Young modulus of the rock, the smaller is its Poisson’s ratio and vice versa.
Geological Model and Finite Element Mesh
The steps to establish the geological model of the Dingshan area were as follows:
(1) The CAD software was used to extract the position information on the contour lines of each layer in the geological structure map to obtain the structural features at different positions.
(2) According to the geological information on several layers in the study area, the surfer software was used for surface fitting to obtain the surface related to the actual stratum distribution characteristics.
(3) The Catia 3D modeling software is used to simulate the closure and filling of the research object, and then the initial geological model of the Dingshan area was established.
(4) The initial geological model of the Dingshan area was imported into the ANSYS finite element simulation software.
As shown in Figure 10, to reduce the computational complexity and improve the computational accuracy, the geological model was meshed by quadrilateral elements and then subdivided into a series of nodes and elements. According to the characteristics of element types in the finite element software, the Solid 45 elements were used for meshing the shale reservoir as the most suitable for layered structure element division. More precise element division could produce more accurate results, but the computational complexity would also be increased. Therefore, the target strata and fault zones were subdivided into several quadrilateral grid elements with side lengths of 3–10 m. The surrounding rock was simulated with a coarse grid with a side length of 10–300 m. The study area around the borehole was split into fine grids, and the area far away from the study area was subdivided into coarse grids. The FEM model contained 1,124,643 elements and 188,632 nodes. Each of these nodes was assigned different mechanical properties, according to the results depicted in Figure 10, which turned the initially homogeneous model into a heterogeneous one. In the computations, tensile and compressive stresses had positive and negative values, respectively.
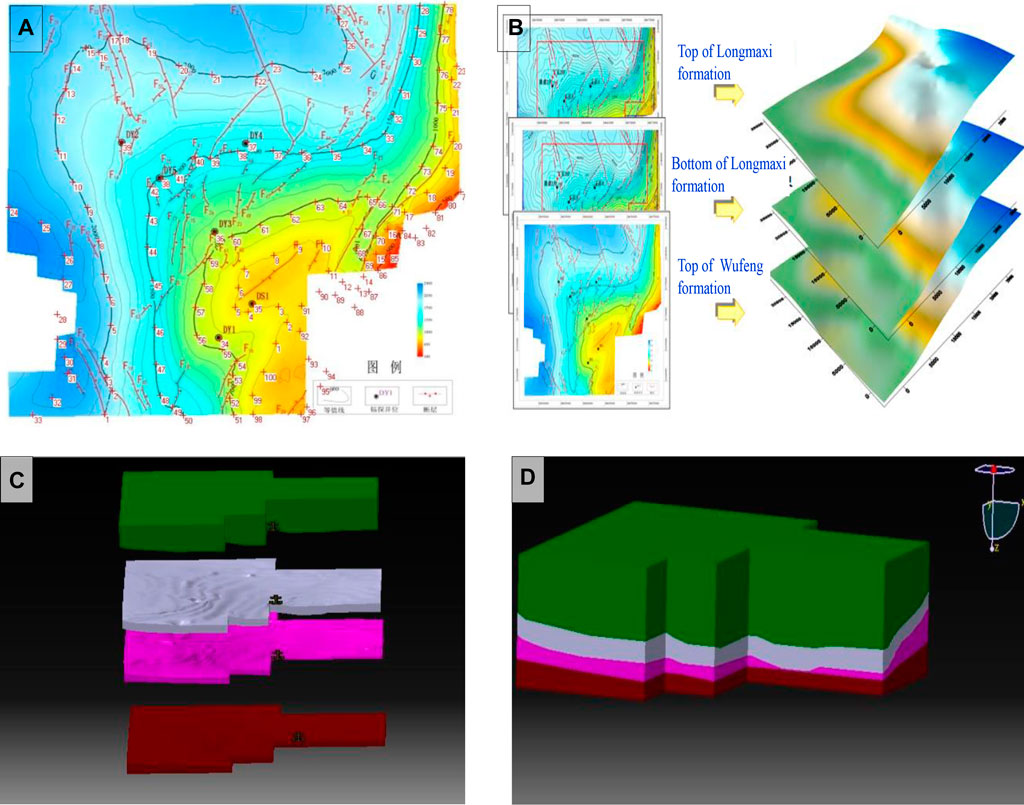
FIGURE 10. Modeling process of numerical simulation. (A) Construction information extraction point distribution map. (B) Fitting surface of each layer interface. (C) Development map of rock geological body. (D) 3D geological model of Longmaxi formation shale in Dingshan area.
Results and Discussion
In the fractured reservoir, the propagation direction of hydraulic fractures was closely related to the stress state, fracture extension, and the development of natural fractures. Various stress parameters, horizontal stress difference ∆σ, and horizontal stress difference coefficient (Kh) were the main factors controlling the propagation of hydraulic fractures along the maximum principal stress direction (Liu et al., 2017b).
As seen in Figures 11A,B, the maximum and minimum principal stresses had similar distribution patterns. In contrast, gravity and plate boundary stress played a major part in the Dingshan area. Figure 11A shows the distribution diagram of the maximum PHS and azimuth contour of shale gas reservoirs in the Longmaxi formation of the Dingshan area. As observed, the variation range of the maximum principal stress in the study area ranged from −135 to −45 MPa, which implied the prevailing compressive stress state. The increasing trends from east to west and south to north were observed, strongly correlated with the strata buried depth of strata but could not be described by simple linear relationships. Due to the large fault structure segmentation of the near NEE trending, the stress field in the study area was characterized by obvious zoning. The existence of fault structures greatly affected the maximum principal stress: its variation gradient was the highest near the fault zone, especially in the areas with fault structure turns or intersection of multiple faults. Meanwhile, since the internal rocks of the fractured structure were partially broken, the relevant mechanical parameters were slightly lower, the maximum principal stress value in the fracture structure was reduced correspondingly. The larger fracture structure scales corresponded to the larger decline of the maximum principal stress.
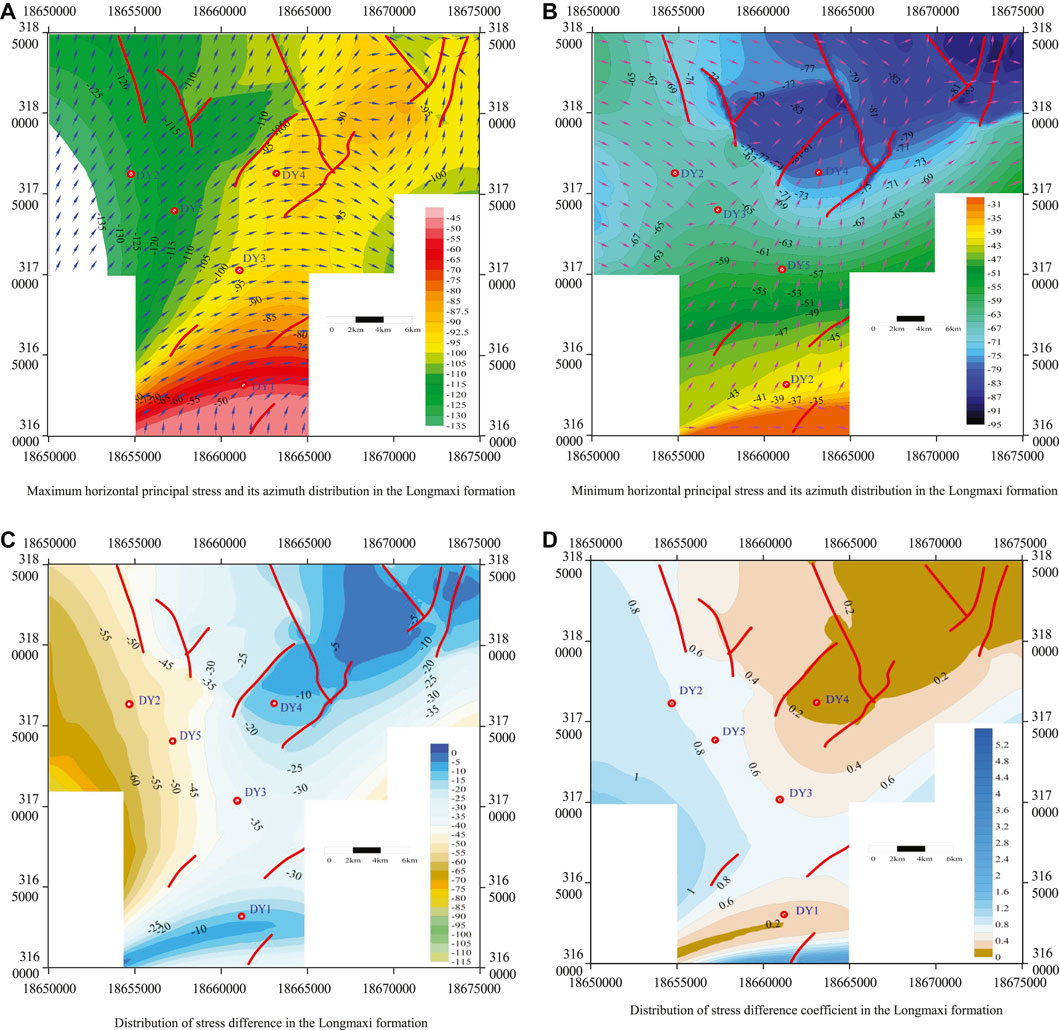
FIGURE 11. Stress field of shale gas reservoir of the Longmaxi formation in Dingshan area. (A) Maximum horizontal principal stress and its azimuth distribution in the Longmaxi formation. (B) Minimum horizontal principal stress and its azimuth distribution in the Longmaxi formation. (C) Distribution of stress difference in the Longmaxi formation. (D) Distribution of stress difference coefficient in the Longmaxi formation.
As shown in Figure 11A, the azimuth of the maximum PHS of the Longmaxi formation in the Dingshan area mainly ranged between NE20° and NE80° directions, which was consistent with the stress azimuth of the far-field area on the whole. However, there were also some differences: the orientation of the maximum principal stress in the study area was approximately parallel to the strike of the main fault zone, while that in the local area was normal to the fault structure. The fault zone significantly affected the maximum principal stress distribution. The principal stress orientation exhibited refraction and deflection near the fault structure, especially at large fault scales and in multiple fault structures’ intersections.
The minimum PHS and its orientation distribution in the shale gas reservoir of the Longmaxi formation in the Dingshan area are shown in Figure 11B. As observed, the minimum PHS mainly ranged between −95 and −35 MPa, featuring the prevailing compressive stress state. The minimum PHS in the study area increased from south to north and from east to west, with an obvious depth correlation. However, in terms of the specific values, the minimum PHS value variation pattern strongly differed from the maximum principal stress. In the area under study, due to the high degree of rock breaking near the fault structure and the low ability to bear the shear load, the difference between the maximum and minimum principal stresses and the coefficient of stress difference were relatively small, as shown in Figures 11C,D. The fractured structure had a stronger effect on the distribution of the minimum principal stress than on the maximum one, showing a higher variation gradient and local zoning characteristics.
As shown in Figure 11B, the orientation distribution of the minimum PHS of the shale gas reservoir in the Dingshan area was more complex. The variation range was wider than that of the maximum principal stress. In particular, the orientation of the minimum principal stress near several main faults in the north and northeast directions of the study area changed greatly, indicating that the orientation of the minimum PHS was also affected by faults.
The reliability of the simulation results was verified by comparing the calculation results on the in-situ stresses of DY1, DY2, DY3, DY4, and DY5. As shown in Figure 12, the maximum relative error between the maximum and minimum PHS values did not exceed 15%, while the relative error of the local position did not exceed 10%. Therefore, the method of heterogeneous geomechanical modeling proposed in this paper accurately predicted the 3D in-situ stress field.
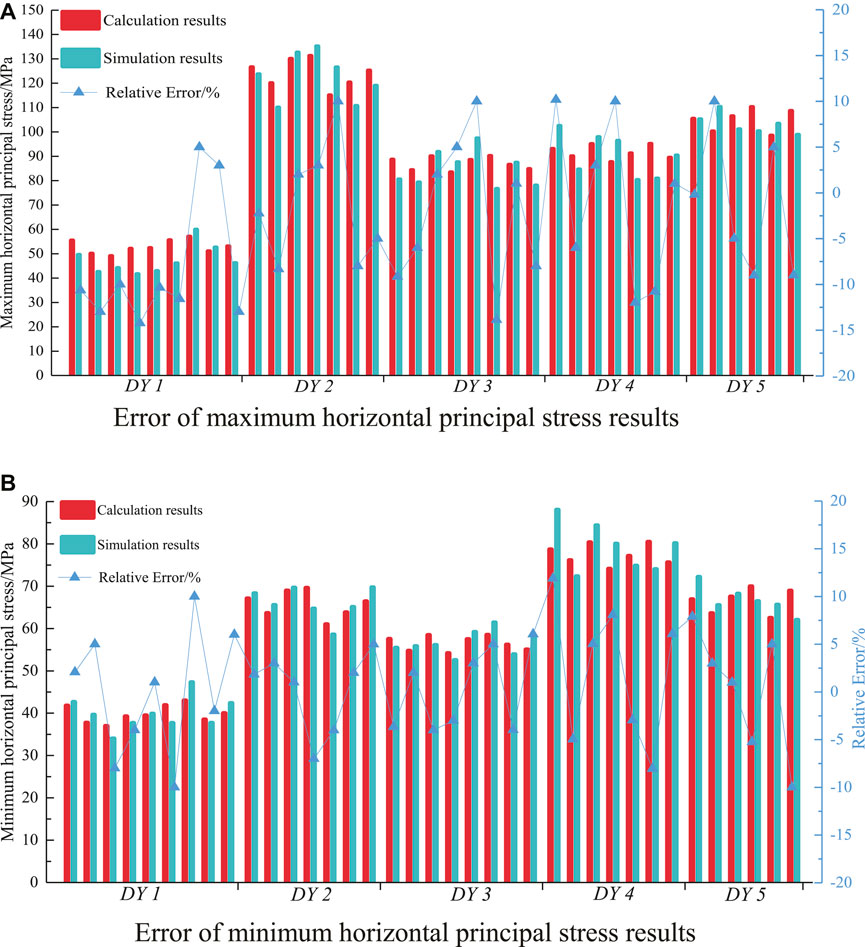
FIGURE 12. Comparison of horizontal principal stress results based on simulation and calculation. (A) Error of maximum horizontal principal stress results. (B) Error of minimum horizontal principal stress results.
Conclusion
1) The fracture extension directions of the Longmaxi formation in the Dingshan structure were mainly NWW, NE, approx. SN, and NNW, and the fracture development was relatively poor. The seismic interpretation results show that the structural pattern of the Longmaxi formation was high in the east and low in the west, mainly developing NE-SW, NNW-SSE fault systems and a small number of near-SN fault systems, mainly reverse faults. The implies that the area was mainly affected by tectonic compression and consistent with the in-situ stress distribution.
2) The maximum PHS in the study area varied within the range from 63.0 to 127.0 MPa, and the minimum PHS ranged from 48.0 to 109.0 MPa. The maximum and minimum PHS directions coincided with NE-SW and NW-SE lines, respectively. The northwest part of the study area was higher than the southeast one, and the PHS magnitude variation was directional. The maximum PHS and minimum PHS exhibited a certain correlation with the strata depth. The maximum PHS direction in the study area slightly deviated from the NE-SW direction to the near-EW direction. The minimum PHS direction coincided with the NW-SE line. The respective directions of DY3, DY2, and DY1 wells exhibited a systematic deviation from the north to the west, while that of the DY4 well deflected from the north to the east.
Data Availability Statement
The data used for supporting the conclusion of this article are available from the corresponding authors upon request.
Author Contributions
All authors contributed to this paper. QL prepared and edited the manuscript. QL and QF substantially contributed to the data analysis and revised the article. KY, QW, HL, and HW reviewed the manuscript and processed the investigation during the research process.
Funding
This study was supported by the Institute of Energy, Hefei Comprehensive National Science Center under Grant No.19KZS203, the Science and Technology Research Project of the Exploration Branch of Sinopec Group (35450003-19-zc0613-0002), the Natural Science Foundation of Anhui Province(1708085ME133), Chinese Excellent Young Talents Support Program Project in Universities (gxyq-ZD2019025), Graduate Innovation Fund Project of Anhui University of Science and Technology of China (2020CX1002).
Conflict of Interest
Author QW was employed by the company Sinopec Exploration Company.
The remaining authors declare that the research was conducted in the absence of any commercial or financial relationships that could be construed as a potential conflict of interest.
Publisher’s Note
All claims expressed in this article are solely those of the authors and do not necessarily represent those of their affiliated organizations, or those of the publisher, the editors and the reviewers. Any product that may be evaluated in this article, or claim that may be made by its manufacturer, is not guaranteed or endorsed by the publisher.
References
Bai, X., Zhang, D.-m., Wang, H., Li, S.-j., and Rao, Z. (2018). A Novel In Situ Stress Measurement Method Based on Acoustic Emission Kaiser Effect: a Theoretical and Experimental Study. R. Soc. Open Sci. 5, 181263. doi:10.1098/rsos.181263
Bell, J. S. (1996). Petro Geoscience 2. In Situ Stresses in Sedimentary Rocks (Part 2): Applications of Stress Measurements. Geosci. Can. 23, 135–153.
Chen, X., Wang, R., Huang, W., Jiang, Y., and Yin, C. (2018). Clustering-based Stress Inversion from Focal Mechanisms in Microseismic Monitoring of Hydrofracturing. Geophys. J. Int. 215, 1887–1899. doi:10.1093/gji/ggy388
Ciftci, N. B. (2013). In-situ Stress Field and Mechanics of Fault Reactivation in the Gediz Graben, Western Turkey. J. Geodynamics 65, 136–147. doi:10.1016/j.jog.2012.03.006
Dubey, V., Abedi, S., and Noshadravan, A. (2021). A Multiscale Modeling of Damage Accumulation and Permeability Variation in Shale Rocks under Mechanical Loading. J. Pet. Sci. Eng. 198, 108123. doi:10.1016/j.petrol.2020.108123
Fu, Q., Liu, Q.-j., and Yang, K. (2021). Optimization Inversion Analysis of a Geo-Stress Field in a Deep Mine Area: a Case Study. Arab J. Geosci. 14, 1–11. doi:10.1007/s12517-021-06880-3
Han, D., Wang, H., Wang, C., Yuan, W., Zhang, J., Lin, W., et al. (2021). Differential Characterization of Stress Sensitivity and its Main Control Mechanism in Deep Pore-Fracture Clastic Reservoirs. Sci. Rep. 11, 7374. doi:10.1038/s41598-021-86444-3
Han, H. X., Yin, S., and Aadnoy, B. S. (2018). Impact of Elliptical Boreholes on In Situ Stress Estimation from Leak-Off Test Data. Pet. Sci. 15, 794–800. doi:10.1007/s12182-018-0248-8
Hashimoto, C., and Matsu'Ura, M. (2006). 3-D Simulation of Tectonic Loading at Convergent Plate Boundary Zones: Internal Stress fields in Northeast Japan. Pure Appl. Geophys. 163, 1803–1817. doi:10.1007/s00024-006-0098-y
He, S., Wang, W., Zhou, J., Huang, Z., and Tang, M. (2015). A Model for Analysis of Wellbore Stability Considering the Effects of Weak Bedding Planes. J. Nat. Gas Sci. Eng. 27, 1050–1062. doi:10.1016/j.jngse.2015.09.053
Hu, W. G., Li, F. G., Fan, C. H., and Zhou, Z. Z. (2019). Prediction and Evaluation of marine Deep Shale Gas Reservoirs in Sichuan Basin: a Case Study of Dingshan Area. Nat. gas exploration Dev. 42, 66–77. doi:10.12055/gaskk.issn.1673-3177.2019.03.008
Jang, H., Lee, J., and Lee, J. (2015). Effect of Fracture Design Parameters on the Well Performance in a Hydraulically Fractured Shale Gas Reservoir. Energy Exploration & Exploitation 33, 157–168. doi:10.1260/0144-5987.33.2.157
Kim, T. H., and Lee, K. S. (2015). Pressure-transient Characteristics of Hydraulically Fractured Horizontal wells in Shale-Gas Reservoirs with Natural- and Rejuvenated-Fracture Networks. J. Can. Pet. Tech. 54, 245–258. doi:10.2118/176027-PA
Li, Y., Fu, S., Qiao, L., Liu, Z., and Zhang, Y. (2019). Development of Twin Temperature Compensation and High-Level Biaxial Pressurization Calibration Techniques for CSIRO In-Situ Stress Measurement in Depth. Rock Mech. Rock Eng. 52, 1115–1131. doi:10.1007/s00603-018-1618-7
Liu, H., Cui, S., Meng, Y., Zhao, X., and Han, X. (2019). Influence of Relation between Stress Field and Bedding Space on Wellbore Stability in Shale Formation. Arab J. Geosci. 12, 629. doi:10.1007/s12517-019-4727-z
Liu, J., Ding, W., Wang, R., YinYang, S. H., Yang, H., and Gu, Y. (2017a). Simulation of Paleotectonic Stress fields and Quantitative Prediction of Multi-Period Fractures in Shale Reservoirs: A Case Study of the Niutitang Formation in the Lower Cambrian in the Cen'gong Block, South China. Mar. Pet. Geology. 84, 289–310. doi:10.1016/j.marpetgeo.2017.04.004
Liu, J., Ding, W., Yang, H., Wang, R., Yin, S., Li, A., et al. (2017b). 3D Geomechanical Modeling and Numerical Simulation of In-Situ Stress fields in Shale Reservoirs: A Case Study of the Lower Cambrian Niutitang Formation in the Cen'gong Block, South China. Tectonophysics 712-713, 663–683. doi:10.1016/j.tecto.2017.06.030
Liu, J., He, Z.-l., Liu, X.-w., Huo, Z.-z., and Guo, P. (2019). Using Frequency-dependent AVO Inversion to Predict the "sweet Spots" of Shale Gas Reservoirs. Mar. Pet. Geology. 102, 283–291. doi:10.1016/j.marpetgeo.2018.12.039
Liu, S., Ma, W., Jansa, L., Huang, W., Zeng, X., and Zhang, C. (2013). Characteristics of the Shale Gas Reservoir Rocks in the Lower Silurian Longmaxi Formation, East Sichuan Basin, China. Energy Exploration & Exploitation 31, 187–219. doi:10.1260/0144-5987.31.2.187
Liu, S., Yang, Y., Deng, B., Zhong, Y., Wen, L., Sun, W., et al. (2021). Tectonic Evolution of the Sichuan basin, Southwest China. Earth-Science Rev. 213, 103470. doi:10.1016/j.earscirev.2020.103470
Ljunggren, C., Chang, Y., Janson, T., and Christiansson, R. (2003). An Overview of Rock Stress Measurement Methods. Int. J. Rock Mech. Mining Sci. 40, 975–989. doi:10.1016/j.ijrmms.2003.07.003
Lü, J., Zhou, W., Xie, R., Shan, Y., Zhang, C., and Xu, H. (2017). Three-dimensional In Situ Stress-Field Simulations of Shale Gas Formations: A Case Study of the 5th Member of the Xujiahe Formation in the Xinchang Gas Field, West Sichuan Depression. Acta Geologica Sinica - English Edition 91, 617–629. doi:10.1111/1755-6724.13121
Nian, T., Wang, G., Xiao, C., Zhou, L., Sun, Y., and Song, H. (2016). Determination of In-Situ Stress Orientation and Subsurface Fracture Analysis from Image-Core Integration: an Example from Ultra-deep Tight sandstone (BSJQK Formation) in the Kelasu Belt, Tarim Basin. J. Pet. Sci. Eng. 147, 495–503. doi:10.1016/j.petrol.2016.09.020
Rajabi, M., Tingay, M., and Heidbach, O. (2016). The Present-Day State of Tectonic Stress in the Darling Basin, Australia: Implications for Exploration and Production. Mar. Pet. Geology. 77, 776–790. doi:10.1016/j.marpetgeo.2016.07.021
Ren, W., and Lau, H. C. (2020). Analytical Modeling and Probabilistic Evaluation of Gas Production from a Hydraulically Fractured Shale Reservoir Using a Quad-Linear Flow Model. J. Pet. Sci. Eng. 184, 106516. doi:10.1016/j.petrol.2019.106516
Sun, F., Yao, Y., Li, X., Li, G., Miao, Y., Han, S., et al. (2018). Flow Simulation of the Mixture System of Supercritical CO2 & Superheated Steam in Toe-point Injection Horizontal Wellbores. J. Pet. Sci. Eng. 163, 199–210. doi:10.1016/j.petrol.2017.12.085
Wang, R., Hu, Z., Long, S., Liu, G., Zhao, J., Dong, L., et al. (2019). Differential Characteristics of the Upper Ordovician‐Lower Silurian Wufeng‐Longmaxi Shale Reservoir and its Implications for Exploration and Development of Shale Gas In/around the Sichuan Basin. Acta Geologica Sinica ‐ English Edition 93, 520–535. doi:10.1111/1755-6724.13875
Yin, Z., Chen, W., Hao, H., Chang, J., Zhao, G., Chen, Z., et al. (2020). Dynamic Compressive Test of Gas-Containing Coal Using a Modified Split Hopkinson Pressure Bar System. Rock Mech. Rock Eng. 53, 815–829. doi:10.1007/s00603-019-01955-w
Yong, T., Fan, Y., Lv, Q. Q., Tang, W. J., and Wang, H. K. (2018). Analysis of the Tectonic Stress Field of SE Sichuan and its Impact on the Preservation of Shale Gas in Lower Silurian Longmaxi Formation of the Dingshan Region, China. J. Geol. Soc. India 92, 92–100. doi:10.1007/s12594-018-0957-z
Zeng, L., Wang, H., Gong, L., and Liu, B. (2010). Impacts of the Tectonic Stress Field on Natural Gas Migration and Accumulation: A Case Study of the Kuqa Depression in the Tarim Basin, China. Mar. Pet. Geology. 27, 1616–1627. doi:10.1016/j.marpetgeo.2010.04.010
Zhang, G. Z., Chen, J. J., Chen, H. Z., Ma, Z. G., and Yin, X. Y. (2015). Prediction for In-Situ Formation Stress of Shale Based on Rock Physics Equivalent Model. Chin. J. Geophysics- Chin. Edition 58, 2112–2122. doi:10.6038/cjg20150625
Zhao, X. G., Wang, J., Qin, X. H., Cai, M., Su, R., He, J. G., et al. (2015). In-situ Stress Measurements and Regional Stress Field Assessment in the Xinjiang Candidate Area for China's HLW Disposal. Eng. Geology. 197, 42–56. doi:10.1016/j.enggeo.2015.08.015
Keywords: shale formation, hydraulic fracturing, in-situ stress field, geomechanical model, inversion analysis
Citation: Liu Q, Fu Q, Yang K, Wei Q, Liu H and Wu H (2022) Geomechanical Modeling and Inversion Analysis of the in-situ Stress Field in Deep Marine Shale Formations: A Case Study of the Longmaxi Formation, Dingshan Area, China. Front. Earth Sci. 9:808535. doi: 10.3389/feart.2021.808535
Received: 03 November 2021; Accepted: 27 December 2021;
Published: 15 February 2022.
Edited by:
Yilin Gui, Queensland University of Technology, AustraliaCopyright © 2022 Liu, Fu, Yang, Wei, Liu and Wu. This is an open-access article distributed under the terms of the Creative Commons Attribution License (CC BY). The use, distribution or reproduction in other forums is permitted, provided the original author(s) and the copyright owner(s) are credited and that the original publication in this journal is cited, in accordance with accepted academic practice. No use, distribution or reproduction is permitted which does not comply with these terms.
*Correspondence: Qiang Fu, ZnF5bWNAYXVzdC5lZHUuY24=