 Jie Chen1,2
 Thomas Stevens2Taibao Yang3*Mingrui Qiang1Gennady Matishov4Evgeny Konstantinov5Redzhep Kurbanov6Biao Zeng3Peihong Shi7
- 1School of Geography, South China Normal University, Guangzhou, China
- 2Department of Earth Sciences, Uppsala University, Uppsala, Sweden
- 3Institute of Glaciology and Ecogeography, College of Earth and Environmental Sciences, Lanzhou University, Lanzhou, China
- 4Southern Scientific Center, Russian Academy of Sciences, Rostov-on-Don, Russia
- 5Institute of Geography, Russian Academy of Sciences, Moscow, Russia
- 6Faculty of Geography, Lomonosov Moscow State University, Moscow, Russia
- 7College of Tourism and Environment, Shaanxi Normal University, Xi’an, China
Loess-paleosol sequences are the most intensively studied terrestrial archives used for the reconstruction of Late Pleistocene environmental and climatic changes in the Azov Sea region, southwest Russia. Here we present a refined chronostratigraphy and a multiproxy record of Late Pleistocene environmental dynamics of the most complete and representative loess–paleosol sequences (Beglitsa and Chumbur-Kosa sections) from the Azov Sea region. We propose a new chronostratigraphy following the Chinese and Danubean loess stratigraphic models that refines the subdivision of the Last Interglacial paleosol (S1) complex in two Azov Sea sites, resolve the uncertainty of the stratigraphic position of the weakly developed paleosol (L1SSm) in Beglitsa section, and allow for direct correlation of the Azov Sea sections with those in the Danube Basin and the Chinese Loess Plateau. More importantly, it may serve as a basis for better constraining local and regional chronostratigraphic correlations, and facilitate the interpretation of climatic connections and possible forcing mechanisms responsible for the climatic trends in the region. In addition, a general succession of environmental dynamics is reconstructed from these two vital sections, which is broadly consistent with other loess records in the Dnieper Lowland and Lower Danube Basin, demonstrating similar climatic trends at Glacial–Interglacial time scales. Furthermore, our results have important implications for the chronostratigraphic representativeness of Beglitsa as a key regional loess section and for the reconstruction of the temporal and spatial evolution of Late Pleistocene climate in the Azov Sea region.
Introduction
The loess–paleosol sequences (LPSs) of the Azov Sea in Eastern Europe–Western Russia are extensively distributed terrestrial deposits that preserve detailed evidence of past climatic and environmental changes in the region. However, they are also among the least well known and understood relative to loess deposits from elsewhere in Europe (Smalley et al., 2009; Schaetzl et al., 2018). The thickness of individual LPS varies between a few meters to several tens of meters, demonstrating multiple alternating series of loess and paleosol that indicate different environmental conditions extending through the mid Pleistocene to the present (Velichko, 1990; Dodonov et al., 2006; Velichko et al., 2009a).
Unlike the more uniform LPS further west in central Europe and further east in central Asia, Azov loess deposits and underlying alluvial/marine sediments contain small mammal faunas that are typically distributed along the Azov Sea shorelines, providing an important marker for bio-stratigraphic correlation between the continental and marine deposits (Dodonov et al., 2000; Dodonov et al., 2006). These fossil assemblages are also a vital advantage for the establishment of loess chronostratigraphy (Tesakov et al., 2007). Therefore, previous research on LPS of the Azov Sea was mainly focused on paleosol identification and stratigraphic subdivision at individual sites based on faunal composition of small mammals from alluvial/marine deposits and overlying buried soils (Dodonov et al., 2000; Markova, 2005; Markova, 2007; Tesakov et al., 2007; Velichko et al., 2009b; Sotnikova and Titov, 2009). In addition, a common way to establish the age of LPS horizons is based on stratigraphic correlations with previously dated paleosols known from regions farther north on the East European Plain (Dlussky, 2007; Chen et al., 2018a; Sycheva et al., 2020), or via patterns in the mineral magnetic characteristics of the LPS in the Black Sea and Azov Sea region (Dodonov et al., 2006; Velichko et al., 2009b; Panin et al., 2018). The latter approach of using magnetic variation in stratigraphic correlation is also widely applied elsewhere in Europe, such as the Danube Basin region (Buggle et al., 2009; Fitzsimmons et al., 2012; Marković et al., 2015; Sümegi et al., 2018) and the East European Plain (Rutter et al., 2003; Velichko et al., 2006; Hlavatskyi and Bakhmutov, 2020).
Generally, there are several stratigraphic models based on associations with marine isotope stages (MISs) that have been accepted in LPS records of the East European Plain. For detailed comparisons between these models see the illustrations in Velichko et al. (2011) and Zastrozhnov et al. (2018). It is worth noting that significant differences arise in the period between MIS 13 and 5 as a result of the unsatisfactory absolute chronology, as such the differences in models during the Late Pleistocene depends on choice paleosol corresponding to MIS 5 (Table 1). In addition, the nomenclatures for paleosol and loess at different horizons were usually derived from local place names or different research groups (Table 1), resulting in confusion and making correlation between sections difficult. These nomenclatures developed independently of one another and are substantially limiting for further research where these sequences are put into a wider context (Schaetzl et al., 2018; Krijgsman et al., 2019).
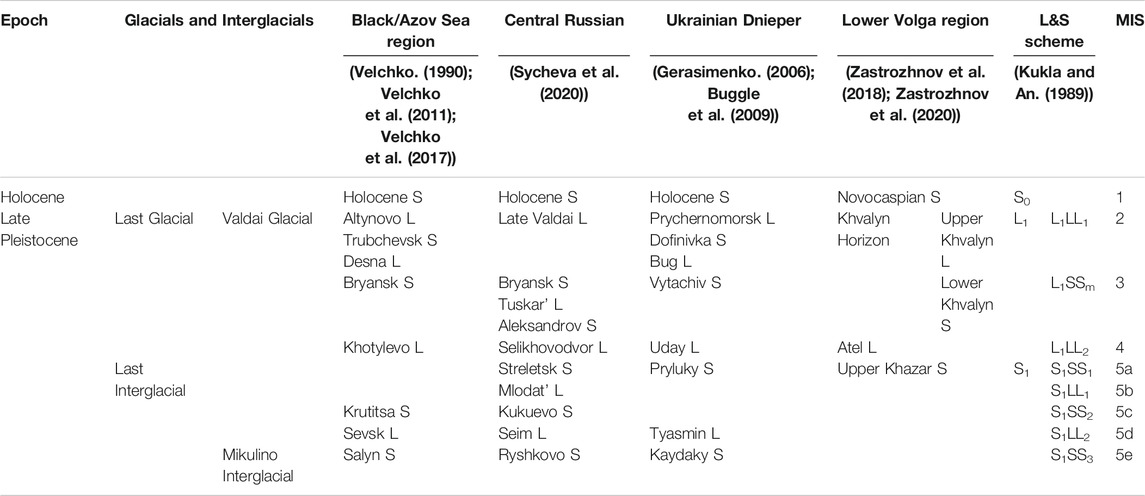
TABLE 1. Existing loess stratigraphic models with different nomenclatures on the East European Plain and correlations with L&S (loess and soil) stratigraphic nomenclatures initially presented by Kukla and An (1989) and marine isotope stages (MISs) since the Late Pleistocene.
The existing loess stratigraphy of Azov Sea region was developed to a great extent based on a correlation between paleosols of the Azov Sea region and general stratigraphic schemes of East European Plain. As a consequence, there is inevitably the same challenge as witnessed in the general stratigraphic schemes of East European Plain. However, in spite of the difficulties mentioned above, it is still possible to establish a reliable stratigraphic model for LPS in the Azov Sea region. Supported by additional chronological approaches such as radiocarbon and luminescence dating, the record of alternation between loess and paleosol, clearly represented by multiple proxy variations including physical and geochemical parameters, allows for direct inter-section correlations from the Central Russian Upland to the Black/Azov Sea region. For instance, Chen et al. (2018a, b) applied optically stimulated luminescence (OSL) dating combined with magnetic susceptibility (MS) variations to develop a preliminary stratigraphic framework on two sections of the Azov Sea.
Moreover, a general succession of the Azov Sea area environmental changes at different timescales has been revealed by multiple paleoclimate proxy records from Azov LPS including MS and grain size (GS) variations (Velichko et al., 2009a; Liang et al., 2016; Chen et al., 2018b; Timireva et al., 2021), mammal faunal composition (Tesakov et al., 2007; Velichko et al., 2009b; Markova and Vislobokova, 2016), pollen and diatom assemblages (Matishov et al., 2013), and paleosol macro- and micromorphology (Panin et al., 2018). This integrated approach using multiproxy records has resulted in considerable progress in the understanding of paleoenvironmental changes recorded in the loess of the Azov Sea area despite being embedded in the poorly defined chronostratigraphy.
As such, it is now essential to better revisit the LPS chronostratigraphy of the Azov Sea region, hopefully providing opportunities not only to develop accurate past environmental reconstruction in the region but also to develop a complete and unified stratigraphic model that is comparable across loess of the whole European continent. The main purpose of this study is therefore to further refine the LPS stratigraphy of the Azov Sea region using a combined approach that involves reevaluation of previous absolute dating results and comparison of new climate proxies, mainly focusing on the Late Pleistocene and Holocene. It is then followed by a reconstruction of past environmental dynamics. Moreover, we followed the loess and soil stratigraphic nomenclature that has been already well accepted for Chinese and Danubean loess stratigraphy (Kukla and An, 1989; Marković et al., 2015; Schaetzl et al., 2018) and chose two representative sections that are located in different areas of the Azov Sea. The adoption of the refined chronostratigraphic scheme here offers potential for providing an important link to other regional LPS, even across the whole European continent, supporting a key record for comparison of the Black/Azov Sea Quaternary stratigraphy with the Danube loess model, and enabling better understanding of temporal and spatial variability in environmental changes during the Late Quaternary (Marković et al., 2015; Sümegi et al., 2018).
Study area
The Azov Sea (45°∼47°N, 35°∼39°E) is one of the smallest seas in the world, with an average depth of 7 m up to a maximum value of 14 m, as well as a water surface area of 39,000 km2 and water volume of 290 km3 (Kosarev et al., 2007). It is an internal sea connected with the Black Sea via the narrow (up to 4 km) and shallow (up to 15 m) Kerch Strait (Figure 1). There are two primary rivers feeding into the sea, the Don and Kuban rivers, which account for more than 90% inflow volume. In the northeast, the largest bay, the Taganrog Gulf, penetrates into the land and coincides with the delta of the Don river. In the southeast, the Kuban river has vast alluvial plains and numerous channels extending over several tens of kilometers.
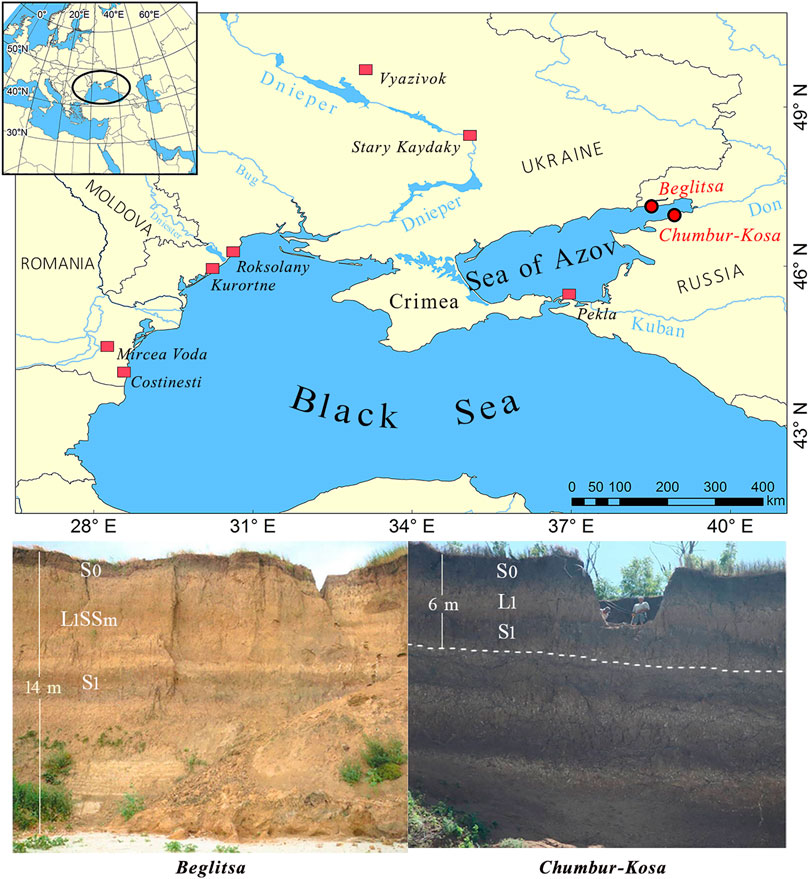
FIGURE 1. Study region and location of the investigated loess–paleosol sequences (LPSs) in this study indicated with red solid circles and other important LPSs mentioned in the main text represented by red solid rectangles. Photographs of the studied LPS sections are also shown.
The present-day climate of the Azov Sea is temperate-continental, with distinct seasonality and occasional dry periods. It is characterized by mild and cold winters and warm, relatively dry summers. Easterly and northeasterly winds with speeds of 4–7 m s−1 and up to a maximum value of 15 m s−1 prevail in the autumn–winter period due to influence of a spur of the Siberian High anticyclone (Kosarev et al., 2007). The mean January temperature ranges from −5°C to 0°C (Matishov et al., 2013). In the spring–summer period, there are occasionally west and southwest winds with speeds of 4–6 m s−1 resulting from Mediterranean cyclonic systems passing over the sea. The mean monthly temperature in July is 22°C –24°C (Matishov et al., 2013). The Azov region receives, on average, ∼580 mm of precipitation annually, which is unevenly distributed over the year. It can reach up to ∼120 mm per month in winter (December, January) and early summer (May, June), compared with ∼30 mm or more in other months (Panin et al., 2018). Such a climatic context develops a typical vegetation assemblage and steppe environment, which is presently dominated by stipa and sheep fescue (Matishov et al., 2013).
Materials and Methods
Section Description and Sampling
The most extensive loess deposits are along the coastal area of the Azov Sea, in particular, the Taganrog Gulf. The Beglitsa (47°07′38″N, 38°30′56″E) and Chumbur-Kosa (46°57′48″N, 38°56′47″E) loess sections under study are situated on the northern and southern shores of the Taganrog Gulf, respectively (Figure 1). The Beglitsa section has an outcrop thickness of approximately 14 m, compared with ∼16 m of the Chumbur-Kosa section. Both sections have several visible paleosols intercalated by loess horizons (Figure 1). Detailed pedostratigraphic descriptions and main paleosol macro- and micromorphology features for the two sections are presented by Chen et al. (2018a, b) and Panin et al. (2018). Bulk samples were collected continuously at 2-cm intervals for the Beglitsa and 5-cm intervals for the Chumbur-Kosa from the top to the base of the section, respectively. These samples were then used for physical and geochemical analyses, as outlined below.
Climate Proxies and Measurement Methods
Generally, the cyclicity of alternating high and low MS values between paleosols and loess units is indicative of the intensity of soil forming processes between Interglacial (interstadial) and Glacial periods, likely as a result of the pedogenetically formed fraction of fine ferrimagnetic minerals yielding higher MS values for paleosols in relation to loess units (Zhou et al., 1990; Maher et al., 2003). Thus, trends in MS are often used for establishing magnetostratigraphy in European loess (Basarin et al., 2014; Song et al., 2018) and considered as reliable paleoclimate proxies to directly reflect climatically controlled soil formation variations (e.g., Buggle et al., 2014; Necula et al., 2015). Especially, the χfd% is a main magnetic parameter that has been widely applied in MS as a sensitive indicator of ultrafine magnetic grains, increasing amounts of which also influence χlf (Dearing et al., 1996). In this study, the MS was measured at frequencies of 0.47 and 4.7 kHz in a static field of 300 mA m−1 using a Bartington MS2 susceptibility meter. Final MS is calculated from three measurements and expressed as low-frequency (0.47 kHz, χlf) and high-frequency (4.7 kHz, χhf) mass-specific MS in m3 kg−1. In addition, the frequency-dependent MS (χfd%) was also determined as χfd% = (χlf − χhf)/χlf × 100%.
GS is a complex but important proxy in LPS for the reconstruction of eolian processes and wind circulation patterns, providing insights into characterizing different transport dynamics and relating to different depositional environments (Vandenberghe, 2013; Újvári et al., 2016; Chen et al., 2020). The GS was measured on a Malvern Mastersizer 2000 laser particle analyzer with a measurement range of 0.02 μm–2 mm. Bulk samples of 0.5 g were pretreated with successive procedures such as organic matter oxidation, carbonate dissolution, and particle dispersion prior to measurement. Clay is represented with grain size smaller than 5 μm since there is potential underestimation by the laser diffraction method in comparison with the traditional pipette method (Konert and Vandenberghe, 1997; Beuselinck et al., 1998). This is also in agreement with other published clay fractions in southeastern European loess sections (Obreht et al., 2014; Bösken et al., 2019; Chen et al., 2020). Fine silt is then expressed from 5 to 20 μm, coarse silt from 20 to 50 μm, and sand greater than 50 μm, respectively.
As the most visible difference between loess and paleosol in the field, changes in color are regarded as the most striking features of LPS. Thus, variations in color index have been commonly used to characterize different loess/paleosol horizons and further related to the intensity of pedogenesis in a more quantitative way (Basarin et al., 2011; Buggle et al., 2014; Panin et al., 2018). For measurements, dried and homogenized sediment samples were used to determine the color index using a X-Rite 948 spectrophotometer under standardized observation conditions (10° Standard Observer, 8 mm aperture, Illuminant C). Measured values were then represented in the form of the lightness, redness, and yellowness using the CIELAB color system (L*, a*, b*).
The carbonate content (CaCO3%) and the total organic carbon content (TOC) can also be used as environmental proxies in LPS studies since they are indicative of physical–chemical characteristic variation between loess and paleosol horizons under different climate conditions (Velichko et al., 2009a; Basarin et al., 2011; Liang et al., 2016). In the present study, the CaCO3% was measured using the calcimeter method of Bascomb (1961). Pretreatment procedure is the same as described by Fang et al. (1999). Due to the difficulty in separating the relative content of primary and secondary carbonate, it is important to note that the carbonate content includes both here. The TOC was determined by using the H2SO4–K2CrO7 oxidation method, following the procedure of Zhou et al. (1996).
As these climatic proxies with broadly accepted environmental significance and widely adopted in European loess (e.g., Bokhorst et al., 2011; Rousseau et al., 2011; Vandenberghe, 2013; Marković et al., 2015; Zeeden et al., 2016), we, hence, measured the MS, GS, soil color (L*, a*, b*), CaCO3%, and TOC to better characterize loess/paleosol horizons and reveal paleoclimatic and paleoenvironmental conditions in the Azov Sea region. All climatic proxies above were measured at the College of Earth and Environmental Sciences, Lanzhou University. Data analyses were implemented at both the School of Geography, South China Normal University, and the Department of Earth Sciences, Uppsala University.
Results
Combined with OSL ages and MS variations, Chen et al. (2018a, b) developed preliminary stratigraphic schemes for these two sections extending over the last full Glacial–Interglacial cycle (Supplementary Figure S1). However, this chronostratigraphy still needs to be further refined due to adopting several suboptimal ages that might exceed the upper limit of quartz OSL dating range and only individual MS proxy correlation. Detailed discussion on maximum age of quartz OSL dating and methodological errors of the dating procedure responsible for potential underestimation of these ages can be found in Chen et al. (2018a). Even so, the initial results showed that the whole ∼11 m of the Beglitsa section formed since marine isotope stage (MIS) 5 (Chen et al., 2018a), while only the upper ∼5 m of the Chumbur-Kosa section corresponds to the same period (Chen et al., 2018b). For better comparison, we, hence, present here the whole 14 m of the Beglitsa section and the upper 6 m of the Chumbur-Kosa section for investigation, which both covers the Holocene soil, the entire sequence of Last Glacial loess, the entire sequence of Last Interglacial soil complex, and the very upper part of the penultimate Glacial loess.
The χlf varies along the section between 4.12 and 58.46 × 10⁻⁸ m3 kg−1 (average 21 × 10−8 m3 kg−1) in Beglitsa and between 9.13 and 39.26 × 10⁻⁸ m3 kg−1 (average 22.43 × 10⁻⁸ m3 kg−1) in Chumbur-Kosa, respectively. In addition, the average χfd% is 6.82% in Beglitsa and 5.39% in Chumbur-Kosa. The MS record of two sections generally follows the pedostratigraphy, being enhanced in the paleosols compared with the loess units (Figure 2). However, there are also some stratigraphic paleosols that are visually discriminated in the field, while χlf and χhf do not significantly increase, such as depth intervals of 9.0–8.3 and 4.5–3.2 m of the Beglitsa section (Figure 2). This perhaps implies varying control on MS enhancement in the Beglitsa section.
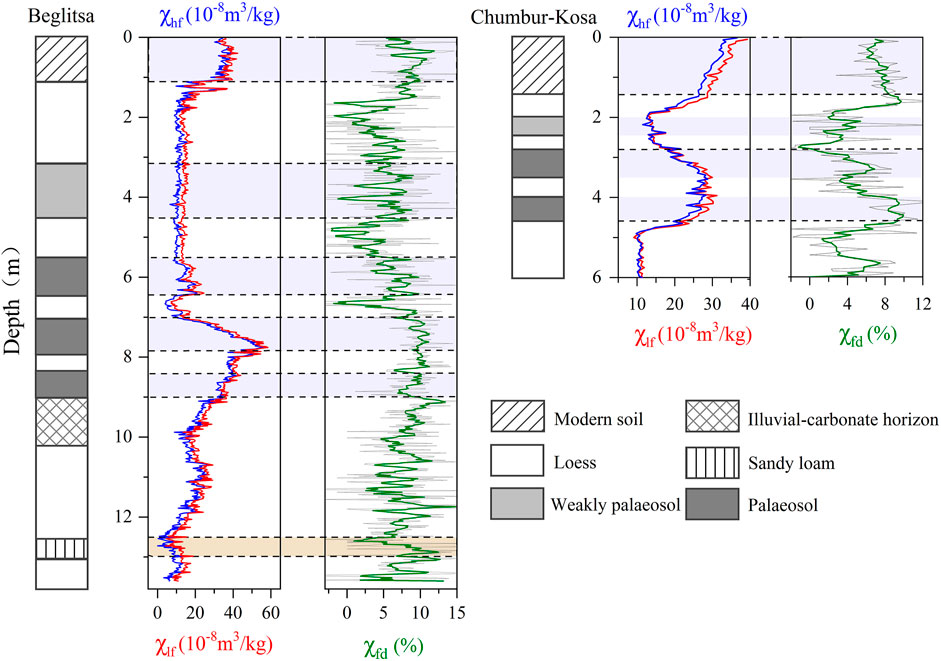
FIGURE 2. Magnetic susceptibility(MS) variations in the Beglitsa and Chumbur-Kosa sections. The blue line represents χhf, the red line denotes χlf, and the green line is indicative of χfd%, respectively (the χfd% data have been smoothed by five points using adjacent-averaging method).
Contents of fine silts (5–20 μm) range from 26.41% to 66.58% in Beglitsa and from 36.07% to 66.26% in Chumbur-Kosa, then followed by coarse silt, clay, and sand fractions (Figure 3). Similarly, variations of median grain size (MGS) are 10.75–42.53 μm (average 16.55 μm) in Beglitsa and 11.27–23.92 μm (average 16.05 μm) in the Chumbur-Kosa section (Figure 3). Both sand content and MGS are relatively stable except for some intervals featuring a marked peak, such as the sand horizon of the Beglitsa section and lower part around depth 5.5 m of the Chumbur-Kosa section (Figure 3). It is worth noting that the maximum MGS value in Beglitsa is much larger than that in Chumbur-Kosa due to the occurrence of this sand layer at a depth of 12.5–13.0 m of the Beglitsa section (Figure 3). In addition, the GS variations of two sections show little clear and consistent relationship to pedostratigraphy.
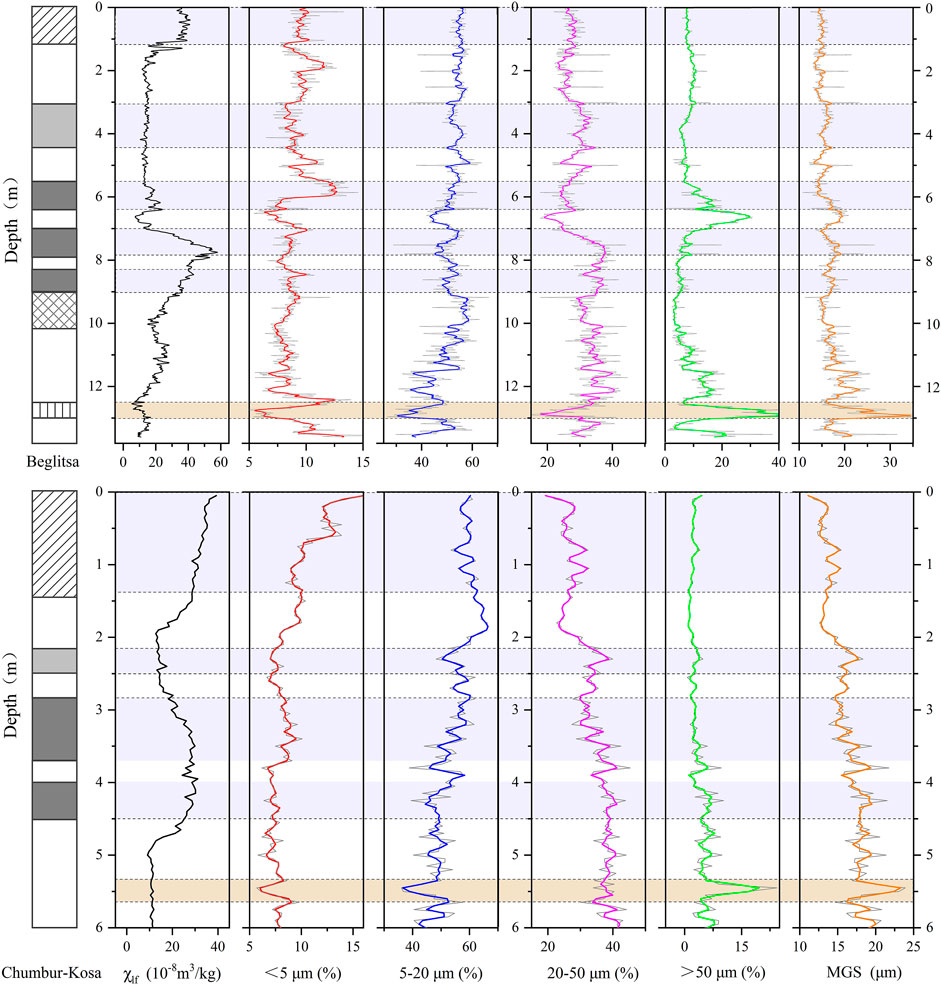
FIGURE 3. Variations in different grain size (GS) fractions and median grain size (MGS) of the Beglitsa and Chumbur-Kosa sections against χlf (all GS data have been smoothed by five points using adjacent-averaging method).
Three proxies (L*, a*, and b*) of color index show obvious variations that broadly match the pedostratigraphy of two sections, lightness L* in particular. This proxy (L*) generally exhibits lower values in paleosols and higher values in the intervening loess units, contrary to variations in MS (Figure 4). Values of L* for two sections fluctuate between 33.24 and 69.89 (Beglitsa), and 28.92 and 48.69 (Chumbur-Kosa), respectively. Notably, distinct fluctuations in L*can be observed approximately at a depth of 4 m at the Beglitsa section, compared with the subtle change in χlf and a* proxies at the same depth (Figure 4). It probably shows the sensitivity of this proxy to climate oscillations and potential to distinguish subordinate loess/paleosol horizons. Both a* and b* show broadly similar trends at the two sections (Figure 4).
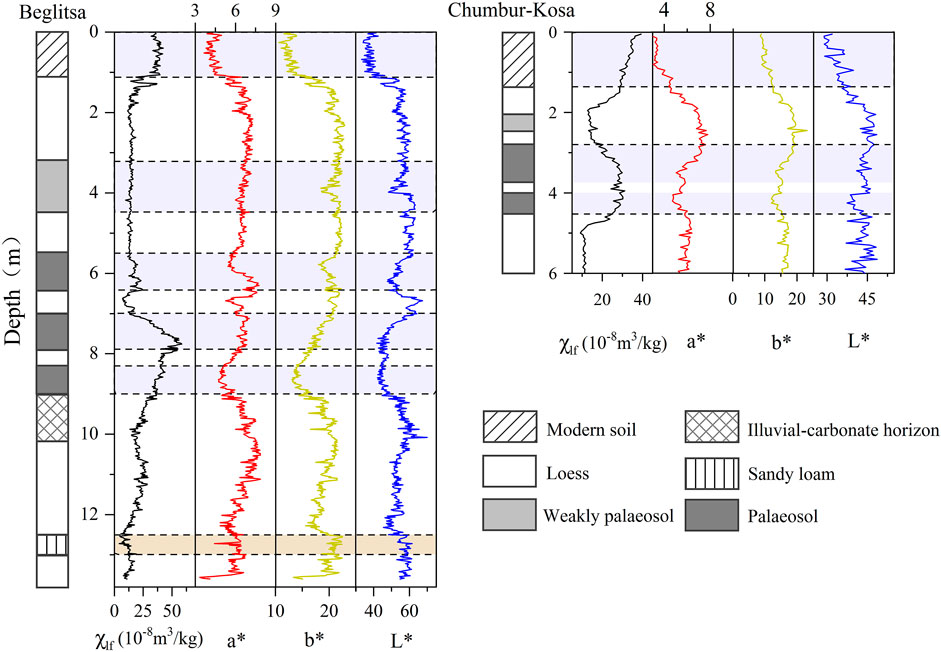
FIGURE 4. Color index (L*, a*, b*) against the χlf variations in the Beglitsa and Chumbur-Kosa sections.
With an average content of 12.59% for Beglitsa and 10.44% for Chumbur-Kosa over the whole sections in this study (Figure 5), CaCO3% shows several obvious peaks and troughs oscillations at two sections. The lowest CaCO3% interval (generally <10%) can be found within the paleosol at a depth of 6.4–5.5 m of the Beglitsa section, while a relatively higher CaCO3% (generally >10%) content is observed within the paleosols at depths of 9.0–8.3 and 8.0–7.0 m. These two enriched CaCO3% intervals within paleosols are even higher than those in the upper 6 m of loess horizons of the Beglitsa section (Figure 5). This phenomenon is probably caused by high precipitation leading to carbonate leaching from the above paleosol or loess horizons (Liang et al., 2016). Additionally, TOC proxy also manifests peaks (paleosol) and troughs (loess) along the pedostratigraphy (Figure 5). In general, these two proxies are in good agreement with pedostratigraphy.
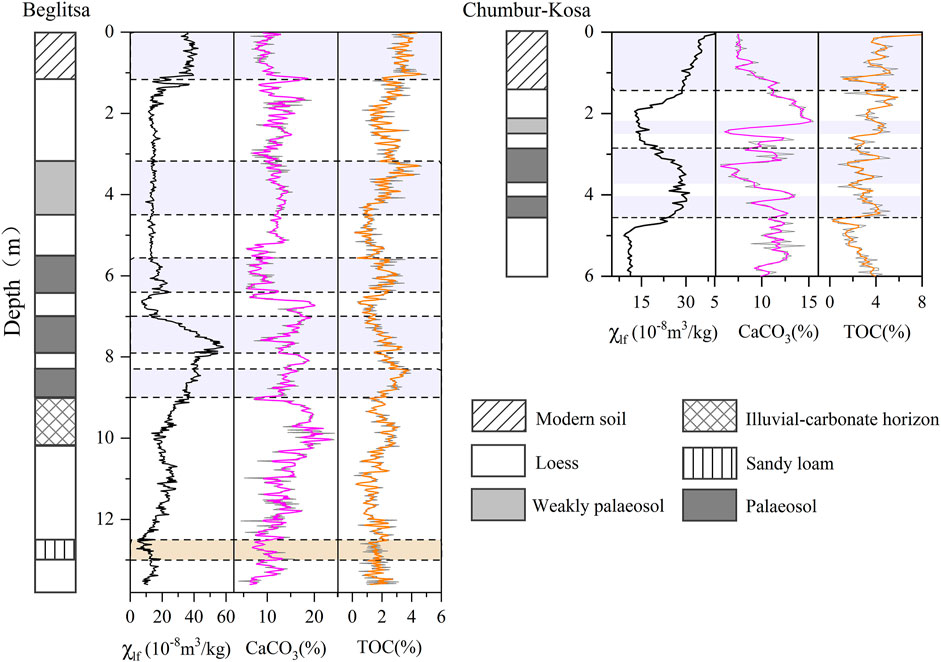
FIGURE 5. CaCO3% and total organic carbon content (TOC) proxies against χlf variations in the Beglitsa and Chumbur-Kosa sections (the CaCO3% and TOC data have been smoothed by five points using adjacent-averaging method).
Discussion
Refined Chronostratigraphy of Two Loess–Paleosol Sequence Sections at the Azov Sea
Figures 6 and 7 shows the refined chronostratigraphies of Beglitsa and Chumbur-Kosa sections, and correlations with the benthic LR04 stack records from Lisiecki and Raymo (2005). We here include further climatic proxies to better constrain the refined chronostratigraphy of these two sections. These new data enable constraints on the LPS sub-horizon phases, and correlations with Quaternary climate change archives and marine oxygen isotope stratigraphy.
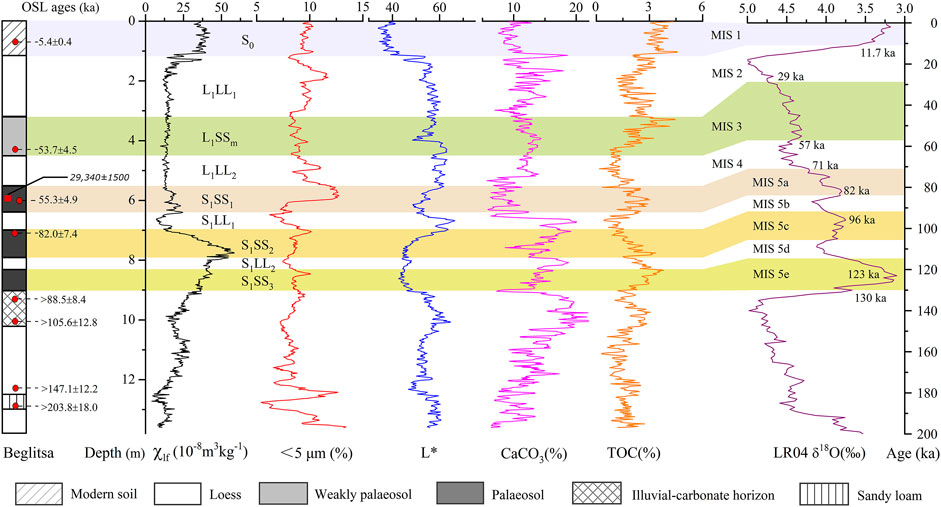
FIGURE 6. Refined chronostratigraphy of the Beglitsa section with published luminescence and radiocarbon ages, together with multiple climate proxies (the χlf, <5 μm, L*, CaCO3%, and TOC), and its correlation with benthic LR04 stack records from Lisiecki and Raymo (2005). Note that optically stimulated luminescence (OSL) and radiocarbon ages obtained by different researchers are illustrated with different forms: the red solid rectangle indicating radiocarbon age is derived from Velichko et al. (2017), and the red solid circles indicating luminescence ages are derived from Chen et al. (2018a).
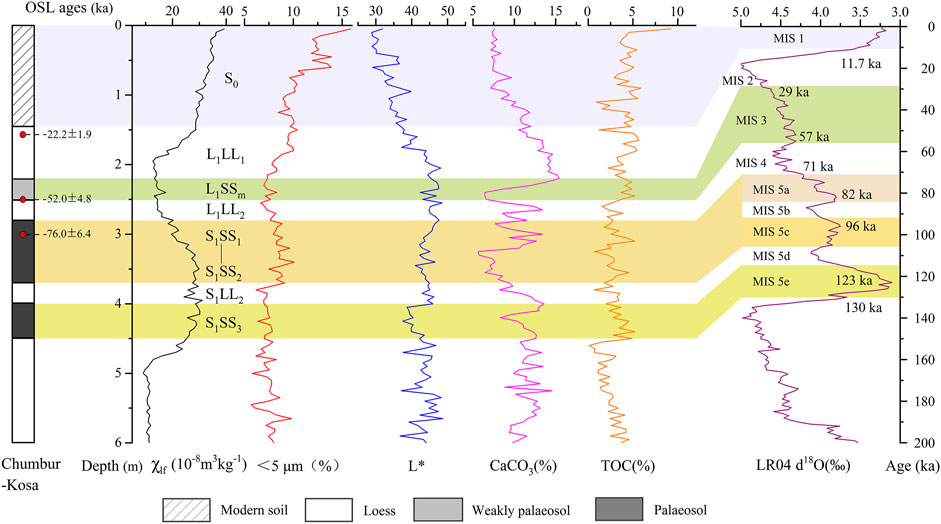
FIGURE 7. Refined chronostratigraphy of the Chumbur-Kosa section with luminescence ages and multiple climate proxies (the χlf, <5 μm, L*, CaCO3%, and TOC), and its correlation with benthic LR04 stack records from Lisiecki and Raymo (2005). The quartz OSL ages are derived from Chen et al. (2018b).
The Last Interglacial Soil Complex
There is one interval of strongest MS enhancement (9.0–5.5 m) located in the middle of the MS curve compared with the surrounding MS values showing a clear baseline at the Beglitsa section (Figures 2 and 6). Three well-developed paleosols (i.e., S1SS3, S1SS2, and S1SS3) are also observed within this interval (Figure 1). By contrast, the L* and CaCO3% proxy shows clearly opposing variations compared with χlf over the same interval. Similarly, other climate proxies, such as the clay content and TOC content, all exhibit peak and trough oscillations during this interval, although not as obviously as shown in the L* and CaCO3% proxies (Figure 6). These variable climate proxies between depths of 9.0 and 5.5 m at the Beglitsa section suggest instability of climatic conditions during this period and potential for subdivision within this paleosol.
There are ages older than 80 ka reported from the middle of the most enhanced MS interval and the underlying carbonate horizon (Chen et al., 2018a). In addition, two minimum OSL ages of 203.8 ± 18.0 and 147.1 ± 12.2 ka were obtained from the lowermost part of the sand layer (depth interval 13–12.5 m) and the base of the overlying loess unit, respectively (Figure 6). It is likely that quartz OSL ages are underestimated when equivalent doses exceed 200 Gy due to (near) saturation of the quartz OSL signal (Murray et al., 2007; Timar-Gabor et al., 2015). Thus, potential age underestimation may occur at lower layers of the Beglitsa section (Chen et al., 2018a). Similarly, a minimum feldspar IRSL age of 204 ka by Pilipenko et al. (2005, 2011) was reported from the middle of sand horizon (corresponding to the sand layer in our Beglitsa section) of the Pekla section, which is located on the northwestern part of the Taman Peninsula between the Black Sea and Azov Sea (Figure 1). Even though probably underestimated, these previous luminescence ages are still important in constraining the formation of lower stratigraphic levels of these sections, especially for the distinctive sand horizons. The deposition time of the sand horizon of Beglitsa section was at least confined to older than MIS 5. Moreover, similar sand horizons of Beglitsa and Pekla were also found at the lower part of Chumbur-Kosa in the form of high MGS and sand fraction content (Figure 3). The existence of this sand horizon at these sections that are all located on the Azov Sea coast probably indicates a widespread and distinct marine transgressive/regressive event. We, therefore, ascribed it to the uppermost Uzunlarian phase of the Black Sea, based on stratigraphic position and properties of these sandy deposits, which is correlated to the MIS 6 (Krijgsman et al., 2019).
From the above results, we correlate the enhanced MS interval above the sand horizon with MIS 5. In addition, a precipitous decrease in the CaCO3% and L* proxy from the carbonate horizon to overlying substratum S1SS3 was observed at a depth of around 9 m, facilitating the identification of the lower boundary for this prominent paleosol complex (Figure 6). Thus, we attribute this lowermost S1SS3 of the main paleosol to the substage of MIS 5e.
In the middle of this enhanced MS interval (i.e., S1SS2), the MS values reach a maximum, while L* and CaCO3% show typical troughs with variations being very similar to the underlying substratum S1SS3 (Figure 6). Together with the previously published OSL age of 82.0 ± 7.4 ka in the upper part of S1SS2 as well as its stratigraphic position, we allocate this distinctive substratum, characterized by the highest MS and lowest L*values, to the substage of MIS 5c.
The uppermost subunit S1SS1 of the enhanced MS interval is distinguished by a weak increase in MS and TOC, a sharp increase in the clay content for the upper horizon, and relatively low L* and CaCO3% values (Figure 6). A previously reported radiocarbon age of 29,340 ± 1,500 a (calibrated age of 34.07 ka) by Velichko et al. (2017) and an OSL age of 55.3 ± 4.9 ka by Chen et al. (2018a) were basically obtained at the same depth from this unit. These two ages made it difficult to determine the formation time of this unit, resulting in stratigraphic inconsistency. Velichko et al. (2017) referred this unit to MIS 3 and correlated it with reference sections in the center of the East European plain (Chen et al., 2018a). However, recent stratigraphic comparison of key sections based on litho- and pedostratigraphy, MS, GS, elemental and mineral composition, and luminescence dating in western Ciscaucasia (Azov Sea region and Stavropol Upland) showed that the three phases of soil formation within the S1 pedocomplex are probably a regional pattern and approximately corresponding to the warm stages within MIS 5-5a, 5c, and 5e (Mazneva et al., 2021). In addition, a detailed study of the depositional environment and pedostratigraphy on three paleosols of the MIS 5 pedocomplex of the Srednaya Akhtuba section was also conducted in nearby Lower Volga region further east of Azov Sea, with OSL ages ranging from 112.6 ± 5.4 to 68.3 ± 4.2 ka (Makeev et al., 2021). Especially the age of 68.3 ± 4.2 ka, obtained from the loess unit overlying the uppermost paleosol (corresponding to the S1SS1 in our Beglitsa section) of three soils (Yanina et al., 2017), is much older than the previously reported radiocarbon and OSL ages from the S1SS1 of the Beglitsa section. Thus, Mazneva et al. (2021) argued that the S1SS1 of the Beglitsa section is likely to be formed during MIS 5a rather than MIS 3.
Bioturbation in soils, reworked sediment mixing, or pedogenic overprinting may limit capacity for precisely dating soils using radiocarbon or luminescence, leading to depositional age underestimation and frequent age inversions (Stevens et al., 2006; Stevens et al., 2007). Thus, one possible explanation for producing these inconsistent ages at the uppermost subunit S1SS1 of the prominent paleosol complex is probably a consequence of intensive post-depositional pedogenic alteration (e.g., bioturbation) that leads to rejuvenation of the upper layer of S1SS1 due to bleaching of the luminescence signal and possible incorporation of older or younger carbon by mixing or excavating activities near this main paleosol surface (e.g., Bateman et al., 2003; Wang et al., 2003). The highest proportions of <5-μm fractions in the upper horizon of S1SS1 also hints at the more intense chemical weathering following pedogenetic overprinting than the lower horizon of S1SS1 (Figure 6), which supports the aforementioned assertion. The previous ages obtained from the upper horizon of S1SS1 may not represent the true burial time of this uppermost substratum of the S1 complex. Given its position in the stratigraphy and soil characteristics, we tend to correlate the S1SS1 with MIS 5a, which is consistent with stratigraphic correlation by Mazneva et al. (2021) but different from the previous study by Velichko et al. (2017) and Chen et al. (2018a).
Based on MS variations, Figure 8 shows a stratigraphic correlation of the S1 paleosol between the Beglitsa and other loess records on the East European Plain (Buggle et al., 2009; Hlavatskyi and Bakhmutov, 2020). This correlation is further compared with the high-resolution MS record through a luminescence-based chronostratigraphy from the Weinan section in China (Kang et al., 2011; Kang et al., 2013) and the benthic oxygen isotope stack (Lisiecki and Raymo, 2005). Except for the difference in sedimentary thickness and values within three well-developed paleosols, such a good consistency and correlation over the Eurasian continent supports the accuracy of the stratigraphic subdivision on S1 for the Beglitsa section and correspondence of the substrata of S1 with MIS 5a-e.
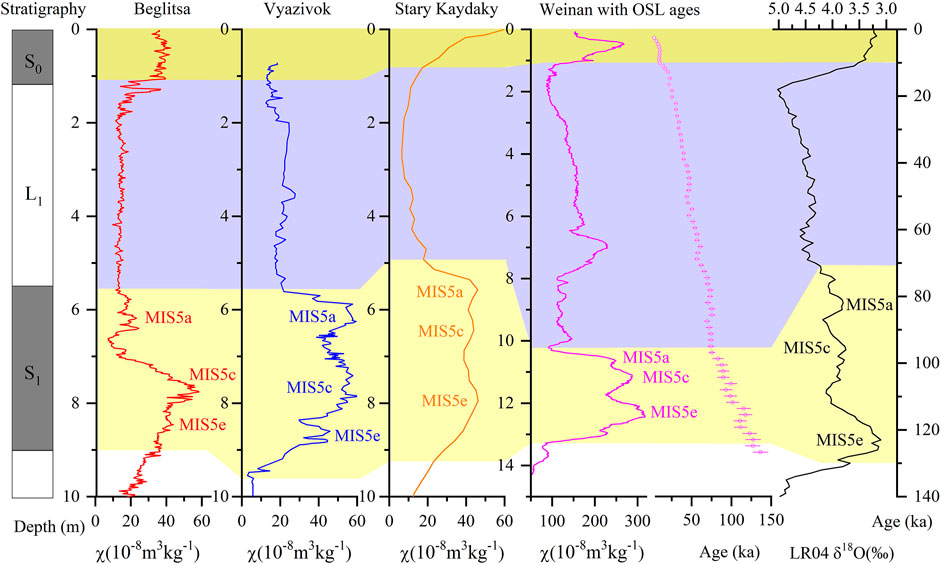
FIGURE 8. Stratigraphy of the Beglitsa section and its correlation with other loess records on the East European Plain and CLP based on the χlf proxy, and with the benthic LR04 stack. Vyazivok, Ukraine (Hlavatskyi and Bakhmutov, 2020); Stary Kaydaky, Ukraine (Buggle et al., 2009); Weinan, China (Kang et al., 2011, 2013); and the benthic LR04 stack (Lisiecki and Raymo, 2005). For location of sections on the East European Plain, please refer to Figure 1.
As for the Chumbur-Kosa section, a previous study has identified the prominent paleosol complex at 4.5–2.8 m below the modern top surface yielding MS values as high as those of the modern soil (Chen et al., 2018b). An OSL age of 76.0 ± 6.4 ka positioned in the uppermost part of this enhanced MS interval suggests this paleosol corresponds to the Late Last Interglacial complex, and probably can be assigned to the Late MIS 5 (Chen et al., 2018b). Moreover, there are two MS peaks with a dominant lower peak typically noted in the curve of χfd (Figure 2), denoting stronger intensity of soil-forming processes compared with the upper one. By contrast, two troughs with an intercalating sharp peak in CaCO3% are observed within this interval, showing an opposing variation compared with χfd (Figure 5). Other climate proxies also show peak and trough oscillations within the S1, although not as distinct as the χfd and CaCO3% (Figure 7).
Due to limited luminescence ages obtained from the Chumbur-Kosa section, we have relied primarily on additional climate proxies and stratigraphic correlation with other well-dated loess sections near the Black–Azov Sea region to achieve the subunit identification within S1 (Figure 9). The MS pattern of S1 corresponding to the twin peak association and correlating to the MIS 5 can be found elsewhere of southeastern Europe. For instance, in the Kurortne section in the Black Sea Lowland of Southern Ukraine, the MIS 5 paleosol is presented by the two pedogenetic levels: Kaydaky paleosol (MIS 5e) and Pryluky paleosol (MIS 5a-c) and characterized by well-developed humus and high MS values (Tecsa et al., 2020). On the Black Sea shore of Romania (such as the Mircea Voda and Costinesti sections), the MIS 5 pedocomplex is composed of two strongly developed paleosols and covered by relatively unweathered loess deposits of MIS 4 (Constantin et al., 2014; Necula et al., 2013, Necula et al., 2015). It has been shown previously that a loess unit occurs rarely in the upper part of S1 (or it has a very small thickness) probably due to low sediment accumulation rates and substantial transformation by soil-forming processes at a later stage; thus, the S1SS1 and S1SS2 paleosols are occasionally superimposed on each other and without an intercalating loess unit (Figure 7) (Hlavatskyi and Bakhmutov, 2020; Tecsa et al., 2020). At Chumbur-Kosa section, a sharp increase in the CaCO3% within the upper MS peak of S1 might indicate the presence of less altered loess material, although not enough to form a loess unit due to overprinting by post-depositional pedogenic processes (Figure 7). In view of this, we followed this stratigraphic subdivision for the S1 of the Chumbur-Kosa section according to its lithological facies and pedological characteristics, with previously independent ages providing stratigraphic control. That is, the depth interval of 4.5–4.0 m correlates with MIS 5e, and the depth interval of 3.7–2.8 m belongs to MIS 5a-c with the bracketing depth interval of 4.0–3.7 m corresponding to MIS 5d (Figure 7).
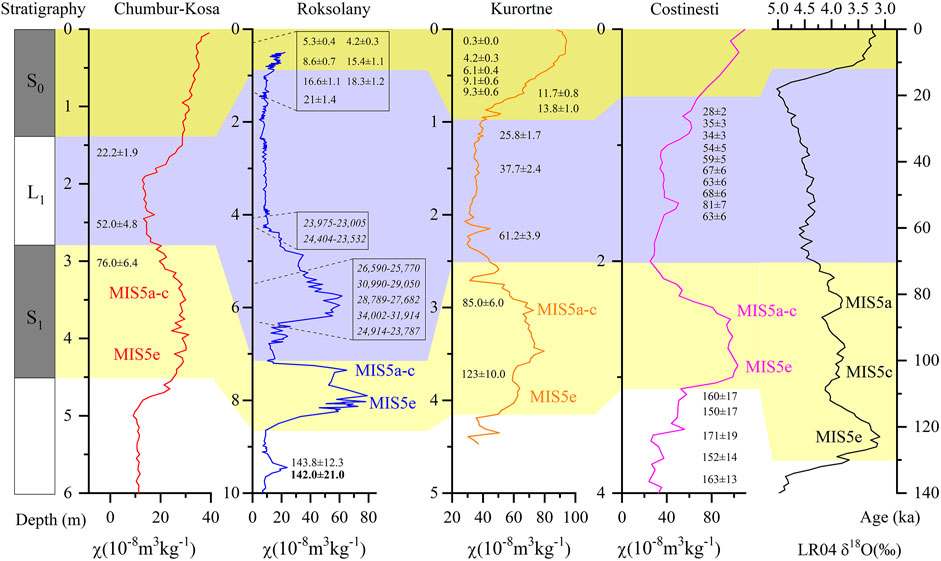
FIGURE 9. Stratigraphy of the Chumbur-Kosa section and its correlation with well-dated loess records near the Black–Azov Sea region based on the χlf proxy, and with the benthic LR04 stack. Roksolany, Ukraine (Hlavatskyi and Bakhmutov, 2020); Kurortne, Ukraine (Tecsa et al., 2020); Costinesti, Romania (Constantin et al., 2014; Necula et al., 2015); and the benthic LR04 stack (Lisiecki and Raymo, 2005). Ages shown at the Chumbur-Kosa section are derived from Chen et al. (2018b); ages presented at the Roksolany section are cited from many references (Fedorowicz et al., 2012; Wulf et al., 2016; Constantin et al., 2019) and summarized in Hlavatskyi and Bakhmutov (2020); and ages presented at the Costinesti section are derived from Constantin et al. (2014). Note that there are three types of absolute ages illustrated: ages in regular type represent OSL ages, ages in italic are 14C ages, and ages in bold show TL ages. For more information, please see the main text in this study and related references. For location of sections near the Black–Azov Sea region, please refer to Figure 1.
The Last Glacial Loess
The most substantial difference from the previous stratigraphy at the Azov Sea loess proposed in Chen et al. (2018a, b) in this new chronostratigraphy is the Last Glacial loess (L1) subdivision. For the Beglitsa section, relatively clear variations in proxies at depths between 4.5 and 3.2 m indicate a weakly developed paleosol formation during this period, such as higher values in TOC and lower values in L* (Figure 6), probably corresponding to an interstadial event. This weakly developed paleosol can be observed in the field by a visible color change but hardly noticeable in MS data. A previous OSL age of 53.7 ± 4.5 ka at the lowermost part of this interval provides additional evidence. Considering the stratigraphic position of this interval, we attribute it to MIS 3 (57–29 ka), named L1SSm. Similarly, the depth interval of 2.5–2.2 m at the Chumbur-Kosa section is also suggestive of MIS 3 based on multiple proxy variations (especially a drastic drop in the CaCO3%) and an OSL age of 52.0 ± 4.8 ka at a depth of 2.5 m (Figure 7).
The L1SSm paleosol, known as Bryansk soil in European Russia and Vytachiv soil in Ukraine, is widely distributed over the periglacial and extraglacial regions of the East European Plain and presents a key stratigraphic marker of sections (Sycheva and Khokhlova, 2016). Previously obtained radiocarbon and OSL ages in this paleosol from different sites on the East European Plain cover a wide interval older than 25 ka and younger than 55 ka (Rusakov and Sedov, 2012; Gozhik et al., 2014; Sedov et al., 2016; Veres et al., 2018; Sycheva et al., 2020). Moreover, morphological characteristics of this paleosol with silty-loam groundmass, farinaceous carbonates, granular aggregates, and irregular wedge-like structures are clearly recognizable in the central region of the East European Plain (Sycheva and Khokhlova, 2016; Sycheva et al., 2020). The previous OSL ages we obtained within the L1SSm paleosol at the Azov Sea sections are in reasonably good agreement with multiple radiocarbon and OSL ages obtained at other sections on the East European Plain (e.g., Sycheva and Khokhlova, 2016; Veres et al., 2018) and the lower limit of MIS 3 (e.g., Lisiecki and Raymo, 2005). In addition, the L1SSm paleosols expressed in the Azov sections are typically characterized by high contents of coarse silt and low values of carbonate content (Figures 3, 5), which are similar to the main characteristics of similar paleosols in the central region of the East European Plain. Last but not the least, this weakly developed paleosol was also identified in the depth interval of ∼4.0–2.0 m below the modern top surface at other different Azov Sea loess sections by a slight increase in MS and organic matter content in recent studies, suggesting the widespread existence of an L1SSm paleosol in the Azov Sea region (Mazneva et al., 2021; Timireva et al., 2021).
Chen et al. (2018a, b) failed to distinguish this substratum (L1SSm) due to a clear baseline of low MS values showing comparative constancy and small fluctuation at this depth interval. Especially for the Beglitsa section, two close-in-age OSL ages at different depths add to the difficulty in ascribing this interval to a specific MIS stage or stages (Supplementary Figure S1). Although the MS behavior of Beglitsa section generally follows the pedostratigraphy with higher values shown in paleosols and lower values in loess units, which is broadly consistent with the pedogenic enhancement model, there are χlf and χhf that do not significantly increase in this weaker paleosol L1SSm (Figure 2). In addition, the χfd% shows much more limited relation to pedostratigraphy, with changes not occurring at stratigraphic boundaries and inconsistent patterns between different units (Figure 2). These two parameters are likewise not covariant at certain stratigraphic horizons, such as a depth interval of 5.5–4.5 m (loess unit) and 4.5–3.2 m (paleosol L1SSm) (Figure 2). The inconsistent changes in χlf with pedostratigraphy, more complex pattern of χfd%, and noncovariant relationship along the section between these two parameters may indicate that other processes affect the magnetic signal in the Beglitsa section. A recent enviromagnetic study in nearby Lower Volga loess deposits further east of Azov showed that there are also other factors, such as magnetic mineral dissolution by hydromorphic processes (Taylor et al., 2014), magnetic mineral destruction by strong weathering (Baumgart et al., 2013), magnetic mineral alteration induced by weak pedogenesis (Ma et al., 2013), and surface oxidation of coarse magnetic grains (Van Velzen and Dekkers, 1999; Buggle et al., 2014; Buggle et al., 2014; Stevens et al., 2020), controlling the magnetic signal in this region (Költringer et al., 2020). These processes do not always lead to magnetic enhancement but can cause dissolution and magnetic depletion of certain components, depending on the type of soils and the characteristics of the environment in which the paleosol formed (Bradák et al., 2021). Magnetic enhancement in southern Russia is, thus, more complex than implied by the application of a simple pedogenic enhancement model, which requires further study in the future. As a result, it is difficult to identify this weakly developed paleosol based on only individual MS indicator.
Fortunately, the additional climate proxies in this study give us increased confidence to discriminate this sublayer within the loess horizon. It is, therefore, important to adopt a multiproxy approach for interpreting the stratigraphy and paleoclimatic significance of LPS. In contrast, single-proxy approaches may often provide merely fragmentary information and cause problematic interpretations (Vandenberghe et al., 2014). The stratigraphic position of L1SSm paleosol of the Beglitsa section determined here is different from the previous subdivision by Velichko et al. (2012, 2017). The newly identified L1SSm paleosol of the Chumbur-Kosa section has never been reported by previous study (e.g., Liang et al., 2016; Chen et al., 2018b, 2020).
After determining the position of L1SSm paleosols for two sections, it is much easier to attribute the under- and overlying loess units (L1LL2 and L1LL1) to MIS 4 and MIS 2, respectively (Figures 6 and 7). The L1LL2 and L1LL1 loess units, intercalated by the L1SSm paleosol, are strongly enriched in carbonates and depleted in humus, additionally with higher L* values in comparison with paleosols for two sections (Figures 6 and 7). Moreover, a previous OSL age of 22.2 ± 1.9 ka (Chen et al., 2018b) obtained for the upper part of the L1LL1 loess of the Chumbur-Kosa section further confirms the correlation of L1LL1 loess with MIS 2, thus, corroborating the accuracy of our subdivision and correlation of L1 loess at the Azov Sea.
The Holocene Soil
Here our model is the same as those presented in a previous study of the Holocene soil (S0) subdivision (Chen et al., 2018a, b), that is, depths of 1.2–0 m for the Beglitsa section and 1.4–0 m for the Chumbur-Kosa section belong to the Holocene soil (S0) and correspond to MIS 1 (Figures 6, 7). In the Beglitsa section, a large and rapid jump in all climatic proxy curves at a depth of 1.2 m, together with a previous OSL age (5.4 ± 0.4 ka) at a depth of 0.7 m, constitutes the whole evidence to ascertain forming phases of this uppermost soil horizon (Figure 6). As for the Chumbur-Kosa section, obvious variations can also be found from the curve of all climatic proxies at a depth of 1.4 m, although with no OSL ages obtained within this interval (Figure 7).
Environmental Changes at the Azov Sea
The Last Interglacial Complex (MIS 5)
During the Last Interglacial complex period, the climate in the Azov Sea region was generally characterized by warm, relatively humid conditions, although undergoing several obvious oscillations, as reflected in the intensity of pedogenesis responsible for paleosol S1 (9.0–5.5 m in Beglitsa, 4.5–2.8 m in Chumbur-Kosa). The soil type resembles the modern soil, and MS values are as high as those of the modern soil, making this period as a potential analog for the present Interglacial. Patterns in paleoclimate proxy data within S1 correlate well with warmer global climates, as demonstrated by the benthic LR04 stack records (Lisiecki and Raymo, 2005). Furthermore, high values of clay and TOC content and low values of L* and CaCO3% (Figures 6 and 7), indices of climatic conditions favorable to forming soils, further confirm this general trend during the period. The climate trend is also consistent with the macro- and micromorphological studies performed on the LPS in the Azov Sea region, where the paleosol is represented as humus accumulation (dark brown dense loam, spots of Fe–Mn, biogenic pores, and fine gypsum crystals) and a series of genetic horizons (Acs-A-Bcy-BCks), suggesting abundant moisture supply and high humidity (Velichko et al., 2017; Panin et al., 2018). Additionally, the predominance of forb steppes inferred from palynological data and the presence of small mammal remains for paleosol S1 of Azov loess sections, such as Lagurus lagurus and ground squirrels, are also indicators of mild steppe conditions with a dense vegetation cover (Dodonov et al., 2006; Tesakov et al., 2007; Velichko et al., 2012; Velichko et al., 2017). Furthermore, gastropod studies from the surrounding area of the Azov Sea, such as the Caucasus region, strongly support humid conditions during the formation of paleosol S1, as expressed by the ecosystem with high-grass to forest-steppe biomes (Richter et al., 2020).
These climatic conditions inferred from different paleoclimate proxy data of S1 are broadly similar with records in the Dnieper Lowland and Lower Danube Basin through regional loess comparison (Figures 8 and 9), providing insights into general climatic trends in these regions. However, also in the detail, there are differences seen when these records are compared under a better constrained chronostratigraphy.
The S1SS3 and S1SS2 paleosols show relatively higher MS values in the Beglitsa section, which sharply decrease toward the upper S1SS1 paleosol resulting in low MS values in the S1SS1, while a less distinctive pattern and a more constant change can be observed in the whole S1 of the Chumbur-Kosa section (Figures 8 and 9). In addition, the MIS 5c seems to be the climatic optimum during the Last Interglacial complex as revealed by the highest χlf and χfd% values within S1 of the Beglitsa section (Figure 2), while it is the MIS 5e in the Chumbur-Kosa section, as expressed by two χfd% peaks with much greater χfd% values in the lower S1SS3 paleosols compared with the upper one (Figure 2), if not taking into account the complexity in magnetic enhancement between these two sections. This is most probably related to specific features of the depositional and preservational environment at particular sections (Vandenberghe et al., 2014), as the Beglitsa and Chumbur-Kosa sections are separately exposed on the northern coast of the second terrace of the Azov Sea and southern shores of the sub-horizontal flat interfluves of the Azov Sea, and further isolated by the Gulf of Taganrog (Figure 1). Through a comparison between the Beglitsa and the Chumbur-Kosa sections of S1 and other loess records from the Danube–Black/Azov Sea loess fields, we show that the investigated sequence extends over the Late Pleistocene, providing a key record for direct comparison of paleoclimatic trends over the vast European continent, revealing similarities in environmental magnetic loess records among these regions (e.g., Marković et al., 2015; Song et al., 2018; Sümegi et al., 2018), and further highlighting the dissimilarities of the site for the understanding of Eurasian continental temporal and spatial climatic evolution (Marković et al., 2018; Zeeden et al., 2018).
The Last Glacial (MIS 4-2)
The whole Last Glacial period was characterized by thick loess accumulation and clear background MS values associated with the L1 loess in response to cold and dry climate conditions in the Azov region (5.5–1.2 m in Beglitsa, 2.8–1.4 m in Chumbur-Kosa). Multiproxy records indicate a similar climate condition, documented by low values of clay and TOC content and high values of L* and CaCO3% (Figures 6 and 7). Cold glacial conditions inferred from the Black Sea records also support such climatic evolution in these adjacent areas (Ménot and Bard, 2012; Wegwerth et al., 2015).
However, a phase characterized by milder, relatively wetter conditions during the Last Glacial period, corresponding to MIS 3, was traced (4.5–3.2 m in Beglitsa, 2.5–2.2 m in Chumbur-Kosa) and also supported by distinct morphogenetic characteristics of the L1SSm paleosol in most of the loess sections located on the central part of the East European Plain. They are noted for wedge-like structures of the lower boundary of the humus horizon, farinaceous carbonates, and abundant granular aggregates from the upper horizon (Sycheva and Khokhlova, 2016). The granular aggregates can be considered as a cryogenic process indicator according to Todisco and Bhiry (2008) and Villagran et al. (2013). These characteristics suggest that the L1SSm paleosol formed under less cold and more moist climatic conditions but underwent intense cryogenic processes in the final stage of the paleosol development (Sedov et al., 2016; Sycheva and Khokhlova, 2016; Sycheva et al., 2020). In contrast, no obvious signs of cryoturbations in the L1SSm of Azov sections were found, indicating an insignificant cryogenic influence on this paleosol and relatively warmer climatic conditions at that time in this region (Panin et al., 2018). This is perhaps due to the fact that the geographic position of the Azov Sea is far from glacial areas compared with its analog in the central region of the East European Plain. It is also probably related to the moderating influence of the Black and Azov seas (Necula et al., 2015).
In summary, climate conditions in the Azov region during the Last Glacial period, as a whole, were characterized by two main cold and arid phases corresponding to the Early and Late Last Glacial, related to intensive accumulation of loess units L1LL2 and L1LL1, as well as separated by a phase of mild and wet climate corresponding to the Middle Last Glacial, associated with weakly developed soil L1SSm and noted for humus accumulation (high TOC content) and carbonate redistribution (low CaCO3% content). These results are comparable with review studies of climatic oscillations during the Last Glacial period recorded in the Danube Basin LPS, except for the difference in thickness of the stratigraphic units (Marković et al., 2008; Fitzsimmons et al., 2012).
The Holocene (MIS 1)
The Holocene period is associated with the uppermost soil S0, corresponding to climatic amelioration in the form of warmer, relatively more humid conditions (upper 1.2 m in Beglitsa and upper 1.4 m in Chumbur-Kosa), as demonstrated by higher χlf, <5 μm, and TOC values and lower L*, CaCO3% values (Figures 6 and 7). The soil is represented by a Chernozem, a soil type close to the modern ones found in the area, and noted typically for humus accumulation and soil aggregation due to biogenic processes (Panin et al., 2018). Paleoclimatic records from other loess sections adjacent to the Azov Sea also yield evidence for a relatively warmer climate during this period (Velichko et al., 2012; Panin et al., 2019; Mazneva et al., 2021).
Conclusion
Following a multiproxy sedimentological investigation and chronological reevaluation, we show that two Late Quaternary loess sections around the Azov Sea are key sections for better constraining local and regional chronostratigraphic correlations. A more detailed and accurate chronostratigraphy was established with the help of various absolute ages and climatic proxies, compared with previous ones that are mainly following general stratigraphic schemes of the East European Plain. The new chronostratigraphy of the Azov Sea sections resolves many uncertainties in the stratigraphic position of loess units and soil complexes, and further correlates them with corresponding MIS, facilitating direct stratigraphic comparison between different regions. Besides, by this comparison and/or correlation with other terrestrial records from the Danube–East European Plain, we show that there are also some differences requiring further study in spite of general similarities.
In the studied records, the MIS 5 Interglacial complex period was the warmest and relatively most humid period, as reflected by intensively weathered paleosol. It was then followed by two main cold and arid periods corresponding to the MIS 4 and MIS 2 Glacial periods, interrupted by a phase of mild and wet climate corresponding to MIS 3. Finally, the Holocene is a period of climatic amelioration characterized by warmer, relatively more humid conditions, corresponding to MIS 1.
Data Availability Statement
The raw data supporting the conclusions of this article will be made available by the authors, without undue reservation.
Author Contributions
JC conceptualized the study, wrote the original draft, developed the methodology, performed the formal analysis, and conducted the investigation and visualization. TS wrote, reviewed, and edited the manuscript. TY supervised the study, acquired the resources, was in charge of the project administration, and acquired the funding. MQ wrote, reviewed, and edited the manuscript, and acquired the funding. GM acquired the resources and validated the study. EK and RK conducted the investigation and acquired the resources. BZ was in charge of the data curation. PS conducted the investigation and was in charge of the data curation.
Funding
This research was funded by the National Natural Science Foundation of China (Nos. 41271024 and 42071109), the Guangdong Basic and Applied Basic Research Foundation (2021A1515110246) and the Open Foundation of MOE Key Laboratory of Western China’s Environmental System, Lanzhou University, and the Fundamental Research Funds for the Central Universities (lzujbky-2021-kb01). The Swedish Research Council is gratefully acknowledged for funding TS for his part in this project (2017–03888).
Conflict of Interest
The authors declare that the research was conducted in the absence of any commercial or financial relationships that could be construed as a potential conflict of interest.
Publisher’s Note
All claims expressed in this article are solely those of the authors and do not necessarily represent those of their affiliated organizations, or those of the publisher, the editors, and the reviewers. Any product that may be evaluated in this article, or claim that may be made by its manufacturer, is not guaranteed or endorsed by the publisher.
Acknowledgments
We are grateful to members from the Institute of Geography, Russian Academy of Sciences, for the help in the field, members from the Institute of Glaciology and Ecogeography, Lanzhou University, for the aid in the laboratory analyses, and Yan Qin for her assistance with Figure 1. We would also like to extend our sincere thanks to Dmytro Hlavatskyi, Cristian Necula, Daniel Veres, and Shugang Kang for providing the MS data of the different sections.
Supplementary Material
The Supplementary Material for this article can be found online at: https://www.frontiersin.org/articles/10.3389/feart.2021.808157/full#supplementary-material
References
Basarin, B., Buggle, B., Hambach, U., Marković, S. B., Dhand, K. O. H., Kovačević, A., et al. (2014). Time-scale and Astronomical Forcing of Serbian Loess-Paleosol Sequences. Glob. Planet. Change 122, 89–106. doi:10.1016/j.gloplacha.2014.08.007
Basarin, B., Vandenberghe, D. A. G., Marković, S. B., Catto, N., Hambach, U., Vasiliniuc, S., et al. (2011). The Belotinac Section (Southern Serbia) at the Southern Limit of the European Loess belt: Initial Results. Quat. Int. 240, 128–138. doi:10.1016/j.quaint.2011.02.022
Bateman, M. D., Frederick, C. D., Jaiswal, M. K., and Singhvi, A. K. (2003). Investigations into the Potential Effects of Pedoturbation on Luminescence Dating. Quat. Sci. Rev. 22, 1169–1176. doi:10.1016/s0277-3791(03)00019-2
Baumgart, P., Hambach, U., Meszner, S., and Faust, D. (2013). An Environmental Magnetic Fingerprint of Periglacial Loess: Records of Late Pleistocene Loess-Palaeosol Sequences from Eastern Germany. Quat. Int. 296, 82–93. doi:10.1016/j.quaint.2012.12.021
Beuselinck, L., Govers, G., Poesen, J., Degraer, G., and Froyen, L. (1998). Grain-size Analysis by Laser Diffractometry: Comparison with the Sieve-Pipette Method. Catena 32, 193–208. doi:10.1016/s0341-8162(98)00051-4
Bokhorst, M. P., Vandenberghe, J., Sümegi, P., Łanczont, M., Gerasimenko, N. P., Matviishina, Z. N., et al. (2011). Atmospheric Circulation Patterns in central and Eastern Europe during the Weichselian Pleniglacial Inferred from Loess Grain-Size Records. Quat. Int. 234, 62–74. doi:10.1016/j.quaint.2010.07.018
Bösken, J., Obreht, I., Zeeden, C., Klasen, N., Hambach, U., Sümegi, P., et al. (2019). High-resolution Paleoclimatic Proxy Data from the MIS3/2 Transition Recorded in Northeastern Hungarian Loess. Quat. Int. 502, 95–107. doi:10.1016/j.quaint.2017.12.008
Bradák, B., Seto, Y., Stevens, T., Újvári, G., Fehér, K., and Költringer, C. (2021). Magnetic Susceptibility in the European Loess Belt: New and Existing Models of Magnetic Enhancement in Loess. Palaeogeogr. Palaeoclimatol. Palaeoecol. 569, 110329. doi:10.1016/j.palaeo.2021.110329
Buggle, B., Hambach, U., Glaser, B., Gerasimenko, N., Marković, S., Glaser, I., et al. (2009). Stratigraphy, and Spatial and Temporal Paleoclimatic Trends in Southeastern/Eastern European Loess-Paleosol Sequences. Quat. Int. 196, 86–106. doi:10.1016/j.quaint.2008.07.013
Buggle, B., Hambach, U., Müller, K., Zöller, L., Marković, S. B., and Glaser, B. (2014). Iron Mineralogical Proxies and Quaternary Climate Change in SE-European Loess-Paleosol Sequences. Catena 117, 4–22. doi:10.1016/j.catena.2013.06.012
Chen, J., Yang, T., Matishov, G. G., Velichko, A. A., Zeng, B., He, Y., et al. (2018b). Luminescence Chronology and Age Model Application for the Upper Part of the Chumbur-Kosa Loess Sequence in the Sea of Azov, Russia. J. Mt. Sci. 15, 504–518. doi:10.1007/s11629-017-4689-0
Chen, J., Yang, T., Matishov, G. G., Velichko, A. A., Zeng, B., He, Y., et al. (2018a). A Luminescence Dating Study of Loess Deposits from the Beglitsa Section in the Sea of Azov, Russia. Quat. Int. 478, 27–37. doi:10.1016/j.quaint.2017.11.017
Chen, J., Yang, T., Qiang, M., Matishov, G. G., Velichko, A. A., Zeng, B., et al. (2020). Interpretation of Sedimentary Subpopulations Extracted from Grain Size Distributions in Loess Deposits at the Sea of Azov, Russia. Aeolian Res. 45, 100597. doi:10.1016/j.aeolia.2020.100597
Constantin, D., Begy, R., Vasiliniuc, S., Panaiotu, C., Necula, C., Codrea, V., et al. (2014). High-resolution OSL Dating of the Costineşti Section (Dobrogea, SE Romania) Using fine and Coarse Quartz. Quat. Int. 334-335, 20–29. doi:10.1016/j.quaint.2013.06.016
Constantin, D., Veres, D., Panaiotu, C., Anechitei-Deacu, V., Groza, S. M., Begy, R., et al. (2019). Luminescence Age Constraints on the Pleistocene-Holocene Transition Recorded in Loess Sequences across SE Europe. Quat. Geochronol. 49, 71–77. doi:10.1016/j.quageo.2018.07.011
Dearing, J. A., Dann, R. J. L., Hay, K., Lees, J. A., Loveland, P. J., Maher, B. A., et al. (1996). Frequency-dependent Susceptibility Measurements of Environmental Materials. Geophys. J. Int. 124, 228–240. doi:10.1111/j.1365-246x.1996.tb06366.x
Dlussky, K. G. (2007). Likhvin Interglacial Polygenetic Paleosol: A Reconstruction on the Russian Plain. Quat. Int. 162-163, 141–157. doi:10.1016/j.quaint.2006.10.029
Dodonov, A. E., Tchepalyga, A. L., Mihailescu, C. D., Zhou, L. P., Markova, A. K., Trubikhin, V. M., et al. (2000). Last-interglacial Records from central Asia to the Northern Black Sea Shoreline: Stratigraphy and Correlation. Neth. J. Geosciences 79, 303–311. doi:10.1017/s0016774600021788
Dodonov, A. E., Zhou, L. P., Markova, A. K., Tchepalyga, A. L., Trubikhin, V. M., Aleksandrovski, A. L., et al. (2006). Middle-Upper Pleistocene Bio-Climatic and Magnetic Records of the Northern Black Sea Coastal Area. Quat. Int. 149, 44–54. doi:10.1016/j.quaint.2005.11.017
Fang, X.-M., Ono, Y., Fukusawa, H., Bao-Tian, P., Li, J.-J., Dong-Hong, G., et al. (1999). Asian Summer Monsoon Instability during the Past 60,000 Years: Magnetic Susceptibility and Pedogenic Evidence from the Western Chinese Loess Plateau. Earth Planet. Sci. Lett. 168, 219–232. doi:10.1016/s0012-821x(99)00053-9
Fedorowicz, S., Woźniak, P., Halas, S., Łanczont, M., Paszkowski, M., and Wójtowicz, A. (2012). Challenging K-Ar Dating of the Quaternary Tephra from Roxolany, Ukraine. Mineralogia-Special Pap. 39, 102–105.
Fitzsimmons, K. E., Marković, S. B., and Hambach, U. (2012). Pleistocene Environmental Dynamics Recorded in the Loess of the Middle and Lower Danube basin. Quat. Sci. Rev. 41, 104–118. doi:10.1016/j.quascirev.2012.03.002
Gerasimenko, N. (2006). Upper Pleistocene Loess-Palaeosol and Vegetational Successions in the Middle Dnieper Area, Ukraine. Quat. Int. 149, 55–66. doi:10.1016/j.quaint.2005.11.018
Gozhik, P., Komar, M., Łanczont, M., Fedorowicz, S., Bogucki, A., Mroczek, P., et al. (2014). Paleoenvironmental History of the Middle Dnieper Area from the Dnieper to Weichselian Glaciation: A Case Study of the Maksymivka Loess Profile. Quat. Int. 334-335, 94–111. doi:10.1016/j.quaint.2013.11.037
Hlavatskyi, D. V., and Bakhmutov, V. G. (2020). Magnetostratigraphy and Magnetic Susceptibility of the Best Developed Pleistocene Loess-Palaeosol Sequences of Ukraine: Implications for Correlation and Proposed Chronostratigraphic Models. Geol. Q. 64, 723–753. doi:10.7306/gq.1544
Kang, S. G., Wang, X. L., and Lu, Y. C. (2013). Quartz OSL Chronology and Dust Accumulation Rate Changes since the Last Glacial at Weinan on the southeastern Chinese Loess Plateau. Boreas 42, 815–829. doi:10.1111/bor.12005
Kang, S., Lu, Y., and Wang, X. (2011). Closely-spaced Recuperated OSL Dating of the Last Interglacial Paleosol in the southeastern Margin of the Chinese Loess Plateau. Quat. Geochronol. 6, 480–490. doi:10.1016/j.quageo.2011.04.004
Költringer, C., Stevens, T., Bradák, B., Almqvist, B., Kurbanov, R., Snowball, I., et al. (2020). Enviromagnetic Study of Late Quaternary Environmental Evolution in Lower Volga Loess Sequences, Russia. Quat. Res. 103, 1–25. doi:10.1017/qua.2020.73
Konert, M., and Vandenberghe, J. (1997). Comparison of Laser Grain Size Analysis with Pipette and Sieve Analysis: A Solution for the Underestimation of the clay Fraction. Sedimentology 44, 523–535. doi:10.1046/j.1365-3091.1997.d01-38.x
Kosarev, A. N., Kostianoy, A. G., and Shiganova, T. A. (2007). The Sea of Azov, the Black Sea Environment. Berlin: Springer, 63–89.
Krijgsman, W., Tesakov, A., Yanina, T., Lazarev, S., Danukalova, G., Van Baak, C. G. C., et al. (2019). Quaternary Time Scales for the Pontocaspian Domain: Interbasinal Connectivity and Faunal Evolution. Earth-Science Rev. 188, 1–40. doi:10.1016/j.earscirev.2018.10.013
Kukla, G., and An, Z. (1989). Loess Stratigraphy in Central China. Palaeogeogr. Palaeoclimatol. Palaeoecol. 72, 203–225. doi:10.1016/0031-0182(89)90143-0
Liang, Y., Yang, T.-b., Velichko, A. A., Zeng, B., Shi, P.-h., Wang, L.-d., et al. (2016). Paleoclimatic Record from Chumbur-Kosa Section in Sea of Azov Region since Marine Isotope Stage 11. J. Mt. Sci. 13, 985–999. doi:10.1007/s11629-015-3738-9
Lisiecki, L. E., and Raymo, M. E. (2005). A Pliocene-Pleistocene Stack of 57 Globally Distributed Benthic δ18O Records. Paleoceanography 20, 1–17. doi:10.1029/2004pa001071
Ma, M., Liu, X., Hesse, P. P., Lü, B., Guo, X., and Chen, J. (2013). Magnetic Properties of Loess Deposits in Australia and Their Environmental Significance. Quat. Int. 296, 198–205. doi:10.1016/j.quaint.2012.06.018
Maher, B. A., MengYu, H., Roberts, H. M., and Wintle, A. G. (2003). Holocene Loess Accumulation and Soil Development at the Western Edge of the Chinese Loess Plateau: Implications for Magnetic Proxies of Palaeorainfall. Quat. Sci. Rev. 22, 445–451. doi:10.1016/s0277-3791(02)00188-9
Makeev, A., Lebedeva, M., Kaganova, A., Rusakov, A., Kust, P., Romanis, T., et al. (2021). Pedosedimentary Environments in the Caspian Lowland during MIS5 (Srednaya Akhtuba Reference Section, Russia). Quat. Int. 590, 164–180. doi:10.1016/j.quaint.2021.03.015
Markova, A. К., and Vislobokova, I. А. (2016). Mammal Faunas in Europe at the End of the Early - Beginning of the Middle Pleistocene. Quat. Int. 420, 363–377. doi:10.1016/j.quaint.2015.07.065
Markova, A. K. (2005). Eastern European Rodent (Rodentia, Mammalia) Faunas from the Early-Middle Pleistocene Transition. Quat. Int. 131, 71–77. doi:10.1016/j.quaint.2004.07.020
Markova, A. K. (2007). Pleistocene Mammal Faunas of Eastern Europe. Quat. Int. 160, 100–111. doi:10.1016/j.quaint.2006.09.011
Marković, S. B., Bokhorst, M. P., Vandenberghe, J., McCoy, W. D., Oches, E. A., Hambach, U., et al. (2008). Late Pleistocene Loess-Palaeosol Sequences in the Vojvodina Region, north Serbia. J. Quat. Sci. 23, 73–84. doi:10.1002/jqs.1124
Marković, S. B., Stevens, T., Kukla, G. J., Hambach, U., Fitzsimmons, K. E., Gibbard, P., et al. (2015). Danube Loess Stratigraphy-Towards a Pan-European Loess Stratigraphic Model. Earth-Science Rev. 148, 228–258. doi:10.1016/j.earscirev.2015.06.005
Marković, S. B., Stevens, T., Mason, J., Vandenberghe, J., Yang, S., Veres, D., et al. (2018). Loess Correlations-Between Myth and Reality. Palaeogeogr. Palaeoclimatol. Palaeoecol. 509, 4–23. doi:10.1016/j.palaeo.2018.04.018
Matishov, G., Kovaleva, G., Novenko, E., Krasnorutskaya, K., and Pol'shin, V. (2013). Paleogeography of the Sea of Azov Region in the Late Holocene (Reconstruction by Diatom and Pollen Data from marine Sediments). Quat. Int. 284, 123–131. doi:10.1016/j.quaint.2012.05.044
Mazneva, E., Konstantinov, E., Zakharov, A., Sychev, N., Tkach, N., Kurbanov, R., et al. (2021). Middle and Late Pleistocene Loess of the Western Ciscaucasia: Stratigraphy, Lithology and Composition. Quat. Int. 590, 146–163. doi:10.1016/j.quaint.2020.11.039
Ménot, G., and Bard, E. (2012). A Precise Search for Drastic Temperature Shifts of the Past 40,000 Years in southeastern Europe. Paleoceanography 27, PA2210. doi:10.1029/2012PA002291
Murray, A. S., Svendsen, J. I., Mangerud, J., and Astakhov, V. I. (2007). Testing the Accuracy of Quartz OSL Dating Using a Known-Age Eemian Site on the River Sula, Northern Russia. Quat. Geochronol. 2, 102–109. doi:10.1016/j.quageo.2006.04.004
Necula, C., Dimofte, D., and Panaiotu, C. (2015). Rock Magnetism of a Loess-Palaeosol Sequence from the Western Black Sea Shore (Romania). Geophys. J. Int. 202, 1733–1748. doi:10.1093/gji/ggv250
Necula, C., Panaiotu, C., Heslop, D., and Dimofte, D. (2013). Climatic Control of Magnetic Granulometry in the Mircea Vodă Loess/paleosol Sequence (Dobrogea, Romania). Quat. Int. 293, 5–14. doi:10.1016/j.quaint.2012.03.043
Obreht, I., Buggle, B., Catto, N., Markovič, S. B., Bösel, S., Vandenberghe, D. A. G., et al. (2014). The Late Pleistocene Belotinac Section (Southern Serbia) at the Southern Limit of the European Loess belt: Environmental and Climate Reconstruction Using Grain Size and Stable C and N Isotopes. Quat. Int. 334-335, 10–19. doi:10.1016/j.quaint.2013.05.037
Panin, P. G., Timireva, S. N., Konstantinov, E. A., Kalinin, P. I., Kononov, Y. M., Alekseev, A. O., et al. (2019). Plio-Pleistocene Paleosols: Loess-Paleosol Sequence Studied in the Beregovoye Section, the Crimean Peninsula. Catena 172, 590–618. doi:10.1016/j.catena.2018.09.020
Panin, P. G., Timireva, S. N., Morozova, T. D., Kononov, Y. M., and Velichko, A. A. (2018). Morphology and Micromorphology of the Loess-Paleosol Sequences in the South of the East European plain (MIS 1-MIS 17). Catena 168, 79–101. doi:10.1016/j.catena.2018.01.032
Pilipenko, O. V., Sharonova, Z. V., Trubikhin, V. M., Abrahamsen, N., and Moerner, N.-A. (2005). Paleomagnetic and Petromagnetic Investigations of Rocks of the Pekla Loess-Soil Section (Krasnodar Territory) in the Interval 240-55 Ka. Izvestiya, Phys. Solid Earth 41, 492–501.
Pilipenko, O. V., and Trubikhin, V. M. (2011). Paleomagnetic Record in the Late Pleistocene Loess-Soil Deposits of the Pekla Section in the Time Interval 425-50 Ka. Izv., Phys. Solid Earth 47, 686–697. doi:10.1134/s106935131107007x
Richter, C., Wolf, D., Walther, F., Meng, S., Sahakyan, L., Hovakimyan, H., et al. (2020). New Insights into Southern Caucasian Glacial-Interglacial Climate Conditions Inferred from Quaternary Gastropod Fauna. J. Quat. Sci 35, 634–649. doi:10.1002/jqs.3204
Rousseau, D.-D., Antoine, P., Gerasimenko, N., Sima, A., Fuchs, M., Hatté, C., et al. (2011). North Atlantic Abrupt Climatic Events of the Last Glacial Period Recorded in Ukrainian Loess Deposits. Clim. Past 7, 221–234. doi:10.5194/cp-7-221-2011
Rusakov, A., and Sedov, S. (2012). Late Quaternary Pedogenesis in Periglacial Zone of Northeastern Europe Near Ice Margins since MIS 3: Timing, Processes, and Linkages to Landscape Evolution. Quat. Int. 265, 126–141. doi:10.1016/j.quaint.2012.03.002
Rutter, N. W., Rokosh, D., Evans, M. E., Little, E. C., Chlachula, J., and Velichko, A. (2003). Correlation and Interpretation of Paleosols and Loess across European Russia and Asia over the Last Interglacial-Glacial Cycle. Quat. Res. 60, 101–109. doi:10.1016/s0033-5894(03)00069-3
Schaetzl, R. J., Bettis, E. A., Crouvi, O., Fitzsimmons, K. E., Grimley, D. A., Hambach, U., et al. (2018). Approaches and Challenges to the Study of Loess-Introduction to the LoessFest Special Issue. Quat. Res. 89, 563–618. doi:10.1017/qua.2018.15
Sedov, S., Rusakov, A., Sheinkman, V., and Korkka, M. (2016). MIS3 Paleosols in the center-north of Eastern Europe and Western Siberia: Reductomorphic Pedogenesis Conditioned by Permafrost? Catena 146, 38–47. doi:10.1016/j.catena.2016.03.022
Smalley, I., O’Hara-Dhand, K., Wint, J., Machalett, B., Jary, Z., and Jefferson, I. (2009). Rivers and Loess: The Significance of Long River Transportation in the Complex Event-Sequence Approach to Loess deposit Formation. Quat. Int. 198, 7–18. doi:10.1016/j.quaint.2008.06.009
Song, Y., Guo, Z., Marković, S., Hambach, U., Deng, C., Chang, L., et al. (2018). Magnetic Stratigraphy of the Danube Loess: A Composite Titel-Stari Slankamen Loess Section over the Last One Million Years in Vojvodina, Serbia. J. Asian Earth Sci. 155, 68–80. doi:10.1016/j.jseaes.2017.11.012
Sotnikova, M., and Titov, V. (2009). Carnivora of the Tamanian Faunal Unit (The Azov Sea Area). Quat. Int. 201, 43–52. doi:10.1016/j.quaint.2008.05.019
Stevens, T., Armitage, S. J., Lu, H., and Thomas, D. S. G. (2006). Sedimentation and Diagenesis of Chinese Loess: Implications for the Preservation of Continuous, High-Resolution Climate Records. Geol 34, 849–852. doi:10.1130/g22472.1
Stevens, T., Sechi, D., Bradák, B., Orbe, R., Baykal, Y., Cossu, G., et al. (2020). Abrupt Last Glacial Dust Fall over Southeast England Associated with Dynamics of the British-Irish Ice Sheet. Quat. Sci. Rev. 250, 106641. doi:10.1016/j.quascirev.2020.106641
Stevens, T., Thomas, D., Armitage, S., Lunn, H., and Lu, H. (2007). Reinterpreting Climate Proxy Records from Late Quaternary Chinese Loess: A Detailed OSL Investigation. Earth-Science Rev. 80, 111–136. doi:10.1016/j.earscirev.2006.09.001
Sümegi, P., Gulyás, S., Molnár, D., Sümegi, B. P., Almond, P. C., Vandenberghe, J., et al. (2018). New Chronology of the Best Developed Loess/paleosol Sequence of Hungary Capturing the Past 1.1 Ma: Implications for Correlation and Proposed Pan-Eurasian Stratigraphic Schemes. Quat. Sci. Rev. 191, 144–166. doi:10.1016/j.quascirev.2018.04.012
Sycheva, S., Frechen, M., Terhorst, B., Sedov, S., and Khokhlova, O. (2020). Pedostratigraphy and Chronology of the Late Pleistocene for the Extra Glacial Area in the Central Russian Upland (Reference Section Aleksandrov Quarry). Catena 194, 104689. doi:10.1016/j.catena.2020.104689
Sycheva, S., and Khokhlova, O. (2016). Genesis, 14C Age, and Duration of Development of the Bryansk Paleosol on the Central Russian Upland Based on Dating of Different Materials. Quat. Int. 399, 111–121. doi:10.1016/j.quaint.2015.08.055
Taylor, S.N., Lagroix, F., Rousseau, D.-D, and Antoine, P. (2014). Mineral Magnetic Characterization of the Upper Pleniglacial Nussloch loess Sequence (Germany): An Insight into Local Environmental Processes. Geophys. J. Int. 199, 1463–1480. doi:10.1093/gji/ggu331
Tecsa, V., Gerasimenko, N., Veres, D., Hambach, U., Lehmkuhl, F., Schulte, P., et al. (2020). Revisiting the Chronostratigraphy of Late Pleistocene Loess-Paleosol Sequences in Southwestern Ukraine: OSL Dating of Kurortne Section. Quat. Int. 542, 65–79. doi:10.1016/j.quaint.2020.03.001
Tesakov, A. S., Dodonov, A. E., Titov, V. V., and Trubikhin, V. M. (2007). Plio-Pleistocene Geological Record and Small Mammal Faunas, Eastern Shore of the Azov Sea, Southern European Russia. Quat. Int. 160, 57–69. doi:10.1016/j.quaint.2006.09.009
Timar-Gabor, A., Constantin, D., Buylaert, J. P., Jain, M., Murray, A. S., and Wintle, A. G. (2015). Fundamental Investigations of Natural and Laboratory Generated SAR Dose Response Curves for Quartz OSL in the High Dose Range. Radiat. Measurements 81, 150–156. doi:10.1016/j.radmeas.2015.01.013
Timireva, S. N., Kononov, Y. M., Sycheva, S. A., Taratunina, N. A., Kalinin, P. I., Filippova, K. G., et al. (2021). Revisiting the Taman peninsula Loess-Paleosol Sequence: Middle and Late Pleistocene Record of Cape Pekla. Quat. Int. doi:10.1016/j.quaint.2021.06.010
Todisco, D., and Bhiry, N. (2008). Micromorphology of Periglacial Sediments from the Tayara Site, Qikirtaq Island, Nunavik (Canada). Catena 76, 1–21. doi:10.1016/j.catena.2008.08.002
Újvári, G., Kok, J. F., Varga, G., and Kovács, J. (2016). The Physics of Wind-Blown Loess: Implications for Grain Size Proxy Interpretations in Quaternary Paleoclimate Studies. Earth-Science Rev. 154, 247–278. doi:10.1016/j.earscirev.2016.01.006
Van Velzen, A. J., and Dekkers, M. J. (1999). Low-temperature Oxidation of Magnetite in Loess-Paleosol Sequences: a Correction of Rock Magnetic Parameters. Studia Geophysica et Geodaetica 43, 357–375. doi:10.1023/a:1023278901491
Vandenberghe, J. (2013). Grain Size of fine-grained Windblown Sediment: A Powerful Proxy for Process Identification. Earth-Science Rev. 121, 18–30. doi:10.1016/j.earscirev.2013.03.001
Vandenberghe, J., Markovič, S. B., Jovanovič, M., and Hambach, U. (2014). Site-specific Variability of Loess and Palaeosols (Ruma, Vojvodina, Northern Serbia). Quat. Int. 334-335, 86–93. doi:10.1016/j.quaint.2013.10.036
Velichko, A. A., Borisova, O. K., Kononov, Y. M., Konstantinov, E. A., Kurbanov, R. N., Morozova, T. D., et al. (2017). Reconstruction of Late Pleistocene Events in the Periglacial Area in the Southern Part of the East European Plain. Dokl. Earth Sc. 475, 895–899. doi:10.1134/s1028334x17080098
Velichko, A. A., Catto, N. R., Yu Kononov, M., Morozova, T. D., Yu Novenko, E., Panin, P. G., et al. (2009a). Progressively Cooler, Drier Interglacials in Southern Russia through the Quaternary: Evidence from the Sea of Azov Region. Quat. Int. 198, 204–219. doi:10.1016/j.quaint.2008.06.005
Velichko, A. A., Catto, N., Tesakov, A. S., Titov, V. V., Morozova, T. D., Semenov, V. V., et al. (2009b). Structural Specificity of Pleistocene Loess and Soil Formation of the Southern Russian plain According to Materials of Eastern Priazovie. Dokl. Earth Sc. 429, 1364–1368. doi:10.1134/s1028334x09080273
Velichko, A. A., Faustova, M. A., Pisareva, V. V., Gribchenko, Y. N., Sudakova, N. G., and Lavrentiev, N. V. (2011). “Glaciations of the East European Plain,” in Glaciations of the East European Plain: Distribution and Chronology, Developments in Quaternary Sciences (Amsterdam: Elsevier), 337–359. doi:10.1016/b978-0-444-53447-7.00026-x
Velichko, A. A. (1990). Loess-paleosol Formation on the Russian plain. Quat. Int. 7-8, 103–114. doi:10.1016/1040-6182(90)90044-5
Velichko, A. A., Morozova, T. D., Nechaev, V. P., Rutter, N. W., Dlusskii, K. G., Little, E. C., et al. (2006). Loess/paleosol/cryogenic Formation and Structure Near the Northern Limit of Loess Deposition, East European Plain, Russia. Quat. Int. 152-153, 14–30. doi:10.1016/j.quaint.2005.12.003
Velichko, A., Morozova, T. D., Borisova, O. K., Timireva, S. N., Semenov, V. V., Kononov, Y. M., et al. (2012). Development of the Steppe Zone in Southern Russia Based on the Reconstruction from the Loess-Soil Formation in the Don-Azov Region. Dokl. Earth Sc. 445, 999–1002. doi:10.1134/s1028334x12080107
Veres, D., Tecsa, V., Gerasimenko, N., Zeeden, C., Hambach, U., and Timar-Gabor, A. (2018). Short-term Soil Formation Events in Last Glacial East European Loess, Evidence from Multi-Method Luminescence Dating. Quat. Sci. Rev. 200, 34–51. doi:10.1016/j.quascirev.2018.09.037
Villagran, X. S., Schaefer, C. E. G. R., and Ligouis, B. (2013). Living in the Cold: Geoarchaeology of Sealing Sites from Byers Peninsula (Livingston Island, Antarctica). Quat. Int. 315, 184–199. doi:10.1016/j.quaint.2013.07.001
Wang, H., Hackley, K. C., Panno, S. V., Coleman, D. D., Liu, J. C.-l., and Brown, J. (2003). Pyrolysis-combustion 14C Dating of Soil Organic Matter. Quat. Res. 60, 348–355. doi:10.1016/j.yqres.2003.07.004
Wegwerth, A., Ganopolski, A., Ménot, G., Kaiser, J., Dellwig, O., Bard, E., et al. (2015). Black Sea Temperature Response to Glacial Millennial‐scale Climate Variability. Geophys. Res. Lett. 42, 8147–8154. doi:10.1002/2015gl065499
Wulf, S., Fedorowicz, S., Veres, D., Łanczont, M., Karátson, D., Gertisser, R., et al. (2016). The 'Roxolany Tephra' (Ukraine) − New Evidence for an Origin from Ciomadul Volcano, East Carpathians. J. Quat. Sci. 31, 565–576. doi:10.1002/jqs.2879
Yanina, Т. А., Svitoch, А. А., Kurbanov, R. N., Murray, А. S., Tkach, N. T., and Sychev, N. V. (2017). Opyt Datirovaniya Pleystotsenovykh Otlozheniy Nizhnego Povolzh’ya Metodom Opticheski Stimulirovannoy Lyuminestsentsii (Paleogeographic Analysis of the Results of Optically Stimulated Luminescence Dating of Pleistocene Deposits of the Lower Volga Area). Vestnik MSU, Seriya 5 Geografiya 1, 21–29.
Zastrozhnov, A., Danukalova, G., Golovachev, M., Titov, V., Osipova, E., Simakova, A., et al. (2020). Biostratigraphical Investigations as a Tool for Palaeoenvironmental Reconstruction of the Neopleistocene (Middle-Upper Pleistocene) at Kosika, Lower Volga, Russia. Quat. Int. 540, 38–67. doi:10.1016/j.quaint.2018.11.036
Zastrozhnov, A., Danukalova, G., Shick, S., and van Kolfshoten, T. (2018). State of Stratigraphic Knowledge of Quaternary Deposits in European Russia: Unresolved Issues and Challenges for Further Research. Quat. Int. 478, 4–26. doi:10.1016/j.quaint.2017.03.037
Zeeden, C., Hambach, U., Obreht, I., Hao, Q., Abels, H. A., Veres, D., et al. (2018). Patterns and Timing of Loess-Paleosol Transitions in Eurasia: Constraints for Paleoclimate Studies. Glob. Planet. Change 162, 1–7. doi:10.1016/j.gloplacha.2017.12.021
Zeeden, C., Kels, H., Hambach, U., Schulte, P., Protze, J., Eckmeier, E., et al. (2016). Three Climatic Cycles Recorded in a Loess-Palaeosol Sequence at Semlac (Romania) - Implications for Dust Accumulation in South-Eastern Europe. Quat. Sci. Rev. 154, 130–142. doi:10.1016/j.quascirev.2016.11.002
Zhou, L. P., Oldfield, F., Wintle, A. G., Robinson, S. G., and Wang, J. T. (1990). Partly Pedogenic Origin of Magnetic Variations in Chinese Loess. Nature 346, 737–739. doi:10.1038/346737a0
Keywords: quaternary stratigraphy, paleoenvironmental reconstruction, loess–paleosol sequences, Late Pleistocene, Azov Sea
Citation: Chen J, Stevens T, Yang T, Qiang M, Matishov G, Konstantinov E, Kurbanov R, Zeng B and Shi P (2022) Revisiting Late Pleistocene Loess–Paleosol Sequences in the Azov Sea Region of Russia: Chronostratigraphy and Paleoenvironmental Record. Front. Earth Sci. 9:808157. doi: 10.3389/feart.2021.808157
Received: 03 November 2021; Accepted: 15 December 2021;
Published: 03 February 2022.
Edited by:
Kathryn Elizabeth Fitzsimmons, University of Tübingen, GermanyReviewed by:
Diana Jordanova, National Institute of Geophysics, Geodesy and Geography (BAS), BulgariaUlrich Friedrich Hambach, University of Bayreuth, Germany
Copyright © 2022 Chen, Stevens, Yang, Qiang, Matishov, Konstantinov, Kurbanov, Zeng and Shi. This is an open-access article distributed under the terms of the Creative Commons Attribution License (CC BY). The use, distribution or reproduction in other forums is permitted, provided the original author(s) and the copyright owner(s) are credited and that the original publication in this journal is cited, in accordance with accepted academic practice. No use, distribution or reproduction is permitted which does not comply with these terms.
*Correspondence: Taibao Yang, eWFuZ3RiQGx6dS5lZHUuY24=